Attached files
| file | filename |
|---|---|
| EX-3.02 - EXHIBIT 3.02 - BRADY CORP | d302750dex302.htm |
| EX-99.1 - EXHIBIT 99.1 - BRADY CORP | d302750dex991.htm |
| 8-K - FORM 8-K - BRADY CORP | d302750d8k.htm |
Exhibit 99.2
| F'12 - Q2 Financial Results February 16, 2012 February 16, 2012 Brady - Fiscal 2012 q2 Financial Results |

| FORWARD-LOOKING STATEMENTS BRADY - FISCAL 2012 Q2 FINANCIAL RESULTS 2 Brady believes that certain statements in this presentation are "forward-looking statements" within the meaning of the Private Securities Litigation Reform Act of 1995. All statements related to future, not past, events included in this presentation, including, without limitation, statements regarding Brady's future financial position, business strategy, targets, projected sales, costs, earnings, capital expenditures, debt levels and cash flows, and plans and objectives of management for future operations are forward-looking statements. When used in this presentation, words such as "may," "will," "expect," "intend," "estimate," "anticipate," "believe," "should," "project" or "plan" or similar terminology are generally intended to identify forward-looking statements. These forward-looking statements by their nature address matters that are, to different degrees, uncertain and are subject to risks, assumptions and other factors, some of which are beyond Brady's control, that could cause actual results to differ materially from those expressed or implied by such forward-looking statements. For Brady, uncertainties arise from the length or severity of the current worldwide economic downturn or timing or strength of a subsequent recovery; future financial performance of major markets Brady serves, which include, without limitation, telecommunications, manufacturing, electrical, construction, laboratory, education, governmental, public utility, computer, transportation; difficulties in making and integrating acquisitions; risks associated with newly acquired businesses; Brady's ability to develop and successfully market new products; changes in the supply of, or price for, parts and components; increased price pressure from suppliers and customers; fluctuations in currency rates versus the US dollar; unforeseen tax consequences; potential write-offs of Brady's substantial intangible assets; Brady's ability to retain significant contracts and customers; risks associated with international operations; Brady's ability to maintain compliance with its debt covenants; technology changes; business interruptions due to implementing business systems; environmental, health and safety compliance costs and liabilities; future competition; interruptions to sources of supply; Brady's ability to realize cost savings from operating initiatives; difficulties associated with exports; risks associated with restructuring plans; risks associated with obtaining governmental approvals and maintaining regulatory compliance; and numerous other matters of national, regional and global scale, including those of a political, economic, business, competitive and regulatory nature contained from time to time in Brady's U.S. Securities and Exchange Commission filings, including, but not limited to, those factors listed in the "Risk Factors" section located in Item 1A of Part I of Brady's Form 10-K for the year ended July 31, 2011. These uncertainties may cause Brady's actual future results to be materially different than those expressed in its forward-looking statements. Brady does not undertake to update its forward-looking statements except as required by law. We refer to certain non-GAAP financial measures in this presentation. Reconciliations of these non-GAAP financial measures to the most directly comparable GAAP financial measures can be found within this presentation. |

| Q2 F'12 ONE-TIME ITEMS During the 2nd quarter, a non-cash goodwill impairment charge was taken in the Asia- Pacific segment. This diluted EPS impact of the non-cash impairment charge, and other items are as follows: BRADY - FISCAL 2012 Q2 FINANCIAL RESULTS Q2 F'12: 3 Q2 F'12 Q2 F'12 Comparability Items: Non-Cash Goodwill Impairment Charge $ (2.21) Impact of the Thailand Flood in Q2 (0.04) Reduced Variable Compensation 0.06 Total $ (2.19) |

| Q2 F'12 FINANCIAL SUMMARY Sales down 2.6% to $320.6M vs. $329.0M in Q2 of F'11. Organic Sales decline of 1.8%. Gross Profit Margin of 47.8% vs. 48.3% in Q2 of F'11. Decline due to the Asia-Pacific region. SG&A Expense down 10 bps to 32.7% of sales vs. 32.8% in Q2 of F'11. Reported net income (loss) of $(90.0 million) in Q2 of F'12. Net Income, excluding impairment and restructuring charges flat at $25.7M in both Q2 of F'12 and Q2 of F'11. Reported diluted EPS of $(1.72) in Q2 of F'12. Diluted EPS, excluding impairment and restructuring charges up 2.1% to $0.49 vs. $0.48 in Q2 of F'11. January 31, 2012 cash balance of $380M. BRADY - FISCAL 2012 Q2 FINANCIAL RESULTS 4 |

| F'12 GUIDANCE BRADY - FISCAL 2012 Q2 FINANCIAL RESULTS 5 Diluted EPS $2.20 - $2.40 (Excluding after-tax impairment and restructuring charges) Guidance Assumptions: Full-year income tax rate in the mid-20% range.* Guidance based on current foreign currency exchange rates. Full-year capital expenditures of approximately $25 million. Full-year depreciation and amortization expense of approximately $40 - $45 million. Free cash flow equal to 100% - 120% of net income.* In accordance with our normal practice, our guidance does not assume any acquisitions or dispositions. Brady Corporation's practice is to only change or reconfirm guidance in a public forum. * Excludes $115.7M of non-cash impairment charges in Q2 of F'12. |
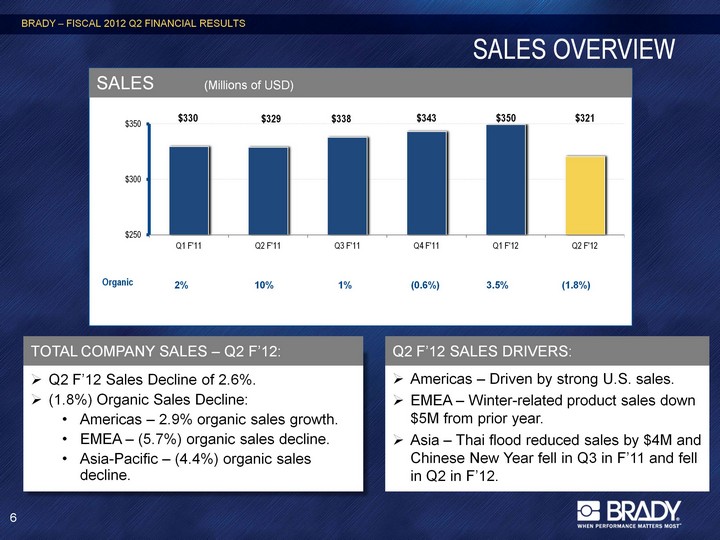
| SALES OVERVIEW (CHART) Organic 2% 10% 1% (0.6%) 3.5% (1.8%) BRADY - FISCAL 2012 Q2 FINANCIAL RESULTS 6 Q2 F'12 Sales Decline of 2.6%. (1.8%) Organic Sales Decline: Americas - 2.9% organic sales growth. EMEA - (5.7%) organic sales decline. Asia-Pacific - (4.4%) organic sales decline. Americas - Driven by strong U.S. sales. EMEA - Winter-related product sales down $5M from prior year. Asia - Thai flood reduced sales by $4M and Chinese New Year fell in Q3 in F'11 and fell in Q2 in F'12. TOTAL COMPANY SALES - Q2 F'12: Q2 F'12 SALES DRIVERS: SALES (Millions of USD) |

| GROSS PROFIT MARGIN AND SG&A (CHART) BRADY - FISCAL 2012 Q2 FINANCIAL RESULTS 7 (CHART) GROSS PROFIT & GPM% (Millions of USD) SG&A & SG&A as % of SALES (Millions of USD) GPM down 50 bps to 47.8% in Q2 of F'12 versus 48.3% in Q2 of F'11. Asia GPM weakness driving down the total company GPM. GROSS PROFIT MARGIN DRIVERS: Excluding reductions in variable compensation, SG&A expense would have been approx. $109.3 million in Q2 of F'12 (34.1% of sales). SG&A is a continued area of focus. SG&A EXPENSE DRIVERS: |

| NET INCOME AND DILUTED EPS Q2 GAAP net loss of $90M due to non-cash impairment. Q2 F'12 net income, excluding impairment and restructuring charges, was flat at $25.7M. Q2 F'12 diluted EPS, excluding impairment and restructuring charges was up 2.1% to $0.49. Strong comparables in Q2 of F'11: Strong winter-product sales in Europe. Gain on the sale of the Teklynx business. Q2 F'12 significant items: Thailand Flood Impact - $(0.04/share). Reduced Variable Compensation + $0.06/share. (CHART) (CHART) BRADY - FISCAL 2012 Q2 FINANCIAL RESULTS 8 NET INCOME* (Millions of USD) DILUTED EPS (Class A Shares)* Q2 F'12 NET INCOME* & DILUTED EPS*: NET INCOME & DILUTED EPS DRIVERS: * Excludes $115.7M of non-cash impairment charges in Q2 of F'12. |

| CASH GENERATION BRADY - FISCAL 2012 Q2 FINANCIAL RESULTS 9 Cash Flow from Operating Activities = 109% of net income*. Cash position remains strong at $380 million. CASH BALANCE WALK (Millions of USD) CASH GENERATION - F'12 Q2: * Excludes $115.7M of non-cash impairment charges in Q2 of F'12. |

| DECREASING DEBT & INCREASING EBITDA (CHART) BRADY - FISCAL 2012 Q2 FINANCIAL RESULTS NET DEBT / EBITDA* January 31, 2012 Debt = $384M January 31, 2012 Cash = $380M STRONG BALANCE SHEET: 10 (CHART) DEBT & TTM EBITDA* (Millions of USD) * Excludes $115.7M of non-cash impairment charges in Q2 of F'12. |

| Q2 F'12 - NEW PRODUCT LAUNCHES Continuous Tubing Printer: BMP-91TM Printing System - The BMP(r)91 is a tubing, wiremarking, label and heatshrink printer for the Asia-Pacific electrical market with best in class features for ease of use and productivity. Durable Full Color Media: ToughJetTM Durable Inkjet Media - New ToughJet(tm) Adhesive Sheets combine the high-quality color and photo capabilities of inkjet printing with the durability of Brady's industrial grade label materials (B-141 & B-146). Durable Media for Lab and Healthcare: B-7425 Specimen Identification Labels- From liquid nitrogen to autoclave, B-7425 labels remain adhered to specimen containers through the toughest laboratory environments. B-7425 laboratory labels are made to perform across a wide temperature range while withstanding exposure to common laboratory solvents. BRADY - FISCAL 2012 Q2 FINANCIAL RESULTS 11 |

| AMERICAS - Q2 F'12 SUMMARY (CHART) Q2 F'11 Q2 F'12 Change Sales $ 136.0 $ 138.4 + 1.8% Segment Profit 31.0 35.8 + 15.4% Segment Profit % 22.8% 25.9% + 3.1 pts BRADY - FISCAL 2012 Q2 FINANCIAL RESULTS 12 SALES & SEGMENT PROFIT % (Millions of USD) Q2 F'12 vs. Q2 F'11 PERFORMANCE Revenues up 1.8%: Organic Growth = 2.9% Fx = (0.7%) Acquisitions/Divestitures = (0.4%) Strong results in Brady's U.S. business, and nice improvements in Brazil. Direct Marketing Customer Contact Centers awarded top honors by the Service Quality Measurement (SQM) Group. New products and sales initiatives driving consistent customer demand and growth in most businesses. Segment profit up 15.4%. Price increases and operations cost savings offsetting inflation. Q2 F'12 SUMMARY: Continued low single-digit organic growth. Economy expected to continue to grow at a modest pace. OUTLOOK: |

| EMEA - Q2 F'12 SUMMARY (CHART) Q2 F'11 Q2 F'12 Change Sales $104.0 $ 95.6 - 8.1% Segment Profit 29.2 26.6 - 8.9% Segment Profit % 28.0% 27.8% - 0.2 pts BRADY - FISCAL 2012 Q2 FINANCIAL RESULTS 13 SALES & SEGMENT PROFIT % (Millions of USD) Q2 F'12 vs. Q2 F'11 PERFORMANCE Revenues down 8.1%: Organic Revenue Decline = (5.7)% Fx = (1.5%) Acquisitions/Divestitures = (0.9%) Segment profit down 8.9%. Mild winter throughout Europe compared to tough winter in Q2 of F'11. Winter-product sales down $5 million in the quarter. Continued double-digit internet sales growth. Q2 F'12 SUMMARY: Approximately flat organic sales for the remainder of F'12. Internal growth initiatives offsetting the negative impacts from the challenging macro-economic climate. OUTLOOK: |

| ASIA-PACIFIC - Q2 F'12 SUMMARY (CHART) Q2 F'11 Q2 F'12 Change Sales $ 89.0 $ 86.6 - 2.7% Segment Profit 11.5 7.7 - 32.9% Segment Profit % 13.0% 8.9% - 4.1 pts Revenues down 2.7%: Organic Sales Decline = (4.4%) Fx = 1.7% Segment profit down $3.8 million. Q2 F'12 results influenced by Thailand flood and timing of Chinese New Year. Price competition in the mobile handset industry causing margin compression. BRADY - FISCAL 2012 Q2 FINANCIAL RESULTS 14 SALES & SEGMENT PROFIT % (Millions of USD) Q2 F'12 vs. Q2 F'11 PERFORMANCE Q2 F'12 SUMMARY: Low single-digit organic growth in the second half of fiscal 2012. Regional economies generally stable, but competition in the die-cut business is increasing. OUTLOOK: |

| INVESTOR RELATIONS Brady Contact: Aaron Pearce Investor Relations 414-438-6895 Aaron_Pearce@Bradycorp.com See our web site at www.investor.bradycorp.com BRADY - FISCAL 2012 Q2 FINANCIAL RESULTS 15 |

| INCOME STATEMENTS BRADY - FISCAL 2012 Q2 FINANCIAL RESULTS 16 COMPARABLE INCOME STATEMENT (Millions of USD) |

| EBITDA RECONCILIATION BRADY - FISCAL 2012 Q2 FINANCIAL RESULTS 17 EBITDA* (Millions of USD) |