Attached files
| file | filename |
|---|---|
| 8-K - NORANDA ALUMINUM HOLDING CORPORATION 8-K - Noranda Aluminum Holding CORP | a50168986.htm |
| EX-99.1 - EXHIBIT 99.1 - Noranda Aluminum Holding CORP | a50168986ex99_1.htm |
| EX-99.3 - EXHIBIT 99.3 - Noranda Aluminum Holding CORP | a50168986ex99_3.htm |
Exhibit
99.2
Noranda Aluminum Holding
Corp February 15, 2012 10:00 AM Eastern / 9:00 AM Central
The presentation and
comments made by Noranda’s management on the quarterly conference call
contain “forward-looking statements” within the meaning of the Private
Securities Litigation Reform Act of 1995. Forward-looking statements are
statements about future, not past, events and involve certain important
risks and uncertainties, any of which could cause the Company’s actual
results to differ materially from those expressed in forward-looking
statements, including, without limitation: the cyclical nature of the
aluminum industry and fluctuating commodity prices, which cause
variability in earnings and cash flows; a downturn in general economic
conditions, including changes in interest rates, as well as a downturn
in the end-use markets for certain of the Company’s products;
fluctuations in the relative cost of certain raw materials and energy
compared to the price of primary aluminum and aluminum rolled products;
the effects of competition in Noranda’s business lines; Noranda’s
ability to retain customers, a substantial number of which do not have
long-term contractual arrangements with the Company; the ability to
fulfill the business’s substantial capital investment needs; labor
relations (i.e. disruptions, strikes or work stoppages) and labor costs;
unexpected issues arising in connection with Noranda’s operations
outside of the United States; the ability to retain key management
personnel; and Noranda’s expectations with respect to its acquisition
activity, or difficulties encountered in connection with acquisitions,
dispositions or similar transactions. Forward-looking statements contain
words such as “believes,” “expects,” “may,” “should,” “seeks,”
“approximately,” “intends,” “plans,” “estimates,” or “anticipates” or
similar expressions that relate to Noranda’s strategy, plans or
intentions. All statements Noranda makes relating to its estimated and
projected earnings, margins, costs, expenditures, cash flows, growth
rates and financial results or to the Company’s expectations regarding
future industry trends are forward-looking statements. Noranda
undertakes no obligation to publicly update or revise any
forward-looking statement as a result of new information, future events
or otherwise, except as otherwise required by law. Readers are cautioned
not to place undue reliance on forward-looking statements, which speak
only as of the date on which they are made and which reflect
management's current estimates, projections, expectations or beliefs.
For a discussion of additional risks and uncertainties that may affect
the future results of Noranda, please see the Company’s filings with
theSecurities and Exchange Commission, including its Annual Report on
Form 10-K.
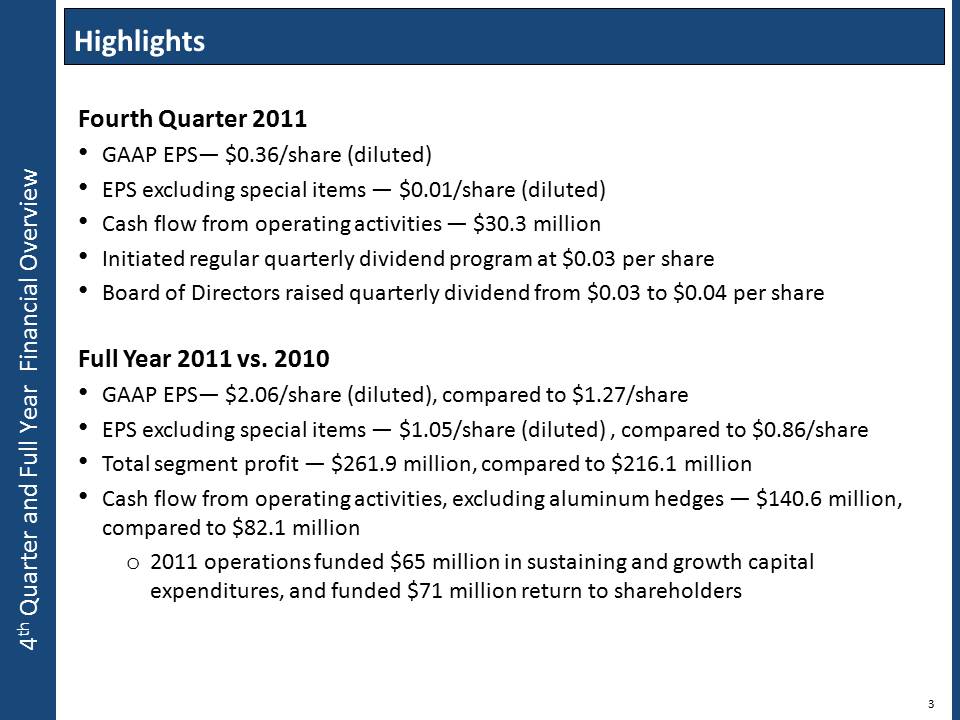
4th Quarter and Full Fourth
Quarter 2011 •GAAP EPS— $0.36/share (diluted) •EPS excluding special
items — $0.01/share (diluted) •Cash flow from operating activities —
$30.3 million •Initiated regular quarterly dividend program at $0.03 per
share •Board of Directors raised quarterly dividend from $0.03 to $0.04
per share Full Year 2011 vs. 2010 •GAAP EPS— $2.06/share (diluted),
compared to $1.27/share •EPS excluding special items — $1.05/share
(diluted) , compared to $0.86/share •Total segment profit — $261.9
million, compared to $216.1 million •Cash flow from operating
activities, excluding aluminum hedges — $140.6 million, compared to
$82.1 million o2011 operations funded $65 million in sustaining and
growth capital expenditures, and funded $71 million return to
shareholders
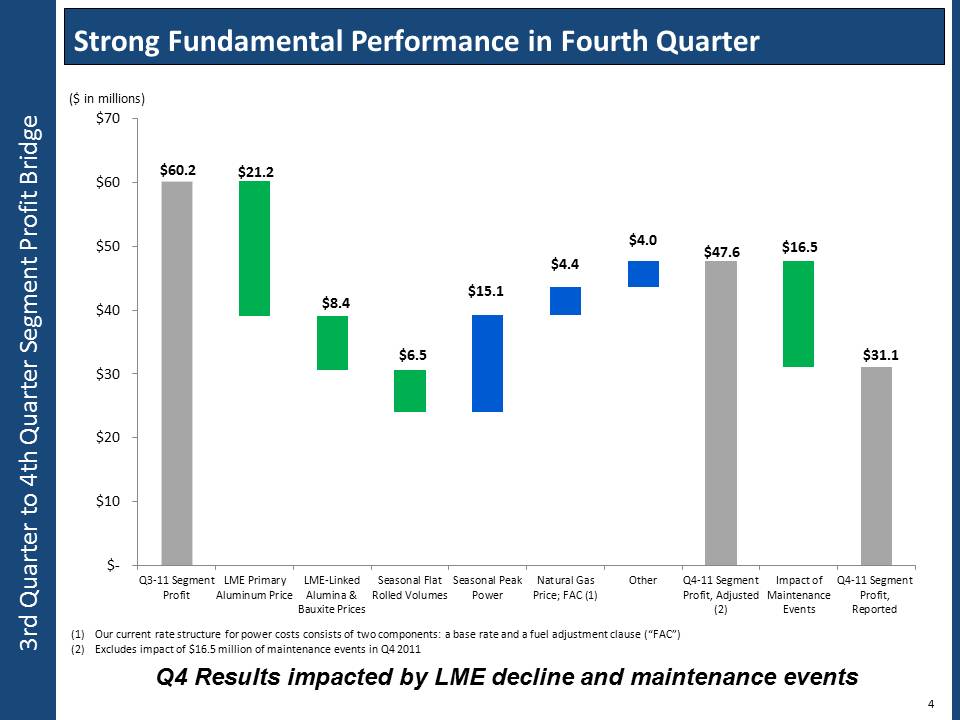
4 $47.6 $31.1 $21.2 $8.4 $6.5 $16.5 $15.1 $4.4 $4.0 $60.2 $- $10 $20 $30 $40 $50 $60 $70Q3-11 SegmentProfitLME PrimaryAluminum PriceLME-LinkedAlumina &Bauxite PricesSeasonal FlatRolled VolumesSeasonal PeakPowerNatural GasPrice; FAC (1) OtherQ4-11 SegmentProfit, Adjusted(2) Impact ofMaintenance EventsQ4-11 SegmentProfit,Reported($ in millions) (1)Our current rate structure for power costs consists of two components: a base rate and a fuel adjustment clause (“FAC”) (2)Excludes impact of $16.5 million of maintenance events in Q4 2011 Q4 Results impacted by LME decline and maintenance events
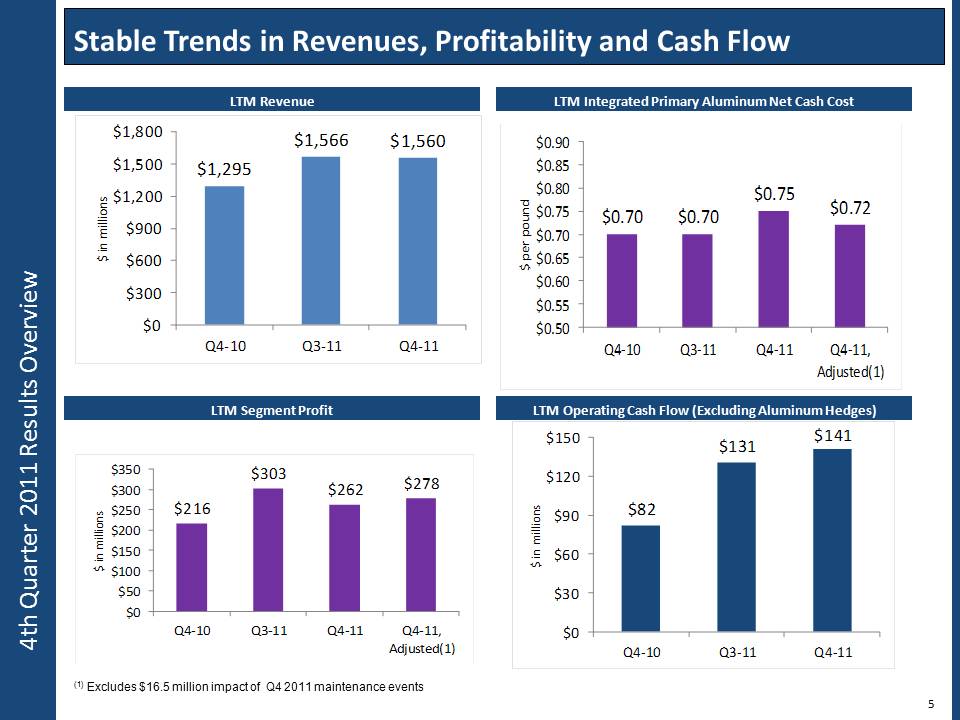
5 (1) Excludes $16.5 million impact of Q4 2011 maintenance events
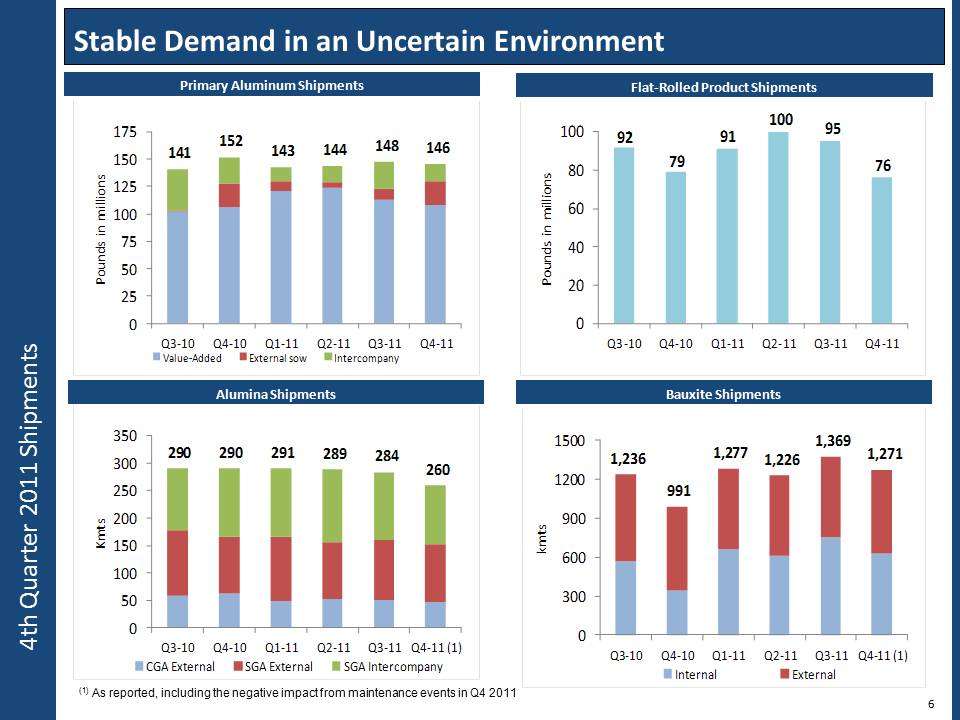
Aluminum 6 (1) As reported, including the negative impact from maintenance events in Q4 2011
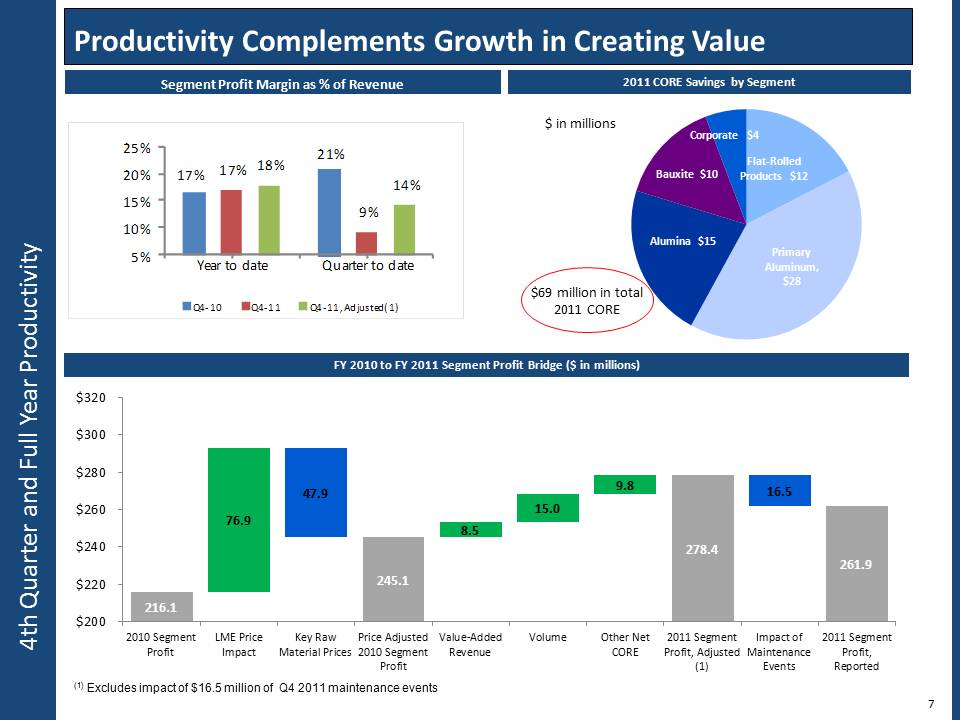
$3202010 SegmentProfitLME PriceImpactKey RawMaterial PricesPrice Adjusted2010 SegmentProfitValue Added Revenue Volume Other NetCORE2011 SegmentProfit, AdjustedImpact of MaintenanceEvents2011 SegmentProfit,Reported (1) Excludes impact of $16.5 million of Q4 2011 maintenance events
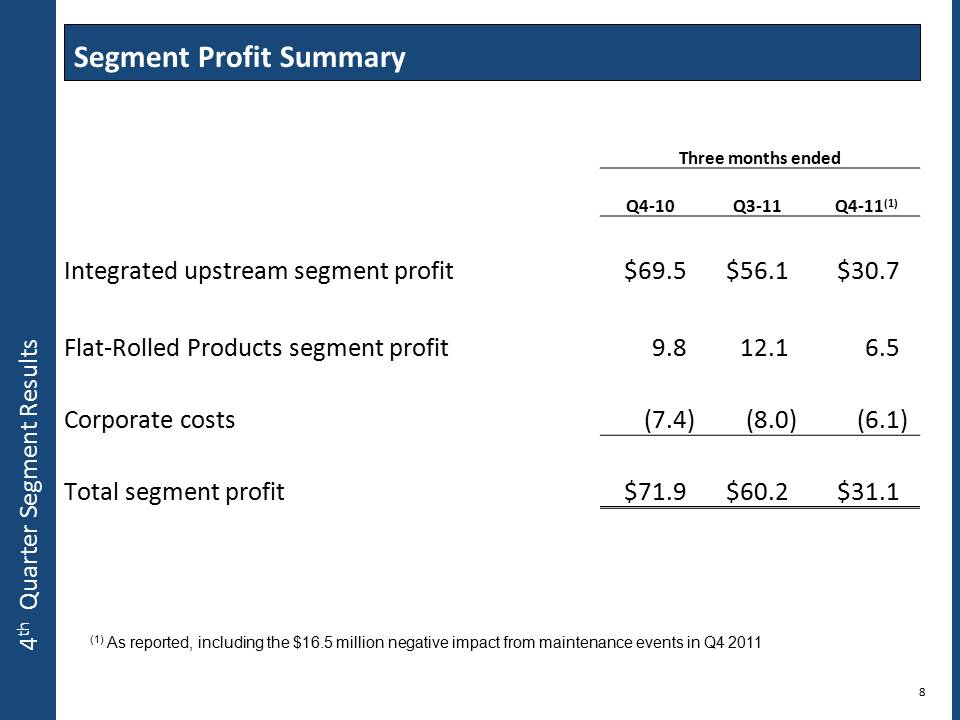
4th Quarter Segment 8 Three months ended Q4-10 Q3-11 Q4-11(1)Segment Profit Summary Integrated upstream segment profit$69.5$56.1$30.7 Flat-Rolled Products segment profit9.812.16.5 Corporate costs(7.4) (8.0) (6.1) Total segment profit$71.9$60.2$31.1(1) As reported, including the $16.5 million negative impact from maintenance events in Q4 2011
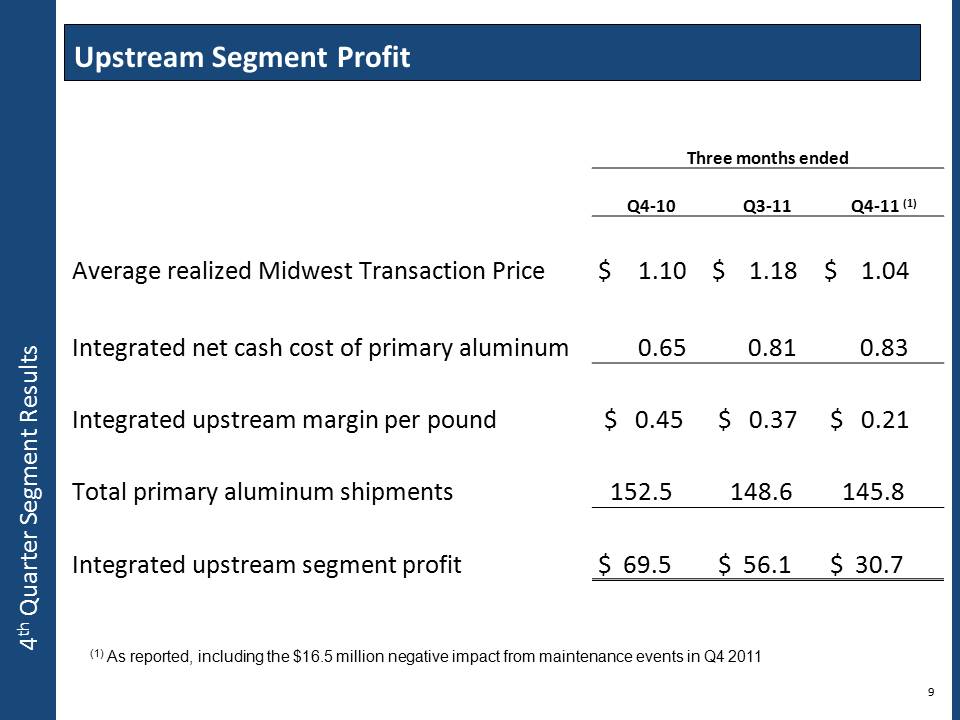
9 Three months ended Q3-11 Q4-11 (1) Q4-10 Average realized Midwest Transaction Price Segment Profit 1.10$ 1.18$ 1.04 Integrated net cash cost of primary aluminum0.650.810.83 Integrated upstream margin per pound$ 0.45$ 0.37$ 0.21 Total primary aluminum shipments152.5148.6145.8 Integrated upstream segment profit$ 69.5$ 56.1$ 30.7 Segment Results (1) As reported, including the $16.5 million negative impact from maintenance events in Q4 2011
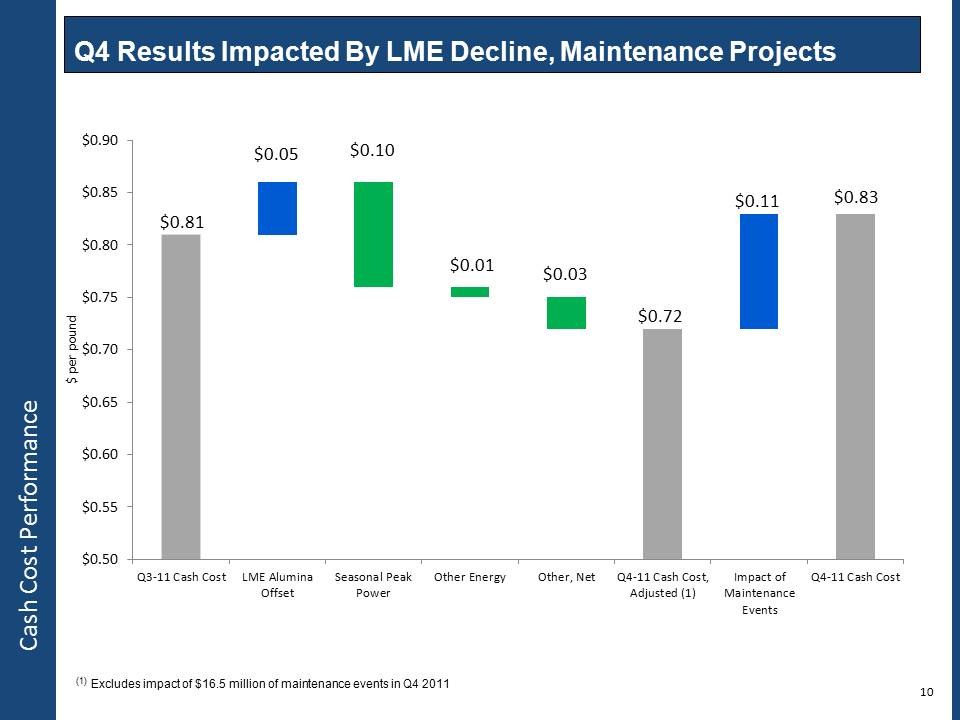
10 Q4 Results Impacted By LME Decline, Maintenance Projects $0.72 $0.83 $0.10 $0.01 $0.03 $0.05 $0.11 $0.81 $0.50$0.55$0.60$0.65$0.70$0.75$0.80$0.85$0.90Q3-11 Cash CostLME AluminaOffsetSeasonal PeakPowerOther EnergyOther, NetQ4-11 Cash Cost,Adjusted (1) Impact ofMaintenanceEventsQ4-11 Cash Cost$ per pound (1) Excludes impact of $16.5 million of maintenance events in Q4 2011
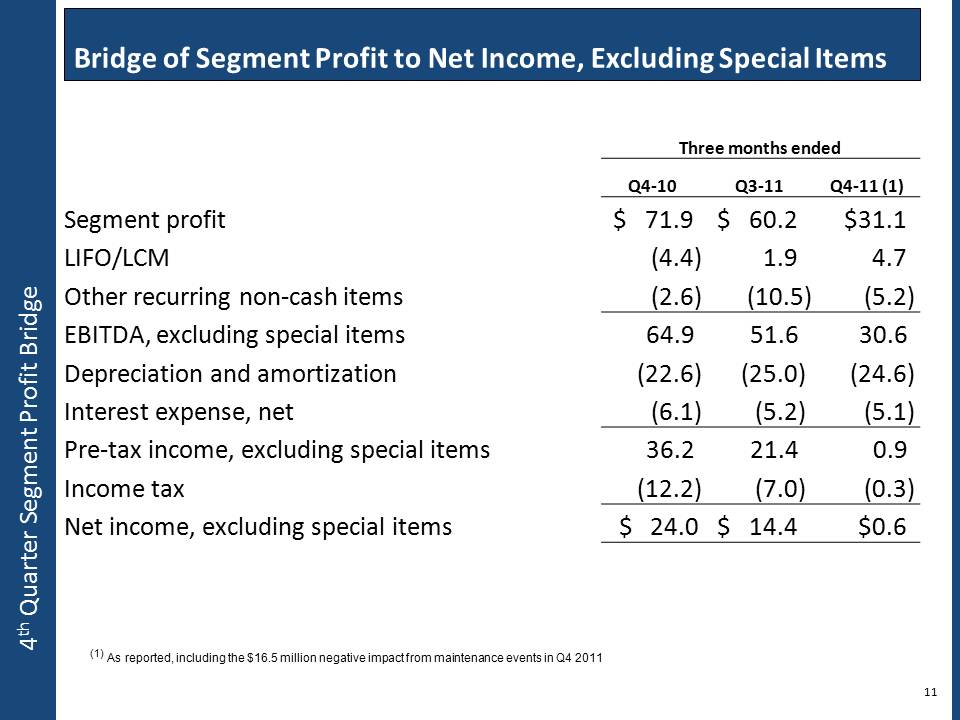
4th Quarter Segment Profit Bridge 11 Bridge of Segment Profit to Net Income, Excluding Special Three months ended Q4-10 Q3-11 Q4-11 (1) 4.7Segment profit$ 71.9$ 60.2$31.1 LIFO/LCM(4.4) 1.9 Other recurring non-cash items(2.6) (10.5) (5.2)EBITDA, excluding special items64.951.630.6 Depreciation and amortization(22.6) (25.0) (24.6) Interest expense, net(6.1) (5.2) (5.1) Pre-tax income, excluding special items36.221.40.9 Income tax(12.2(7.0) (0.3) Net income, excluding special items$ 24.0$ 14.4$0.6 (1) As reported, including the $16.5 million negative impact from maintenance events in Q4 2011
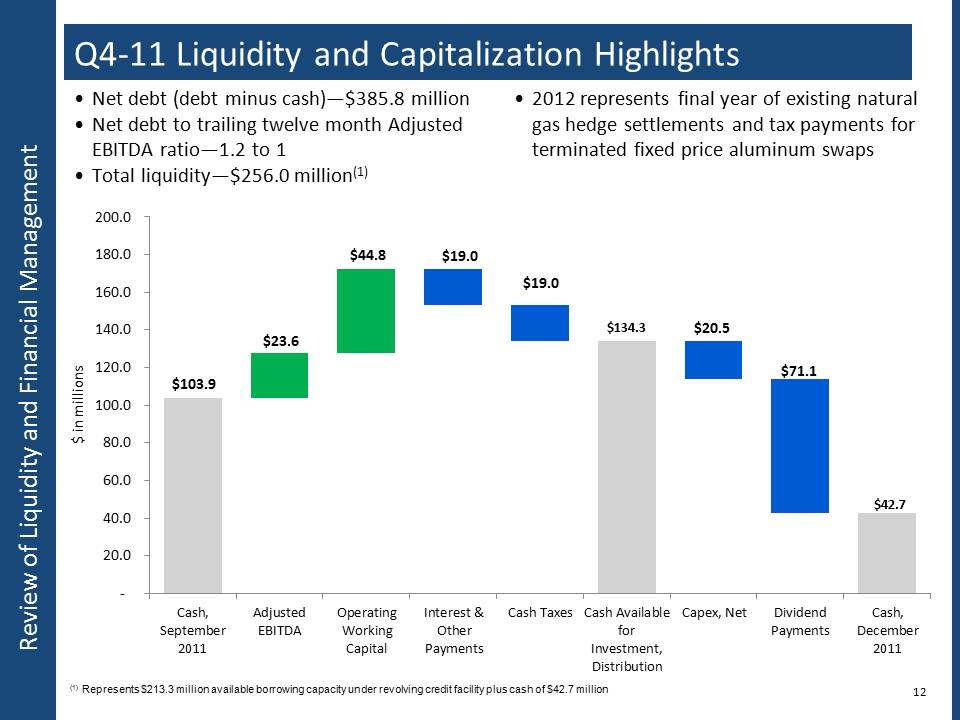
$134.3 $42.7 $19.0 $19.0 $20.5 $71.1 $23.6 $44.8 $103.9 - 20.0 40.0 60.0 80.0 100.0 120.0 140.0 160.0 180.0 200.0Cash,September2011Adjusted EBITDAOperating WorkingCapital Interest & OtherPaymentsCash TaxesCash AvailableforInvestment,DistributionCapex,NetDividendPaymentsCash,December2011$ in millions Review of Liquidity and Financial Management Q4-11 Liquidity and Capitalization Highlights •Net debt (debt minus cash)—$385.8 million •Net debt to trailing twelve month Adjusted EBITDA ratio—1.2 to 1 •Total liquidity—$256.0 million(1) 12 •2012 represents final year of existing natural gas hedge settlements and tax payments for terminated fixed price aluminum swaps (1) Represents $213.3 million available borrowing capacity under revolving credit facility plus cash of $42.7 million
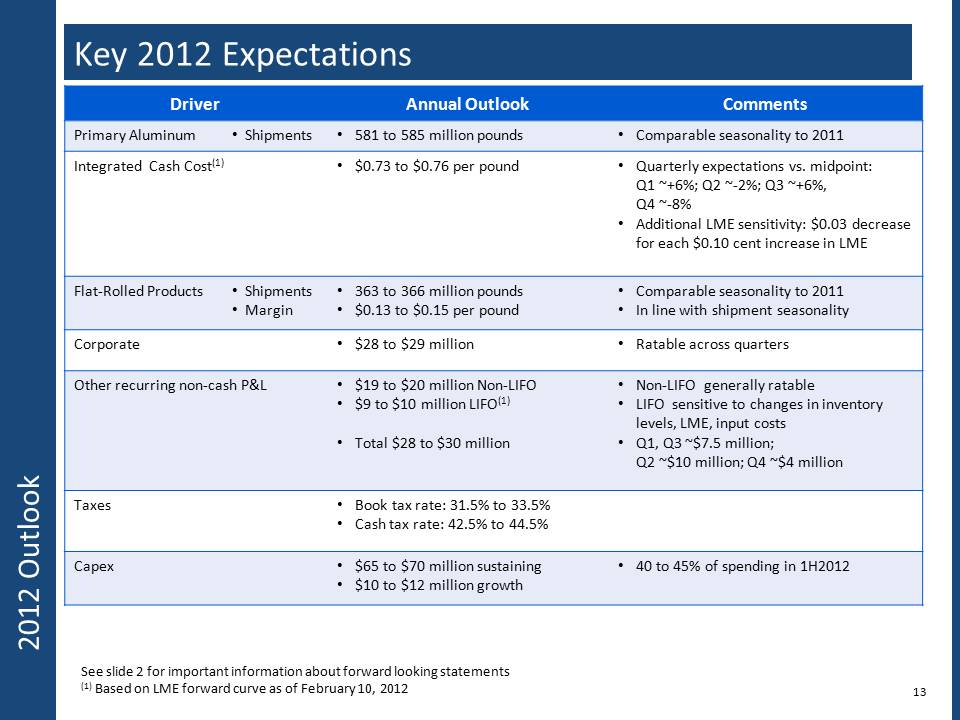
13 Primary Aluminum•Shipments•581 to 585 million pounds •Comparable seasonality to 2011 Integrated Cash Cost(1)•$0.73 to $0.76 per pound •Quarterly expectations vs. midpoint: Q1 ~+6%; Q2 ~-2%; Q3 ~+6%, Q4 ~-8% •Additional LME sensitivity: $0.03 decrease for each $0.10 cent increase in LME Flat-Rolled Products•Shipments •Margin •363 to 366 million pounds •$0.13 to $0.15 per pound •Comparable seasonality to 2011 •In line with shipment seasonality Corporate•$28 to $29 million •Ratable across quarters Other recurring non-cash P&L•$19 to $20 million Non-LIFO •$9 to $10 million LIFO(1) •Total $28 to $30 million •Non-LIFO generally ratable •LIFO sensitive to changes in inventory levels, LME, input costs •Q1, Q3 ~$7.5 million; Q2 ~$10 million; Q4 ~$4 million Taxes•Book tax rate: 31.5% to 33.5% •Cash tax rate: 42.5% to 44.5% Capex•$65 to $70 million sustaining •$10 to $12 million growth •40 to 45% of spending in 1H2012 See slide 2 for important information about forward looking statements (1) Based on LME forward curve as of February 10, 2012
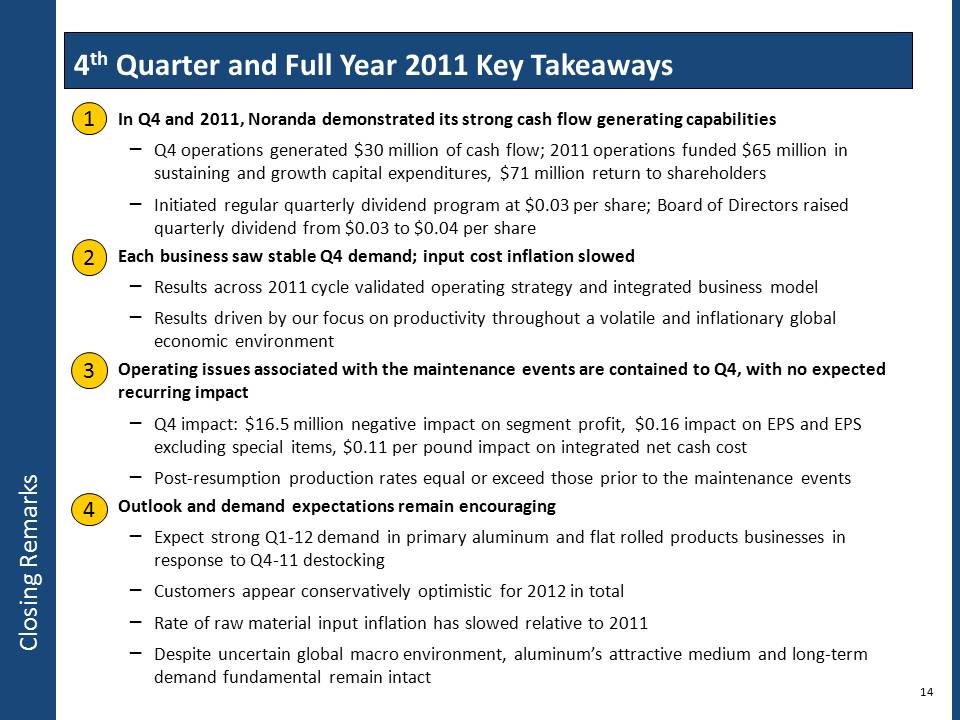
In Q4 and 2011, Noranda demonstrated its strong cash flow generating capabilities –Q4 operations generated $30 million of cash flow; 2011 operations funded $65 million in sustaining and growth capital expenditures, $71 million return to shareholders –Initiated regular quarterly dividend program at $0.03 per share; Board of Directors raised quarterly dividend from $0.03 to $0.04 per share Each business saw stable Q4 demand; input cost inflation slowed –Results across 2011 cycle validated operating strategy and integrated business model –Results driven by our focus on productivity throughout a volatile and inflationary global economic environment •Operating issues associated with the maintenance events are contained to Q4, with no expected recurring impact –Q4 impact: $16.5 million negative impact on segment profit, $0.16 impact on EPS and EPS excluding special items, $0.11 per pound impact on integrated net cash cost –Post-resumption production rates equal or exceed those prior to the maintenance events •Outlook and demand expectations remain encouraging –Expect strong Q1-12 demand in primary aluminum and flat rolled products businesses in response to Q4-11 destocking –Customers appear conservatively optimistic for 2012 in total –Rate of raw material input inflation has slowed relative to 2011 –Despite uncertain global macro environment, aluminum’s attractive medium and long-term demand fundamental remain intact 4th Quarter and Full Year 2011 Key 14 3 12 4

Appendices
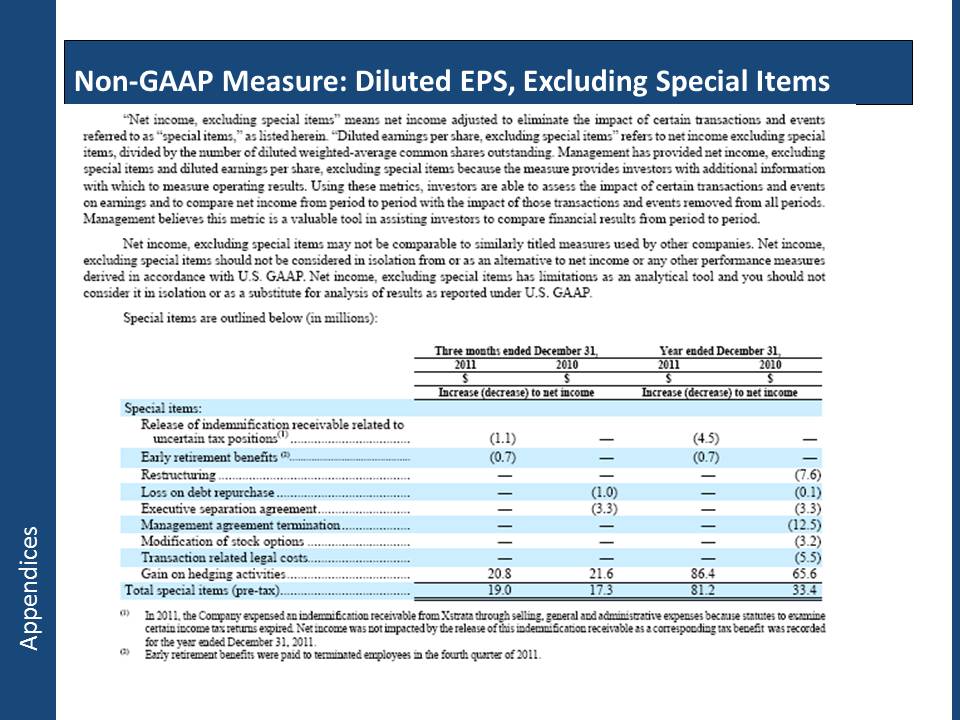
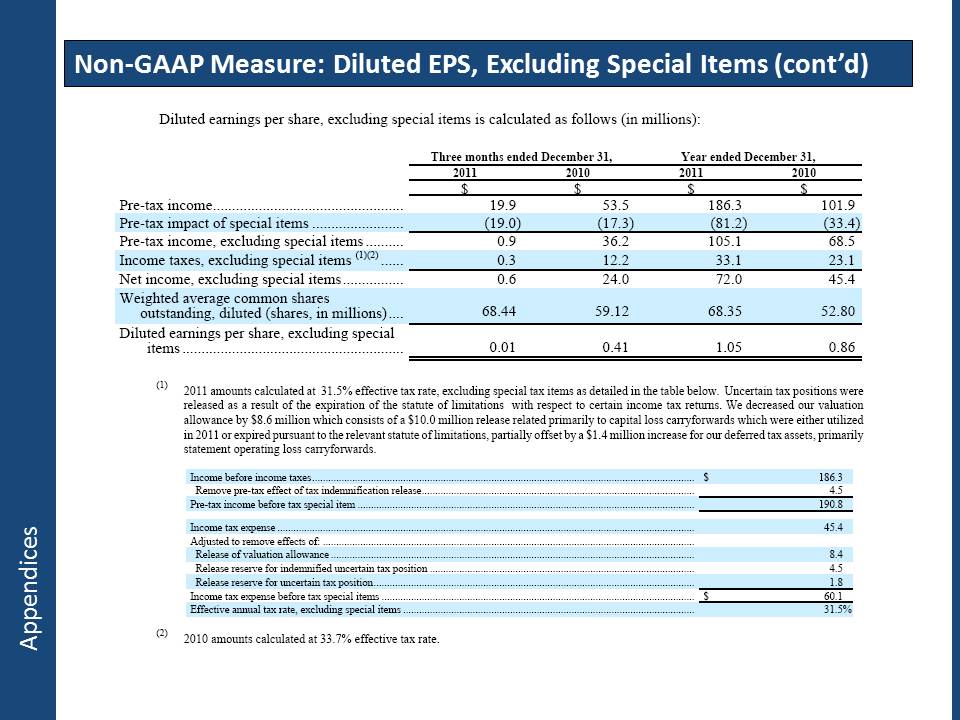
This presentation contains non-GAAP financial measures as defined by SEC rules. We think that these measures are helpful to investors in measuring our financial performance and comparing our performance to our peers. However, our non-GAAP financial measures may not be comparable to similarly titled non-GAAP financial measures used by other companies. These non-GAAP financial measures have limitations as an analytical tool and should not be considered in isolation or as a substitute for U.S. GAAP financial measures. To the extent we discuss any non-GAAP financial measures on the earnings call, a reconciliation of each measure to the most directly comparable U.S. GAAP measure are available in the appendices that follow and are filed as an Exhibit 99 to our Current Report on Form 8-K furnished to the SEC concurrent with the use of this presentationAppendices