Attached files
Table of Contents
UNITED STATES
SECURITIES AND EXCHANGE COMMISSION
WASHINGTON, D.C. 20549
FORM 10-K
| x | Annual Report pursuant to section 13 or 15(d) of the Securities Exchange Act of 1934 |
For the fiscal year ended December 31, 2010
or
| ¨ | Transition report pursuant to section 13 or 15(d) of the Securities Exchange Act of 1934 |
For the transition period from to .
Commission file number: 001-34741
NORANDA ALUMINUM HOLDING
CORPORATION
(Exact name of registrant as specified in its charter)
| Delaware | 20-8908550 | |
| (State or other jurisdiction of incorporation) |
(I.R.S. Employer Identification No.) | |
| 801 Crescent Centre Drive, Suite 600 Franklin, TN 37067 |
37067 | |
| (Address of principal executive offices) | (Zip Code) | |
Registrant’s telephone number, including area code: (615) 771-5700
Securities registered pursuant to Section 12(g) of the Act: None
Securities registered pursuant to Section 12(b) of the Act:
| Title of each class |
Name of each exchange on which registered | |
| Common Stock, $0.01 par value | New York Stock Exchange |
Indicate by check mark if the registrant is a well-known seasoned issuer, as defined in Rule 405 of the Securities Act. Yes ¨ No x
Indicate by check mark if the registrant is not required to file reports pursuant to Section 13 or Section 15(d) of the Act. Yes ¨ No x
Indicate by check mark whether the registrant (1) has filed all reports required to be filed by Section 13 or 15(d) of the Securities Exchange Act of 1934 during the preceding 12 months (or for such shorter period that the registrant was required to file such reports), and (2) has been subject to such filing requirements for the past 90 days. Yes x No ¨
Indicate by check mark whether the registrant has submitted electronically and posted on its corporate Web site, if any, every Interactive Data File required to be submitted and posted pursuant to Rule 405 of Regulation S-T during the preceding 12 months. Yes ¨ No ¨
Indicate by check mark if disclosure of delinquent filers pursuant to Item 405 of Regulation S-K is not contained herein, and will not be contained, to the best of registrant’s knowledge, in definitive proxy or information statements incorporated by reference in Part III of this Form 10-K or any amendment to this Form 10-K. x
Indicate by check mark whether the registrant is a large accelerated filer, an accelerated filer, a non-accelerated filer, or a smaller reporting company. See the definitions of “large accelerated filer,” “accelerated filer” and “smaller reporting company” in Rule 12b-2 of the Exchange Act.
| Large accelerated filer | ¨ | Accelerated filer | ¨ | |||
| Non-accelerated filer | (Do not check if a smaller reporting company) x | Smaller reporting company | ¨ | |||
Indicate by check mark whether the registrant is a shell company (as defined in Rule 12b-2 of the Act). Yes ¨ No x
The aggregate market value of the Common Stock held by non-affiliates of the registrant, based on the closing of the Common Stock on the NYSE on June 30, 2010 the last business day of the registrant’s most recently completed second fiscal quarter, was $73,945,000. For purposes of this response, the registrant has assumed that its directors, executive officers and beneficial owners of 5% or more of its Common Stock are the affiliates of the registrant. Indicate the number of shares outstanding of cash of the registrant’s classes of common stock as of the latest practicable date.
| Class |
Outstanding at February 28, 2011 | |
| Common Stock, $0.01 par value | 66,826,561 |
Documents Incorporated by Reference: None
Table of Contents
NORANDA ALUMINUM HOLDING CORPORATION
2
Table of Contents
GLOSSARY OF SELECTED TERMS
“Noranda,” the “Company,” “we,” “our,” and “us” means collectively (1) Noranda Aluminum, Inc. and its subsidiaries on a consolidated basis prior to the consummation of the Apollo Acquisition and (2) Noranda HoldCo and its subsidiaries on a consolidated basis (including Noranda Aluminum, Inc.) after the completion of the Apollo Acquisition.
“AcquisitionCo Notes” means our senior floating rate notes due 2015 issued by Noranda AcquisitionCo.
“Apollo” means investment funds affiliated with, or co-investment vehicles managed indirectly by, Apollo Management L.P., including Apollo Investment Fund VI, L.P., along with its parallel investment funds.
“Apollo Acquisition” means the May 18, 2007 acquisition by Apollo of the Noranda aluminum business of Xstrata.
“Apollo Transactions” means collectively the Apollo Acquisition and related financings.
“Century” means Century Aluminum Company together with its subsidiaries.
“CORE” means Cost-Out Reliability and Effectiveness, the Company’s productivity program.
“CRU” means CRU International Limited, an independent consulting group focused in part on the mining and metal sectors.
“DMT” means dry metric tonnes.
“Downstream Business” means our flat rolled products reportable segment consisting of four rolling mill facilities.
“Exchange Act” means the Securities Exchange Act of 1934, as amended.
“FIFO” means the first-in, first-out method of valuing inventory.
“GOJ” means the Government of Jamaica.
“Gramercy” means our wholly owned alumina refinery in Gramercy, Louisiana.
“HoldCo Notes” means our senior floating rate notes due 2014 issued by Noranda HoldCo.
“Joint Venture Transaction” means the transaction, consummated on August 31, 2009, whereby Noranda became sole owner of Gramercy and St. Ann.
“KMts” means kilometric tonnes.
“LIFO” means the last-in, first-out method of valuing inventory.
“LME” means the London Metals Exchange.
“Midwest Transaction Price” or “MWTP” is equal to the LME price of primary aluminum plus a Midwest premium.
“NBL” means Noranda Bauxite Limited, a Jamaican private limited company and wholly owned subsidiary of Noranda HoldCo.
“New Madrid” means our aluminum smelter near New Madrid, Missouri.
“NJBP” means Noranda Jamaica Bauxite Partnership, a Jamaican partnership owned 51% by the GOJ and 49% by NBL.
“Noranda 2007 Long-Term Incentive Plan” means the Amended and Restated Noranda Aluminum Holding Corporation 2007 Long-Term Incentive Plan.
“Noranda 2010 Incentive Award Plan” means the Noranda Aluminum Holding Corporation 2010 Incentive Award Plan.
“Noranda AcquisitionCo” means Noranda Aluminum Acquisition Corporation, a Delaware corporation and wholly owned subsidiary of Noranda HoldCo, excluding its subsidiaries.
“Noranda HoldCo” means Noranda Aluminum Holding Corporation, a Delaware corporation, excluding its subsidiaries.
“Notes” means, collectively, the AcquisitionCo Notes and the HoldCo Notes.
“Pre-predecessor” means financial information (including results of operations, cash flows and financial information) as of and for the period from January 1, 2006 to August 15, 2006 for Noranda Aluminum Inc. on a basis reflecting the historical carrying values of Noranda Aluminum, Inc. prior to the Xstrata Acquisition.
“Predecessor” means financial information (including results of operations, cash flows and financial information) for the periods from August 16, 2006 to December 31, 2006 and from January 1, 2007 to May 17, 2007, and as of December 31, 2006 for Noranda Aluminum, Inc. on a basis reflecting the stepped-up values of Noranda Aluminum, Inc. prior to the Apollo Acquisition, but subsequent to the Xstrata Acquisition.
“Securities Act” means the Securities Act of 1933, as amended.
3
Table of Contents
“Special Dividend” means the June 2007 dividend of $216.1 million paid to Noranda stockholders, along with the related financing.
“St. Ann” means our bauxite mining operation in Jamaica.
“Successor” means financial information (including results of operations, cash flows and financial information) for the period from May 18, 2007 to December 31, 2007, as of December 31, 2007, and as of and for the years ended December 31, 2008, 2009 and 2010 for Noranda on a basis reflecting the impact of the purchase allocation of the Apollo Acquisition.
“Term B loan” means that certain term B loan maturing in 2014 with an original principal amount of $500.0 million pursuant to the secured credit facilities Noranda AquisitionCo entered into on May 18, 2007.
“Upstream Business” means, collectively, our three reportable segments: primary aluminum products, alumina refining and bauxite. These segments consist of the New Madrid, Missouri aluminum smelter, the Gramercy, Louisiana alumina refinery and the St. Ann, Jamaica bauxite mine.
“U.S. GAAP” means generally accepted accounting principles in the United States.
“Xstrata” means Xstrata (Schweiz) AG.
“Xstrata Acquisition” means the August 15, 2006 acquisition by which Noranda Aluminum, Inc. became Xstrata’s wholly owned subsidiary.
4
Table of Contents
CAUTIONARY STATEMENT CONCERNING FORWARD-LOOKING STATEMENTS
This report contains “forward-looking statements.” You can identify forward-looking statements because they contain words such as “believes,” “expects,” “may,” “should,” “seeks,” “approximately,” “intends,” “plans,” “estimates,” or “anticipates” or similar expressions that relate to our strategy, plans or intentions. All statements we make relating to our estimated and projected earnings, margins, costs, expenditures, cash flows, growth rates and financial results or to our expectations regarding future industry trends are forward-looking statements. These forward-looking statements are subject to known and unknown risks, uncertainties and other factors which may cause our actual results, performance or achievements to be materially different from any future results, performance or achievements expressed or implied by such forward-looking statements. We derive many of our forward-looking statements from our operating budgets and forecasts, which are based upon many detailed assumptions. While we believe that our assumptions are reasonable, we caution that it is very difficult to predict the impact of known factors, and it is impossible for us to anticipate all factors that could affect our actual results. All forward-looking statements are based upon information available to us on the date of this report.
Important factors that could cause actual results to differ materially from our expectations, which we refer to as cautionary statements, are disclosed under “Risk Factors” and elsewhere in this report, including, without limitation, in conjunction with the forward-looking statements included in this report. All forward-looking information in this report and subsequent written and oral forward-looking statements attributable to us, or to persons acting on our behalf, are expressly qualified in their entirety by the cautionary statements. Some of the factors that we believe could affect our results include:
| • | our indebtedness, and the possibility that we may incur more indebtedness; |
| • | the cyclical nature of the aluminum industry and fluctuating commodity prices, which cause variability in our earnings and cash flows; |
| • | a downturn in general economic conditions, including changes in interest rates, as well as a downturn in the end-use markets for certain of our products; |
| • | losses caused by disruptions in the supply of electrical power; |
| • | fluctuations in the relative cost of certain raw materials and energy compared to the price of primary aluminum and aluminum rolled products; |
| • | the effects of competition in our business lines; |
| • | the relative appeal of aluminum compared with alternative materials; |
| • | our ability to retain customers, a substantial number of which do not have long-term contractual arrangements with us; |
| • | our ability to fulfill our business’s substantial capital investment needs; |
| • | the cost of compliance with and liabilities under environmental, safety, production and product regulations; |
| • | weather, including natural disasters and other unplanned business interruptions; |
| • | labor relations (i.e., disruptions, strikes or work stoppages) and labor costs; |
| • | unexpected issues arising in connection with our operations outside of the United States; |
| • | our ability to retain key management personnel; |
| • | our expectations with respect to our acquisition activity, or difficulties encountered in connection with acquisitions, dispositions or similar transactions; |
| • | the ability of our insurance to cover fully our potential exposures; |
| • | the cost of compliance with future changes to healthcare legislation; and |
| • | the concentration of ownership held by our equity sponsor. |
We caution you that the foregoing list of important factors may not contain all of the material factors that are important to you. In addition, in light of these risks and uncertainties, the matters referred to in the forward-looking statements contained in this report may not in fact occur. Accordingly, investors should not place undue reliance on those statements. We undertake no obligation to publicly update or revise any forward-looking statement as a result of new information, future events or otherwise, except as otherwise required by law.
5
Table of Contents
| ITEM 1. | BUSINESS |
Except as otherwise indicated herein or as the context otherwise requires, references in this report to (a) “Noranda HoldCo” refer only to Noranda Aluminum Holding Corporation, a Delaware corporation, excluding its subsidiaries, (b) “Noranda AcquisitionCo” refer only to Noranda Aluminum Acquisition Corporation, a Delaware corporation and wholly owned subsidiary of Noranda HoldCo, excluding its subsidiaries, and (c) “Noranda,” the “Company,” “we,” “our,” and “us” refer collectively to (1) Noranda Aluminum, Inc. and its subsidiaries on a consolidated basis prior to the Apollo Acquisition, and (2) Noranda HoldCo and its subsidiaries on a consolidated basis after the completion of the Apollo Acquisition, (d) “HoldCo Notes” refer to our senior floating rate notes due 2014 issued by Noranda HoldCo, and (e) “AcquisitionCo Notes” refer to senior floating rate notes due 2015 issued by Noranda AcquisitionCo.
Overview
We are a leading North American integrated producer of value-added primary aluminum products and high quality rolled aluminum coils. We have two businesses: our upstream business and downstream business. Our upstream business consists of three reportable segments: primary aluminum products, alumina refining, and bauxite. These three segments are closely integrated and consist of a smelter near New Madrid, Missouri, which we refer to as “New Madrid,” and our bauxite mining operation and alumina refinery, both of which have sufficient capacity to support New Madrid and supply third party customers. New Madrid has annual production capacity of approximately 580 million pounds (263,000 metric tonnes). Operated at capacity, this represents more than 15% of total 2010 U.S. primary aluminum production, based on statistics from CRU. Our downstream business comprises our flat rolled products segment, which is one of the largest aluminum foil producers in North America and consists of four rolling mill facilities with a combined maximum annual production capacity of 410 to 495 million pounds, depending on production mix.
Our upstream business is one of the largest U.S. producers of primary aluminum products. We believe our combination of captive alumina and bauxite, a secure electric power contract and strategically located assets give us meaningful operational flexibility. Our bauxite mining operation in St. Ann, Jamaica provides a secure source of bauxite to our wholly owned alumina refinery in Gramercy, Louisiana. Gramercy provides a strategic supply of alumina to our New Madrid smelter at costs below recent spot market prices for alumina. Because our captive alumina and bauxite production capacity exceeds our internal requirements, we also sell these raw materials to third parties. The margin from these sales effectively lowers the cost of our alumina supply and therefore lowers our integrated aluminum cash cost. In addition, we have a long-term, secure power contract at New Madrid that extends through 2020. We believe this contract gives Noranda an advantage over aluminum smelters facing frequent power shortages or disruptions. In addition, our power costs are not linked to London Metals Exchange (or “LME prices”) aluminum prices, unlike the power costs of some of our competitors, particularly in North America.
In addition to providing security of supply, we believe our fully integrated upstream cost structure benefits us in an environment of rising aluminum prices. The cost of our supply of alumina, which we own, is positively affected by a rising LME price due to our realization of higher margins on third-party sales of alumina and bauxite.
Primary aluminum is a global commodity and its price is set on the LME. Due to a long-term domestic supply deficit in the U.S. and transportation costs, our primary aluminum products typically earn a Midwest premium on top of the LME price, the sum of which is known as the Midwest Transaction Price, or the “MWTP.” In addition, we typically sell a majority of our primary aluminum shipments in the form of value-added products, such as billet, rod and foundry, which include a fabrication premium over the MWTP. We also have the flexibility to direct primary aluminum volumes to our downstream rolling mills, on an arms-length basis, when demand is weak for our value-added end-products. This helps to ensure a standby demand for our upstream production.
Our downstream business is a low-cost domestic producer of aluminum rolled products. We own and operate four rolling mills, including the West plant in Huntingdon, Tennessee, which is recognized as one of the most advanced rolled aluminum production facilities in North America. Versatile manufacturing capabilities and advantageous geographic locations provide our rolling mills with the flexibility to serve a diverse range of end-users. We believe that this flexibility, when combined with our strong customer service capabilities, product quality and strategic sales support, has allowed our downstream business to gain share of demand in 2009 during a period of weakness in end-market demand and retain demand share in 2010. The downstream business prices its products at the MWTP plus a fabrication premium. Therefore, notwithstanding periodic metal margin gains or losses during times of volatility in aluminum prices, our downstream earnings are substantially insulated from fluctuations in primary aluminum prices. As a result, the downstream business’s performance is predominantly driven by fluctuations in volumes and the fabrication premiums we are able to achieve. During periods of difficult market conditions in our downstream business, we have the ability to scale back meaningfully on capital expenditures, such as in 2009, when we reduced our capital expenditures by 58% versus 2008. We believe that the nominal maintenance capital requirements combined with operating performance that is substantially insulated from aluminum price fluctuations make the downstream business a relatively effective vehicle for free cash flow generation. The geographic proximity of the facilities in our upstream and downstream businesses creates a further degree of vertical integration, providing for additional operational flexibility.
6
Table of Contents
Company History
The Apollo Acquisition. Noranda HoldCo and Noranda AcquisitionCo were formed on March 27, 2007 by investment funds affiliated with, or co-investment vehicles managed indirectly by, Apollo Management, L.P., including Apollo Investment Fund VI, L.P. (collectively “Apollo”), along with its parallel investment funds, to acquire a portion of the aluminum business of Xstrata (Schweiz) AG (“Xstrata”). The Apollo Acquisition was completed on May 18, 2007, when Noranda AcquisitionCo acquired the stock of a subsidiary of Xstrata that held the Noranda aluminum business. As used in this report, the term “Apollo Transactions” means, collectively, the May 18, 2007 acquisition by Apollo of the Noranda aluminum business.
Upon completion of the Apollo Acquisition, Apollo and certain members of management became the owners of all of the outstanding equity interests of Noranda HoldCo. Noranda AcquisitionCo is a wholly owned subsidiary of Noranda HoldCo.
The Joint Venture Transaction. On August 31, 2009, we completed a transaction, which we refer to as the “Joint Venture Transaction,” whereby we became the sole owner of the alumina and bauxite production joint ventures, Gramercy and St. Ann, respectively, that we had operated since 2004 with Century Aluminum Company (together with its subsidiaries, “Century”). In consideration for its ownership share, Century was forgiven certain liabilities to the alumina joint venture and was released from all agreements and obligations of the joint ventures. In addition, as part of the Joint Venture Transaction, we agreed to sell to Century approximately 190,500 metric tonnes of alumina through 2010, with the first 125,000 metric tonnes sold at a fixed price and the reminder sold at prices indexed to the LME price.
Primary Metal — Upstream Business
Business Overview. The upstream business is vertically integrated with operations in bauxite mining, alumina refining and aluminum smelting. The process of making aluminum is power intensive and requires a large amount of alumina (aluminum oxide), which is derived from the raw material bauxite. Approximately four pounds of bauxite are required to produce approximately two pounds of alumina, and two pounds of alumina will produce approximately one pound of aluminum.
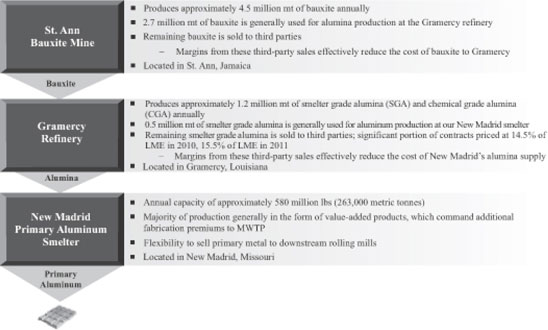
New Madrid Primary Aluminum Smelter. All of our primary aluminum production occurs at New Madrid, which produces approximately 580 million pounds (263,000 metric tonnes) of primary aluminum annually at full capacity, accounting for approximately 15% of total United States primary aluminum production for 2010 according to CRU. New Madrid is strategically located as the closest Midwest facility to a supply of alumina. It is also located in an area with abundant sources of electrical power. See “Raw Materials and Supply” below. The smelter was built in 1971 and underwent significant capacity expansions in 1976, 1983 and 2001. On August 4, 2010, the New Madrid smelter received a Prevention of Significant Deterioration (PSD) Permit from the Missouri Department of Natural Resources which allows the facility to increase production capacity to 650 million pounds per year. During the third quarter of 2010, we announced that we had initiated steps to complete a $38 million capital project at New Madrid, which we expect to increase annual metal production by approximately 35 million pounds during 2013. During the fourth quarter 2010, we invested approximately $1.1 million toward the smelter expansion project, which remains on schedule for completion during 2013.
7
Table of Contents
The smelter is located aside the Mississippi River near New Madrid, Missouri. It occupies 250 acres, including 44 acres under roof, of the 4,200 acre St. Jude Industrial Park, the largest industrial park in the State of Missouri. Noranda owns and manages approximately 2,600 acres of the St. Jude Industrial Park, providing us land for either expansion or sale to prospective tenants.
The smelter is fully integrated with its own raw material unloading facility, environmental control systems and aluminum reduction plant, including carbon anode fabrication. New Madrid has three production lines. This diversity of lines facilitates the maintenance of steady production levels near full capacity and, in rare instances of severe production threats; helps insulate us from complete plant shutdowns.
The plant site also includes a fabrication facility for the production of continuous cast rod, extrusion billet and foundry ingot. This business converts molten aluminum into value-added products. The fabrication facility has the capacity to produce annually approximately 160 million pounds of rod, used mainly for electrical applications and steel de-oxidation; 286 million pounds of extrusion billet, used mainly for building construction and architectural and transportation applications; and 75 million pounds of foundry ingot, used mainly for transportation. During 2010, based on CRU data, New Madrid produced approximately 28% of the rod manufactured in North America and supplied approximately 9% of North American primary extrusion billet. Molten aluminum that is not used in these product lines is produced as primary ingots for transfer to our downstream business or sale to other aluminum fabricators.
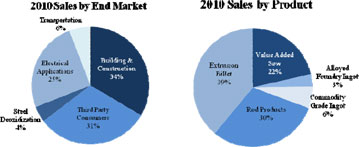
Source: Company data for the year ended December 31, 2010
During 2010, approximately 62% of our value-added products were sold at the prior month’s MWTP plus a fabrication premium. Our major target customers in the primary aluminum products segment are located in the Midwestern United States and Mexico, with 79% of loads delivered to these customers within a one-day truck delivery distance.
Raw Materials and Supply. Energy and alumina are the main cost components for primary aluminum production.
Raw Materials
Our upstream business is fully integrated from bauxite to alumina to primary aluminum metal, ensuring security of raw material supply at long-term competitive costs. Our aluminum smelter in New Madrid, Missouri receives substantially all of its alumina requirements from Gramercy. We believe New Madrid has a freight cost advantage relative to other smelters because of the proximity of Gramercy to St. Ann and New Madrid to Gramercy. We believe our strategic location allows New Madrid to source its alumina from Gramercy at a lower freight cost than other U.S. based smelters.
Gramercy Alumina Refinery. At the Gramercy refinery, bauxite is chemically refined and converted into alumina, the principal raw material used in the production of primary aluminum. Extensive portions of the Gramercy refinery were rebuilt from 2000 through 2002. Gramercy has an annual production capacity of 1.2 million metric tonnes of alumina, approximately 40% of which is supplied to our New Madrid facility. The Gramercy refinery is the source for the vast majority of New Madrid’s alumina requirements. New Madrid purchases alumina from time to time from third parties, but the quantities are minimal. The remaining alumina production at the Gramercy refinery that is not taken by New Madrid is sold in the form of smelter grade alumina and alumina hydrate, or chemical grade alumina, margins on which effectively reduce the cost of New Madrid’s alumina supply.
St. Ann Bauxite Mine. Bauxite is the principal raw material used in the production of alumina and all of the bauxite used at our Gramercy refinery is purchased from St. Ann. We transport bauxite from St. Ann to Gramercy by oceangoing vessels, which are the only available means of transportation. We recently signed a new contract which extends through December 2015 with a third party for bauxite ocean vessel freight.
We operate the St. Ann bauxite mine through Noranda Bauxite Limited, which we refer to as “NBL,” a Jamaican limited liability company formerly known as St. Ann Bauxite Limited. NBL’s bauxite mining assets consist of: (1) a concession from the Government of Jamaica, or “GOJ,” to mine bauxite in Jamaica through 2030 and (2) a 49% interest in Noranda Jamaica Bauxite Partnership, or “NJBP,” which holds the physical mining assets and conducts the mining and related operations pursuant to the concession. The GOJ owns the remaining 51% of NJBP. The physical mining assets consist primarily of rail facilities, other mobile equipment, dryers and loading and dock facilities. The age and remaining lives of the mining assets vary and they may be repaired or replaced from time to time as part of NJBP’s ordinary capital expenditure plan. Under the terms of the GOJ concession, NJBP mines
8
Table of Contents
the land covered by the concession and the GOJ retains surface rights and ownership of the land. The GOJ granted the concession and entered into other agreements with NBL for the purpose of ensuring that we have sufficient reserves to meet our annual alumina requirements. The concession ensures access to sufficient reserves to allow NBL to ship 4.5 million dry metric tonnes (“DMT”) of bauxite annually from mining operations in the specified concession area through September 30, 2030. We have reached agreement with the GOJ to mine 5.4 million DMT during each of the years 2011 and 2012.
The GOJ is required to provide additional concessions if the specified concession does not contain sufficient quantities of commercially exploitable bauxite. NBL is responsible for reclamation of the land that it mines. The outstanding reclamation liability at December 31, 2010 was $9.4 million.
Pursuant to an establishment agreement that governs the relationship between NBL and the GOJ, NBL manages the operations of the partnership (NJBP), pays operating costs and is entitled to all of its bauxite production. NBL pays the GOJ according to a negotiated fiscal structure, which consists of the following elements: (i) a royalty based on the amount of bauxite mined, (ii) an annual “asset usage fee” for the use of the GOJ’s 51% interest in the mining assets, (iii) customary income and other taxes and fees, (iv) a production levy, which was waived for certain historical periods, but which is applicable in 2009 and future periods, and (v) certain fees for lands owned by the GOJ that are covered by the concession. In calculating income tax on revenues related to sales to our Gramercy refinery, NBL uses a set market price, which is negotiated periodically between NBL and the GOJ. At the end of 2009, we and the GOJ reached an agreement setting the fiscal regime structure for NBL’s bauxite mining operations through December 31, 2014. The agreement covers the fiscal regime, as well as NBL’s commitment for certain expenditures for haulroad development, maintenance, dredging, land purchases, contract mining, training and other general capital expenditures from 2009 through 2014. If we do not meet our commitment to the GOJ regarding these expenditures, we would owe to the GOJ a penalty that could be material to our financial statements. We believe there is a remote possibility that we will not meet the commitment. We signed the formal amendment with the GOJ on the fiscal structure in June 2010, which did not change the cost structure from the agreement reached in 2009. The terms of the agreement required us to make a $14.0 million prepayment of Jamaican income taxes for fiscal years 2011 through 2014, of which $10.0 million was paid in June 2010 and the remainder will be paid in April 2011.
During 2010, approximately 60% of the bauxite from St. Ann is refined into alumina at our Gramercy refinery, and the remainder is sold to Sherwin Alumina Company pursuant to a contract through 2012. Beginning in 2011, pricing of the Sherwin contract is based on a percentage of LME, limited by certain ceilings and floors. The margins from these third-party sales effectively reduce the net cost of bauxite transferred to Gramercy. During the years ended December 31, 2008, 2009 and 2010, St. Ann mined 4.5 million, 3.2 million and 4.6 million DMTs of bauxite, respectively.
Energy
Electrical Power. The smelter is located in an area with abundant sources of electrical power. New Madrid has a power purchase agreement with Ameren Missouri, Missouri’s largest electric utility (“Ameren”), pursuant to which New Madrid has agreed to purchase substantially all of its electricity from Ameren through May 2020. This contract is for regulated power and cannot be altered without the approval of the Missouri Public Service Commission (“MoPSC”). On September 3, 2010, Ameren filed a rate case with the MoPSC seeking an 11% base rate increase. We expect a ruling on this request by July 29, 2011. The pricing structure of our power contract includes two components: a base rate and a fuel adjustment clause.
We are currently appealing several rate-related issues, including the previous two rate rulings and the amount of cost increases related to fuel adjustment charges. As of December 31, 2010, we have $9.8 million held in escrow by the Missouri Circuit Court for disputed amounts related to these appeals.
Natural Gas. Our Gramercy refinery has contractual arrangements with two local suppliers of natural gas, Shell Energy North America, L.P. (“Shell”) and Atmos Energy Marketing, LLC (“Atmos”). Shell supplies the majority of Gramercy’s natural gas needs on a month-to-month basis, following the expiration of our annual contract in April 2010. Atmos supplies the remaining natural gas under an annual contract that expires on April 30, 2011. We believe in the event Shell was unable or unwilling to continue to supply Gramercy with natural gas, there are sufficient alternatives, including Atmos, to meet our needs. These contracts guarantee a secure supply of natural gas at a price based on the Henry Hub Index plus transportation and pipeline costs. In addition, our contract with Atmos provides security in case of a short-term supply emergency (such as a hurricane or other force majeure situation), by granting Gramercy the option, at an established premium, to obligate Atmos to utilize its storage assets to supply Gramercy’s full natural gas supply requirements.
Fuel. Fuel is a substantial component of the cost structure at our St. Ann bauxite mine and is generally linked to the price of oil. The Pricing Index is based on the Platts Oilgram Price Reports, plus an adder for transportation and handling. The facility uses two types of oils. Bunker C or heavy fuel oil is supplied by Clark Oil Trading Company and diesel fuel is supplied by Petrojam, the local refinery. The contract with Petrojam expired December 31, 2010 and a new contract is currently being negotiated. The contract with Clark Oil expires on September 30, 2011.
Competition. The market for primary aluminum is diverse and highly competitive. We believe that we compete on the basis of price, quality, timeliness of delivery and customer service, with our focus on the latter three areas. We also compete on a global basis with other producers and other materials on the basis of production cost. The marginal cost of these producers, who are in the highest
9
Table of Contents
cost quartile, is one factor in determining the market price for aluminum. Aluminum also competes with other materials such as steel, plastic, copper, titanium and glass, based upon functionality and relative pricing.
Sales and Marketing: Customers. We employ a sales force consisting of inside and outside salespeople. Inside salespeople are responsible for maintaining customer relationships, receiving and soliciting individual orders and responding to service and other inquiries by customers. Our outside sales force is responsible for identifying potential customers and calling them to explain our services, as well as maintaining and expanding our relationships with our current customers. The sales force is trained and knowledgeable about the characteristics and applications of various metals, as well as the manufacturing methods employed by our customers.
Our sales and marketing focus is on the identification of original equipment manufacturers, or “OEMs,” and other metals end-users that could achieve significant cost savings through the use of our inventory management, value-added processing, just-in-time delivery and other services. We use a variety of methods to identify potential customers, including the use of databases, direct mail and participation in manufacturers’ trade shows. Customer referrals and the knowledge of our sales force about regional end-users also result in the identification of potential customers. Once a potential customer is identified, our outside salespeople assume responsibility for visiting the appropriate customer contact, typically the vice-president of purchasing or operations and business owners.
All of our value-added (billet, foundry, rod) sales are on a negotiated price basis. In some cases, sales are the result of a competitive bid process where a customer provides a list of products, along with requirements, to us and several competitors and we submit a bid on each product. We have a diverse customer base in our upstream business, with no single customer accounting for more than 6% of our net sales in each of the last three full fiscal years. In 2010, our ten largest customers represented 42% of our net primary aluminum products sales.
Rolling Mills — Downstream Business
Business Overview. Our downstream business is an integrated manufacturer of aluminum foil and light sheet. Our rolling mills are located in the southeastern United States, in Huntingdon, Tennessee, Salisbury, North Carolina and Newport, Arkansas, with a combined maximum annual production capacity of 410 to 495 million pounds, depending on our production mix. Our products include heavy gauge foil products such as finstock and semi-rigid container stock, light gauge converter foils used for packaging applications, consumer foils and light gauge sheet products such as transformer windings and building products. We primarily sell our products to OEMs of air conditioners, transformers, semi-rigid containers and foil packaging, most of whom are located in the eastern and central part of the United States. Our plants are well situated to serve these customers and approximately 61% of deliveries are within a one-day truck delivery distance, resulting in freight savings and customer service benefits. Versatile manufacturing capabilities and advantageous geographic locations provide our rolling mills the flexibility to serve a diverse range of end uses while maintaining a low cost base. The Huntingdon site has ISO 9001-2000 certification from the International Organization for Standardization with regards to its quality management system. A description of the products produced at our four rolling mill facilities follows:
| Plant |
Location |
Maximum capacity | Products | |||
| (in millions of pounds) | ||||||
| Huntingdon – West | Huntingdon, TN | 235 | Finstock, container stock, intercompany reroll and miscellaneous heavy gauge products | |||
| Huntingdon – East | Huntingdon, TN | 130 | Finstock, transformer windings, household foil, and miscellaneous heavy gauge products | |||
| Salisbury | Salisbury, NC | 95 | Light gauge products including flexible packaging, finstock, lithographic sheet, intracompany reroll and miscellaneous leveled products | |||
| Newport | Newport, AR | 35 | Light gauge products including flexible packaging | |||
| Total |
495(1) | |||||
| (1) | Capacity includes intra-company reroll. Based on production mix at December 31, 2010, effective annual capacity of our rolling mills is 410 million pounds. |
Products. Aluminum foil has several outstanding characteristics that account for a wide range of commercial applications:
| • | long life—the aluminum surface has a natural hard, transparent layer of oxide which substantially precludes further oxidation; |
| • | high electrical and thermal conductivity; |
| • | nontoxic and nonabsorbent; |
| • | excellent moisture barrier even at thicknesses less than the diameter of a human hair; |
10
Table of Contents
| • | light weight; |
| • | highly reflective and attractive in appearance; |
| • | “dead fold” for packaging applications; |
| • | the most plentiful metal in the earth’s crust; |
| • | the most recycled packaging material in the world; and |
| • | attractive cost-to-weight ratio compared to other metals such as copper and tin. |
We have a variety of distinctive product and service capabilities, providing us with a strong competitive position. Our main product lines are the following:
Finstock: Bare or coated aluminum foil and sheet ranging in gauge from 0.002 inches to 0.007 inches is widely used as a heat exchanger in air conditioners because it provides more heat transfer area per unit of cost than any other material. Aluminum sheet and foil finstock are used in commercial, residential and automotive applications.
Semi-Rigid Containers: These products are typically made with harder alloys than finstock, although the range of gauges is similar, encompassing both foil and light sheet. Formed, disposable aluminum containers are among the most versatile of all packages and are widely used for pre-packaged foods, easily withstanding all normal extremes of heating and freezing.
Flexible Packaging: Aluminum foil is laminated to papers, paperboards and plastic films to make flexible and semi-rigid pouches and cartons for a wide range of food, drink, agricultural and industrial products. The laminating process is known as “converting,” hence the term “converter foil” for rolled aluminum products used in this application.
Transformer Windings: Aluminum sheet cut into strips and insulated is widely used as the conducting medium that forms the windings of electrical transformers widely used on power grids. Aluminum’s relatively low cost is key to this application.
We price our products at the MWTP plus a negotiated fabrication premium. The cost of primary metal is passed through to customers; therefore, our profitability is largely insulated from movement in aluminum prices except in periods of rapid change, which could create significant differences between the cost of metal purchased and the price of metal sold to customers. We use both primary aluminum, which is sourced from various smelters, and discounted metal units, which usually take the form of scrap or recycled scrap ingot. We seek to maximize profitability by optimizing both the mix of rolled products produced and the prime-to-scrap ratio in our metal feed. Historically, approximately 20% of our primary aluminum production is shipped to our rolling mills, providing security of supply, and allowing us to take advantage of short-term surges in demand.
Raw Materials and Supply. The principal raw materials that we use in rolled products manufacturing include primary aluminum, recycled aluminum and alloying elements. Total metal units purchased in 2010 were approximately 366 million pounds. These raw materials are generally available from several sources and are not subject to supply constraints under normal market conditions. We also consume considerable amounts of energy in the operation of our facilities, which is a significant component of our non-metal conversion costs.
In the downstream business, natural gas and electricity represent the substantial majority of our energy consumption. We purchase our natural gas on the open market with short to medium term supply contracts and agreements for key transportation requirements. See Item 7, “Management’s Discussion and Analysis of Financial Condition and Results of Operations - Quantitative and Qualitative Disclosures about Market Risk” for a summary of the price and quantity of natural gas hedging contracts.
Electricity is purchased through medium-term contracts at industrial rates from regional utilities supplied through local distributors. Supply has been reliable at all plants.
Competition. The aluminum rolled products market is highly competitive. We face domestic competition from a number of companies in the markets in which we operate. Our primary competitors are J.W. Aluminum Company, Aleris International Inc. and Novelis North America. Some of our competitors are substantially larger, have more diversified operations, and compete in product lines in which we do not operate. We also face competition from imports, mainly from Asia. The factors influencing competition vary by region and end-use, but we generally compete on the basis of price, product quality, the ability to meet customers’ specifications, range of products offered, lead times, technical support and customer service.
In addition to competition from within the aluminum rolled products industry, the industry faces competition from non-aluminum materials. In the packaging market, aluminum rolled products’ primary competitors are plastics and cardboard. However, for our most important heat exchanger customers, usage of aluminum finstock is well entrenched because we believe no other material offers more favorable economics. Factors affecting competition with substitute materials include technological innovation, relative prices, ease of manufacture, consumer preference and performance characteristics.
Sales and Marketing: Customers. Our sales force consists of inside and outside salespeople. Our outside sales force is primarily responsible for identifying potential customers and calling on them to negotiate profitable business and handling any subsequent issues that may arise. Inside salespeople are primarily responsible for maintaining customer relationships, receiving and
11
Table of Contents
soliciting individual orders and responding to service and other inquiries by customers. The sales force is trained and knowledgeable about the characteristics and applications of our various products, as well as our manufacturing methods and the end-use markets in which our customers are involved.
Our sales and marketing focus is on servicing OEMs who are major participants in the markets where our products are used as inputs. However, our staff participates in industry groups and attends trade shows in order to keep abreast of market developments and to identify potential new accounts. Once a potential new customer is identified, our outside salespeople assume responsibility for visiting the appropriate customer contact, typically the purchasing manager or manager of operations, to explore and develop business opportunities.
Nearly all business is conducted on a negotiated price basis, with a few sales made at list prices, typically to smaller accounts.
Our downstream business has a diverse customer base. Prior to 2009, no single customer accounted for more than 10% of our net sales in each of the last three years; however, in 2010, one customer represented 15% of net sales. In 2010, our ten largest flat rolled products customers represented 51% of flat rolled products net sales. Of our ten largest customers, we have done business with eight for ten years or more, and with six for 20 years or more.
Facilities. We operate four plants at three locations in the southeastern United States and our divisional offices, which consist of leased office space aggregating to approximately 30,000 square feet, are located at our corporate headquarters in Franklin, Tennessee.
Huntingdon. Our largest production site is in Huntingdon, Tennessee, with a maximum annual capacity of up to 365 million pounds, depending on production mix. The Huntingdon site is subject to a long-term lease arrangement with the Industrial Development Board of the Town of Huntingdon, pursuant to which we functionally own the facility and can acquire legal title for the nominal sum of $100. The site includes a long established casting and rolling facility which was built in 1967 and acquired from Archer Aluminum by Noranda in 1979, which we refer to as the East plant. Construction began on a second plant in 1998 and production started in 2000 at a capital cost of $238 million, which we refer to as the West plant. The two plants are physically separate, but are operated with shared administration and maintenance personnel, and with some sharing of production capabilities. According to CRU, the Huntingdon - West facility is one of the most advanced rolled aluminum production facilities in North America, and has the lowest conversion cost (excluding metal) for foil stock production in North and South America.
Salisbury. This plant was originally constructed in 1965 and has a maximum annual capacity of up to 95 million pounds, depending on production mix. The Salisbury plant is one of the largest U.S. producers of intermediate width light gauge product (less than 0.001 inches thickness), typically sold to customers who laminate the foil with paper, plastic or cardboard used in flexible packaging applications such as juice boxes. The facility also has a “tension leveling” line which enables production of lithographic sheet, a higher margin item used in the printing industry.
Newport. The Newport plant is a rolling and finishing operation only and relies on intermediate gauge “reroll” supplied by Salisbury or Huntingdon. The Newport plant has a maximum annual capacity of up to 35 million pounds, depending on production mix.
Employees
As of December 31, 2010, we employed approximately 2,400 persons.
We are a party to six collective bargaining agreements that expire at various times within the next five years. As of December 31, 2010, approximately 1,600 of our employees (or 69%) were members of the following unions: the United Steelworkers of America (“USWA”); the International Association of Machinists and Aerospace Workers (“IAMAW”); the University and Allied Workers Union (“UAWU”); and the Union of Technical, Administrative and Supervisory Personnel (“UTASP”). We have completed the process of formalizing recognition of a third union at St. Ann with the Bustamante Industrial Trade Union (“BITU”). We are currently in negotiations to finalize terms of a three year agreement with the BITU.
| • | The agreement with the USWA at our Gramercy refinery expired in September 2010, and on October 1, 2010 a new five year labor agreement with the USWA was ratified by the refinery’s union members. |
| • | The agreement at St. Ann with the UAWU expired on April 30, 2010. We are currently in negotiation to finalize the terms of a three year agreement with the UAWU. |
| • | The agreement at St. Ann with the UTASP expired in December 2010. As of December 31, 2010, we have not received a new claim and have not begun negotiations with the UTASP. (As customary in Jamaican labor practices, unions generally submit claims subsequent to the expiration of the collective bargaining agreements. Until a new agreement is ratified, we continue to operate under the terms of the expired agreement, and, once signed, the new agreement is retroactive to the previous expiration date.) |
| • | The agreement at our Newport rolling mill with the IAMAW expires in May 2011. |
| • | All other collective bargaining agreements expire within the next five years. |
12
Table of Contents
From time to time, there are shortages of qualified operators of metals processing equipment. In addition, during periods of low unemployment, turnover among less-skilled workers can be relatively high. We believe that our relations with our employees are satisfactory.
Safety
Our goal is to provide an accident-free workplace. We are committed to continuing and improving upon each facility’s focus on safety in the workplace. We have a number of safety programs in place, which include regular bi-weekly safety meetings and training sessions to teach proper safe work procedures.
Our executive management, along with site managers and union leadership, are actively involved in supporting and promoting the ongoing emphasis on workplace safety. Improvement in safety performance is a key metric used in determining annual incentive awards for our U.S. employees.
Research and Development
We do not incur material expenses in research and development activities but from time to time participate in various research and development programs. We address research and development requirements and product enhancement by maintaining a staff of technical support, quality assurance and engineering personnel.
Additional Information
Noranda Aluminum Holding Corporation was incorporated in Delaware on March 27, 2007. We file annual, quarterly and current reports and other information with the Securities and Exchange Commission (the “SEC”). You may read and copy any document we file with the SEC at the SEC’s public reference room at 100 F Street, N.E., Washington, D.C. 20549. Please call the SEC at 1-800-SEC-0330 for further information on the public reference room. Our SEC filings are also available to the public at the SEC’s website at http://www.sec.gov.
You may obtain copies of the information and documents incorporated by reference in this report at no charge by writing or telephoning us at the following address or telephone number:
Noranda Aluminum Holding Corporation
801 Crescent Centre Drive, Suite 600
Franklin, TN 37067
Attention: Robert Mahoney
Chief Financial Officer
(615) 771-5700
We also maintain an internet site at http://www.norandaaluminum.com. We will, as soon as reasonably practicable after the electronic filing of our annual report on Form 10-K, quarterly reports on Form 10-Q, current reports on Form 8-K and amendments to those reports if applicable, make available such reports free of charge on our website. Our website and the information contained therein or connected thereto is not incorporated into this annual report.
13
Table of Contents
| ITEM 1A. | RISK FACTORS |
| You should carefully consider the risk factors set forth below as well as the other information contained in this Annual Report on |
Cyclical fluctuations in the primary aluminum industry cause variability in our earnings and cash flows.
Our operating results depend on the market for primary aluminum, a cyclical commodity with prices subject to global market forces of supply and demand and other related factors. Such factors include speculative activities by market participants, production activities by competitors, political and economic conditions, and production costs in major production regions. A substantial increase in primary aluminum production capacity could further affect prices. Prices have been historically volatile. Over the past ten years, the average daily LME settlement price has ranged from a low of $0.56 per pound in November 2001 to a high of $1.49 per pound in July 2008.
Beginning in the second half of 2008, global economic contraction severely impacted the aluminum industry. Driven by significant weakness in end-use markets such as housing and transportation, aluminum prices experienced a profound decline. During that contraction, the monthly average LME price dropped from a peak of $1.49 in July 2008, to a low of $0.57 in February 2009. The decline in LME price to levels at which our production cash costs were higher than our primary metal selling prices had a significant negative impact on our operating results. Though LME prices have risen to $1.12 as of December 31, 2010, our business, financial condition, results of operations and cash flows could be materially and adversely affected by significant declines in LME prices in the future.
Although we have at times hedged our exposure to the volatility of LME prices since the Apollo Acquisition, we currently have no such hedges in place. If we do not undertake further hedging activities, we will continue to have price risk with respect to the unhedged portion of our primary aluminum shipments. A prolonged downturn in prices for primary aluminum could significantly reduce the amount of cash available to us to meet our current obligations and fund our long-term business strategies. In addition, we may enter into new hedging arrangements in the future, which may not be beneficial, depending on subsequent LME price changes, and could materially and adversely affect our business, financial condition, results of operations and cash flows.
We are under no obligation under our senior secured credit facilities, our AcquisitionCo Notes or otherwise to enter into further hedging arrangements. Future market prices for aluminum could decline materially, reducing our revenues and cash flows. For additional information regarding our hedging activities, see Item 7, “Management’s Discussion and Analysis of Financial Condition and Results of Operations” and Item 7A, “Quantitative and Qualitative Disclosures about Market Risk.”
Our significant cost components, specifically our supply of alumina, which we own, and our New Madrid power contract are not tied to the LME price of aluminum. As a result, as the LME price decreases, we are at a competitive disadvantage to non-integrated primary aluminum producers and our profit margins are reduced which could materially and adversely affect our business, financial condition, results of operations and cash flows.
A continued or renewed downturn in general economic conditions, as well as a downturn in the end-use markets for certain of our products, could materially and adversely affect our business, financial condition, results of operations and cash flows.
A global recession and credit crisis began in late 2007 and continued through much of 2009. This crisis substantially impacted our upstream and downstream businesses. While the global market for our primary aluminum products has meaningfully recovered from its trough in early 2009 and the markets for our downstream products stabilized in the second half of 2009, a renewed decline in either the global primary aluminum market or the North American rolled products markets would have a negative impact on our business, financial condition, results of operations and cash flows. Historically, global supply and demand for primary aluminum have fluctuated in part due to general economic and market conditions in the United States and other major global economies, including China. In addition, certain end-use markets for our rolled products, such as the housing, construction and transportation industries, experience demand cycles that are correlated to the general economic environment. Economic downturns in regional and global economies or a decrease in manufacturing activity in industries such as construction, packaging and consumer goods, all of which are sensitive to a number of factors outside our control, could materially and adversely affect our business, financial condition, results of operations and cash flows.
Losses caused by disruptions in the supply of electrical power could materially and adversely affect our business, financial condition, results of operations and cash flows.
We are subject to losses associated with equipment shutdowns, which may be caused by the loss or interruption of electrical power to our facilities due to unusually high demand, blackouts, equipment failure, natural disasters or other catastrophic events. We use large amounts of electricity to produce primary aluminum, and any loss of power that causes an equipment shutdown can result in the hardening or “freezing” of molten aluminum in the pots where it is produced. If this occurs, we may experience significant losses
14
Table of Contents
if the pots are damaged and require repair or replacement, a process that could limit or shut down our production operations for a prolonged period of time.
During the week of January 26, 2009, power supply to our New Madrid smelter was interrupted numerous times because of a severe ice storm in Southeastern Missouri, causing a loss of approximately 75% of the smelter capacity. Although the smelter returned to full operations by March 31, 2010, there can be no assurance that we will not ultimately experience shorter pot lives or higher failure rates as a result of damage from the equipment shutdown.
Although we maintain property and business interruption insurance to mitigate losses resulting from catastrophic events, we may be required to pay significant amounts under the deductible provisions of those insurance policies. In addition, our coverage may not be sufficient to cover all losses, or may not address all causes of loss or cover certain events. Certain of our insurance policies do not cover any losses we may incur if our suppliers are unable to provide us with power during periods of unusually high demand.
Our operations consume substantial amounts of energy and our profitability may decline if energy costs rise.
Electricity and natural gas are essential to our businesses, which are energy intensive. The costs of these resources can vary widely and unpredictably. The factors that affect our energy costs tend to be specific to each of our facilities. Electricity is the largest cost component at our New Madrid smelter and is a key factor to our long-term competitive position in the primary aluminum business. We have a power purchase agreement with Ameren Missouri, Missouri’s largest electric utility (“Ameren”), pursuant to which we have agreed to purchase substantially all of New Madrid’s electricity through May 2020. Ameren may increase the rates it charges its customers, including Noranda, with the approval of the Missouri Public Service Commission (“MoPSC”).
On June 21, 2010, the MoPSC ruled on the power rate case filed by Ameren on July 24, 2009. The MoPSC’s ruling resulted in no significant change to the base electricity rate for the New Madrid smelter. The fuel adjustment clause resulted in additional fuel charges of $5.4 million recorded in cost of goods sold during the year ended December 31, 2010. Though we are not able to predict future fuel adjustment charges, as they are dependent on Ameren’s fuel costs and off system sales volume and prices, we expect the impact of fuel adjustment charges in 2011 to increase our integrated primary aluminum cash cost by 2 to 3 cents per pound for 2011. On September 3, 2010, Ameren filed a new rate case with the MoPSC seeking an 11% base rate increase. We expect a ruling on this request by July 29, 2011. The outcome of the rate case or any future rate cases Ameren may initiate could materially and adversely affect the competitiveness and long-term viability of our smelter as well as our business, financial condition, results of operations and cash flows.
Electricity is also a key cost component at our rolling mill facilities. Electricity is purchased through medium-term contracts at industrial rates from regional utilities supplied through local distributors. If we are unable to obtain power at affordable rates upon expiration of these contracts, we may be forced to curtail or idle a portion of our production capacity, which could materially and adversely affect our business, financial condition, results of operations and cash flows.
Natural gas is the largest cost component at our Gramercy refinery and a key cost component at our rolling mill facilities. Our Gramercy refinery has contracts to guarantee secure supply from two suppliers at an index-based price. Our downstream business purchases natural gas on the open market. The price of natural gas can be particularly volatile. As a result, our natural gas costs may fluctuate dramatically, and we may not be able to mitigate the effect of higher natural gas costs on our cost of sales. Any substantial increases in energy costs could cause our operating costs to increase and could materially and adversely affect our business, financial condition, results of operations and cash flows. At December 31, 2010, we are a party to forward swaps for natural gas, effectively fixing our cost for approximately 45% of our natural gas exposure through 2012. We will continue to have price risk with respect to the unhedged portion of our natural gas purchases. In addition, our actual future usage may be higher or lower than we estimated. As a result of these factors, our hedging activities may be less effective than expected in reducing the economic variability of our future costs.
Fuel is a substantial component of the cost structure at our St. Ann bauxite mining operation. Our fuel is provided under an indexed-based contract linked to the price of oil. Our fuel costs at St. Ann may fluctuate, and we may not be able to mitigate the effect of higher fuel costs. Changes in the index will have an impact on our cost structure. Any increases in fuel costs could cause our operating costs to increase and could materially and adversely affect our business, financial condition, results of operations and cash flows.
We may encounter increases in the cost of raw materials, which could cause our cost of goods sold to increase, thereby materially and adversely affecting our business, financial condition, results of operations or cash flows and limiting our operating flexibility.
We require substantial amounts of raw materials in our business. These raw materials consist principally of bauxite, alumina, primary aluminum, recycled aluminum and aluminum scrap; however, pricing volatility of other raw materials, including carbon products and caustic soda, may have a significant impact on our costs. If raw material prices increase we may not be able to pass on the entire cost of the increases to our customers or offset fully the effects of high raw materials costs through productivity improvements, which could materially and adversely affect our business, financial condition, results of operations or cash flows.
Beginning in fourth quarter 2008 and continuing through second quarter 2009, the cost of alumina purchased from the Gramercy refinery exceeded the spot prices of alumina available from other sources. If such situations arise in the future, we may not
15
Table of Contents
be able to decrease Gramercy’s production in response to changes in market forces and any such decreases will increase our unit costs and limit our ability to fully recover fixed costs. We may be forced to sell excess alumina at market prices that could be substantially lower than our cash cost of production, which could materially and adversely affect our business, financial condition, results of operations and cash flows.
During 2010, we sold approximately 40% of St. Ann’s bauxite production to Sherwin Alumina Company pursuant to a contract that extends through 2012. Margins from these sales effectively reduce the net cost of bauxite to Gramercy. In the event Sherwin Alumina Company is unable to honor that contract, or chooses not to extend the contract upon expiration, the net cost of our bauxite could increase, which could materially and adversely affect our business, financial condition, results of operations and cash flows.
Prices for the raw materials used by our downstream business, including primary aluminum, recycled aluminum and alloying elements, are subject to continuous volatility and may increase from time to time. Our sales are generally made on the basis of a “margin over metal price,” but if raw material costs other than metal increase we may not be able to pass on the entire cost of the increases to our customers or offset fully the effects of high raw materials costs through productivity improvements, which could materially and adversely affect our business, financial condition, results of operations and cash flows. In addition, a sustained material increase in raw materials prices may cause some of our customers to substitute other materials for our products.
We may be unable to continue to compete successfully in the highly competitive markets in which we operate.
We are engaged in a highly competitive industry. We compete with a number of large, well-established companies in each of the markets in which we operate. Our primary aluminum products segment competes with a large number of other value-added metals producers on an international, national, regional and local basis. We also compete, to a much lesser extent, with primary metals producers, who typically sell to very large customers requiring regular shipments of large volumes of metals. Our flat rolled products segment competes in the production and sale of rolled aluminum products with a number of other aluminum rolling mills, including large, single-purpose sheet mills, continuous casters and other multi-purpose mills. Aluminum also competes with other materials, such as steel, copper, plastics, composite materials and glass, among others, for various applications. In the past, for certain applications customers have demonstrated a willingness to substitute other materials for aluminum. In both businesses, some of our competitors are larger than us and have greater financial and technical resources than we do. These larger competitors may be better able to withstand reductions in price or other adverse industry or economic conditions.
Similarly, competitors with superior cost positions to ours, particularly those competitors that operate smelters with access to relatively lower cost production inputs, may be better able to withstand reductions in price or other adverse industry or economic conditions. In the event that the current competitive smelter cost landscape changes such that other smelters see stability or reductions in their major input costs and/or we see increases in ours, the long-term viability of our smelter could be compromised. A current or new competitor may also add or build new capacity, which could diminish our profitability by decreasing the equilibrium prices in our markets. New competitors could emerge from within North America or globally, including in China and the Middle East. If we do not compete successfully, our business, financial condition, results of operations and cash flows could be materially and adversely affected.
In addition, our flat rolled products segment competes with other rolled products suppliers, principally multi-purpose mills, on the basis of quality, price, and timeliness of delivery, technological innovation and customer service. One primary competitive factor, particularly in the flat rolled business, is price. We may be required in the future to reduce fabrication prices or shift our production to products that generally yield lower fabrication prices in order to remain at full capacity, which could impact our level of profitability. In addition, technological innovation is important to our customers and if we are unable to lead or effectively meet new innovations to meet our customers’ needs, such as down-gauging, our financial performance could be materially and adversely impacted. Increased competition in any of our businesses could have a material and adverse effect on our business, financial condition, results of operations and cash flows.
Aluminum may become less competitive with alternative materials, which could reduce our share of industry sales, lower our selling prices and reduce our sales volumes.
Aluminum competes with other materials such as steel, copper, plastics, composite materials and glass for various applications. Higher aluminum prices relative to substitute materials tend to make aluminum products less competitive with these alternative materials. Environmental or other regulations may increase our costs and be passed on to our customers, making our products less competitive. The willingness of customers to accept aluminum substitutes, or the ability of large customers to exert leverage in the marketplace to affect pricing for fabricated aluminum products, could result in a reduced share of industry sales or reduced prices for our products and services, which could decrease revenues or reduce volumes, either of which could materially and adversely affect our business, financial condition, results of operations and cash flows.
If we were to lose order volumes from any of our largest customers, our revenues and cash flows could be materially reduced.
Our business is exposed to risks related to customer concentration. In 2010, our ten largest customers were responsible for 36% of our consolidated revenues. In 2010, no one customer accounted for more than 8% of our consolidated revenues. A loss of order volumes from or a loss of industry share by, any major customer could materially and adversely affect our financial condition and results of operations by lowering sales volumes, increasing costs and lowering profitability. In addition, our customers may become
16
Table of Contents
involved in bankruptcy or insolvency proceedings or default on their obligations to us. Our balance sheet reflected an allowance for doubtful accounts totaling $0.2 million at December 31, 2009 and 2010.
We do not have long-term contractual arrangements with a significant majority of our customers, and our revenues and cash flows could be reduced if our customers switch their suppliers.
A significant majority of our customer contracts have a term of one year or less, although we have long-term relationships with many of our customers. Many of our customers purchase products and services from us on a purchase order basis and may choose not to continue to purchase our products and services. The loss of these customers or a significant reduction in their purchase orders could have a material and adverse impact on our sales volume and business, or cause us to reduce our prices, which could have a material and adverse effect on our business, financial condition, results of operations and cash flows.
Our business requires substantial capital investments that we may be unable to fulfill.
Our operations are capital intensive. Our capital expenditures were $51.6 million, $46.7 million and $61.3 million for 2008, 2009, and 2010 respectively. On a pro forma basis assuming 100% ownership for Gramercy and St. Ann, capital expenditures would have been $82.2 million and $52.3 million for 2008 and 2009, respectively.
We may not generate sufficient operating cash flows and our external financing sources may not be available in an amount sufficient to enable us to make required capital expenditures, service or refinance our indebtedness or fund other liquidity needs. If we are unable to make upgrades or purchase new plant and equipment, our business, financial condition, results of operations and cash flows could be materially and adversely affected by higher maintenance costs, lower sales volumes due to the impact of reduced product quality and other competitive influences.
We may be materially and adversely affected by environmental, safety, production and product regulations or concerns.
Our operations are subject to a wide variety of U.S. federal, state, local and non-U.S. environmental laws and regulations, including those governing emissions to air, discharges to waters, the generation, use, storage, transportation, treatment and disposal of hazardous materials and wastes, land reclamation and employee health and safety matters. Compliance with environmental laws and regulations can be costly, and we have incurred and will continue to incur costs, including capital expenditures, to comply with these requirements. Additionally, certain of our raw material suppliers may be subject to significant compliance costs, which may be passed through to us. As these direct or indirect regulatory costs increase and are passed through to our customers, our products may become less competitive than other materials, which could reduce our sales. If we are unable to comply with environmental laws and regulations, we could incur substantial costs, including fines and civil or criminal sanctions, or costs associated with upgrades to our facilities or changes in our manufacturing processes in order to achieve and maintain compliance. In addition, environmental requirements change frequently and have tended to become more stringent over time. We cannot predict what environmental laws or regulations will be enacted or amended in the future, how existing or future laws or regulations will be interpreted or enforced, or the amount of future expenditures that may be required to comply with such laws or regulations. Our costs of compliance with current and future environmental requirements could materially and adversely affect our business, financial condition, results of operations and cash flows.
In addition, as an owner and operator of real property and a generator of hazardous waste, we may be subject to environmental cleanup liability, regardless of fault, pursuant to Superfund or analogous state or non-U.S. laws. Thus, we could incur substantial costs, including cleanup costs and costs arising from third-party property damage or personal injury claims, relating to environmental contamination at properties currently or formerly operated by us or at third-party sites at which wastes from our operations have been disposed. Contaminants have been discovered in the soil and/or groundwater at some of our facilities. The discovery of additional contaminants or the imposition of additional cleanup obligations at these or other sites could result in significant liability. In addition, because we use or process hazardous substances in our operations, we may be liable for personal injury claims or workers’ compensation claims relating to exposure to hazardous substances.
We have identified certain environmental matters at both Gramercy and St. Ann, which are disclosed in our consolidated financial statements to the extent they represent liabilities as defined by U.S. GAAP. There could be other significant environmental issues of which we are not aware. The occurrence of new environmental issues could materially and adversely affect our business, financial condition, results of operations and cash flows.
Some of our facilities are located in areas that have been subject to natural disasters. Future natural disasters in these areas could damage our facilities and disrupt our operations.
Our aluminum smelter is located in New Madrid, Missouri on the banks of the Mississippi River and near the New Madrid fault line, in an area that may be subject to natural disasters such as floods, tornados, ice storms and earthquakes. As experienced during the January 2009 ice storm and subsequent power outages at our New Madrid facility, when such a disaster occurs, it can damage the facility in question and disrupt our production of aluminum. Our bauxite mine is located in St. Ann, Jamaica and our refinery is located in Gramercy, Louisiana, areas that may be exposed to hurricanes. In addition, our other facilities may be subject to natural disasters. We maintain insurance to protect us from events that may be caused by floods, earthquakes, tornados and hurricanes in amounts that we believe are commercially reasonable. There can be no assurance, however, that such insurance would be available on
17
Table of Contents
a timely basis or adequate to completely reimburse us for the losses that might be sustained or to provide funds for the reconstruction of our facilities, and in any event such insurance would not enable us to immediately reconstruct our facilities to avoid a suspension or disruption of our business while reconstruction proceeded to completion or alternative sourcing was located. In addition, our hedging arrangements could require us to deliver aluminum even if we are unable to produce such aluminum, which could cause us to incur unexpected costs in purchasing aluminum on the open market.
Our business is subject to unplanned business interruptions that may adversely affect our performance.
The production of aluminum is subject to unplanned events such as accidents, supply interruptions, transportation interruptions, human error, mechanical failure and other contingencies. Operational malfunctions or interruptions at one or more of our facilities could cause substantial losses in our production capacity. For example, during January 2009, an ice storm caused a power outage at our New Madrid smelter, causing a loss of approximately 75% of the smelter’s capacity. As such events occur; we may experience substantial business loss and the need to purchase one of our integrated raw materials at prices substantially higher than our normal cost of production, which could materially and adversely affect our business, financial condition, results of operations and cash flows. Furthermore, our vertical integration may cause operational malfunctions or interruptions at a facility in our upstream business to materially and adversely affect the performance or operation of the facilities downstream of the interrupted facility. Such interruptions may harm our reputation among actual and potential customers, potentially resulting in a loss of business. Although we maintain property and business interruption insurance to mitigate losses resulting from catastrophic events, we may be required to pay significant amounts under the deductible provisions of those insurance policies. In addition, our coverage may not be sufficient to cover all losses, or may not cover certain events. To the extent these losses are not covered by insurance, our financial condition, results of operations and cash flows could be materially and adversely affected.
We could experience labor disputes that disrupt our business.
We are a party to six collective bargaining agreements that expire at various times within the next five years. As of December 31, 2010, approximately 1,600 of our employees (or 69%) were members of the following unions: the United Steelworkers of America (“USWA”); the International Association of Machinists and Aerospace Workers (“IAMAW”); the University and Allied Workers Union (“UAWU”); and the Union of Technical, Administrative and Supervisory Personnel (“UTASP”). We have completed the process of formalizing recognition of a third union at St. Ann with the Bustamante Industrial Trade Union (“BITU”). We are currently in negotiations to finalize terms of a three year agreement with the BITU.
| • | The agreement with the USWA at our Gramercy refinery expired in September 2010, and on October 1, 2010, a new five year labor agreement with the USWA was ratified by the refinery’s union members. |
| • | The agreement at St. Ann with the UAWU expired on April 30, 2010. We are currently in negotiation to finalize the terms of a three year agreement with the UAWU. |
| • | The agreement at St. Ann with the UTASP expired in December 2010. As of December 31, 2010, we have not received a new claim and have not begun negotiations with the UTASP. |
| • | The agreement at our Newport rolling mill with the IAMAW expires in May 2011. |
| • | All other collective bargaining agreements expire within the next five years. |
As customary in Jamaican labor practices, unions generally submit claims subsequent to the expiration of the collective bargaining agreements. Until a new agreement is ratified, we continue to operate under the terms of the expired agreement, and, once signed, the new agreement is retroactive to the previous expiration date.
As we renew bargaining agreements, labor negotiations may not conclude successfully and, in that case, may result in a significant increase in the cost of labor or may break down and result in work stoppages or labor disturbances, disrupting our operations. Any such cost increases, stoppages or disturbances could materially and adversely affect our business, financial condition, results of operations and cash flows by limiting plant production, sales volumes and profitability.
Our operations have been and will continue to be exposed to various business and other risks, changes in conditions and events beyond our control in foreign countries.
We have production activities outside the United States via our bauxite mining operations in St. Ann, Jamaica. We are, and will continue to be, subject to financial, political, economic and business risks in connection with our non-U.S. operations. These risks include those associated with political or financial instability, expropriation, renegotiation or nullification of existing agreements, and changes in local government laws, regulations and policies, including those related to taxation, employment regulations and repatriation of earnings. While the impact of these factors is difficult to predict and beyond our control, any one or more of them could adversely affect our business, financial condition or operating results. In addition to the business risks inherent in operating outside the United States, economic conditions may be more volatile, legal and regulatory systems less developed and predictable and the possibility of various types of adverse governmental action more pronounced.
18
Table of Contents
In addition, our revenues, expenses, cash flows and results of operations could be affected by actions in foreign countries that more generally affect the global market for primary aluminum, including inflation, fluctuations in currency and interest rates, competitive factors, civil unrest and labor problems. Our operations and the commercial markets for our products could also be materially and adversely affected by acts of war, terrorism or the threat of any of these events as well as government actions such as controls on imports, exports and prices, tariffs, new forms of taxation or changes in fiscal regimes and increased government regulation in countries engaged in the manufacture or consumption of aluminum products. Unexpected or uncontrollable events or circumstances in any of these markets could materially and adversely affect our business, financial condition, results of operations or cash flows.
The loss of certain members of our management may have an adverse effect on our operating results.
Our success will depend, in part, on the efforts of our senior management and other key employees. These individuals possess sales, marketing, engineering, manufacturing, financial and administrative skills that are critical to the operation of our business. If we lose or suffer an extended interruption in the services of one or more of our senior officers, our business, financial condition, results of operations and cash flows may be materially and adversely affected. Moreover, the market for qualified individuals may be highly competitive and we may not be able to attract and retain qualified personnel to replace or succeed members of our senior management or other key employees, should the need arise.
Past and future acquisitions or divestitures may adversely affect our financial condition.
We have grown partly through the acquisition of other businesses, including the transaction whereby we became sole owner of Gramercy and St. Ann during 2009. As part of our strategy, we may continue to pursue acquisitions, divestitures or strategic alliances, which may not be completed or, if completed, may not be ultimately beneficial to us. There are numerous risks commonly encountered in business combinations, including the risk that we may not be able to complete a transaction that has been announced, effectively integrate businesses acquired or generate the cost savings and synergies anticipated. Failure to do so could materially and adversely affect our business, financial condition, results of operations and cash flows.
The insurance that we maintain may not fully cover all potential exposures.
We maintain property, casualty and workers’ compensation insurance, but such insurance does not cover all risks associated with the hazards of our business and is subject to limitations, including deductibles and maximum liabilities covered. We may incur losses beyond the limits, or outside the coverage, of our insurance policies, including liabilities for environmental compliance or remediation. In addition, from time to time, various types of insurance for companies in our industries have not been available on commercially acceptable terms or, in some cases, have not been available at all. In the future, we may not be able to obtain coverage at current levels, and our premiums may increase significantly on coverage that we maintain. In addition, the outage at our New Madrid smelter could have an impact on our ability in the future to obtain insurance at similar levels and costs, which could materially and adversely affect our business, financial conditions, results of operations and cash flows.
Future changes to healthcare legislation could materially affect our business, financial condition, results of operations and cash flows.
The 2011 changes required by Health Care Reform that will impact our healthcare plans include the following: (i) dependents up to age 26 can be covered under the health plans, (ii) lifetime dollar limits are removed on essential health benefits, and (iii) pre-existing condition exclusions are removed for individuals under age 19. While we currently judge that the changes required by the Health Care Reform will not have a material impact on our costs in 2011, future revisions and clarifications to the legislation could materially and adversely affect our business, financial condition, results of operation and cash flows.
Apollo controls us and its interests may conflict with or differ from your interests.
Our equity sponsor, Apollo, beneficially owns approximately 64.2% of our common stock. As a result, Apollo has the power to elect all of our directors. Therefore, Apollo effectively has the ability to prevent any transaction that requires the approval of our Board of Directors or our stockholders, including the approval of significant corporate transactions such as mergers and the sale of substantially all of our assets. In addition, following a reduction of the equity owned by Apollo to below 50% of our outstanding common stock, Apollo will retain the right to cause the Board of Directors to nominate a number of Apollo designees for the Board of Directors. Thus, Apollo will continue to be able to significantly influence or effectively control our decisions.
The interests of Apollo could conflict with or differ from stockholder interests. For example, the concentration of ownership held by Apollo could delay, defer or prevent a change of control of Noranda or impede a merger, takeover or other business combination that stockholders or debtholders may otherwise view favorably. If we encounter financial difficulties or are unable to pay our debts as they mature, Apollo may have an interest in pursuing acquisitions, divestitures, financings or other transactions that in their judgment could enhance their equity investment, even though these transactions might involve risk to our shareholders or debt holders. Additionally Apollo is in the business of making or advising on investments in companies and holds, and may from time to time in the future acquire interests in or provide advice to businesses that directly or indirectly compete with certain portions of our business or are suppliers or customers of ours. Apollo may also pursue acquisitions that may be complementary to our business, and,
19
Table of Contents
as a result, those acquisition opportunities may not be available to us. A sale of a substantial number of shares of stock in the future by funds affiliated with Apollo could cause our stock price to decline.
Risks Related to our Indebtedness
We have indebtedness, which could adversely affect our ability to raise additional capital to fund our operations, limit our ability to react to changes in the economy or our industry and prevent us from servicing our debt.
As of December 31, 2010, our total indebtedness was $419.7 million. Based on the amount of indebtedness outstanding and interest rates at December 31, 2010, our annualized cash interest expense would be approximately $16.7 million, all of which represents interest expense on floating-rate obligations (and thus is subject to increase in the event interest rates were to rise), prior to any consideration of the impact of interest rate swaps. We issued additional indebtedness as payment for our interest due May 15, 2010 and November 15, 2010. Further, we have notified the trustee for bondholders of the AcquisitionCo Notes of our election to pay the May 15, 2011 interest payments estimated to be approximately $8.9 million by issuing additional indebtedness. For any period subsequent to May 15, 2011, Noranda AcquisitionCo must pay all interest in cash. Our subsidiaries’ ability to generate sufficient cash flow from operations to make scheduled payments on their and our debt depends on a range of economic, competitive and business factors, many of which are outside their and our control. Our subsidiaries’ inability to generate cash flow sufficient to satisfy their and our debt obligations, or to refinance their and our obligations on commercially reasonable terms, could materially and adversely affect our business, financial condition, results of operations or cash flows and could require us and our subsidiaries to do one or more of the following:
| • | raise additional capital through debt or equity issuances or both; |
| • | cancel or scale back current and future business initiatives; or |
| • | sell businesses or properties. |
Our and our subsidiaries’ indebtedness could have important consequences, including:
| • | making it more difficult for us to satisfy our obligations under our indebtedness; |
| • | limiting our ability to borrow money for our working capital, capital expenditures, debt service requirements or other corporate purposes; |
| • | requiring our subsidiaries to dedicate a portion of their cash flow to payments on their and our indebtedness, which will reduce the amount of cash flow available for working capital, capital expenditures, product development and other corporate requirements; |
| • | increasing our vulnerability to general economic and industry conditions; |
| • | placing us at a competitive disadvantage to our less leveraged competitors; |
| • | limiting our ability to respond to business opportunities; and |
| • | subjecting us and our subsidiaries to restrictive covenants, which, if we and our subsidiaries fail to comply with, could result in an event of default under their and our debt which, if not cured or waived, could materially and adversely affect our business, financial condition, results of operations and cash flows. |
Restrictive covenants under the indenture governing our AcquisitionCo Notes and our senior secured credit facilities may adversely affect our operational flexibility.
The indenture governing the AcquisitionCo Notes and our senior secured credit facilities contain, and any future indebtedness we incur may contain, a number of restrictive covenants that could impose significant operating and financial restrictions on us and our subsidiaries, including restrictions on our and our subsidiaries’ ability to, among other things:
| • | incur or guarantee additional debt; |
| • | pay dividends or make distributions to our stockholders; |
| • | repurchase or redeem capital stock; |
| • | make loans, capital expenditures, acquisitions or investments; |
| • | sell assets including stock of subsidiaries; |
| • | create or incur liens; |
| • | merge or consolidate with other companies or transfer all or substantially all of our assets; |
| • | enter into transactions with our affiliates; and |
20
Table of Contents
| • | engage in certain business activities. |
As a result of these covenants, we are limited in the manner in which we conduct our business, and we may be unable to engage in favorable business activities or finance future operations or capital needs.
A failure to comply with the covenants contained in our senior secured credit facilities, the indenture governing the AcquisitionCo Notes or any future indebtedness could result in an event of default under the senior secured credit facilities, the indenture governing the AcquisitionCo Notes or such future indebtedness, which, if not cured or waived, could materially and adversely affect our business, financial condition, results of operations and cash flows. The events of default contained in our existing indebtedness are customary for senior secured credit facilities and indentures of companies similar to the Company. Certain of such events of default-generally, defaults based on volitional acts that violate prohibitions on our taking certain actions such as incurring debt or paying dividends beyond permitted amounts are not subject to notice or cure periods. In the event of any default under the senior secured credit facilities, the indenture governing the AcquisitionCo Notes or any future indebtedness, our and our subsidiaries’ debt holders and lenders:
| • | will not be required to lend any additional amounts to us and our subsidiaries; |
| • | could elect to declare all borrowings outstanding, together with accrued and unpaid interest and fees, to be due and payable; |
| • | may have the ability to require us to apply all of our available cash to repay these borrowings; or |
| • | may prevent us and our subsidiaries from making debt service payments under our and our subsidiaries’ other agreements, any of which could result in an event of default under such agreements. |
See “Description of Certain Indebtedness.”
Despite our indebtedness, we and our subsidiaries may still be able to incur significantly more debt. This could increase the risks associated with our leverage, including our ability to service our indebtedness.
The indenture governing the AcquisitionCo Notes and our senior secured credit facilities contain restrictions on our and our subsidiaries’ ability to incur additional indebtedness. These restrictions are subject to a number of important qualifications and exceptions, and the indebtedness incurred in compliance with these restrictions could be substantial. Accordingly, we and our subsidiaries could incur significant additional indebtedness in the future, much of which could constitute secured or senior indebtedness. The more leveraged we and our subsidiaries become, the more we and our subsidiaries, and in turn our securityholders, become exposed to the risks described above under the heading “We have indebtedness, which could adversely affect our ability to raise additional capital to fund our operations, limit our ability to react to changes in the economy or our industry and prevent us from servicing our debt.”
Our variable-rate indebtedness subjects us to interest rate risk, which could cause our annual debt service obligations to increase significantly.
Substantially all of our and our subsidiaries’ indebtedness, including the AcquisitionCo Notes and borrowings under the senior secured credit facilities, are subject to variable rates of interest and expose us to interest rate risk. See “Description of Certain Indebtedness.” If interest rates increase, our debt service obligations on the variable rate indebtedness would increase, resulting in a reduction of our net income, even though the amount borrowed remained the same. As of December 31, 2010, our outstanding indebtedness was $419.7 million. Based on this amount of indebtedness, if interest rates remained at December 31, 2010 levels, our annualized cash interest expense would be approximately $16.7 million, all of which represents interest expense on floating-rate obligations (and thus is subject to increase in the event interest rates rise), prior to any consideration of the impact of interest rate swaps. A 1% increase in the interest rates would increase our annual interest expense by $4.2 million, prior to any consideration of the impact of interest rate swaps.
| ITEM 1B. | UNRESOLVED STAFF COMMENTS |
Not applicable.
| ITEM 2. | PROPERTIES |
Our upstream business is a vertically integrated producer of primary aluminum, consisting of an aluminum smelter in New Madrid, Missouri, bauxite mining operations in St. Ann, Jamaica and an alumina refinery in Gramercy, Louisiana.
Our downstream business is a manufacturer of aluminum foil and light sheet. We own and operate four rolling mills facilities located in the southeastern United States, two in Huntingdon, Tennessee, and one each in Salisbury, North Carolina and Newport, Arkansas, with a combined maximum annual production capacity of 410 to 495 million pounds, depending on product-mix.
Our corporate headquarters are located in Franklin, Tennessee and consist of leased office space aggregating approximately 30,000 square feet.
21
Table of Contents
For additional information about the location and productive capacity of our facilities see Item 1, “Business.”
| ITEM 3. | LEGAL PROCEEDINGS |
From time to time, we are involved in a variety of claims, lawsuits and other disputes arising in the ordinary course of business. We believe the resolution of these matters and the incurrence of their related costs and expenses should not have a material adverse effect on our consolidated financial position, results of operations or liquidity. While it is not feasible to predict the outcome of all pending suits and claims, the ultimate resolution of these matters as well as future lawsuits could have a material adverse effect on our business, financial condition, results of operations or reputation.
| ITEM 4. | (REMOVED AND RESERVED) |
22
Table of Contents
| ITEM 5. | MARKET FOR REGISTRANT’S COMMON EQUITY, RELATED STOCKHOLDER MATTERS AND ISSUER PURCHASES OF EQUITY SECURITIES |
Market Information and Holders
Our common stock began trading on the New York Stock Exchange under the symbol “NOR” following our initial public offering in May 2010. Before then, there was no public market for our common stock. The following table sets forth, for the periods indicated, the high and low sales prices of our common stock as reported by the New York Stock Exchange:
| High | Low | |||||||
| Second quarter 2010 |
$ | 9.35 | $ | 6.33 | ||||
| Third quarter 2010 |
$ | 8.59 | $ | 5.87 | ||||
| Fourth quarter 2010 |
$ | 14.70 | $ | 8.14 | ||||
As of February 28, 2011, we had approximately 167 holders of record of our common stock. Investment funds associated with Apollo beneficially own approximately 64.2% of our capital stock.
Dividends
The payment of any cash dividend on our common stock is considered a restricted payment under our credit facilities and the indentures governing our Notes, and we are restricted from paying any cash dividend on our common stock unless we satisfy certain conditions, including satisfying certain financial thresholds and the absence of any event of default. As of December 31, 2009, because we did not meet required performance ratios contained in the credit agreement governing our senior secured credit facilities and the indentures governing our Notes, our ability to pay dividends was restricted. At December 31, 2010, we meet all required performance ratios contained in the indentures.
Our Board of Directors declared and we paid a $102.2 million cash dividend ($2.35 per share) in June 2008.
Use of Proceeds
Initial Public Offering. On May 13, 2010, our registration statement (File No. 333-150760) was declared effective for our initial public offering, pursuant to which we registered the offering and sale of 11.5 million shares of common stock (including the underwriters’ right to purchase up to an additional 1.5 million shares to cover over-allotments) at a public offering price of $8.00 per share. We completed our IPO on May 19, 2010. Aggregate gross offering proceeds were $92.0 million. The representatives for the underwriters were Merrill Lynch, Pierce, Fenner and Smith Incorporated; Morgan Stanley and Co., Incorporated; Credit Suisse Securities (USA) LLC; Goldman, Sachs and Co; and UBS Securities LLC.
The net proceeds from the offering, after underwriting discounts and commission of $5.6 million, and additional offering-related fees and expenses of $3.5 million, were $82.9 million. We used the net proceeds, together with $95.9 million of proceeds from settling all our outstanding fixed price aluminum hedges, to repurchase all outstanding Holdco Notes, of which $66.3 million was remaining, and to repay $110.0 million principal amount outstanding under the term B loan. The remaining $2.5 million was used for general corporate purposes.
Follow-on Offering. On December 6, 2010, our registration statement (File No. 333-170620) was declared effective for our follow-on public offering, pursuant to which we registered the offering and sale of 11.5 million shares of common stock (including the underwriters’ right to purchase up to an additional 1.5 million shares to cover over-allotments) at a public offering price of $11.35 per share. We completed the follow-on offering on December 10, 2010 and the over-allotment on December 22, 2010. Aggregate gross offering proceeds were $130.5 million. The representatives for the underwriters were Merrill Lynch, Pierce, Fenner & Smith Incorporated; Morgan Stanley and Co., Incorporated; Citigroup Global Markets, Inc.; Credit Suisse Securities (USA) LLC; Goldman, Sachs & Co; and UBS Securities LLC.
The net proceeds from the offering, after underwriting discounts and commission of $5.9 million, and additional offering-related fees and expenses of $1.6 million, were $123.1 million. We used the net proceeds to repay $122.3 million principal amount outstanding under the term B loan. The remaining $0.8 million was used for general corporate purposes.
Securities Authorized for Issuance Under Equity Compensation Plans
See Part III – Item 12, “Security Ownership of Certain Beneficial Owners and Management and Related Stockholder Matters – Equity Compensation Plan Information.”
23
Table of Contents
Stock Performance Graph
The following graph compares the cumulative total stockholder return on our common stock from May 14, 2010 (the date of our IPO) to December 31, 2010 (the company’s fiscal year-end) with the cumulative total returns of the Russell 2000 Index and the S&P 600 SmallCap Materials Index over the same period. The comparison assumes $100 was invested on May 14, 2010, in shares of our common stock and in each of the indices shown and assumes that all of the dividends were reinvested. The historical stock price performance shown on this graph is not necessarily indicative of future performance.
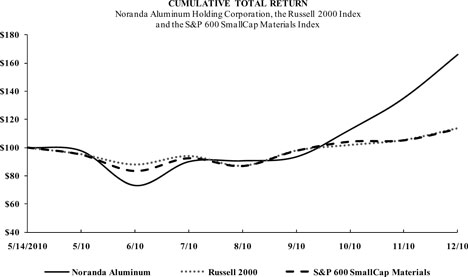
| May 14, 2010 |
May 2010 |
June 2010 |
July 2010 |
August 2010 |
September 2010 |
October 2010 |
November 2010 |
December 2010 |
||||||||||||||||||||||||||||
| Noranda Aluminum |
100.00 | 97.61 | 73.07 | 90.00 | 90.57 | 93.41 | 112.73 | 135.11 | 165.91 | |||||||||||||||||||||||||||
| Russell 2000 |
100.00 | 95.38 | 87.99 | 94.04 | 87.08 | 97.92 | 101.93 | 105.47 | 113.84 | |||||||||||||||||||||||||||
| S&P 600 SmallCap Materials |
100.00 | 95.02 | 83.50 | 92.46 | 86.96 | 97.67 | 104.13 | 105.06 | 113.09 | |||||||||||||||||||||||||||
Source: Research Data Group, Inc.
This performance graph shall not be deemed “filed” for purposes of Section 18 of the Securities Exchange Act of 1934, as amended (the “Exchange Act”) or otherwise subject to the liabilities under that Section and shall not be deemed to be incorporated by reference into any filing of Noranda Aluminum Holding Corporation under the Securities Act of 1933, as amended, or the Exchange Act.
24
Table of Contents
| ITEM 6. | SELECTED FINANCIAL DATA |
Selected Historical Consolidated Financial Data
The following tables present our selected historical consolidated financial data. This information should be read in conjunction with the sections entitled “Management’s Discussion and Analysis of Financial Condition and Results of Operations” and with the audited consolidated financial statements of Noranda Aluminum Holding Corporation and their notes included elsewhere in this report, as well as the other financial information included herein.
Noranda HoldCo, Noranda AcquisitionCo and Noranda Intermediate Holding Corporation did not engage in any business or other activities prior to the Apollo Acquisition except in connection with their formation, the Apollo Transactions and the Special Dividend. The Apollo Transactions means collectively the Apollo Acquisition and related financings. Special Dividend means the June 2007 dividend of $216.1 million paid to Noranda stockholders, along with the related financing. Accordingly, all financial and other information herein relating to periods prior to the completion of the Apollo Transactions and the Special Dividend is that of Noranda Aluminum, Inc.
The financial information for the period from January 1, 2006 to August 15, 2006 includes the results of operations, cash flows and financial condition for Noranda Aluminum, Inc. on a basis reflecting the historical values of Noranda Aluminum, Inc. prior to the August 15, 2006 acquisition by which Noranda Aluminum, Inc. became Xstrata’s wholly owned subsidiary (the “Xstrata Acquisition,”) and is referred to as “Pre-predecessor.” The financial information for the periods from August 16, 2006 to December 31, 2006 and from January 1, 2007 to May 17, 2007, and as of December 31, 2006 includes the results of operations, cash flows and financial condition for Noranda Aluminum, Inc. on a basis reflecting the stepped-up values of Noranda Aluminum, Inc. prior to the Apollo Acquisition, but subsequent to the Xstrata Acquisition, and is referred to as “Predecessor.” The financial information for the period from May 18, 2007 to December 31, 2007, as of December 31, 2007, and as of and for the years ended December 31, 2008, 2009 and 2010 includes the results of operations, cash flows and financial condition for Noranda HoldCo on a basis reflecting the impact of the purchase allocation of the Apollo Acquisition, and is referred to as “Successor.”
The consolidated statements of operations and cash flow data for the years ended December 31, 2008, 2009 and 2010 and the consolidated balance sheet data as of December 31, 2009 and 2010 have been derived from our consolidated financial statements included elsewhere in this report. Other prior period operations data, cash flow data and balance sheet data have been derived from our consolidated financial statements which are not included in this report.
The unaudited supplemental pro forma condensed consolidated statements of operations for the years ended December 31, 2006 and 2007 are based on the historical consolidated statements of operations for the Pre-predecessor period from January 1, 2006 to August 15, 2006 and the Predecessor periods from August 16, 2006 to December 31, 2006 and from January 1, 2007 to May 17, 2007 and the Successor period from May 18, 2007 to December 31, 2007 and give effect to the Apollo Transactions and Special Dividend as if they had occurred on January 1, 2006.
The following information should be read in conjunction with, and is qualified by reference to, our “Management’s Discussion and Analysis of Financial Condition and Results of Operations,” our consolidated financial statements and the notes included elsewhere in this report, as well as the other financial information included in this report.
25
Table of Contents
| Pro
forma pre-predecessor and predecessor(1) |
Pro forma predecessor and successor(1) |
Successor | ||||||||||||||||||
| (in millions, except per share data and where noted) |
Year ended and as of December 31, 2006 |
Year ended and as of December 31, 2007 |
Year ended and as of December 31, 2008 |
Year ended and as of December 31, 2009(2) |
Year ended and as of December 31, 2010 |
|||||||||||||||
| Statements of operations data: |
||||||||||||||||||||
| Sales |
$ | 1,312.7 | $ | 1,395.1 | $ | 1,266.4 | $ | 769.9 | $ | 1,294.9 | ||||||||||
| Operating costs and expenses: |
||||||||||||||||||||
| Cost of sales |
1,133.8 | 1,205.3 | 1,122.7 | 779.9 | 1,113.4 | |||||||||||||||
| Selling, general and administrative expenses |
40.1 | 56.5 | 73.8 | 75.6 | 114.0 | |||||||||||||||
| Goodwill and other intangible asset impairment |
— | — | 25.5 | 108.0 | — | |||||||||||||||
| Excess insurance proceeds |
— | — | — | (43.5 | ) | — | ||||||||||||||
| Other (recoveries) charges, net |
(0.6 | ) | (0.5 | ) | — | — | — | |||||||||||||
| 1,173.3 | 1,261.3 | 1,222.0 | 920.0 | 1,227.4 | ||||||||||||||||
| Operating income (loss): |
139.4 | 133.8 | 44.4 | (150.1 | ) | 67.5 | ||||||||||||||
| Other (income) expenses: |
||||||||||||||||||||
| Interest expense, net |
112.7 | 106.8 | 88.0 | 53.5 | 31.1 | |||||||||||||||
| (Gain) loss on hedging activities, net |
22.0 | 44.1 | 69.9 | (111.8 | ) | (65.6 | ) | |||||||||||||
| Equity in net (income) loss of investments in affiliates |
(9.2 | ) | (11.5 | ) | (7.7 | ) | 79.7 | — | ||||||||||||
| (Gain) loss on debt repurchases |
— | 2.2 | 1.2 | (211.2 | ) | 0.1 | ||||||||||||||
| Gain on business combination |
— | — | — | (120.3 | ) | — | ||||||||||||||
| Income (loss) before income taxes |
13.9 | (7.8 | ) | (107.0 | ) | 160.0 | 101.9 | |||||||||||||
| Income tax expense (benefit) |
0.8 | 1.7 | (32.9 | ) | 58.6 | 35.0 | ||||||||||||||
| Net income (loss) for the period |
$ | 13.1 | $ | (9.5 | ) | $ | (74.1 | ) | $ | 101.4 | $ | 66.9 | ||||||||
| Net income (loss) per common share: |
||||||||||||||||||||
| Basic |
$ | 0.31 | $ | (0.22 | ) | $ | (1.70 | ) | $ | 2.33 | $ | 1.30 | ||||||||
| Diluted |
$ | 0.31 | $ | (0.22 | ) | $ | (1.70 | ) | $ | 2.33 | $ | 1.27 | ||||||||
| Weighted-average common shares outstanding: |
||||||||||||||||||||
| Basic |
42.84 | 43.07 | 43.44 | 43.53 | 51.56 | |||||||||||||||
| Diluted |
42.84 | 43.07 | 43.44 | 43.53 | 52.80 | |||||||||||||||
| Cash dividends declared per common share |
— | $ | 5.00 | $ | 2.35 | — | — | |||||||||||||
| Balance sheet data(4) : |
||||||||||||||||||||
| Cash and cash equivalents |
$ | 40.5 | $ | 75.6 | $ | 184.7 | $ | 167.2 | $ | 33.8 | ||||||||||
| Property, plant and equipment, net |
672.8 | 657.8 | 599.6 | 745.5 | 719.9 | |||||||||||||||
| Total assets |
1,616.7 | 1,650.5 | 1,936.2 | 1,697.6 | 1,414.7 | |||||||||||||||
| Long-term debt (including current portion)(5) |
160.0 | 1,151.7 | 1,346.6 | 951.7 | 419.7 | |||||||||||||||
| Common stock subject to redemption |
— | — | 2.0 | 2.0 | 2.0 | |||||||||||||||
| Shareholders’ equity (deficiency) |
1,008.5 | (0.1 | ) | 36.6 | 92.2 | 295.7 | ||||||||||||||
| Working capital(6) |
201.7 | 211.5 | 336.0 | 387.9 | 171.5 | |||||||||||||||
| Cash flow data: |
||||||||||||||||||||
| Operating activities |
— | — | $ | 65.5 | $ | 220.5 | $ | 270.9 | ||||||||||||
| Investing activities |
— | — | (51.1 | ) | (24.0 | ) | (61.1 | ) | ||||||||||||
| Financing activities |
— | — | 94.7 | (214.0 | ) | (343.2 | ) | |||||||||||||
| Financial and other data: |
||||||||||||||||||||
| EBITDA(7) |
— | — | $ | 79.3 | $ | 306.9 | $ | 231.7 | ||||||||||||
| Average realized Midwest Transaction Price (per pound)(8) |
$ | 1.20 | $ | 1.23 | $ | 1.21 | $ | 0.81 | $ | 1.04 | ||||||||||
| Net cash cost for primary aluminum (per pound shipped)(11) |
$ | 0.82 | $ | 0.77 | $ | 0.70 | ||||||||||||||
| Shipments: |
||||||||||||||||||||
| Third party shipments: |
||||||||||||||||||||
| Bauxite (kMts)(9) |
— | — | — | 482.9 | 1,738.0 | |||||||||||||||
| Alumina (kMts)(9) |
— | — | — | 245.0 | 683.6 | |||||||||||||||
| Primary aluminum products (pounds, in millions) |
496.5 | 523.4 | 509.5 | 291.4 | 438.8 | |||||||||||||||
| Flat rolled products (pounds, in millions) |
409.3 | 371.6 | (10) | 346.1 | 309.3 | 346.4 | ||||||||||||||
| Intersegment shipments: |
||||||||||||||||||||
| Bauxite (kMts) |
— | — | — | 835.1 | 2,565.5 | |||||||||||||||
| Alumina (kMts) |
— | — | — | 116.5 | 467.4 | |||||||||||||||
| Primary aluminum products (pounds, in millions) |
58.5 | 31.2 | 80.4 | 60.2 | 121.7 | |||||||||||||||
See accompanying notes to this table
26
Table of Contents
| Pre-predecessor | Predecessor | Successor | ||||||||||||||
| (in millions, except per share data and where noted) |
Period
from January 1, 2006 to August 15, 2006 |
Period
from August 16, 2006 to December 31, 2006 and as of December 31, 2006 |
Period
from January 1, 2007 to May 17, 2007 |
Period
from May 18, 2007 to December 31, 2007 and as of December 31, 2007 |
||||||||||||
| Statements of operations data: |
||||||||||||||||
| Sales |
$ | 816.0 | $ | 496.7 | $ | 527.7 | $ | 867.4 | ||||||||
| Operating costs and expenses |
||||||||||||||||
| Cost of sales |
660.6 | 409.0 | 424.5 | 768.0 | ||||||||||||
| Selling, general and administrative expenses |
23.9 | 14.0 | 16.8 | 39.2 | ||||||||||||
| Other (recoveries) charges, net |
(0.1 | ) | (0.5 | ) | — | (0.5 | ) | |||||||||
| 684.4 | 422.5 | 441.3 | 806.7 | |||||||||||||
| Operating income |
131.6 | 74.2 | 86.4 | 60.7 | ||||||||||||
| Other expenses (income) |
||||||||||||||||
| Interest expense net |
12.7 | 6.4 | 6.2 | 65.0 | ||||||||||||
| (Gain) loss on hedging activities, net |
16.6 | 5.4 | 56.6 | (12.5 | ) | |||||||||||
| Equity in net income of investments in affiliates |
(8.3 | ) | (3.2 | ) | (4.3 | ) | (7.3 | ) | ||||||||
| Loss on debt repurchase |
— | — | — | 2.2 | ||||||||||||
| Income before income taxes |
110.6 | 65.6 | 27.9 | 13.3 | ||||||||||||
| Income tax expense |
38.7 | 23.6 | 13.6 | 5.1 | ||||||||||||
| Net income for the period |
$ | 71.9 | $ | 42.0 | $ | 14.3 | $ | 8.2 | ||||||||
| Net income per common share:(3) |
||||||||||||||||
| Basic |
— | — | — | $ | 0.19 | |||||||||||
| Diluted |
— | — | — | $ | 0.19 | |||||||||||
| Weighted-average common shares outstanding: |
||||||||||||||||
| Basic |
— | — | — | 43.21 | ||||||||||||
| Diluted |
— | — | — | 43.33 | ||||||||||||
| Cash dividends declared per common share |
$ | 5.00 | ||||||||||||||
| Balance sheet data (4): |
||||||||||||||||
| Cash and cash equivalents |
— | $ | 40.5 | — | $ | 75.6 | ||||||||||
| Property, plant and equipment, net |
— | 672.8 | — | 657.8 | ||||||||||||
| Total assets |
— | 1,616.7 | — | 1,650.5 | ||||||||||||
| Long-term debt (including current portion)(5) |
— | 160.0 | — | 1,151.7 | ||||||||||||
| Shareholders’ equity (deficiency) |
— | 1,008.5 | — | (0.1 | ) | |||||||||||
| Working capital(6) |
— | 201.7 | — | 211.5 | ||||||||||||
| Cash flow data: |
||||||||||||||||
| Operating activities |
$ | 81.9 | $ | 107.8 | $ | 41.2 | $ | 160.8 | ||||||||
| Investing activities |
(20.5 | ) | (31.8 | ) | 5.1 | (1,197.7 | ) | |||||||||
| Financing activities |
(37.7 | ) | (60.5 | ) | (83.7 | ) | 1,112.5 | |||||||||
| Financial and other data: |
||||||||||||||||
| Average realized Midwest Transaction Price (per pound)(8) |
$ | 1.19 | $ | 1.20 | $ | 1.31 | $ | 1.21 | ||||||||
| Shipments: |
||||||||||||||||
| Third party shipments: |
||||||||||||||||
| Primary aluminum products (pounds, in millions) |
308.8 | 187.7 | 202.3 | 321.1 | ||||||||||||
| Flat rolled products (pounds, in millions) |
259.1 | 150.2 | 135.6 | (10) | 236.0 | (10) | ||||||||||
| Intersegment shipments: |
||||||||||||||||
| Primary aluminum products (pounds in millions) |
36.3 | 22.2 | 12.1 | 19.1 | ||||||||||||
See accompanying notes to this table
27
Table of Contents
| (1) | Pro forma financial data is presented. See table on following page for historical financial data. For a reconciliation of the pro forma financial data to the historical data, see “Unaudited Supplemental Pro Forma Condensed Consolidated statements of Operations.” |
| (2) | See Item 7, “Management’s Discussion and Analysis of Financial Condition and Results of Operations — Company Overview — Joint Venture Transaction” for a summary of the Joint Venture Transaction which closed on August 31, 2009. |
| (3) | Net income (loss) per common share is not presented for the Pre-predecessor and Predecessor historical periods because Noranda was a wholly owned subsidiary during those periods. |
| (4) | Historical balance sheet data is presented. |
| (5) | Long-term debt includes long-term debt due to related parties and to third parties, including current installments of long-term debt, but does not include issued and undrawn letters of credit under the revolving credit facility. |
| (6) | Working capital is defined as current assets net of current liabilities. |
| (7) | EBITDA represents net income (loss) before income taxes, net interest expense and depreciation and amortization. We have provided EBITDA herein because we believe it provides investors with additional information to measure our performance. We use EBITDA as one criterion for evaluating our performance relative to our peers. We believe that EBITDA is an operating performance measure, and not a liquidity measure, that provides investors and analysts with a measure of operating results unaffected by differences in capital structures, capital investment cycles and ages of related assets among otherwise comparable companies. |
EBITDA is not a measure of financial performance under U.S. GAAP and may not be comparable to similarly titled measures used by other companies in our industry. EBITDA should not be considered in isolation from or as an alternative to net income, operating income (loss) or any other performance measures derived in accordance with U.S. GAAP.
For example, EBITDA excludes certain tax payments that may represent a reduction in cash available to us; does not reflect any cash requirements for the assets being depreciated and amortized that may have to be replaced in the future; does not reflect capital cash expenditures, future requirements for capital expenditures or contractual commitments; does not reflect changes in, or cash requirements for, our working capital needs; and does not reflect the significant interest expense, or the cash requirements necessary to service interest or principal payments, on our indebtedness. The following table reconciles net income (loss) to EBITDA for the periods presented (in millions):
| Year ended December 31, | ||||||||||||
| 2008 | 2009 | 2010 | ||||||||||
| $ | $ | $ | ||||||||||
| Net income (loss) |
(74.1 | ) | 101.4 | 66.9 | ||||||||
| Income tax expense (benefit) |
(32.9 | ) | 58.6 | 35.0 | ||||||||
| Interest expense, net |
88.0 | 53.5 | 31.1 | |||||||||
| Depreciation and amortization |
98.3 | 93.4 | 98.7 | |||||||||
| EBITDA |
79.3 | 306.9 | 231.7 | |||||||||
| (8) | The price for primary aluminum consists of two components: the price quoted for primary aluminum ingot on the LME and the Midwest transaction premium, a premium to LME price reflecting domestic market dynamics as well as the cost of shipping and warehousing, the sum of which is known as the Midwest Transaction Price. As a majority of our value-added products are sold at the prior month’s MWTP, we calculate a “realized” MWTP which reflects the specific pricing of sale transactions in each period. |
| (9) | External alumina and bauxite shipments are recorded subsequent to the August 31, 2009 Joint Venture Transaction. Additionally, from time-to-time, the New Madrid smelter sells excess alumina. Alumina and bauxite are exchanged and priced in metric tonnes. One metric tonne represents 2,204.6 pounds. For the year ended December 31, 2009, our sales included 540.1 million pounds of alumina sold to third parties, and 1.1 billion pounds of bauxite sold to third parties. |
| (10) | For purposes of comparability to other periods, brokered metal sales are excluded from pounds shipped in the flat rolled products segment because the related metal was sold without fabrication premiums. Brokered metal sales excluded were $8.1 million for the period from January 1, 2007 to May 17, 2007, and $43.2 million for the period from May 18, 2007 to December 31, 2007. |
| (11) | Unit net cash cost for primary aluminum per pound represents our costs of producing commodity grade aluminum net of value-added and Midwest premiums on primary aluminum sales, and alumina and bauxite sales to external customers. We have provided unit net cash cost per pound of aluminum shipped because we believe it provides investors with additional information to measure our operating performance. Using this metric, investors are able to assess the prevailing LME price plus Midwest premium per pound versus our unit net costs per pound shipped. Unit net cash cost per pound is positively or negatively impacted by changes in primary aluminum, alumina and bauxite production and sales volumes, natural gas and oil related costs, seasonality in our electrical contract rates, and increases or decreases in other production related costs. Unit net cash costs is not a measure of financial performance under U.S. GAAP and may not be comparable to similarly titled measures used by other companies in our industry and should not be considered in isolation from or as an alternative to any performance measures derived in accordance with U.S. GAAP. |
| Year ended December 31, | ||||||||||||
| 2008 | 2009 | 2010 | ||||||||||
| Total primary aluminum cash cost (in millions) (a) |
$ | 482.5 | $ | 271.6 | $ | 391.2 | ||||||
| Total shipments (pounds in millions) |
589.9 | 351.6 | 560.5 | |||||||||
| Net primary aluminum cash cost per pound of primary aluminum(b) |
$ | 0.82 | $ | 0.77 | $ | 0.70 | ||||||
| (a) | Total primary aluminum cash cost is calculated below (in millions): |
| Total primary aluminum revenue |
$ | 758.5 | $ | 340.3 | $ | 621.3 | ||||||
| Less fabrication premiums and other revenue |
(45.9 | ) | (55.8 | ) | (37.1 | ) | ||||||
| Realized Midwest transaction price revenue |
712.6 | 284.5 | 584.2 | |||||||||
| Primary aluminum products segment profit |
222.7 | 4.9 | 112.2 | |||||||||
| Alumina refining segment profit (loss) |
— | (2.3 | ) | 61.9 | ||||||||
| Bauxite segment profit |
— | 12.3 | 23.8 | |||||||||
| Profit eliminations |
7.4 | (2.0 | ) | (4.9 | ) | |||||||
| Total |
230.1 | 12.9 | 193.0 | |||||||||
| Total primary aluminum cash cost (in millions) |
$ | 482.5 | $ | 271.6 | $ | 391.2 | ||||||
| (b) | During 2009, we refined our cash cost calculation methodologies to reflect an adjusted EBITDA based calculation (see the “Covenant Compliance” section for a full description and reconciliation of adjusted EBITDA). As a result, 2008 figures may not tie to cash costs as presented in 2008 filings. |
28
Table of Contents
UNAUDITED SUPPLEMENTAL PRO FORMA CONDENSED CONSOLIDATED STATEMENTS OF OPERATIONS
FOR THE YEAR ENDED DECEMBER 31, 2006
(in millions, except per share data)
The following unaudited pro forma condensed consolidated statements of operations for the year ended December 31, 2006 is based on the historical consolidated statements of operations of the Pre-predecessor period from January 1, 2006 to August 15, 2006 and the predecessor period from August 16, 2006 to December 31, 2006, and gives effect to the Apollo Transactions and Special Dividend as if they had occurred on January 1, 2006.
| Pre-predecessor | Predecessor | Pro forma Noranda Aluminum Holding Corporation |
||||||||||||||
| Period
from January 1, 2006 to August 15, 2006(1) |
Period
from August 16, 2006 to December 31, 2006(1) |
Pro
forma adjustments |
Year
ended December 31, 2006 |
|||||||||||||
| $ | $ | $ | $ | |||||||||||||
| Sales |
816.0 | 496.7 | — | 1,312.7 | ||||||||||||
| Operating costs and expenses: |
||||||||||||||||
| Cost of sales |
660.6 | 409.0 | 64.2 | (2) | 1,133.8 | |||||||||||
| Selling, general and administrative expenses |
23.9 | 14.0 | 2.2 | (3) | 40.1 | |||||||||||
| Other (recoveries) charges, net |
(0.1 | ) | (0.5 | ) | — | (0.6 | ) | |||||||||
| 684.4 | 422.5 | 66.4 | 1,173.3 | |||||||||||||
| Operating income |
131.6 | 74.2 | (66.4 | ) | 139.4 | |||||||||||
| Other (income) expenses: |
||||||||||||||||
| Interest expense (income), net: |
||||||||||||||||
| Parent and related party |
12.6 | 7.1 | (19.7 | )(4) | — | |||||||||||
| Other |
0.1 | (0.7 | ) | 113.3 | (5) | 112.7 | ||||||||||
| Loss on hedging activities, net |
16.6 | 5.4 | — | 22.0 | ||||||||||||
| Equity in net (income) loss of investments in affiliates |
(8.3 | ) | (3.2 | ) | 2.3 | (6) | (9.2 | ) | ||||||||
| Total other expenses, net |
21.0 | 8.6 | 95.9 | 125.5 | ||||||||||||
| Income (loss) before income taxes |
110.6 | 65.6 | (162.3 | ) | 13.9 | |||||||||||
| Income tax expense (benefit) |
38.7 | 23.6 | (61.5 | )(7) | 0.8 | |||||||||||
| Net income (loss) |
71.9 | 42.0 | (100.8 | ) | 13.1 | |||||||||||
| Net income per common share: |
||||||||||||||||
| Basic |
0.31 | |||||||||||||||
| Diluted |
0.31 | |||||||||||||||
| Weighted-average common shares outstanding: |
||||||||||||||||
| Basic |
42.84 | |||||||||||||||
| Diluted |
42.84 | |||||||||||||||
| (1) | Represents the historical consolidated results of operations. |
| (2) | Reflects an increase of $49.7 million for the year ended December 31, 2006 of depreciation resulting from fair value adjustments to property, plant and equipment as a result of the Apollo Acquisition. The adjustment also reflects an increase of $14.5 million for the year ended December 31, 2006 resulting from the fair value adjustment to inventory as a result of the Apollo Acquisition. |
| (3) | Includes (i) the elimination of administrative expenses in GCA Lease Holdings, Inc. of $0.7 million, which was not acquired as part of the Apollo Acquisition; (ii) the elimination of certain pension expenses of $1.7 million primarily related to amortization of actuarial losses, transition obligations and prior service costs; (iii) an increase of $2.6 million of amortization resulting from fair value adjustments to amortizable intangible assets as a result of the Apollo Acquisition; and (iv) the addition of a management fee of $2.0 million that we are permitted to pay to Apollo for certain financial, strategic, advisory and consulting services under the terms of the indentures governing the Notes (See Item 13, “Certain Relationships and Related Transactions, and Director Independence–Apollo Management Agreement and Transaction Fee”). |
| (4) | Reflects the elimination of historical intercompany interest income and expenses, related to intercompany balances which were not acquired as part of the Apollo Acquisition. |
| (5) | Reflects the net effect of the increase in interest expense related to the additional indebtedness, incurred in the Apollo Transactions and the Special Dividend in the aggregate principal amount of $1,227.8 million, bearing interest at a weighted-average interest rate of 8.3%. The interest rates used for pro forma purposes are based on assumptions of the rates at the time of the acquisition. The adjustment assumes straight-line amortization of related deferred financing costs. A 0.125% change in the interest rates on our pro forma indebtedness would change our annual pro forma interest expense by $1.5 million. |
| (6) | Reflects an increase of amortization of excess of carrying value of investment over Noranda’s share of the investments’ underlying net assets resulting from the fair value adjustments to Noranda’s joint ventures as a result of the Apollo Acquisition. |
| (7) | Reflects the estimated tax effect of the pro forma adjustments at Noranda’s statutory tax rate. |
29
Table of Contents
UNAUDITED SUPPLEMENTAL PRO FORMA CONDENSED CONSOLIDATED STATEMENTS OF OPERATIONS
FOR THE YEAR ENDED DECEMBER 31, 2007
(in millions, except per share data)
The following unaudited pro forma condensed consolidated statements of operations for the year ended December 31, 2007 is based on the historical consolidated statements of operations of the Predecessor period from January 1, 2007 to May 17, 2007 and the Successor period from May 18, 2007 to December 31, 2007 and gives effect to the Apollo Transactions and Special Dividend as if they had occurred on January 1, 2007.
| Predecessor | Successor | Pro forma Noranda Aluminum Holding Corporation |
||||||||||||||
| Period
from January 1, 2007 to May 17, 2007(1) |
Period
from May 18, 2007 to December 31, 2007(1) |
Pro forma adjustments |
Year
ended December 31, 2007 |
|||||||||||||
| Sales |
$ | 527.7 | $ | 867.4 | $ | — | $ | 1,395.1 | ||||||||
| Operating costs and expenses: |
||||||||||||||||
| Cost of sales |
424.5 | 768.0 | 12.8 | (2) | 1,205.3 | |||||||||||
| Selling, general and administrative expenses |
16.8 | 39.2 | 0.5 | (3) | 56.5 | |||||||||||
| Other charges (recoveries), net |
— | (0.5 | ) | — | (0.5 | ) | ||||||||||
| 441.3 | 806.7 | 13.3 | 1,261.3 | |||||||||||||
| Operating income |
86.4 | 60.7 | (13.3 | ) | 133.8 | |||||||||||
| Other expenses (income): |
||||||||||||||||
| Interest expense, (income), net: |
||||||||||||||||
| Parent and related party |
7.2 | — | (7.2 | )(4) | — | |||||||||||
| Other |
(1.0 | ) | 65.0 | 42.8 | (5) | 106.8 | ||||||||||
| (Gain) loss on hedging activities, net |
56.6 | (12.5 | ) | — | 44.1 | |||||||||||
| Equity in net (income) loss of investments in affiliates |
(4.3 | ) | (7.3 | ) | 0.1 | (6) | (11.5 | ) | ||||||||
| Gain on debt repurchase |
— | 2.2 | — | 2.2 | ||||||||||||
| Total other expenses, net |
58.5 | 47.4 | 35.7 | 141.6 | ||||||||||||
| Income (loss) before income taxes |
27.9 | 13.3 | (49.0 | ) | (7.8 | ) | ||||||||||
| Income tax expense (benefit) |
13.6 | 5.1 | (17.0 | )(7) | 1.7 | |||||||||||
| Net income (loss) |
$ | 14.3 | $ | 8.2 | $ | (32.0 | ) | $ | (9.5 | ) | ||||||
| Net income (loss) per common share: |
||||||||||||||||
| Basic |
$ | 0.19 | $ | (0.22 | ) | |||||||||||
| Diluted |
$ | 0.19 | $ | (0.22 | ) | |||||||||||
| Weighted-average common shares outstanding: |
||||||||||||||||
| Basic |
43.21 | 43.07 | ||||||||||||||
| Diluted |
43.33 | 43.07 | ||||||||||||||
| (1) | Represents the historical consolidated results of operations. |
| (2) | Reflects an increase of $12.5 million for the year ended December 31, 2007 of depreciation resulting from fair value adjustments to property, plant and equipment as a result of the Apollo Acquisition. The adjustment also reflects an increase of $0.3 million for the year ended December 31, 2007 resulting from the fair value adjustment to inventory as a result of the Apollo Acquisition. |
| (3) | Includes an increase of $0.5 million for the year ended December 31, 2007 of amortization resulting from fair value adjustments to amortizable intangible assets as a result of the Apollo Acquisition. |
| (4) | Reflects the elimination of historical intercompany interest income and expenses, related to intercompany balances which were not acquired as part of the Apollo Acquisition. |
| (5) | Reflects the net effect of the increase in interest expense related to the additional indebtedness, incurred in the Apollo Transactions and the Special Dividend in the aggregate principal amount of $1,227.8 million, bearing interest at a weighted-average interest rate of 8.3%. The interest rates used for pro forma purposes are based on assumptions of the rates at the time of the acquisition. The adjustment assumes straight-line amortization of related deferred financing costs. A 0.125% change in the interest rates on our pro forma indebtedness would change our annual pro forma interest expense by $1.5 million. |
| (6) | Reflects an increase of amortization of excess of carrying value of investment over Noranda’s share of the investments’ underlying net assets resulting from the fair value adjustments to Noranda’s joint ventures as a result of the Apollo Acquisition. |
| (7) | Reflects the estimated tax effect of the pro forma adjustments at Noranda’s statutory tax rate. |
30
Table of Contents
| ITEM 7. | MANAGEMENT’S DISCUSSION AND ANALYSIS OF FINANCIAL CONDITION AND RESULTS OF OPERATIONS |
You should read the following discussion of our results of operations and financial condition with the “Selected Historical Consolidated Financial Data,” and the audited consolidated financial statements and related notes included elsewhere in this report. The following discussion contains forward-looking statements that reflect our plans, estimates and beliefs, and that involve numerous risks and uncertainties, including, but not limited to, those described in the “Risk Factors” section of this report. Actual results may differ materially from those contained in any forward-looking statements. See “Cautionary Statement Concerning Forward-Looking Statements.”
Introduction
The following Management’s Discussion and Analysis of Financial Condition and Results of Operations (“MD&A”) is provided to supplement the consolidated financial statements and the related notes included elsewhere in this report to help provide an understanding of our financial condition, changes in financial condition and results of our operations. The MD&A is organized as follows:
Company Overview. This section provides a general description of our business as well as recent developments that we believe are necessary to understand our financial condition and results of operations and to anticipate future trends in our business.
Reconciliation of Net Income between Noranda AcquisitionCo and Noranda HoldCo. This section reconciles the results of operations of Noranda HoldCo and its wholly owned subsidiary, Noranda AcquisitionCo.
Critical Accounting Policies and Estimates. This section discusses the accounting policies and estimates that we consider being important to our financial condition and results of operations and that require significant judgment and estimates on the part of management in their application.
Selected Quarterly Consolidated Financial Data. This section provides the unaudited quarterly financial information for each of our years ended December 31, 2009 and 2010.
Results of Operations. This section provides a discussion of the results of operations on a historical basis for each of our years ended December 31, 2008, 2009 and 2010.
Liquidity and Capital Resources. This section provides an analysis of our cash flows for each of our years ended December 31, 2008, 2009 and 2010 and availability of funds at December 31, 2010.
Description of Certain Indebtedness. This section provides a general description of our senior secured credit facilities, our Notes and governing indentures, including covenant compliance and financial ratios as of December 31, 2010.
Contractual Obligations and Contingencies. This section provides a discussion of our commitments as of December 31, 2010.
Company Overview
We are a leading North American integrated producer of value-added primary aluminum products and high quality rolled aluminum coils. We have two businesses: our upstream business and downstream business. Our upstream business consists of three reportable segments: primary aluminum products, alumina refining, and bauxite. These three segments are closely integrated and consist of a smelter near New Madrid, Missouri, which we refer to as “New Madrid,” and supporting operations at our bauxite mine and alumina refinery. New Madrid has annual production capacity of approximately 580 million pounds (263,000 metric tonnes). Operated at capacity, this represented approximately 15% of total 2010 U.S. primary aluminum production, based on data from CRU. Our flat rolled products segment comprises our downstream business, which is one of the largest aluminum foil producers in North America and consists of four rolling mill facilities with a combined maximum annual production capacity of 410 to 495 million pounds, depending on production mix.
Joint Venture Transaction
Through August 31, 2009, we held a 50% interest in Gramercy and in St. Ann. Our investments in these non-controlled entities, in which we had the ability to exercise equal or significant influence over operating and financial policies, were accounted for by the equity method. On August 3, 2009, we entered into an agreement with Century whereby we would become the sole owner of both Gramercy and St. Ann. The transaction closed on August 31, 2009 and is discussed further in Note 2 “Joint Venture Transaction” to our annual consolidated financial statements, included elsewhere in this report.
In the transaction, Noranda and Gramercy released Century from certain obligations. These obligations included (i) approximately $23.5 million Century owed Gramercy for pre-transaction alumina purchases, and (ii) Century’s guarantee to fund future payments of environmental and asset retirement obligations.
Key factors affecting our results of operations
Prices and markets. Primary aluminum is a global commodity, and its price is set on the LME. Our primary aluminum products typically earn the LME price plus a Midwest premium. As a result of the global economic contraction, the monthly average LME price dropped from a peak of $1.49 in July 2008 to a low of $0.57 in February 2009. The average LME price for 2009 was $0.76 per pound, which had a significant negative impact on our upstream business and our 2009 operating results. By December 31, 2009, LME prices had risen to $1.00 per pound. As of December 31, 2010, the LME cash price was $1.12 per pound and the Midwest U.S. Transaction premium was $0.06 per pound.
31
Table of Contents
Profit margins in the flat rolled products segment are generally unaffected by short-term volatility in the underlying LME price, except in periods of rapid change, which could create significant differences between the cost of metal purchased and the price of metal sold to customers. The price of any given end-product is equal to the cost of the metal, the MWTP, plus a negotiated fabrication premium. These fabrication premiums are determined in large part by industry capacity utilization, which in turn is driven by supply-demand fundamentals for our products.
Because primary aluminum is a global commodity, we have experienced and expect to continue to be subject to volatile primary aluminum prices. This price volatility is influenced primarily by the world supply-demand balance for those commodities and related processing services, and other related factors such as speculative activities by market participants, production activities by competitors and political and economic conditions, as well as production costs in major production regions. Increases or decreases in primary aluminum prices result in increases and decreases in our revenues (assuming all other factors are unchanged). At times, since the Apollo Acquisition, we have partially hedged this volatility through the use of derivative financial instruments. See Item 7A, “Quantitative and Qualitative Disclosures about Market Risk” for further discussion of fixed price aluminum swaps. See “Critical Accounting Policies and Estimates” for further discussion of our accounting for these hedges.
Demand. We are a North American producer with a majority of our primary aluminum sales in the form of value-added products delivered within a one-day delivery radius of New Madrid. Therefore, while global market trends determine the LME price and impact our margins, domestic supply and demand for our value-added products also directly impact our margins.
Our integrated operations provide us the flexibility to shift a portion of our upstream production to our downstream business, reducing our overall external purchase commitments, and allowing us to retain the economic differential between LME pricing and our production costs. In fourth quarter 2009, as we returned pot lines to operation in the New Madrid smelter, while value-added product demand continued to lag, we shipped 25.9 million pounds to our downstream operation.
Production. In 2009 and 2010, our primary aluminum products segment produced approximately 316 million pounds (143,000 metric tonnes) and 556 million pounds (252,000 metric tonnes), respectively, of primary aluminum. In January 2009, an ice storm disrupted the power grid throughout Southeastern Missouri. The resulting power outage completely disabled two of New Madrid’s three production lines and partially disabled the third, initially reducing our daily production to 25% of pre-outage levels. This event had a substantial negative impact on our 2009 operating results, resulting in an average operating rate of 58% of capacity for the year. This operating rate is significantly below our operating rate for the past 20 years of 99%. We reached a settlement with our insurance providers with respect to this incident pursuant to which we collected approximately $67.5 million in the second and third quarters of 2009.
Our smelter became fully operational in the first quarter of 2010. Shipments of value-added products in the year ended December 31, 2010 were 45.7% higher than in the year ended December 31, 2009.
Our rolling mills have a combined maximum annual production capacity of 410 to 495 million pounds, depending on our product mix.
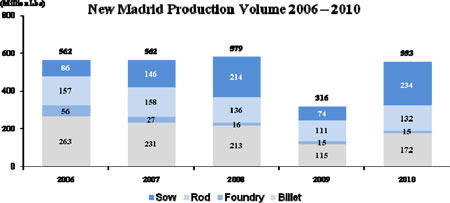
Source: Company data as of December 31, 2010
Production costs. The key cost components at our smelter are power and alumina however, input costs, such as wages, carbon products and caustic soda may affect our results as well.
We have a long-term, secure power contract at New Madrid that extends through 2020. Our power contract with Ameren includes two components: a base rate and a fuel adjustment clause. The fuel adjustment clause resulted in additional fuel charges of $5.4 million recorded in costs of goods sold during the year ended December 31, 2010. We are not able to predict future fuel adjustments charges as they are dependent on Ameren’s fuel cost and off system sales volume and prices. We are currently disputing the amount of cost increases related to the fuel adjustment clause. As of December 31, 2010, we hold $9.8 million in a restricted cash account which is reflected in other current assets on our consolidated balance sheet. This restricted cash represents money held in
32
Table of Contents
escrow by the Missouri Circuit Court for disputed amounts related to our appeal of Ameren’s rates. Additionally, on September 3, 2010, Ameren filed a new rate case with the MoPSC seeking an 11% base rate increase. We expect a ruling on this request by July 29, 2011. Though we are not able to predict future fuel adjustment charges, as they are dependent on Ameren’s fuel costs and off system sales volume and prices, we expect the impact of fuel adjustment charges in 2011 to increase our integrated primary aluminum cash cost by 2 to 3 cents per pound for 2011.
Our vertical integration with Gramercy provides us with a secure supply of alumina at a cost effectively equal to Gramercy and St. Ann’s combined cost of production, net of bauxite and alumina sales to third parties. St. Ann sells bauxite to third parties and Gramercy sells chemical and smelter grade alumina to third parties. Margins from these third-party sales effectively reduce the cost for producing smelter grade alumina for our smelter in New Madrid. Upon becoming sole owner of Gramercy, we began selling smelter grade alumina under contract to third parties on market terms. Under current market conditions, these sales are expected to allow us to generate positive cash margins that will effectively reduce our integrated upstream cash cost of primary aluminum.
The following chart presents our New Madrid smelter’s placement on the aluminum cost curve:
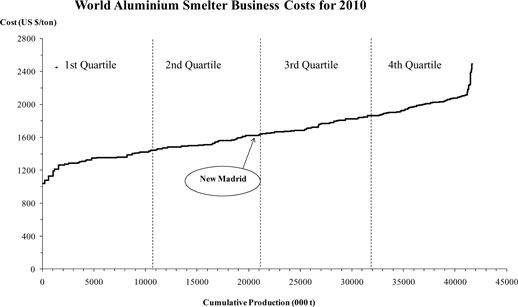
Source: CRU data as of January 27, 2011
Historically, natural gas prices have shown a high level of volatility. Average natural gas prices were $8.89 per million BTU in 2008, $3.94 in 2009, and $4.37 in 2010 based on end of day prices at the Henry Hub. At December 31, 2010, we are a party to forward swaps for natural gas, effectively fixing our cost for approximately 45% of our natural gas exposure through 2012 at an average price of $7.37 per million BTU.
During 2010 in our downstream business, aluminum metal units, which represent a pass-through cost to our customers, accounted for 74% of production costs with value-added conversion costs accounting for the remaining 26%. Conversion costs include labor, energy and operating supplies, including maintenance materials. Energy includes natural gas and electricity, which made up about 14% of conversion costs during 2010.
CORE stands for “Cost-Out, Reliability, and Effectiveness”, and represents our productivity program. We believe CORE is an effective part of our efforts to manage for productivity, where we identify opportunities throughout the organization to either remove existing costs, or to affect processes or business arrangements. We then utilize project teams to address the opportunity. Although results will vary from year to year, our over-arching aim is to use CORE projects to offset the effects of inflation and to mitigate the impact of unexpected cost increases. Our CORE program target is to generate in total over $140.0 million of savings from 2009 through 2011 either in the form of cost savings, capital expenditure savings or cash generation. For the year ended December 31, 2010, our results reflect approximately $62.4 million in cost savings and over $14.7 million in capital expenditure savings. Added to the $43.0 million of CORE savings accomplished in 2009, we have generated $120.1 million of our three year $140.0 million CORE program goal. We believe the impact of CORE is evident in the cash cost of primary aluminum, which declined from $0.82 per pound for the full year ended December 31, 2008 to $0.77 per pound for the year ended December 31, 2009 and $0.70 for the year ended December 31, 2010. We estimate that due to lost production volume in 2009 from the smelter outage, which caused a loss of efficiency and fixed cost absorption, our net cash cost of primary aluminum for 2009 of $0.77 per pound was negatively impacted by $0.05 per pound.
33
Table of Contents
Seasonality and the effects of inflation
We are subject to seasonality associated with the demand cycles of our end-use customers, which results in lower shipment levels from November to February each year. Our power contracts have seasonally adjusted pricing which results in fluctuations in our cost of production; the rates from June to September are approximately 45% higher than the rates from October to May.
We experience inflationary pressures for input costs, such as wages, carbon products such as coke, chemical such as caustic soda, and other key inputs. We may not be able to offset fully the inflationary impact from these input costs or energy costs through price increases, productivity improvements or cost reduction programs. Due to the expiration of favorable sourcing arrangements, we expect full year 2011 integrated primary aluminum cash cost to be unfavorably impacted by approximately 3 to 4 cents per pound for carbon-based products and 2 to 3 cents per pound for chemical products.
Outlook
At the current forward LME curve the Company expects higher LME prices, coupled with the benefits of fully operational integrated upstream assets throughout 2011, to have a favorable impact on its results in 2011. However, the Company expects these improvements to be partially offset by inflation in chemicals and carbon-based input materials as well as the impact from fuel adjustment charges in New Madrid’s power contract.
Off balance sheet arrangements
We do not have any significant off balance sheet arrangements.
Government regulations and environmental matters
Our operations are subject to a number of federal, state and local regulations relating to the protection of the environment and to workplace health and safety. In particular, our operations are subject to extensive federal, state and local laws and regulations governing emissions to air, discharges to water emissions, the generation, storage, transportation, treatment or disposal of hazardous materials or wastes and employee health and safety matters. We have spent, and expect to spend, significant amounts for compliance with those laws and regulations.
We accrue for costs associated with environmental investigations and remedial efforts when it becomes probable that we are liable and the associated costs can be reasonably estimated. Our aggregate environmental-related liabilities at December 31, 2009 and 2010 were $26.6 million and $28.6 million, respectively. Additionally, at December 31, 2009 and 2010, we had $6.2 million and $9.2 million respectively, of restricted cash in an escrow account as security for the payment of red mud lake closure obligations that would arise under state environmental laws upon the termination of operations at the Gramercy facility. With regard to our New Madrid smelter, we have asset retirement obligations related to the disposal of certain spent pot liners. Related to St. Ann, we have land reclamation liabilities to rehabilitate the land disturbed by St. Ann’s mining operations. With respect to the Gramercy refinery, we have asset-retirement obligations associated with the future closure and post-closure care of the “red mud lakes,” where Gramercy disposes of non-hazardous red mud wastes from its refining process. We also have an environmental liability for the remediation of certain hazardous waste contamination at the Gramercy refinery.
All accrued amounts have been recorded without giving effect to any possible future recoveries. With respect to ongoing environmental compliance costs, including maintenance and monitoring, we expense the costs when incurred.
For the years ended December 31, 2009 and 2010, we had $6.3 million and $10.4 million of capital expenditures related to compliance with environmental regulations. We have incurred, and in the future will continue to incur, operating expenses related to environmental compliance. As part of our general capital expenditure plan, we also expect to incur capital expenditures for other capital projects that may, in addition to improving operations, reduce certain environmental impacts.
Reconciliation of Net Income between Noranda AcquisitionCo and Noranda HoldCo
Noranda HoldCo was formed on March 27, 2007, and its principal asset is its wholly owned subsidiary, Noranda AcquisitionCo, which was also formed on March 27, 2007, both formed for the purpose of the Apollo Transactions. The following table reconciles the results of operations of Noranda HoldCo and Noranda AcquisitionCo (in millions):
| Year Ended December 31, | ||||||||||||
| 2008 | 2009 | 2010 | ||||||||||
| $ | $ | $ | ||||||||||
| Consolidated net income (loss) of Noranda AcquisitionCo |
(59.5 | ) | 40.2 | 76.1 | ||||||||
| Noranda HoldCo interest expense |
(21.3 | ) | (18.1 | ) | (6.0 | ) | ||||||
| Noranda HoldCo director and other fees |
(1.6 | ) | (3.2 | ) | (7.3 | ) | ||||||
| Noranda HoldCo gains (losses) on debt repurchases |
— | 116.1 | (1.0 | ) | ||||||||
| Noranda HoldCo tax effects |
8.3 | (33.6 | ) | 5.1 | ||||||||
| Consolidated net income (loss) of Noranda HoldCo. |
(74.1 | ) | 101.4 | 66.9 | ||||||||
34
Table of Contents
Critical Accounting Policies and Estimates
Our principal accounting policies are described in Note 1, “Accounting Policies” of the audited consolidated financial statements included elsewhere in this report. The preparation of the consolidated financial statements in accordance with U.S. GAAP requires management to make significant judgments and estimates. Some accounting policies have a significant impact on amounts reported in our consolidated financial statements. Our financial position and results of operations may be materially different when reported under different conditions or when using different assumptions in the application of such policies. In the event estimates or assumptions prove to be different from actual amounts, adjustments are made in subsequent periods to reflect more current information. The preparation of interim financial statements involves the use of certain estimates that are consistent with those used in the preparation of our annual consolidated financial statements. Significant accounting policies, including areas of critical management judgments and estimates, include the following financial statement areas:
Revenue recognition
Revenue is recognized when title and risk of loss pass to customers in accordance with contract terms.
Impairment of long-lived assets
Our long-lived assets, primarily property, plant and equipment, comprise a significant amount of our total assets. We evaluate our long-lived assets and make judgments and estimates concerning the carrying value of these assets, including amounts to be capitalized, depreciation and useful lives. The carrying values of these assets are reviewed for impairment periodically whenever events or changes in circumstances indicate that the carrying amounts may not be recoverable. An impairment loss is recorded in the period in which it is determined that the carrying amount is not recoverable. This evaluation requires us to make long-term forecasts of future revenues and costs related to the assets subject to review. These forecasts require assumptions about demand for our products and future market conditions. Significant and unanticipated changes to these assumptions could require a provision for impairment in a future period. Although we believe the assumptions and estimates we have made in the past have been reasonable and appropriate, different assumptions and estimates could materially impact our reported financial results.
Goodwill and other intangible assets
Goodwill represents the excess of acquisition consideration paid over the fair value of identifiable net tangible and identifiable intangible assets acquired. Goodwill and other indefinite-lived intangible assets are not amortized, but are reviewed for impairment at least annually, in the fourth quarter, or upon the occurrence of certain triggering events. We evaluate goodwill for impairment using a two-step process. The first step is to compare the fair value of each of our reporting units to their respective book values, including goodwill. If the fair value of a reporting unit exceeds its book value, reporting unit goodwill is not considered impaired and the second step of the impairment test is not required. If the book value of a reporting unit exceeds its fair value, the second step of the impairment test is performed to measure the amount of impairment loss, if any. The second step of the impairment test compares the implied fair value of the reporting unit’s goodwill with the book value of that goodwill. If the book value of the reporting unit’s goodwill exceeds the implied fair value of that goodwill, an impairment loss is recognized in an amount equal to that excess. The implied fair value of goodwill is determined in the same manner as the amount of goodwill recognized in a business combination.
Our analyses include assumptions about future profitability and cash flows of our segments, which reflect our best estimates at the date the valuations was performed. The estimates are based on information that was known or knowable at the date of the valuations. It is at least reasonably possible that the assumptions we employ will be materially different from the actual amounts or results, and that additional impairment charges may be necessary.
Inventory valuation
Inventories are stated at the lower of cost or market (“LCM”). We use the last-in-first-out (“LIFO”) method of valuing raw materials, work-in-process and finished goods inventories at our New Madrid smelter and our rolling mills. Inventories at Gramercy and St. Ann and supplies at New Madrid are valued at weighted-average cost. The remaining inventories (principally supplies) are stated at cost using the first-in first-out (“FIFO”) method. Inventories in our flat rolled products segment, our bauxite segment and our alumina refining segment are valued using a standard costing system, which gives rise to cost variances. Variances are capitalized to inventory in proportion to the quantity of inventory remaining at period end to quantities produced during the period. Variances are recorded such that ending inventory reflects actual costs on a year-to-date basis.
As of the date of the Apollo Acquisition a new base layer of LIFO inventories was established at fair value, such that FIFO basis and LIFO basis were equal. For layers added between the acquisition date and period end, we use a dollar-value LIFO approach where a single pool for each segment represents a composite of similar inventory items. Increases and decreases in inventory are
35
Table of Contents
measured on a pool basis rather than item by item. In periods following the Apollo Acquisition, LIFO cost of sales reflect sales at current production costs, which are substantially lower than the fair value cost recorded at the date of acquisition, to the extent that quantities produced exceed quantities sold. In periods when quantities sold exceed quantities produced, cost of goods sold reflect the higher fair value cost per unit.
As LME prices fluctuate, our inventory will be subject to market valuation reserves. In periods when the LME price at a given balance sheet date is higher than the LME price at the time of the Apollo Acquisition (the date used to determine the fair value of our inventory), no reserves will be necessary.
Asset retirement obligations
We record our costs for legal obligations associated with the retirement of a tangible long-lived asset that results from its acquisition, construction, development or normal operation as asset retirement obligations. We recognize liabilities, at fair value, for our existing legal asset retirement obligations and adjust these liabilities for accretion costs and revision in estimated cash flows. The related asset retirement costs are capitalized as increases to the carrying amount of the associated long-lived assets and depreciation on these capitalized costs is recognized.
Derivative instruments and hedging activities
Derivatives that have not been designated for hedge accounting are adjusted to fair value through earnings in (gain) loss on hedging activities in the consolidated statements of operations. For derivative instruments that are designated and qualify as cash flow hedges, the effective portion of any gain or loss on the derivative is reported as a component of accumulated other comprehensive loss and reclassified into earnings in the same period or periods during which the hedged transaction affects earnings. Gains and losses on the derivatives representing either hedge ineffectiveness or hedge components excluded from the assessment of effectiveness are recognized in current earnings. Amounts recorded in accumulated other comprehensive income are reclassified into earnings in the periods during which the hedged transaction affects earnings, unless it is determined that it is probable that the original forecasted transactions will not occur, at which point a corresponding amount of accumulated other comprehensive income is immediately reclassified into earnings.
Forecasted sales represent a sensitive estimate in our designation of derivatives as cash flow hedges. As a result of the New Madrid power outage in January 2009, management concluded that certain hedged sale transactions were no longer probable of occurring, and we discontinued hedge accounting for all our aluminum fixed price sale swaps on January 29, 2009. At that date, the accounting for amounts in accumulated other comprehensive income did not change. Forecasted sales represent a sensitive estimate in our accounting for derivatives because they impact the determination of whether any amounts in accumulated other comprehensive income should be reclassified into earnings in the current period.
We determine the fair values of our derivative instruments using industry standard models that incorporate inputs which are observable throughout the full term of the instrument. Key inputs include quoted forward prices for commodities (aluminum and natural gas) and interest rates, and credit default swap spread rates for non-performance risk. Our derivative assets are adjusted for the non-performance risk of our counterparties using their credit default swap spread rates, which are updated quarterly. Likewise, in the case of our liabilities, our nonperformance risk is considered in the valuation, and are also adjusted quarterly based on current default swap spread rates on entities we consider comparable to us. We present the fair value of our derivative contracts net of cash paid pursuant to collateral agreements on a net-by-counterparty basis in our consolidated statements of financial position when we believe a legal right of setoff exists under an enforceable master netting agreement.
Share-based payments
As described in more detail in Note 15 “Shareholders’ Equity and Share-Based Payments” in our consolidated financial statements, the fair value of each award is separately estimated and amortized into compensation expense over the service period. The fair value of our stock option grants is estimated on the grant date using the Black-Scholes-Merton valuation model. The application of this valuation model involves assumptions that require judgment and are highly sensitive in the determination of compensation expense.
36
Table of Contents
Selected Quarterly Consolidated Financial Data
The following table presents unaudited quarterly financial information as required by Item 302 of Regulation S-K (in millions, except per share data):
| 2009 quarter ended | 2010 quarter ended | |||||||||||||||||||||||||||||||
| First quarter |
Second quarter |
Third quarter |
Fourth quarter |
First quarter |
Second quarter |
Third quarter |
Fourth quarter |
|||||||||||||||||||||||||
| $ | $ | $ | $ | $ | $ | $ | $ | |||||||||||||||||||||||||
| Sales |
164.3 | 157.7 | 218.6 | 229.3 | 301.5 | 334.9 | 314.2 | 344.3 | ||||||||||||||||||||||||
| Gross profit (loss) |
(20.0 | ) | (6.1 | ) | 2.4 | 13.7 | 36.6 | 43.9 | 40.0 | 61.0 | ||||||||||||||||||||||
| Operating income (loss) |
(85.2 | ) | 12.4 | (2.1 | ) | (75.2 | ) | 7.6 | 0.8 | 20.1 | 39.0 | |||||||||||||||||||||
| Net income (loss) |
44.3 | (12.1 | ) | 125.9 | (56.7 | ) | (0.1 | ) | 6.9 | 25.2 | 34.9 | |||||||||||||||||||||
| Net income (loss) per common share: |
||||||||||||||||||||||||||||||||
| Basic |
1.02 | (0.28 | ) | 2.89 | (1.30 | ) | (0.00 | ) | 0.14 | 0.46 | 0.60 | |||||||||||||||||||||
| Diluted |
1.02 | (0.28 | ) | 2.89 | (1.30 | ) | (0.00 | ) | 0.14 | 0.45 | 0.59 | |||||||||||||||||||||
The special items outlined below significantly impacted the comparability of our unaudited quarterly financial results (in millions):
| 2009 quarter ended | 2010 quarter ended | |||||||||||||||||||||||||||||||
| First quarter |
Second quarter |
Third quarter |
Fourth quarter |
First quarter |
Second quarter |
Third quarter |
Fourth quarter |
|||||||||||||||||||||||||
| $ | $ | $ | $ | $ | $ | $ | $ | |||||||||||||||||||||||||
| Pre-tax impact of specific transactions: |
||||||||||||||||||||||||||||||||
| Insurance recoveries in excess of losses |
— | 29.2 | 14.3 | — | — | — | — | — | ||||||||||||||||||||||||
| Management agreement termination |
— | — | — | — | — | (12.5 | ) | — | — | |||||||||||||||||||||||
| Modification of stock options |
— | — | — | — | — | (3.2 | ) | — | — | |||||||||||||||||||||||
| Transaction related legal costs |
— | — | — | — | (0.3 | ) | (5.2 | ) | — | — | ||||||||||||||||||||||
| Restructuring |
— | — | — | — | (4.4 | ) | (3.2 | ) | — | — | ||||||||||||||||||||||
| Executive separation agreement |
— | — | — | — | — | — | — | (3.3 | ) | |||||||||||||||||||||||
| Goodwill and other intangible asset impairment |
(43.0 | ) | — | — | (65.0 | ) | — | — | — | — | ||||||||||||||||||||||
| Impact of special items on operating income (loss) |
(43.0 | ) | 29.2 | 14.3 | (65.0 | ) | (4.7 | ) | (24.1 | ) | — | (3.3 | ) | |||||||||||||||||||
| Gain on hedging activities |
45.1 | 53.2 | 5.9 | 7.6 | 1.7 | 20.6 | 21.7 | 21.6 | ||||||||||||||||||||||||
| Joint venture impairment |
(45.3 | ) | (35.0 | ) | — | — | — | — | — | — | ||||||||||||||||||||||
| Gain (loss) on debt repurchase |
152.2 | 12.4 | 28.6 | 18.0 | (0.1 | ) | (2.5 | ) | 3.5 | (1.0 | ) | |||||||||||||||||||||
| Gain on business combination |
— | — | 120.3 | — | — | — | — | — | ||||||||||||||||||||||||
| Income tax impact of special items |
(12.3 | ) | (19.8 | ) | (41.7 | ) | 14.3 | 1.0 | 2.0 | (8.8 | ) | (5.9 | ) | |||||||||||||||||||
| Impact of special items on net income (loss) |
96.7 | 40.0 | 127.4 | (25.1 | ) | (2.1 | ) | (4.0 | ) | 16.4 | 11.4 | |||||||||||||||||||||
37
Table of Contents
Results of Operations
To aid the reader in understanding the results of operations of each of these distinctive periods, we have provided the following discussion. You should read the following discussion of the results of operations and financial condition with the consolidated financial statements and related notes included herein.
The following chart indicates the percentages of sales represented by each of our segments for the periods presented:
| Year ended December 31, | ||||||||||||
| 2008 | 2009 | 2010 | ||||||||||
| % | % | % | ||||||||||
| Bauxite |
— | 5 | 9 | |||||||||
| Alumina refining |
— | 11 | 28 | |||||||||
| Primary aluminum products |
60 | 44 | 49 | |||||||||
| Flat rolled products |
48 | 53 | 40 | |||||||||
| Eliminations |
(8 | ) | (13 | ) | (26 | ) | ||||||
| 100 | 100 | 100 | ||||||||||
The following chart indicates the percentages of segment profit (loss) represented by each of our segments for the periods presented:
| Year ended December 31, | ||||||||||||
| 2008 | 2009 | 2010 | ||||||||||
| % | % | % | ||||||||||
| Bauxite |
— | 63 | 11 | |||||||||
| Alumina refining |
— | (12 | ) | 29 | ||||||||
| Primary aluminum products |
92 | 25 | 51 | |||||||||
| Flat rolled products |
12 | 179 | 23 | |||||||||
| Corporate |
(7 | ) | (145 | ) | (12 | ) | ||||||
| Eliminations |
3 | (10 | ) | (2 | ) | |||||||
| 100 | 100 | 100 | ||||||||||
38
Table of Contents
Discussion of results for the year ended December 31, 2008 compared to the year ended December 31, 2009
The following table sets forth certain consolidated financial information for the years ended December 31, 2008 and 2009 (in millions, except per share data and where noted):
| Year ended December 31, | ||||||||
| 2008 | 2009 | |||||||
| Statements of operations data: |
||||||||
| Sales |
$ | 1,266.4 | $ | 769.9 | ||||
| Operating costs and expenses: |
||||||||
| Cost of sales |
1,122.7 | 779.9 | ||||||
| Selling, general and administrative expenses and other |
73.8 | 75.6 | ||||||
| Goodwill and other intangible asset impairment |
25.5 | 108.0 | ||||||
| Excess insurance proceeds |
— | (43.5 | ) | |||||
| 1,222.0 | 920.0 | |||||||
| Operating income (loss) |
44.4 | (150.1 | ) | |||||
| Other expenses (income): |
||||||||
| Interest expense, net |
88.0 | 53.5 | ||||||
| (Gain) loss on hedging activities, net |
69.9 | (111.8 | ) | |||||
| Equity in net (income) loss of investments in affiliates |
(7.7 | ) | 79.7 | |||||
| (Gain) loss on debt repurchase |
1.2 | (211.2 | ) | |||||
| Gain on business combination |
— | (120.3 | ) | |||||
| Total other expenses |
151.4 | (310.1 | ) | |||||
| Income (loss) before income taxes |
(107.0 | ) | 160.0 | |||||
| Income tax expense (benefit) |
(32.9 | ) | 58.6 | |||||
| Net income (loss) for the period |
$ | (74.1 | ) | $ | 101.4 | |||
| Net income (loss) per common share: |
||||||||
| Basic |
$ | (1.70 | ) | $ | 2.33 | |||
| Diluted |
$ | (1.70 | ) | $ | 2.33 | |||
| Weighted-average common shares outstanding: |
||||||||
| Basic |
43.44 | 43.53 | ||||||
| Diluted |
43.44 | 43.53 | ||||||
| Sales by segment: |
||||||||
| Bauxite |
$ | — | $ | 34.6 | ||||
| Alumina refining |
— | 84.2 | ||||||
| Primary aluminum products |
758.5 | 340.3 | ||||||
| Flat rolled products |
605.7 | 408.4 | ||||||
| Eliminations |
(97.8 | ) | (97.6 | ) | ||||
| Total |
$ | 1,266.4 | $ | 769.9 | ||||
| Segment profit (loss): |
||||||||
| Bauxite |
$ | — | $ | 12.3 | ||||
| Alumina refining |
— | (2.3 | ) | |||||
| Primary aluminum products |
222.7 | 4.9 | ||||||
| Flat rolled products |
28.5 | 35.1 | ||||||
| Corporate |
(15.9 | ) | (28.4 | ) | ||||
| Eliminations |
7.4 | (2.0 | ) | |||||
| Total |
$ | 242.7 | $ | 19.6 | ||||
| Financial and other data: |
||||||||
| Average realized Midwest Transaction Price (per pound) |
$ | 1.21 | $ | 0.81 | ||||
| Net cash cost for primary aluminum products (per pound shipped) |
$ | 0.82 | $ | 0.77 | ||||
| Shipments: |
||||||||
| Third party shipments: |
||||||||
| Bauxite (kMts) |
— | 482.9 | ||||||
| Alumina (kMts) |
— | 245.0 | ||||||
| Primary aluminum products (pounds, in millions) |
509.5 | 291.4 | ||||||
| Flat rolled products (pounds, in millions) |
346.1 | 309.3 | ||||||
| Intersegment shipments: |
||||||||
| Bauxite (kMts) |
— | 835.1 | ||||||
| Alumina (kMts) |
— | 116.5 | ||||||
| Primary aluminum products (pounds, in millions) |
80.4 | 60.2 | ||||||
39
Table of Contents
Sales for the year ended December 31, 2009 were $769.9 million compared to $1,266.4 million for the year ended December 31, 2008, a decrease of 39.2%.
Sales to external customers in our primary aluminum products segment were $290.4 million in the year ended December 31, 2009; a 56% decrease from $660.7 million in sales to external customers for the year ended December 31, 2008, driven primarily by a decline in LME aluminum prices, lower volumes of value-added shipments due to a decline in end-market demand and lower sow volumes related to the New Madrid power outage, as discussed below:
| • | The decline in pricing, due to a 33.1% decrease in realized MWTP, resulted in a decrease of $101.7 million in external revenues. For the years ended December 31, 2008 and 2009, the average LME aluminum price per pound was $1.17 and $0.76, respectively. |
| • | Total primary aluminum shipments for the year ended December 31, 2009 decreased 238.3 million pounds to 351.6 million pounds or 40.4% compared to the year ended December 31, 2008. Intersegment shipments to our flat rolled products segment decreased 20.2 million pounds or 25.1%, to 60.2 million pounds as a result of the power outage at New Madrid. The downstream business had sufficient external alternate sources of supply to meet its aluminum needs. |
| • | External primary aluminum shipments decreased to 291.4 million pounds for the year ended December 31, 2009 from 509.5 million pounds for the year ended December 31, 2008. This 42.8% decrease in external shipments resulted in a decrease of $282.8 million in external revenues and is largely the result of lower production levels because of the smelter outage and the continued decline in demand for value-added products. Shipments of value-added primary aluminum products totaled 283.4 million pounds for the year ended December 31, 2009 compared to 404.8 million pounds for the year ended December 31, 2008. This lower volume was driven by lower end-market demand in transportation and building markets. The power outage at the New Madrid smelter had minimal impact on these primary aluminum value-added volume declines, as we sourced third-party metal to offset the primary aluminum production outage. The re-melt capability and value-added processing capacity within the New Madrid facility were sufficient to serve our customers’ demands for products such as billet and rod. |
| • | Revenues in the primary aluminum products segment for the year ended December 31, 2009 include $14.2 million related to quantities of excess alumina shipped to external customers from our New Madrid smelter. |
Sales to external customers in our alumina refining and bauxite segments for the year ended December 31, 2009 were $56.5 million and $14.6 million, respectively, reflecting the impact of the operations of Gramercy and St. Ann after August 31, 2009. Intercompany shipments from the alumina refining and bauxite segments for the year ended December 31, 2009 were $27.7 million and $20.0 million, respectively.
Sales in our flat rolled products segment were $408.4 million for the year ended December 31, 2009, a decrease of 32.6% compared to sales of $605.7 million for the year ended December 31, 2008. The decrease was primarily due to a negative impact from pricing, as well as lower shipments to external customers, as summarized below:
| • | The LME price decline contributed $132.9 million to the sales decrease. Fabrication premiums were relatively unchanged. |
| • | Decreased shipment volumes reduced revenues by $64.4 million. Shipment volumes of flat rolled products decreased to 309.3 million pounds for the year ended December 31, 2009 from 346.1 million pounds for the year ended December 31, 2008. This 10.6% decrease was primarily due to lower end-market demand in the building and construction markets. |
Cost of sales decreased to $779.9 million for the year ended December 31, 2009 from $1,122.7 million for the year ended December 31, 2008.
| • | Total primary aluminum products segment cost of sales decreased to $384.6 million in 2009 from $623.0 million in 2008. This 38.3% decrease principally related to a 40.4% decrease in total shipments (including internal and external), due to the factors referenced in the discussion of revenue. Costs incurred related to the New Madrid power outage totaled $20.2 million for the year ended December 31, 2009, of which $17.5 million were directly offset by insurance proceeds. |
| • | Flat rolled products segment cost of sales decreased to $369.0 million in 2009 from $597.5 million in 2008. Approximately $63.5 million of the $228.5 million decrease related to a 10.6% decrease in shipments in 2009, due to the factors referenced in the discussion of revenue. The remaining decrease related principally to the dramatic decrease in the LME aluminum price, since much of that segment’s product cost represents the pass-through cost of metal. |
| • | Cost of sales in the bauxite and alumina refining segments, before the effects of intercompany eliminations, totaled $32.9 million and $91.1 million, respectively. These two segments principally reflect the cost of sales for St. Ann and Gramercy, respectively, which we became sole owners of on August 31, 2009, and have no corresponding costs for 2008. Cost of sales for 2009 in these two segments includes $11.7 million of expenses associated with the purchase accounting step up of property, plant and equipment values and inventory values due to the Joint Venture Transaction. |
40
Table of Contents
| • | The elimination of intercompany sales was $97.6 million in 2009, compared to $97.8 million in 2008, reflecting the decrease in 2009 of inter-segment sales from the primary aluminum products segment to the flat rolled products segment. This decrease was offset by the elimination of inter-segment sales from the alumina refinery segment to the primary aluminum products segment following the Joint Venture Transaction. |
The production outage at New Madrid negatively impacted our net cash cost of primary aluminum in 2009. Although insurance proceeds covered the costs and losses associated with our outage and returning the smelter to operation, our coverage did not make us whole for inefficiencies associated with operating our integrated upstream business significantly below capacity. We estimate that due to lost production volume in 2009 from the smelter outage, which caused a loss of efficiency and fixed cost absorption, our net cash cost of primary aluminum for 2009 of $0.77 per pound was negatively impacted by $0.05 per pound.
Selling, general and administrative expenses for the year ended December 31, 2009 were $75.6 million compared to $73.8 million for the year ended December 31, 2008, a 2.4% increase.
| • | During 2009, we wrote off an unused mill in the flat rolled products segment resulting in $3.0 million of increased expenses. |
| • | Selling, general and administrative expenses associated with the power outage at New Madrid were $7.2 million, of which $6.6 million was directly offset by insurance proceeds for the year ended December 31, 2009. |
Goodwill and other intangible asset impairment increased from $25.5 million for the year ended December 31, 2008 to $108.0 million for the year ended December 31, 2009. During the year ended 2008, we recorded a $25.5 million impairment in the flat rolled products segment, reflecting continued weakness in end markets and the view that the acute decline in foil demand continued to put pressure on pricing as industry capacity utilization was operating well below historic levels. Our impairment analyses performed during 2009 resulted in write-downs of the remaining goodwill of $105.2 million in our flat rolled products segment. These write-downs reflected our view that the rolled products markets will be increasingly competitive for the foreseeable future. The combination of price-based competition and increased demand for lighter gauge products will limit opportunities for achieving higher fabrication margins.
Our analyses included assumptions about future profitability and cash flows of our segments, which we believe reflect our best estimates at the date the valuations were performed. The estimates were based on information that was known or knowable at the date of the valuations, and it is at least reasonably possible that the assumptions we employed will be materially different from the actual amounts or results.
Excess insurance proceeds totaled $43.5 million during the year ended December 31, 2009. We reached a $67.5 million settlement with our insurance carriers, all of which has been received by December 31, 2009. The settlement proceeds of $67.5 million were allocated to cost of sales and selling, general and administrative expenses to the extent losses were realized and eligible for recovery under our insurance policies. The line item titled “Excess insurance proceeds” reflects the residual insurance recovery after applying total proceeds recognized against the losses incurred through September 30, 2009, which was the reporting period in which we finalized all settlements and received related proceeds. This amount is not intended to represent a gain on the insurance claim. We incurred costs in fourth quarter 2009 of approximately $3.3 million related to bringing production back to full capacity, but those costs incurred after September 30, 2009 will not be reflected in the “Excess insurance proceeds” line. Total costs incurred may exceed the total insurance settlement.
Operating income (loss) for the year ended December 31, 2009 was a loss of $150.1 million compared to operating income of $44.4 million for the year ended December 31, 2008. The decrease relates to period-over-period sales margin (sales minus cost of sales) reductions of $153.7 million, a $1.8 million increase in selling, general and administrative and other expenses, and goodwill and other intangible asset impairments.
| • | Sales margin for the year ended December 31, 2009 was a $10.0 million loss compared to income of $143.7 million for the year ended December 31, 2008. This $153.7 million decrease resulted from the impact of a 33.1% decrease in realized MWTP coupled with a decrease in higher margin sales of value-added products and higher production costs (as a percent of sales) in the primary aluminum products segment. |
| • | Selling, general and administrative expenses were $75.6 million for the year ended December 31, 2009 and were relatively stable compared to $73.8 million for the year ended December 31, 2008. |
| • | Operating income was also impacted by goodwill and other intangible asset impairment charges for the year ended December 31, 2009 of $108.0 million, offset by excess insurance proceeds of $43.5 million. |
Interest expense, net for the year ended December 31, 2009 was $53.5 million compared to $88.0 million for the year ended December 31, 2008, a decrease of $34.5 million. Decreased interest expense is related to lower LIBOR interest rates as well as lower average debt outstanding on the term B loan (due to the $24.5 million principal payment in April 2009) and the AcquisitionCo Notes and HoldCo Notes (due to the debt repurchases, discussed further below). These reductions in principal balance were partially offset
41
Table of Contents
by the increased balance under the revolving credit facility; however, the revolving credit facility carries a lower interest rate than the HoldCo Notes and AcquisitionCo Notes.
(Gain) loss on hedging activities, net was a gain of $111.8 million for the year ended December 31, 2009 compared to a $69.9 million loss for the year ended December 31, 2008. We discontinued hedge accounting for our entire remaining aluminum fixed price sale swaps on January 29, 2009. For the year ended December 31, 2009, the amount reclassified from accumulated other comprehensive income to earnings was $172.2 million including $77.8 million reclassified into earnings because it is probable that the original forecasted transactions will not occur.
Equity in net (income) loss of investments in affiliates was a $79.7 million loss for the year ended December 31, 2009, compared to income of $7.7 million for the year ended December 31, 2008. This change was attributable to impairment charges of $80.3 million recorded during the year ended December 31, 2009.
(Gain) loss on debt repurchase was a $211.2 million gain in 2009 compared to a $1.2 million loss in 2008. For the year ended December 31, 2009, we repurchased $430.9 million principal aggregate amount of our outstanding HoldCo Notes, AcquisitionCo Notes, term B loan and revolving credit facility with an aggregate carrying amount of $426.5 million for a price of $215.3 million, including $1.2 million of fees. Of this amount, we repaid $9.1 million of our revolving credit facility borrowings, resulting in our borrowing capacity being reduced $7.3 million to $242.7 million. We recognized a gain of $211.2 million representing the difference between the reacquisition price and the carrying amount of repurchased debt net of write-offs of related deferred financing fees and discounts. For the year ended December 31, 2008, the $1.2 million loss related entirely to the write-off of the HoldCo Notes unamortized debt discount.
Gain on business combination was $120.3 million in 2009. We believe the Joint Venture Transaction was a bargain purchase. We assumed the remaining portion of Gramercy and St. Ann in exchange for releasing Century from certain obligations which included (i) approximately $23.5 million Century owed Gramercy for pre-transaction alumina purchases, and (ii) Century’s guarantee to fund future payments of environmental and asset retirement obligations. To the extent permitted by U.S. GAAP, we assigned fair value to the identifiable assets acquired and liabilities assumed.
We utilized a third-party valuation firm to assist us in determining the fair values of the assets acquired and liabilities assumed in the Joint Venture Transaction. Based on the fair values assigned to the assets acquired and liabilities assumed, we have recorded a gain of $120.3 million, of which, $18.5 million relates to adjusting our previous 50% equity interests to fair value and the remaining $101.8 million relates to the gain recorded on acquired interests. Expenses related to the Joint Venture Transaction such as valuation, legal and consulting costs are included in selling, general, and administrative expenses.
Income tax expense (benefit) was a $58.6 million expense in 2009 compared to a $32.9 million benefit in 2008. Our effective income tax rates were approximately 36.6% for the year ended December 31, 2009 and 30.8% for the year ended December 31, 2008. The increase in the effective tax rate for the year ended December 31, 2009 over December 31, 2008 was primarily impacted by state income taxes, equity method investee income, and gain on business combination in 2009, the Internal Revenue Code Section 199 manufacturing deduction, and goodwill impairment in 2009. See Note 16, “Income Taxes,” in our consolidated financial statements included elsewhere in this report.
As of December 31, 2009 and December 31, 2008, we had unrecognized income tax benefits (including interest) of approximately $11.5 million and $11.1 million (including interest), respectively (of which approximately $7.5 million and $7.2 million, if recognized, would favorably impact the effective income tax rate). As of December 31, 2009, the gross amount of unrecognized tax benefits (excluding interest) increased by an immaterial amount. It is expected that the unrecognized tax benefits may change in the next twelve months; however, due to Xstrata’s indemnification of us for tax obligations related to periods ending on or before the 2007 Apollo Acquisition date, we do not expect the change to have a significant impact on our results of operations or our financial position.
In April 2009, the Internal Revenue Service commenced an examination of our U.S. income tax return for 2006. As part of the Apollo Acquisition, Xstrata agreed to indemnify us for tax obligations related to periods ending on or before the 2007 Apollo Acquisition date. Therefore, we do not anticipate that the IRS examination will have a material impact on our consolidated financial statements.
Net income (loss). Net income was $101.4 million for the year ended December 31, 2009 compared to a $74.1 million loss for the year ended December 31, 2008.
Year ended December 31, 2008 compared to year ended December 31, 2009 discussion of segment results.
Primary aluminum products. Segment profit for the year ended December 31, 2008 was $222.7 million compared to segment profit of $4.9 million for the year ended December 31, 2009. The $217.8 million segment profit decrease during 2009 is primarily driven by lower shipments, declining LME aluminum prices, and the negative impact from the power outage, as average operating pots in operation were approximately 58%.
42
Table of Contents
Flat rolled products. Segment profit in the year ended December 31, 2008 was $28.5 million, compared to $35.1 million in the year ended December 31, 2009. The increase in segment profit relates to favorable product mix during 2009 partially offset by lower shipment volumes due to weakening end markets.
Corporate. Corporate costs in the year ended December 31, 2008 were $15.9 million compared to $28.4 million in the year ended December 31, 2009. The increase in corporate expenses is primarily a result of the Annual Incentive Plan pay-out to its executive officers, the Incentive Compensation pay-out to Corporate employees and an increase in Pension Expense.
A comparison of the year ended December 31, 2008 to the year ended December 31, 2009 for our bauxite and alumina refining segments is not meaningful, as we wholly-owned the bauxite mining operations and the alumina refinery for only four months in the year ended December 31, 2009 and none of the year ended December 31, 2008.
43
Table of Contents
Discussion of results for the year ended December 31, 2009 compared to the year ended December 31, 2010
The following table sets forth certain consolidated financial information for the year ended December 31, 2009 and 2010 (in millions, except per share data and where noted):
| Year ended December 31, | ||||||||
| 2009 | 2010 | |||||||
| Statements of operations data: |
||||||||
| Sales |
$ | 769.9 | $ | 1,294.9 | ||||
| Operating costs and expenses: |
||||||||
| Cost of sales |
779.9 | 1,113.4 | ||||||
| Selling, general and administrative expenses |
75.6 | 114.0 | ||||||
| Goodwill and other intangible asset impairment |
108.0 | — | ||||||
| Excess insurance proceeds |
(43.5 | ) | — | |||||
| 920.0 | 1,227.4 | |||||||
| Operating income (loss) |
(150.1 | ) | 67.5 | |||||
| Other expenses (income): |
||||||||
| Interest expense, net |
53.5 | 31.1 | ||||||
| Gain on hedging activities, net |
(111.8 | ) | (65.6 | ) | ||||
| Equity in net loss of investments in affiliates |
79.7 | — | ||||||
| (Gain) loss on debt repurchase |
(211.2 | ) | 0.1 | |||||
| Gain on business combination |
(120.3 | ) | — | |||||
| Total other (income) expenses |
(310.1 | ) | (34.4 | ) | ||||
| Income before income taxes |
160.0 | 101.9 | ||||||
| Income tax expense |
58.6 | 35.0 | ||||||
| Net income |
$ | 101.4 | $ | 66.9 | ||||
| Net income common per common share: |
||||||||
| Basic |
$ | 2.33 | $ | 1.30 | ||||
| Diluted |
$ | 2.33 | $ | 1.27 | ||||
| Weighted-average common shares outstanding: |
||||||||
| Basic |
43.53 | 51.56 | ||||||
| Diluted |
43.53 | 52.80 | ||||||
| Sales by segment: |
||||||||
| Bauxite |
$ | 34.6 | $ | 120.4 | ||||
| Alumina refining |
84.2 | 365.4 | ||||||
| Primary aluminum products |
340.3 | 621.3 | ||||||
| Flat rolled products |
408.4 | 521.4 | ||||||
| Eliminations |
(97.6 | ) | (333.6 | ) | ||||
| Total |
$ | 769.9 | $ | 1,294.9 | ||||
| Segment profit (loss): |
||||||||
| Bauxite |
$ | 12.3 | $ | 23.8 | ||||
| Alumina refining |
(2.3 | ) | 61.9 | |||||
| Primary aluminum products |
4.9 | 112.2 | ||||||
| Flat rolled products |
35.1 | 50.0 | ||||||
| Corporate |
(28.4 | ) | (26.9 | ) | ||||
| Eliminations |
(2.0 | ) | (4.9 | ) | ||||
| Total |
$ | 19.6 | $ | 216.1 | ||||
| Financial and other data: |
||||||||
| Average realized Midwest Transaction Price (per pound) |
$ | 0.81 | $ | 1.04 | ||||
| Net cash cost for primary aluminum products (per pound shipped) |
$ | 0.77 | $ | 0.70 | ||||
| Shipments: |
||||||||
| Third party shipments: |
||||||||
| Bauxite (kMts) |
482.9 | 1,738.0 | ||||||
| Alumina refining (kMts) |
245.0 | 683.6 | ||||||
| Primary aluminum products (pounds, in millions) |
291.4 | 438.8 | ||||||
| Flat rolled products (pounds, in millions) |
309.3 | 346.4 | ||||||
| Intersegment shipments: |
||||||||
| Bauxite (kMts) |
835.1 | 2,565.5 | ||||||
| Alumina refining (kMts) |
116.5 | 467.4 | ||||||
| Primary aluminum products (pounds, in millions) |
60.2 | 121.7 | ||||||
44
Table of Contents
Sales
Sales in the year ended December 31, 2009 were $769.9 million compared to $1,294.9 million in the year ended December 31, 2010, an increase of 68.2%.
Sales to external customers from our primary aluminum products segment increased 70.8% from $290.4 million in the year ended December 31, 2009 to $495.9 million in the year ended December 31, 2010, driven primarily by the increase in LME prices, higher volumes of value-added shipments related to increased end-market demand and higher sow volumes related to the New Madrid power outage in the prior year.
| • | A 28.4% increase in realized MWTP increased external primary aluminum products revenue by $80.0 million in the year ended December 31, 2010 compared to the year ended December 31, 2009. |
| • | A 50.6% increase in external primary aluminum shipments generated $139.7 million additional revenue comparing the year ended December 31, 2010 to the year ended December 31, 2009. This increase is largely the result of the New Madrid smelter becoming fully operational during first quarter 2010. Shipments of value-added products in the year ended December 31, 2010 were 45.7% higher than in the year ended December 31, 2009. |
| • | Revenues in the primary aluminum products segment for the year ended December 31, 2009 include $14.2 million related to quantities of excess alumina shipped to external customers from our New Madrid smelter. |
Sales to our external customers in our flat rolled products segment increased 27.6% from the year ended December 31, 2009 to $521.3 million in the year ended December 31, 2010, primarily due to the increase in LME prices, as well as higher shipments to external customers.
| • | Rising LME prices contributed $63.9 million to the sales increase. Fabrication premiums were relatively unchanged. |
| • | Higher shipment volumes increased revenues by $49.0 million. Shipment volumes from our flat rolled products segment increased 12.0% to 346.4 million pounds primarily due to higher end-market demand. |
Sales to external customers from our alumina refining and bauxite segments for the year ended December 31, 2010 were $222.8 million and $54.9 million, respectively. A comparison to 2009 is not meaningful, as we only wholly-owned the alumina and bauxite segments for four months during 2009.
Cost of sales
Cost of sales for the year ended December 31, 2009 was $779.9 million compared to $1,113.4 million in the year ended December 31, 2010. The increase in cost of sales is mainly the result of higher shipment volumes in the primary aluminum and flat rolled products segments, as well as the increase in LME prices, reflected in the pass-through nature of the flat rolled products segment.
| • | Total cost of sales in the primary aluminum products segment increased from $384.6 million in the year ended December 31, 2009 to $550.1 million in the year December 31, 2010. The increase relates to several factors, including the increase in total shipments of primary aluminum as referenced in the discussion of sales, offset by (i) decreased depreciation expense related to certain fixed assets which became fully-depreciated in the year ended December 31, 2009, and (ii) a significant reduction in our integrated net cash cost to produce primary aluminum of $0.70 per pound in the year ended December 31, 2010, compared to $0.77 per pound in the year December 31, 2009. This decrease in integrated net cash cost reflects efficiencies gained from bringing the smelter back to full capacity during the year ended December 31, 2010, as well as reduced raw materials inputs. |
| • | Flat rolled products segment cost of sales increased from $369.0 million in the year ended December 31, 2009 to $485.0 million in the year ending December 31, 2010. The increase related principally to the increase in the LME aluminum price, since much of that segment’s product cost represents the pass-through cost of metal. |
| • | Cost of sales in the bauxite and alumina refining segments, before the effects of intercompany eliminations, were $32.9 million and $91.1 million, respectively, during the year ended December 31, 2009. Cost of sales in the bauxite and alumina refining segments, before the effects of intercompany eliminations, totaled $94.0 million and $315.8 million, respectively during the year ended December 31, 2010. We became sole owner of these two segments on August 31, 2009. Cost of sales in the alumina refining segment for the year ended December 31, 2010 reflects a $4.5 million favorable cumulative impact of negotiations to reduce our maintenance obligations for ships transporting bauxite to Gramercy from St. Ann. |
Selling, general and administrative expenses
Selling, general and administrative expenses in the year ended December 31, 2009 were $75.6 million compared to $114.0 million in the year ended December 31, 2010. This change reflects (i) $17.4 million of increased costs from the inclusion of St. Ann and Gramercy since the Joint Venture Transaction, (ii) $7.6 million of costs related to our workforce and contract mining
45
Table of Contents
restructuring plans, (iii) $11.5 million in increased fees related primarily to the termination of the Apollo management agreement, (iv) $4.3 million in increased stock compensation costs, primarily associated with accelerated vesting in connection with the IPO, and (v) $5.5 million of increased consulting costs and professional fees, which were primarily transaction-related legal fees. The cost increases were partially offset by CORE productivity savings and $3.3 million of reduced losses on fixed asset disposals.
Goodwill and other intangible asset impairment
We recorded $108.0 million of goodwill and other intangible asset impairments related to our flat rolled products segment in the year ended December 31, 2009. No goodwill impairment was recorded during the year ended December 31, 2010.
Excess insurance proceeds
We reached an insurance settlement with our primary insurance carrier in the year ended December 31, 2009. The settlement proceeds of $67.5 million were allocated to cost of sales and selling, general and administrative expenses to the extent losses were realized and eligible for recovery under our insurance policies. The line item titled “Excess insurance proceeds” reflects the residual after applying the total proceeds recognized against losses incurred through September 30, 2009. This amount is not intended to represent a gain on the insurance claim, but only a timing difference between proceeds recognized and claim related costs incurred.
Operating income (loss)
Operating loss in the year ended December of 2009 was $150.1 million compared to operating income of $67.5 million in the year ended December 31, 2010. The increase in operating income relates to sales margin improvements of $191.5 million, offset in part by $38.4 million increase in selling, general and administrative expenses discussed previously.
Sales margin was a loss of $10.0 million for the year ended December 31, 2009 compared to income of $181.5 million the year ended December 31, 2010. This increase resulted from the impact of a 28.4% increase in realized MWTP, coupled with efficiencies gained in bringing the smelter back to full production.
Interest expense, net
Interest expense in the year ended December 31, 2009 was $53.5 million compared to $31.1 million in the year ended December 31, 2010, a decrease of $22.4 million. During the year ended December 31, 2010 we used net proceeds from our completed IPO, our follow-on offering, proceeds from the termination of fixed price aluminum swaps and available cash balances and to repay $249.9 million and $215.9 million of aggregate principal balances on the term B loan and revolving credit facility, respectively, and to repurchase $66.3 million and $20.6 million aggregate principal balance of our HoldCo Notes and AcquisitionCo Notes, respectively. The $22.4 million decrease in interest expense is primarily a result of these lower average debt balances.
Gain on hedging activities, net
Gain on hedging activities was $111.8 million in the year ended December 31, 2009 compared to $65.6 million in the year ended December 31, 2010. Reclassifications of aluminum and natural gas hedge gains and losses from accumulated other comprehensive income into earnings in 2010 were $80.3 million, compared to $172.2 million in the year ended December 31, 2009. Of this amount in 2009, $77.8 million was reclassified into earnings related to the January 2009 de-designation of our then remaining fixed price aluminum swaps because it was probable that the original forecasted transactions would not occur.
Gain on debt repurchase
During the year ended December 31, 2010 we used net proceeds from our completed IPO, our December 2010 follow-on public offering, available cash balances and proceeds from the termination of fixed price aluminum swaps to repay $249.9 million and $215.9 million of aggregate principal balances on the term B loan and revolving credit facility, respectively, and to repurchase $66.3 million and $20.6 million aggregate principal balance of our HoldCo Notes and AcquisitionCo Notes, respectively. The 2010 debt repurchases resulted in a $0.1 million net loss. During the year ended December 31, 2009, we repurchased $161.9 million and $194.5 million aggregate principal balance of our HoldCo and AcquisitionCo notes, respectively, at discounts to face value and repaid $65.4 million and $9.1 million of outstanding principal balance on the term B loan and revolving credit facility borrowings, respectively. The 2009 debt repurchases resulted in a $211.2 million net gain.
46
Table of Contents
Income before income taxes
Income before income taxes was $160.0 million in the year ended December 31, 2009 compared to $101.9 million in the year ended December 31, 2010. The special items outlined below significantly impacted the comparability of our pre-tax income (in millions):
| Year ended December 31, | ||||||||
| 2009 | 2010 | |||||||
| $ | $ | |||||||
| Increase (decrease) to income before income taxes for special items: |
||||||||
| Insurance recoveries in excess of costs and losses |
43.5 | — | ||||||
| Management agreement termination |
— | (12.5 | ) | |||||
| Modification of stock options |
— | (3.2 | ) | |||||
| Other transaction related legal costs |
— | (5.5 | ) | |||||
| Restructuring |
— | (7.6 | ) | |||||
| Gain (loss) on debt repurchases |
211.2 | (0.1 | ) | |||||
| Gain on business combination |
120.3 | — | ||||||
| Joint venture impairment |
(80.3 | ) | — | |||||
| Executive separation agreement |
— | (3.3 | ) | |||||
| Goodwill and other intangible asset impairment |
(108.0 | ) | — | |||||
| Gain on hedging activities |
111.8 | 65.6 | ||||||
| Total |
298.5 | 33.4 | ||||||
Income tax expense
Income tax expense was $58.6 million in the year ended December 31, 2009, compared to $35.0 million in the year ended December 31, 2010.
The effective tax rate for the year ended December 31, 2009 was primarily impacted by goodwill impairment, state income taxes, equity method investee income and bargain purchase accounting. The effective tax rate for the year ended December 31, 2010 was primarily impacted by state income taxes, the Internal Revenue Code Section 199 manufacturing deduction, and accrued interest related to unrecognized tax benefits.
Net income
Net income was $101.4 million in the year ended December 31, 2009, compared to $66.9 million in the year ended December 31, 2010. The decrease in net income resulted from the net effects of (i) reductions in other income, specifically, a $46.2 million reduction in gains on hedging activities, a $211.3 million reduction in gains on debt repurchases and the prior year $120.3 million gain on business combination, offset by (ii) favorable impacts of $217.6 million of increased operating income, $80.3 million of prior year impairment losses on our investment in affiliates and $46.0 million in reduced interest and income tax expenses.
Year ended December 31, 2009 compared to year ended December 31, 2010 discussion of segment results.
Primary aluminum products. Segment profit in the year ended December 31, 2009 was $4.9 million compared to segment profit of $112.2 million in the year ended December 31, 2010. Segment profit in the year ended December 31, 2010 reflects increases in LME prices, higher volumes of value-added shipments related to increased end-market demand and lower net cash costs to produce aluminum. The year ended December 31, 2009 segment results reflect the negative impact from the power outage, as average pots in operation were only approximately 58%.
Flat rolled products. Segment profit in the year ended December 31, 2009 was $35.1 million, compared to $50.0 million in the year ended December 31, 2010. Shipment volumes from our flat rolled products segment increased 12.0% to 346.4 million pounds primarily due to higher end-market demand along with increased efficiencies associated with higher production.
Corporate. Corporate costs in the year ended December 31, 2009 were $28.4 million, compared to $26.9 million in the year ended December 31, 2010 due to variability in legal and consulting fees.
Bauxite and Alumina. Segment profit for the bauxite segment in the year ended December 31, 2009 was $12.3 million, compared to $23.8 million in the year ended December 31, 2010. Segment loss for the alumina refining segment in the year ended December 31, 2009 was $2.3 million, compared to segment profit of $61.9 million in the year ended December 31, 2010. A comparison of the year ended December 31, 2009 to the year ended December 31, 2010 for our bauxite and alumina refining segments is not meaningful, as we only wholly-owned the bauxite mining operations and the alumina refinery for four months in the year ended December 31, 2009.
47
Table of Contents
Liquidity and Capital Resources
Our primary sources of liquidity are cash provided by operating activities, available borrowings under our revolving credit facility and cash on hand. Our main continuing liquidity requirements are to finance working capital, capital expenditures and acquisitions, and debt service.
As of December 31, 2009 and 2010, our total indebtedness was as follows (in millions):
| As of December 31, | ||||||||
| 2009 | 2010(1) | |||||||
| $ | $ | |||||||
| Noranda HoldCo: |
||||||||
| Senior Floating Rate Notes due 2014 |
63.6 | — | ||||||
| Noranda AcquisitionCo: |
||||||||
| Term B loan due 2014 |
328.1 | 78.2 | ||||||
| Senior Floating Rate Notes due 2015 |
344.1 | 341.5 | ||||||
| Revolving credit facility |
215.9 | — | ||||||
| Total debt |
951.7 | 419.7 | ||||||
| (1) | On May 14, 2010, Moody’s Investors Service upgraded Noranda’s Corporate Family Rating and Probability of Default Rating to B2 from B3. Moody’s issue level ratings for Noranda were revised as follows: Noranda AcquisitionCo senior secured revolver and senior secured term loan ratings were moved to Ba3 from B1 and its senior unsecured notes due 2014 rating was moved to B3 from Caa1. Noranda’s rating outlook was upgraded by Moody’s to “positive” on January 25, 2010. On June 11, 2010, Standard and Poor’s upgraded Noranda’s Corporate rating to B. S&P’s issue level ratings for Noranda were revised as follows: Noranda AcquisitionCo senior secured revolver and senior secured term loan ratings were moved to B+ from B and its senior unsecured notes rating was upgraded to CCC+ from CCC. Noranda’s rating outlook was upgraded by S&P to “positive” on March 17, 2010. A future downgrade of any of these ratings could have an adverse effect on our liquidity. |
Based on the amount of indebtedness outstanding and interest rates as of December 31, 2010, our annualized cash interest expense is approximately $16.7 million, all of which represents interest expense on floating-rate obligations (and thus is subject to increase in the event interest rates rise), prior to any consideration of the impact of interest rate swaps. We issued additional indebtedness as payment for our interest due May 15, 2010 and November 15, 2010 under our bond indentures. Further, we have notified the trustee for bondholders of the AcquisitionCo Notes of our election to pay the May 15, 2011 interest payments estimated to be approximately $8.9 million by issuing additional indebtedness. For any period subsequent to May 15, 2011, Noranda AcquisitionCo must pay all interest in cash.
We may borrow additional amounts under our revolving credit facility to fund our working capital, capital expenditure and other corporate and strategic needs. As of December 31, 2009, of our revolving credit facility’s $242.7 million borrowing capacity, we had a drawn balance of $215.9 million and outstanding letters of credit of $26.1 million, resulting in $0.7 million available for borrowing under the facility. In 2010, we used available cash balances, $82.9 million of IPO proceeds, $164.6 million of proceeds from our remaining hedge terminations, and $123.1 million of proceeds from our follow-on public offering to repay $215.9 million of our revolving credit facility and $249.9 million of term B loan borrowings and to repurchase $66.3 million principal balance of our HoldCo Notes and $20.6 million principal balance of our AcquisitionCo Notes. As of December 31, 2010, we have approximately $33.8 million of cash and cash equivalents and $215.2 million of available borrowing capacity under our revolving credit facility.
Our ability to make scheduled payments of principal, to pay interest on, or to refinance our indebtedness, or to fund planned capital expenditures, will depend on our ability to generate cash in the future. This ability is, to a certain extent, subject to general economic, financial, competitive, legislative, regulatory and other factors that are beyond our control.
Based on our current level of operations, we believe that cash flow from operations and available cash will be adequate to meet our short-term liquidity needs. We cannot be assured, however, that our business will generate sufficient cash flow from operations, that future borrowings will be available to us under our senior secured credit facilities in an amount sufficient to enable us to pay our indebtedness or to fund our other liquidity needs. In addition, upon the occurrence of certain events, such as a change of control, we could be required to repay or refinance our indebtedness.
Discussion of certain historical cash flow information for the years ended December 31, 2008 and 2009
The following table sets forth certain historical condensed consolidated financial information for the years ended 2008 and 2009 (in millions):
| Year ended December 31, | ||||||||
| 2008 | 2009 | |||||||
| $ | $ | |||||||
| Cash provided by operating activities |
65.5 | 220.5 | ||||||
| Cash used in investing activities |
(51.1 | ) | (24.0 | ) | ||||
| Cash provided by (used in) financing activities |
94.7 | (214.0 | ) | |||||
| Change in cash and cash equivalents |
109.1 | (17.5 | ) | |||||
48
Table of Contents
Operating activities provided a total of $220.5 million of cash in the year ended December 31, 2009 compared to $65.5 million in the year ended December 31, 2008. Cash provided by operating activities in the year ended December 31, 2009 reflected $120.8 million of proceeds from hedge terminations under our hedge settlement agreement with Merrill Lynch and $21.2 million from reduction of working capital. Additionally, during 2009, we contributed $25.3 million to our pension plans and OPEB plans in order to maintain an Adjusted Funding Target Attainment Percentage (AFTAP) under the Pension Protection Act of 2006 of 80%.
Investing activities used $24.0 million of cash during the year ended December 31, 2009, compared to $51.1 million of cash used during the year ended December 31, 2008. Capital expenditures amounted to $46.7 million in 2009 and $51.7 million in 2008. This amount is offset in 2009 by $11.1 million of cash acquired during the Joint Venture Transaction. Additionally, $11.5 million of our capital spending in 2009 was related to the New Madrid restart and funded with insurance proceeds.
Financing activities: In late September 2008, in light of concerns about instability in the financial markets and general business conditions, in order to preserve our liquidity, we borrowed $225 million under the revolving portion of our senior secured credit facilities and invested the proceeds in highly liquid cash equivalents, including U.S. Government treasury bills and money market funds holding only U.S. Government treasury securities, with the remainder held in our bank accounts. During 2009, our financing cash flows mainly reflected debt reduction. We utilized net proceeds from our hedge settlement agreement to repurchase $403.8 million aggregate principal amount of our HoldCo Notes, AcquisitionCo Notes, term B loan and revolving credit facility for a total price of $187.2 million (plus transaction fees). Additionally, we made a required $24.5 million repayment of our term B loan and repaid $2.5 million of borrowings under our revolving credit facility.
On May 15, 2009 and November 15, 2009, we issued $19.9 million and $14.6 million, respectively, in additional Notes in payment of Payment-in-Kind (“PIK”) interest due on the HoldCo Notes and AcquisitionCo Notes. On May 15, 2010, we issued $11.3 million in additional Notes in payment of PIK interest due on the HoldCo and AcquisitionCo Notes. On November 15, 2010, we issued $8.9 million in additional AcquisitionCo Notes in payment of PIK interest due. Further, we have notified the trustee for bondholders of the AcquisitionCo Notes of our election to pay the May 15, 2011 interest payments by issuing additional indebtedness.
In June 2008, we paid a $102.2 million dividend to our common stockholders.
Discussion of certain historical cash flow information for the years ended December 31, 2009 and 2010
The following table sets forth consolidated cash flow information for the periods indicated (in millions):
| Year ended December 31, | ||||||||
| 2009 | 2010 | |||||||
| $ | $ | |||||||
| Cash provided by operating activities |
220.5 | 270.9 | ||||||
| Cash used in investing activities |
(24.0 | ) | (61.1 | ) | ||||
| Cash used in financing activities |
(214.0 | ) | (343.2 | ) | ||||
| Change in cash and cash equivalents |
(17.5 | ) | (133.4 | ) | ||||
Operating activities
Cash provided by operating activities in the year ended December 31, 2010 reflected $164.6 million of proceeds from hedge terminations under our hedge settlement agreement with Merrill Lynch, offset by $32.6 million from increases in working capital due to the increased level of volume and the smelter becoming fully operational.
We contributed $25.3 million and $21.3 million to our pension/OPEB plans in 2009 and 2010, respectively, in order to maintain an Adjusted Funding Target Attainment Percentage (“AFTAP”) under the Pension Protection Act of 2006 of 80%. Required pension plan contributions approximate $19.3 million in 2011; although we may elect to make additional contributions. Additionally, in 2010, we made a $10.0 million tax prepayment in connection with the finalization of the GOJ agreement.
Investing activities
Capital expenditures amounted to $46.7 million in the year ended December 31, 2009 and $61.3 million in the year ended December 31, 2010.
| • | Purchases of property, plant and equipment accrued in accounts payable and not yet paid were $6.3 million for the year ended December 31, 2010 and are not reflected as capital expenditures on the statements of cash flows. |
| • | During the global economic contraction, we reduced our capital expenditures to critical maintenance activities and costs associated with bringing the smelter back to full capacity. Of our capital spending in the year ended December 31, 2009, $11.5 million was related to the New Madrid restart, all of which was funded with insurance proceeds. |
| • | During third quarter 2010, we announced that we had initiated steps to complete a $38 million capital project at our New Madrid smelter facility. During fourth quarter 2010, we invested approximately $1.1 million toward the expansion project. We expect the project to increase the smelter’s annual metal production by approximately 35 million pounds during |
49
Table of Contents
| 2013. We anticipate the capital spending will be spread primarily over 2011, 2012, and 2013 and do not expect additional capacity on-line until 2013. |
| • | During fourth quarter 2010, we began an $8.0 million port expansion project at our bauxite facility in Jamaica. The project will allow us to increase shipping volumes and lower our costs, while supporting the new contract with our third party bauxite customer. We spent approximately $2.0 million on the port expansion during fourth quarter 2010 and expect to conclude the project during first quarter 2011. |
| • | Excluding these two growth projects, our capital spending totaled $58 million for 2010, which is in line with our typical expectations of spending $60 - 65 million a year on maintenance capital expenditures. |
Financing activities
During the year ended December 31, 2010, our financing cash flows mainly reflected debt reduction and issuance of common stock. Through December 31, 2010 we used available cash balances, $206.0 million of proceeds from issuance of common stock and $164.6 million of proceeds from our remaining hedge terminations to repay $249.9 million of term B loan borrowings and to repurchase $66.3 million principal balance of our HoldCo Notes and $20.6 million principal balance of our AcquisitionCo Notes for an aggregate reacquisition price of $333.4 million. We also repaid $215.9 million of our revolving credit facility at face value.
In 2010, AcquisitionCo and HoldCo issued a total of $18.0 million and $2.3 million in AcquisitionCo Notes and HoldCo Notes, respectively, as payment for PIK interest. Additionally, we have made a permitted election under the indentures governing our AcquisitionCo Notes, to pay all interest due thereunder on May 15, 2011, entirely in PIK interest.
Description of Certain Indebtedness
We summarize below the principal terms of the agreements that govern the senior secured credit facilities and certain hedging arrangements with Merrill Lynch International, as well as our Notes. This summary is not a complete description of all of the terms of the relevant agreements. Copies of the senior secured credit facilities and the indentures governing the Notes have been filed with the SEC.
Senior secured credit facilities
Noranda AcquisitionCo is a party to senior secured credit facilities, as follows:
| • | a term B loan that matures in May 2014 with an original principal amount of $500.0 million, of which $78.2 million remained outstanding as of December 31, 2010. |
| • | a $250.0 million revolving credit facility that matures in May 2013, which includes borrowing capacity available for letters of credit and for borrowing on same-day notice. We had no outstanding balance under the revolving credit facility at December 31, 2010. As a result of the revolving credit facility repurchase in 2009, our maximum borrowing capacity was reduced $7.3 million from $250.0 million to $242.7 million. As of December 31, 2010, we have $215.2 million available for borrowing, which is net of $27.5 million outstanding letters of credit. |
The senior secured credit facilities permit Noranda AcquisitionCo to incur incremental term and revolving loans under such facilities in an aggregate principal amount of up to $200.0 million. Incurrence of such incremental indebtedness under the senior secured credit facilities is subject to, among other things, Noranda AcquisitionCo’s compliance with a maximum senior secured net debt to Adjusted EBITDA ratio (in each case as defined in the credit agreement governing our senior secured credit facilities) of 3.0 to 1.0. As of December 31, 2010, our Senior Secured Net Debt to Adjusted EBITDA ratio was 0.2 to 1.0. Noranda AcquisitionCo has no commitments from any lender to provide such incremental loans.
The senior secured credit facilities are guaranteed by us and by all of the existing and future direct and indirect wholly owned domestic subsidiaries of Noranda AcquisitionCo that are not designated as “unrestricted” under the senior secured credit facilities. These guarantees are full and unconditional. NHB Capital LLC (“NHB”), in which we have a 100% ownership interest, is the only unrestricted subsidiary and the only domestic subsidiary that has not guaranteed these obligations. The senior secured credit facilities are secured by first priority pledges of all of the equity interests in Noranda AcquisitionCo and all of the equity interests in each of the existing and future direct and indirect wholly owned domestic subsidiaries of Noranda AcquisitionCo other than subsidiaries of unrestricted subsidiaries. The senior secured credit facilities are also secured by first priority security interests in substantially all of the assets of Noranda AcquisitionCo, as well as those of each of our existing and future direct and indirect wholly owned domestic subsidiaries that have guaranteed the senior secured credit facilities.
Term B loan
Interest on the loan is based either on LIBOR or the prime rate, at Noranda AcquisitionCo’s election, in either case plus an applicable margin (1.75% over LIBOR at December 2010) that depends upon the ratio of Noranda AcquisitionCo’s Senior Secured Net Debt to EBITDA (in each case as defined in the credit agreement governing the term B loan). The interest rate at December 31, 2010 was 2.01%. Interest on the term B loan is payable no less frequently than every six months and such loan amortizes at a rate of 1% per annum.
50
Table of Contents
Noranda AcquisitionCo is required to prepay amounts outstanding under the credit agreement based on an amount equal to 50% of our Excess Cash Flow (as calculated in accordance with the terms of the credit agreement governing the term B loan) within 95 days after the end of each fiscal year. The required percentage of Noranda AcquisitionCo’s Excess Cash Flow payable to the lenders under the credit agreement governing the term B loan may be reduced from 50% to either 25% or 0% based on Noranda AcquisitionCo’s Senior Secured Net Debt to EBITDA ratio (in each case as defined in the credit agreement governing the term B loan) or the principal amount of term B loan that has been repaid. During 2010, Noranda AcquisitionCo made a mandatory prepayment of $7.5 million and optional prepayments of $242.4 million using available cash balances, proceeds from issuance of common shares and hedge termination proceeds. No mandatory prepayments are due in 2011 pursuant to the cash flow sweep provisions of the credit agreement.
Revolving credit facility
Interest on the revolving credit facility is based either on LIBOR or the prime rate, at Noranda AcquisitionCo’s election, in either case plus an applicable margin (1.75% over LIBOR at December 31, 2010) that depends upon the ratio of Noranda AcquisitionCo’s Senior Secured Net Debt to EBITDA (in each case as defined in the applicable credit facility) and is payable at least quarterly.
In addition to paying interest on outstanding principal under the revolving credit facility, Noranda AcquisitionCo is required to pay:
| • | a commitment fee to the lenders under the revolving credit facility in respect of unutilized commitments at a rate equal to 0.5% per annum subject to step down if certain financial thresholds are met, presently 0.38% at December 31, 2010; and |
| • | additional fees related to outstanding letters of credit under the revolving credit facility at a rate equal to the margin applicable to loans under the revolving credit facility, presently 1.75% per annum at December 31, 2010. |
Certain covenants
We have no financial maintenance covenants on any borrowings. Certain covenants contained in our debt agreements governing our senior secured credit facilities and the indentures governing our Notes restrict our ability to take certain actions if we are unable to meet certain ratios of Adjusted EBITDA to Fixed Charges and Senior Secured Net Debt to Adjusted EBITDA. These actions include incurring additional secured or unsecured debt, expanding borrowings under existing term loan facilities, paying dividends, engaging in mergers, acquisitions and certain other investments and retaining proceeds from asset sales. We met all financial ratio thresholds as of December 31, 2010.
In addition to the restrictive covenants described above, upon the occurrence of certain events, such as a change of control, our debt agreements could require that we repay or refinance our indebtedness.
Noranda AcquisitionCo Notes
In addition to the senior secured credit facilities, on May 18, 2007, Noranda AcquisitionCo issued $510.0 million senior floating rate notes due 2015. The AcquisitionCo Notes mature on May 15, 2015. Through May 15, 2011, Noranda AcquisitionCo may elect to pay interest: (i) entirely in cash, (ii) by increasing the principal amount of the AcquisitionCo Notes by paying interest entirely in kind (“PIK interest”) or (iii) 50% in cash and 50% in AcquisitionCo PIK Notes interest. We have notified the trustee for the AcquisitionCo Note bondholders of our election to pay the May 15, 2011 interest payment entirely in kind. For any subsequent period after May 15, 2011, Noranda AcquisitionCo must pay all interest in cash. The AcquisitionCo Notes cash interest accrues at six-month LIBOR plus 4.0% per annum, reset semi-annually, and the AcquisitionCo PIK interest, if any, will and accrue at six-month LIBOR plus 4.75% per annum, reset semi-annually. The PIK interest rate at December 31, 2009 and 2010 was 5.27% and 5.19%, respectively.
The AcquisitionCo Notes are fully and unconditionally guaranteed on a senior unsecured, joint and several basis by the existing and future wholly owned domestic subsidiaries of Noranda AcquisitionCo that guarantee the senior secured credit facilities. NHB and St. Ann are not guarantors of the senior secured credit facilities and, are not guarantors of the AcquisitionCo Notes. Noranda HoldCo fully and unconditionally guarantees the AcquisitionCo Notes on a joint and several basis with the subsidiary guarantors. The guarantee by Noranda HoldCo is not required by the indenture governing the AcquisitionCo Notes and may be released by Noranda HoldCo at any time. Noranda HoldCo has no independent operations or any assets other than its interest in Noranda AcquisitionCo. Noranda AcquisitionCo is a wholly owned finance subsidiary of Noranda HoldCo with no operations independent of its subsidiaries.
In 2009 and 2010, we issued the following amounts of AcquisitionCo Notes as AcquisitionCo PIK interest due (in millions):
| AcquisitionCo Notes issued as PIK interest |
||||
| $ | ||||
| May 15, 2009 |
16.6 | |||
| November 15, 2009 |
11.9 | |||
| May 15, 2010 |
9.1 | |||
| November 15, 2010 |
8.9 | |||
51
Table of Contents
If the AcquisitionCo Notes would otherwise constitute applicable high yield discount obligations (“AHYDO”) within the meaning of applicable U.S. federal income tax law, Noranda AcquisitionCo will be required to make mandatory principal redemption payments in cash at such times and in such amounts as is necessary to prevent the AcquisitionCo Notes from being treated as an AHYDO.
The indenture governing the AcquisitionCo Notes limits Noranda AcquisitionCo’s and its subsidiaries’ ability, among other things, to (i) incur additional indebtedness; (ii) declare or pay dividends or make other distributions or repurchase or redeem our capital stock; (iii) make investments; (iv) sell assets, including capital stock of restricted subsidiaries; (v) enter into agreements restricting our subsidiaries’ ability to pay dividends; (vi) consolidate, merge, sell or otherwise dispose of all or substantially all of our assets; (vii) enter into transactions with our affiliates; and (viii) incur liens.
During third quarter 2010, we repurchased $20.6 million principal balance of AcquisitionCo Notes. As of December 31, 2010, we had $341.5 million in principal amount of AcquisitionCo Notes outstanding.
Noranda HoldCo Notes
On June 7, 2007, Noranda HoldCo issued senior floating rate notes due 2014 in aggregate principal amount of $220.0 million, with a discount of 1.0% of the principal amount. During second quarter 2010, we used a portion of the proceeds from our IPO to repurchase and retire all outstanding HoldCo Notes. While the HoldCo Notes were outstanding, Noranda HoldCo had the option to pay interest: (i) entirely in cash, (ii) in HoldCo Notes PIK interest or (iii) 50% in cash and 50% in HoldCo Notes PIK interest. The PIK interest rate was 7.02% at December 31, 2009.
In 2009 and 2010, we issued the following amounts of HoldCo Notes as HoldCo PIK interest due (in millions):
| HoldCo Notes issued
as PIK interest |
||||
| $ | ||||
| May 15, 2009 |
3.3 | |||
| November 15, 2009 |
2.7 | |||
| May 15, 2010 |
2.3 | |||
Debt repurchase
For the year ended December 31, 2008, we made a mandatory prepayment of our term B loan of $30.3 million at face value and recorded a loss on debt repurchase of $1.2 million related entirely to the write-off of the HoldCo Notes unamortized debt discount.
For the year ended December 31, 2009, we repaid $65.4 million and $9.1 million of aggregate principal balances on the term B loan and revolving credit facility, respectively, and we repurchased $161.9 million and $194.5 million aggregate principal balance of our HoldCo Notes and AcquisitionCo Notes, respectively. The aggregate carrying amount of $426.5 million was repurchased or repaid for $215.3 million, including fees, resulting in a gain on debt repurchase of $211.2 million for the year ended December 31, 2009.
For the year ended December 31, 2010, we repaid $249.9 million and $215.9 million of aggregate principal balances on the term B loan and revolving credit facility, respectively, and we repurchased $66.3 million and $20.6 million aggregate principal balance of our HoldCo Notes and AcquisitionCo Notes, respectively. The aggregate carrying amount of $549.2 million was repurchased or repaid for $549.3 million, resulting in a loss on debt repurchase of $0.1 million for the year ended December 31, 2010.
Covenant compliance and financial ratios
Upon the occurrence of certain events, such as a change of control, we could be required to repay or refinance our indebtedness. In addition, certain covenants contained in our debt agreements restrict our ability to take certain actions (including incurring additional secured or unsecured debt, expanding borrowings under existing term loan facilities, paying dividends and engaging in mergers, acquisitions and certain other investments) unless we meet certain standards in respect of the ratio of our Adjusted EBITDA, calculated on a trailing four-quarter basis, to our fixed charges (the “fixed-charge coverage ratio”) or the ratio of our senior secured net debt to our Adjusted EBITDA, calculated on a trailing four-quarter basis (the “net senior secured leverage ratio”). Furthermore, our ability to take certain actions, including paying dividends and making acquisitions and certain other investments, depends on the amounts available for such actions under the applicable covenants, which amounts accumulate with reference to our Adjusted EBITDA, and in some cases our net income, on a quarterly basis. We meet all financial ratio thresholds as of December 31, 2010.
52
Table of Contents
The minimum or maximum ratio levels set forth in our covenants as conditions to our undertaking certain actions and our actual performance are summarized below:
| Financial ratio relevant to covenants |
Covenant threshold | Actual as of December 31, | ||||||||||||||
| 2009(1) | 2010 | |||||||||||||||
| Noranda HoldCo: |
||||||||||||||||
| Senior Floating Rate Notes due 2014 (2) |
|
Fixed Charge Coverage Ratio |
|
|
Minimum 1.75 to 1.0 |
|
1.6 to 1 | — | ||||||||
| Noranda AcquisitionCo: |
||||||||||||||||
| Senior Floating Rate Notes due 2015 (3) |
|
Fixed Charge Coverage Ratio |
|
|
Minimum 2.0 to 1.0 |
|
2.1 to 1 | 6.3 to 1 | ||||||||
| Term B loan and revolving credit facility leverage ratio (4) |
|
Net Senior Secured Leverage Ratio |
|
|
Maximum 3.0 to 1.0 |
|
3.5 to 1 | 0.2 to 1 | ||||||||
| (1) | For purposes of measuring Adjusted EBITDA in order to compute the ratios, pro forma effect is given to the Joint Venture Transaction as if it had occurred at the beginning of the trailing four-quarter period. Fixed charges are the sum of consolidated interest expenses and all cash dividend payments in respect of preferred stock. In measuring interest expense for the ratio, pro forma effect is given to any repayment or issuance of debt as if such transaction occurred at the beginning of the trailing four-quarter period. For Noranda HoldCo and Noranda AcquisitionCo, the pro forma impact of the Joint Venture Transaction on Adjusted EBITDA for the four quarters ended December 31, 2009 was $15.6 million. |
| (2) | During second quarter 2010, we repurchased all outstanding HoldCo Notes; therefore, the ratio as of December 31, 2010 is not included. For Noranda HoldCo, fixed charges on a pro forma basis (giving effect to debt repayments) for the four quarters ended December 31, 2009 were $72.0 million. |
| (3) | For Noranda AcquisitionCo, fixed charges on a pro forma basis (giving effect to debt repayments) for the four quarters ended December 31, 2009 and December 31, 2010 were $53.9 million and $36.1 million, respectively. |
| (4) | As used in calculating this ratio, “senior secured net debt” means the amount outstanding under our term B loan and the revolving credit facility, plus other first-lien secured debt (of which we have none as of December 31, 2009), less “unrestricted cash” and “permitted investments” (as defined under our senior secured credit facilities). At December 31, 2009, senior secured debt was $544.0 million and unrestricted cash and permitted investments aggregated $145.8 million, resulting in senior secured net debt of $398.2 million. At December 31, 2010, senior secured debt was $78.2 million and unrestricted cash and permitted investments were $26.5 million, resulting in senior secured net debt of $51.7 million. |
Our debt agreements do not require us to maintain any financial performance metric or ratio in order to avoid a default.
As used herein, “Adjusted EBITDA” (which is defined as “EBITDA” in our debt agreements) means net income before income taxes, net interest expense and depreciation and amortization, adjusted to eliminate related party management fees, business optimization expenses and restructuring charges, certain charges resulting from the use of purchase accounting and other specified items of income or expense.
Adjusted EBITDA is not a measure of financial performance under U.S. GAAP, and may not be comparable to similarly titled measures used by other companies in our industry. Adjusted EBITDA should not be considered in isolation from or as an alternative to net income, income from continuing operations, operating income or any other performance measures derived in accordance with U.S. GAAP. Adjusted EBITDA has limitations as an analytical tool and you should not consider it in isolation or as a substitute for analysis of our results as reported under U.S. GAAP. For example, Adjusted EBITDA excludes certain tax payments that may represent a reduction in cash available to us; does not reflect any cash requirements for the assets being depreciated and amortized that may have to be replaced in the future; does not reflect capital cash expenditures, future requirements for capital expenditures or contractual commitments; does not reflect changes in, or cash requirements for, our working capital needs; and does not reflect the significant interest expense, or the cash requirements necessary to service interest or principal payments, on our indebtedness. Adjusted EBITDA also includes incremental stand-alone costs and adds back non-cash hedging gains and losses, and certain other non-cash charges that are deducted in calculating net income. However, these are expenses that may recur, vary greatly and are difficult to predict. In addition, certain of these expenses can represent the reduction of cash that could be used for other corporate purposes. You should not consider our Adjusted EBITDA as an alternative to operating or net income, determined in accordance with U.S. GAAP, as an indicator of our operating performance, or as an alternative to cash flows from operating activities, determined in accordance with U.S. GAAP, as an indicator of our cash flows or as a measure of liquidity.
53
Table of Contents
The following table reconciles Adjusted EBITDA to net income (loss) for the periods presented (in millions):
| Twelve months ended December 31, | ||||||||||||
| 2008 | 2009 | 2010 | ||||||||||
| $ | $ | $ | ||||||||||
| Adjusted EBITDA |
234.9 | 98.3 | 226.1 | |||||||||
| LIFO/LCM(a) |
(25.0 | ) | 17.4 | 0.4 | ||||||||
| Loss on disposal of assets |
(8.5 | ) | (7.3 | ) | (4.0 | ) | ||||||
| Non-cash pension, accretion and stock compensation |
(9.8 | ) | (10.8 | ) | (14.9 | ) | ||||||
| Restructuring, relocation and severance |
(8.3 | ) | (2.8 | ) | (11.9 | ) | ||||||
| Consulting and sponsor fees |
(10.2 | ) | (5.8 | ) | (18.9 | ) | ||||||
| Interest rate swaps |
(6.0 | ) | (11.9 | ) | (11.0 | ) | ||||||
| Gain (loss) on debt repurchases |
(1.2 | ) | 211.2 | (0.1 | ) | |||||||
| New Madrid power outage(b) |
— | 30.6 | — | |||||||||
| Charges/fees related to early extinguishment of derivatives |
— | (17.9 | ) | (9.0 | ) | |||||||
| Non-cash derivative gains and losses(c)(d) |
(47.0 | ) | 86.1 | 73.2 | ||||||||
| Goodwill and other intangible asset impairment |
(25.5 | ) | (108.0 | ) | — | |||||||
| Joint venture impairment |
— | (80.3 | ) | — | ||||||||
| Gain on business combination |
— | 120.3 | — | |||||||||
| Joint venture EBITDA(e) |
(13.2 | ) | (8.0 | ) | — | |||||||
| Purchase accounting and other(f) |
(0.9 | ) | (11.0 | ) | 1.8 | |||||||
| Depreciation and amortization |
(98.3 | ) | (86.6 | ) | (98.7 | ) | ||||||
| Interest expense, net |
(88.0 | ) | (53.5 | ) | (31.1 | ) | ||||||
| Income tax expense (benefit) |
32.9 | (58.6 | ) | (35.0 | ) | |||||||
| Net income (loss) |
(74.1 | ) | 101.4 | 66.9 | ||||||||
The following table reconciles Adjusted EBITDA to cash flow from operating activities for the periods presented (in millions):
| Twelve months ended December 31, | ||||||||||||
| 2008 | 2009 | 2010 | ||||||||||
| $ | $ | $ | ||||||||||
| Adjusted EBITDA |
234.9 | 98.3 | 226.1 | |||||||||
| Settlements from hedge terminations, net |
— | 120.8 | 164.6 | |||||||||
| Insurance proceeds applied to capital expenditures |
— | (11.5 | ) | — | ||||||||
| Equity in net income of investment in affiliates |
(7.7 | ) | (0.7 | ) | — | |||||||
| Stock compensation expense |
2.4 | 1.5 | 5.9 | |||||||||
| Changes in other assets |
7.5 | 0.9 | (10.0 | ) | ||||||||
| Changes in pension and other long-term liabilities |
0.2 | (2.9 | ) | (0.6 | ) | |||||||
| Changes in operating asset and liabilities |
28.3 | 21.2 | (32.6 | ) | ||||||||
| Income taxes |
(40.5 | ) | (0.9 | ) | (20.2 | ) | ||||||
| Interest expense, net |
(82.9 | ) | (12.1 | ) | (7.4 | ) | ||||||
| LIFO/LCM(a) |
(25.0 | ) | 17.4 | 0.4 | ||||||||
| Non-cash pension, accretion and stock compensation |
(9.8 | ) | (10.8 | ) | (14.9 | ) | ||||||
| Restructuring, relocation and severance |
(8.3 | ) | (2.8 | ) | (11.9 | ) | ||||||
| Consulting and sponsor fees |
(10.2 | ) | (5.8 | ) | (18.9 | ) | ||||||
| Interest rate swaps |
(6.0 | ) | (11.9 | ) | (11.0 | ) | ||||||
| New Madrid power outage(b) |
— | 30.6 | — | |||||||||
| Insurance proceeds applied to depreciation expense and loss on disposal of assets |
— | 8.8 | — | |||||||||
| Joint venture EBITDA(e) |
(13.2 | ) | (8.0 | ) | — | |||||||
| Purchase accounting and other(f) |
(4.2 | ) | (11.6 | ) | 1.4 | |||||||
| Cash flow from operating activities |
65.5 | 220.5 | 270.9 | |||||||||
54
Table of Contents
| (a) | Our New Madrid smelter and our rolling mills use the LIFO method of inventory accounting for financial reporting and tax purposes. This adjustment restates net income to the FIFO method by eliminating LIFO expenses related to inventory held at the New Madrid smelter and the rolling mills. Inventories at Gramercy and St. Ann are stated at lower of weighted-average cost or market, and are not subject to the LIFO adjustment. We also reduce inventory to the lower of cost (adjusted for purchase accounting) or market value. |
| (b) | Represents the portion of the insurance settlement used for claim-related capital expenditures. |
| (c) | We use derivative financial instruments to mitigate effects of fluctuations in aluminum and natural gas prices. This adjustment eliminates the non-cash gains and losses resulting from fair market value changes of aluminum swaps, but does not affect the following cash settlements (received)/paid (in millions): |
| Year ended December 31, | ||||||||||||
| 2008 | 2009 | 2010 | ||||||||||
| $ | $ | $ | ||||||||||
| Fixed priced aluminum swaps |
5.3 | (93.1 | ) | (24.2 | ) | |||||||
| Variable price aluminum swaps and other |
8.0 | 23.8 | (2.5 | ) | ||||||||
| Natural gas swaps |
3.7 | 31.8 | 23.3 | |||||||||
| Interest rate swaps |
6.0 | 11.9 | 11.0 | |||||||||
| Total |
23.0 | (25.6 | ) | 7.6 | ||||||||
The previous table presents fixed price aluminum swap cash settlement amounts net of early termination discounts totaling $17.9 million in 2009 and $9.0 million in 2010.
| (d) | During third quarter 2010, we concluded that certain non-cash hedge gains should be excluded for purposes of calculating Adjusted EBITDA under the credit agreement governing our senior secured credit facilities. As such, we excluded from the calculation of Adjusted EBITDA hedge gains totaling $53.6 million for the year ended December 31, 2010. |
| (e) | Prior to the consummation of the Joint Venture Transaction on August 31, 2009, our reported Adjusted EBITDA includes 50% of the net income of Gramercy and St. Ann. To reflect the underlying economics of the vertically integrated upstream business, this adjustment eliminates the following components of equity income to reflect 50% of the EBITDA of the joint ventures for the following periods (in millions): |
| Year ended December 31, | ||||||||
| 2008 | 2009 | |||||||
| $ | $ | |||||||
| Depreciation and amortization |
16.0 | 8.7 | ||||||
| Net tax expense |
(2.7 | ) | (0.7 | ) | ||||
| Interest income |
(0.1 | ) | — | |||||
| Total joint venture EBITDA adjustments |
13.2 | 8.0 | ||||||
| (f) | Represents impact from inventory step-up and other adjustments arising from adjusting assets acquired and liabilities assumed in the Joint Venture Transaction to their fair values as well as other immaterial non-recurring items |
Contractual Obligations and Contingencies
The following table reflects certain of our contractual obligations as of December 31, 2010 (in millions):
| Total | 2011 | 2012 | 2013 | 2014 | 2015 | 2016 and beyond |
||||||||||||||||||||||
| $ | $ | $ | $ | $ | $ | $ | ||||||||||||||||||||||
| Long-term debt (including current portion)(1) |
428.6 | — | — | — | 78.2 | 350.4 | — | |||||||||||||||||||||
| Interest on long-term debt(2) |
74.2 | 18.0 | 17.1 | 17.1 | 16.2 | 5.8 | — | |||||||||||||||||||||
| Operating lease commitments(3) |
7.7 | 2.9 | 1.7 | 0.7 | 0.5 | 0.6 | 1.3 | |||||||||||||||||||||
| Purchase obligations(4) |
11.0 | 7.2 | 0.5 | 0.5 | 0.4 | 0.2 | 2.2 | |||||||||||||||||||||
| Other contractual obligations(5)(6) |
252.3 | 26.0 | 25.9 | 25.9 | 21.6 | 23.1 | 129.8 | |||||||||||||||||||||
| Total |
773.8 | 54.1 | 45.2 | 44.2 | 116.9 | 380.1 | 133.3 | |||||||||||||||||||||
| (1) | We may be subject to required annual paydowns on our term B loan, depending on our annual performance; however, payments in future years related to the term B loan cannot be reasonably estimated and are not reflected (maturing in 2014). Additionally, 2015 maturities include the May 15, 2011 interest payment of $8.9 million, which we have elected to pay in kind. |
| (2) | Interest on long-term debt was calculated based on the weighted-average effective LIBOR rate of 0.41% at December 31, 2010. The fronting fee and the undrawn capacity fee of the revolving credit facility are not included here. In addition, interest rate swap obligations are not included and interest is assumed to be paid entirely in cash, with the exception of the May 15, 2011 interest payment of $8.9 million, which we have elected to pay in kind. |
| (3) | We enter into operating leases in the normal course of business. Our operating leases include the leases on certain of our manufacturing and warehouse facilities. |
| (4) | Purchase obligations include minimum purchase requirements under New Madrid’s power contract, minimum nitrogen purchases under a contract at the rolling mill in Huntingdon, and capital expenditures in accounts payable at December 31, 2010. If the nitrogen contract at Huntingdon is cancelled during 2011, we would be obligated to pay a contract termination fee of $1.5 million. Obligations that are legally cancellable without penalty are excluded. |
| (5) | We have other contractual obligations that are reflected in the consolidated financial statements, including pension and OPEB obligations, asset retirement obligations (“AROs”), land and reclamation obligations, environmental matters and service agreements. AROs are stated at the present value of the liability. As of December 31, 2010, the noncurrent portion of our income tax liability, including accrued interest and penalties, related to unrecognized tax benefits, was approximately $11.8 million, which is not included in the total above. At this time, the settlement period for the noncurrent portion of our income tax liability cannot be determined. See Note 16, “Income Taxes” in our consolidated financial statements for information regarding income taxes. |
| (6) | The GOJ and NBL are parties to an Establishment Agreement that governs the relationship between them as to the operation of our bauxite mine in St. Ann, Jamaica. On December 31, 2009, NBL arrived at an understanding with the GOJ to amend the Establishment Agreement. This amendment sets the fiscal regime structure of the Establishment Agreement from January 1, 2009 through December 31, 2014. The amendment provides for a commitment by NBL to make certain expenditures for haulroad development, maintenance, dredging, land purchases, contract mining, training and other general capital expenditures from 2009 through 2014. These commitments are not included in the table above. |
| ITEM 7A. | QUANTITATIVE AND QUALITATIVE DISCLOSURES ABOUT MARKET RISK |
In addition to the risks inherent in our operations, we are exposed to financial, market and economic risks. The following discussion provides information regarding our exposure to the risks of changing commodity prices and interest rates. Our interest rate,
55
Table of Contents
aluminum and natural gas contracts are held for purposes other than trading. They are used primarily to mitigate uncertainty and volatility, and to cover underlying exposures.
Commodity Price Risks
See Note 19, “Derivative Financial Instruments,” to our consolidated financial statements in Item 8 of this Annual Report on Form 10-K for a complete description of our derivative activities to address commodity price risks.
Non-performance risk. Our derivatives are recorded at fair value, the measurement of which includes the effect of our non-performance risk for derivatives in a liability position, and of the counterparty for derivatives in an asset position.
Merrill Lynch is the counterparty for a substantial portion of our derivatives. As of December 31, 2010, the fair value of derivatives where Merrill Lynch was counterparty was a $41.8 million liability. As such, in accordance with our master agreement described below, we used our counterparty’s credit adjustment for the fair value adjustment. All of our obligations in respect of derivatives transactions with Merrill Lynch are entitled to the same guarantee and security provisions as the senior secured credit facilities, but we are not required to post additional collateral or cash margin. Our derivatives transactions with Merrill Lynch are governed by an ISDA Master Agreement, a form document produced by the International Swaps and Derivatives Association and widely used by derivatives market participants to establish basic, market-standard background rules to govern substantive economic transactions. The substantive economic terms of swap and derivative transactions, such as our derivative arrangements described herein, are typically agreed to orally and subsequently memorialized in short-form confirmations that are governed by the background provisions of the ISDA Master Agreement. While management may alter our hedging strategies in the future based on our view of actual forecasted prices, there are no plans in place that would require us to post cash under the master agreement with Merrill Lynch.
We have also entered into variable priced aluminum swaps with counterparties other than Merrill Lynch. To the extent those swap contracts are in an asset position for us, management believes there is minimal counterparty risk because these counterparties are backed by the LME. To the extent these contracts are in a liability position for us, the swap agreements provide for us to establish margin accounts in favor of the broker. These margin account balances are netted in the settlement of swap liability. At December 31, 2010, we had no balance in the margin account.
Financial Risk
Fair values and sensitivity analysis. The following tables show the effect of a hypothetical increase or decrease of 10% of the appropriate risk factor of our financial hedges. The risk factor related to the interest rate swap is the interest rate and the risk factor associated with the commodity swaps is the market price associated with the respective commodity.
We issued variable-rate debt to finance the Apollo Acquisition and will be subject to variations in interest rates with respect to our floating-rate debt. As of December 31, 2010, outstanding long term floating-rate debt was $419.7 million. A 1% increase in the interest rates would increase our annual interest expense by $4.2 million at December 31, 2010 prior to any consideration of the impact of interest rate swaps.
The following table represents our sensitivity summary showing the effect of a hypothetical increase or decrease of 10% of the appropriate risk factor of our financial hedges at December 31, 2010:
| Derivative value as of December 31, 2010 | ||||||||||||
| Assuming 10% increase in the market risk factor |
Actual | Assuming 10% decrease in the market risk factor |
||||||||||
| $ | $ | $ | ||||||||||
| Variable price aluminum swaps and other |
6.0 | 3.1 | 0.2 | |||||||||
| Natural gas hedges |
(32.9 | ) | (40.3 | ) | (47.6 | ) | ||||||
| Interest rate swaps |
(4.4 | ) | (4.4 | ) | (4.5 | ) | ||||||
| Total |
(31.3 | ) | (41.6 | ) | (51.9 | ) | ||||||
Material limitations. The disclosures with respect to commodity prices and interest rates do not take into account the underlying commitments or anticipated transactions. If the underlying items were included in the analysis, the gains or losses on the hedges may be offset. Actual results will be determined by a number of factors that are not under Noranda’s control and could vary significantly from those factors disclosed. Noranda is exposed to credit loss in the event of nonperformance by counterparties on the above instruments, as well as credit or performance risk with respect to its customers. Although nonperformance is possible, Noranda does not anticipate nonperformance by any of these parties. We believe that our contracts are with creditworthy counterparties.
56
Table of Contents
| ITEM 8. | FINANCIAL STATEMENTS AND SUPPLEMENTARY DATA |
NORANDA ALUMINUM HOLDING CORPORATION
57
Table of Contents
MANAGEMENT’S REPORT ON INTERNAL CONTROL OVER FINANCIAL REPORTING
Management is responsible for establishing and maintaining an adequate system of internal control over financial reporting as defined in Rules 13a-15(f) and 15d-15(f) under the Securities Exchange Act of 1934. The company’s internal control over financial reporting is a process designed to provide reasonable assurance regarding the reliability of financial reporting and the preparation of financial statements for external purposes in accordance with GAAP. The company’s internal control over financial reporting includes those policies and procedures that:
| i. | pertain to the maintenance of records that, in reasonable detail, accurately and fairly reflect the transactions and dispositions of the assets of the company; |
| ii. | provide reasonable assurance that transactions are recorded as necessary to permit preparation of financial statements in accordance with generally accepted accounting principles and that receipts and expenditures of the company are being made only in accordance with authorization of management and directors of the company; and |
| iii. | provide reasonable assurance regarding prevention or timely detection of unauthorized acquisitions, use or disposition of the company’s assets that could have a material effect on the financial statements. |
Internal control over financial reporting has certain inherent limitations which may not prevent or detect misstatements. In addition, changes in conditions and business practices may cause variation in the effectiveness of internal controls.
Management assessed the effectiveness of the company’s internal control over financial reporting as of December 31, 2010, based on criteria set forth by the Committee of Sponsoring Organizations of the Treadway Commission (COSO) in Internal Control-Integrated Framework. Based on its assessment and those criteria, management concluded that the company maintained effective internal control over financial reporting as of December 31, 2010. In 2010, management’s assessment and conclusion on the effectiveness of internal control over financial reporting included assessing the internal controls of Noranda Bauxite Ltd. and Noranda Alumina LLC for the first time since the acquisition of both companies on August 31, 2009.
Ernst & Young LLP, an independent registered public accounting firm, has audited the effectiveness of the company’s internal control over financial reporting as of December 31, 2010, as stated in their report, which is presented on the following page.
| /s/ LAYLE K. SMITH |
| Layle K. Smith |
| President and Chief Executive Officer |
| March 7, 2011 |
| /s/ ROBERT B. MAHONEY |
| Robert B. Mahoney |
| Chief Financial Officer |
| March 7, 2011 |
58
Table of Contents
REPORT OF INDEPENDENT REGISTERED PUBLIC ACCOUNTING FIRM
The Board of Directors
Noranda Aluminum Holding Corporation
We have audited the accompanying consolidated balance sheets of Noranda Aluminum Holding Corporation (the “Company”) as of December 31, 2010 and 2009 (Successor) and the related consolidated statements of operations, shareholders’ equity (deficiency), and cash flows for each of the three years in the period ended December 31, 2010. These financial statements are the responsibility of the Company’s management. Our responsibility is to express an opinion on these financial statements based on our audits. We did not audit the financial statements of Gramercy Alumina LLC (Gramercy) and St. Ann Bauxite Limited (St. Ann), corporations in which the Company had 50% interests through August 31, 2009, for the year ended December 31, 2008. Those statements have been audited by other auditors whose reports have been furnished to us, and our opinion on the Company’s consolidated financial statements, insofar as it relates to the amounts included for Gramercy and St. Ann before consolidation adjustments, is based solely on the reports of the other auditors. In the Company’s consolidated financial statements (in millions), the Company’s equity in the net income before consolidation adjustments of Gramercy and St. Ann is $12.7 and $2.5, respectively, for the year ended December 31, 2008.
We conducted our audits in accordance with the standards of the Public Company Accounting Oversight Board (United States). Those standards require that we plan and perform the audit to obtain reasonable assurance about whether the financial statements are free of material misstatement. An audit also includes examining, on a test basis, evidence supporting the amounts and disclosures in the financial statements. An audit also includes assessing the accounting principles used and significant estimates made by management, and evaluating the overall financial statement presentation. We believe that our audits and the reports of the other auditors provide a reasonable basis for our opinion.
In our opinion, based on our audits and the reports of other auditors, the financial statements referred to above present fairly, in all material respects, the consolidated financial position of Noranda Aluminum Holding Corporation at December 31, 2010 and 2009, and the consolidated results of its operations and cash flows for each of the three years in the period ended December 31, 2010, in conformity with U.S. generally accepted accounting principles.
We also have audited, in accordance with the standards of the Public Company Accounting Oversight Board (Untied States), the Company’s internal control over financial reporting as of December 31, 2010, based on criteria established in Internal Control — Integrated Framework issued by the Committee of Sponsoring Organizations of the Treadway Commission, and our report dated March 7, 2011 expressed an unqualified opinion thereon.
| /S/ ERNST & YOUNG LLP |
Nashville, Tennessee
March 7, 2011
59
Table of Contents
REPORT OF INDEPENDENT REGISTERED PUBLIC ACCOUNTING FIRM
The Board of Directors
Noranda Aluminum Holding Corporation
We have audited Noranda Aluminum Holding Corporation’s internal control over financial reporting as of December 31, 2010, based on criteria established in Internal Control—Integrated Framework issued by the Committee of Sponsoring Organizations of the Treadway Commission (the COSO criteria). Noranda Aluminum Holding Corporation’s management is responsible for maintaining effective internal control over financial reporting, and for its assessment of the effectiveness of internal control over financial reporting included in the accompanying Management’s Report on Internal Control Over Financial Reporting. Our responsibility is to express an opinion on the Company’s internal control over financial reporting based on our audit.
We conducted our audit in accordance with the standards of the Public Company Accounting Oversight Board (United States). Those standards require that we plan and perform the audit to obtain reasonable assurance about whether effective internal control over financial reporting was maintained in all material respects. Our audit included obtaining an understanding of internal control over financial reporting, assessing the risk that a material weakness exists, testing and evaluating the design and operating effectiveness of internal control based on the assessed risk, and performing such other procedures as we considered necessary in the circumstances. We believe that our audit provides a reasonable basis for our opinion.
A company’s internal control over financial reporting is a process designed to provide reasonable assurance regarding the reliability of financial reporting and the preparation of financial statements for external purposes in accordance with generally accepted accounting principles. A company’s internal control over financial reporting includes those policies and procedures that (1) pertain to the maintenance of records that, in reasonable detail, accurately and fairly reflect the transactions and dispositions of the assets of the company; (2) provide reasonable assurance that transactions are recorded as necessary to permit preparation of financial statements in accordance with generally accepted accounting principles, and that receipts and expenditures of the company are being made only in accordance with authorizations of management and directors of the company; and (3) provide reasonable assurance regarding prevention or timely detection of unauthorized acquisition, use or disposition of the company’s assets that could have a material effect on the financial statements.
Because of its inherent limitations, internal control over financial reporting may not prevent or detect misstatements. Also, projections of any evaluation of effectiveness to future periods are subject to the risk that controls may become inadequate because of changes in conditions or that the degree of compliance with the policies or procedures may deteriorate.
In our opinion, Noranda Aluminum Holding Corporation maintained, in all material respects, effective internal control over financial reporting as of December 31, 2010, based on the COSO criteria.
We have also audited, in accordance with the standards of the Public Company Accounting Oversight Board (United States), the consolidated balance sheets as of December 31, 2010 and 2009 and the related consolidated statements of operations, shareholders’ equity (deficiency), and cash flows for each of the three years in the period ended December 31, 2010 of Noranda Aluminum Holding Corporation and our report dated March 7, 2011 expressed an unqualified opinion thereon.
| /S/ ERNST & YOUNG LLP |
Nashville, Tennessee
March 7, 2011
60
Table of Contents
To the Members of
St. Ann Bauxite Limited and Its Subsidiary
We have audited the profit and loss account, statements of changes in equity and cash flows for the year then ended December 31, 2008 of St. Ann Bauxite Limited and its subsidiary (the Group) (not presented separately herein). These financial statements are the responsibility of the Group’s directors and management. Our responsibility is to express an opinion on these financial statements based on our audit.
We conducted our audit in accordance with the standards of the Public Company Accounting Oversight Board (United States). Those standards require that we plan and perform the audit to obtain reasonable assurance that the financial statements are free of material misstatements. The Group is not required to have, nor were we engaged to perform, an audit of its internal control over financial reporting. Our audit included consideration of internal control over financial reporting as a basis for designing audit procedures that are appropriate in the circumstances, but not for the purpose of expressing an opinion on the effectiveness of the Group’s internal control over financial reporting. Accordingly, we express no such opinion. An audit also includes examining, on a test basis, evidence supporting the amounts and disclosures in the financial statements, assessing the accounting principles used and significant estimates made by directors and management, as well as evaluating the overall financial statements presentation. We believe our audit provides a reasonable basis for our opinion.
In our opinion, such financial statements present fairly, in all material respects the results of operations, and cash flows of the Group for the year then ended December 31, 2008 in accordance with International Financial Reporting Standards.
US GAAP Reconciliation
Accounting principles under International Financial Reporting Standards vary in certain significant respects from accounting principles generally accepted in the United States of America. Information relating to the nature and effect of such differences is presented in information appended to the financial statements.
| /S/ DELOITTE & TOUCHE |
Kingston, Jamaica
February 6, 2009
61
Table of Contents
REPORT OF INDEPENDENT REGISTERED PUBLIC ACCOUNTING FIRM
To the Board of Managers of
Gramercy Alumina LLC
We have audited the statements of operations, changes in members’ equity, comprehensive income, and cash flows of Gramercy Alumina LLC for the year ended December 31, 2008 (not presented separately herein). These financial statements are the responsibility of Gramercy Alumina LLC’s management. Our responsibility is to express an opinion on these financial statements based on our audit.
We conducted our audit in accordance with the standards of the Public Company Accounting Oversight Board (United States). Those standards require that we plan and perform the audit to obtain reasonable assurance about whether the financial statements are free of material misstatement. Gramercy Alumina LLC is not required to have, nor were we engaged to perform, an audit of its internal control over financial reporting. Our audit included consideration of internal control over financial reporting as a basis for designing audit procedures that are appropriate in the circumstances, but not for the purpose of expressing an opinion on the effectiveness of Gramercy Alumina LLC’s internal control over financial reporting. Accordingly, we express no such opinion. An audit also includes examining, on a test basis, evidence supporting the amounts and disclosures in the financial statements, assessing the accounting principles used and significant estimates made by management, as well as evaluating the overall financial statement presentation. We believe that our audit provides a reasonable basis for our opinion.
In our opinion, such financial statements present fairly, in all material respects, the results of operations and cash flows of Gramercy Alumina LLC for the year ended December 31, 2008 in conformity with accounting principles generally accepted in the United States of America.
| /S/ DELOITTE & TOUCHE LLP |
New Orleans, Louisiana
February 18, 2009
62
Table of Contents
NORANDA ALUMINUM HOLDING CORPORATION
CONSOLIDATED BALANCE SHEETS
(in millions, except par value)
| As of December 31, | ||||||||
| 2009 | 2010 | |||||||
| $ | $ | |||||||
| ASSETS |
||||||||
| Current assets: |
||||||||
| Cash and cash equivalents |
167.2 | 33.8 | ||||||
| Accounts receivable, net |
85.5 | 131.6 | ||||||
| Inventories, net |
182.4 | 201.1 | ||||||
| Derivative assets, net |
68.8 | — | ||||||
| Taxes receivable |
0.7 | — | ||||||
| Prepaid expenses |
34.5 | 12.9 | ||||||
| Other current assets |
15.7 | 19.2 | ||||||
| Total current assets |
554.8 | 398.6 | ||||||
| Property, plant and equipment, net |
745.5 | 719.9 | ||||||
| Goodwill |
137.6 | 137.6 | ||||||
| Other intangible assets, net |
79.0 | 73.0 | ||||||
| Long-term derivative assets, net |
95.5 | — | ||||||
| Other assets |
85.2 | 85.6 | ||||||
| Total assets |
1,697.6 | 1,414.7 | ||||||
| LIABILITIES AND SHAREHOLDERS’ EQUITY |
||||||||
| Current liabilities: |
||||||||
| Accounts payable |
69.9 | 95.7 | ||||||
| Accrued liabilities |
62.0 | 54.6 | ||||||
| Accrued interest |
0.2 | 0.3 | ||||||
| Taxes payable |
— | 4.8 | ||||||
| Derivative liabilities, net |
— | 23.2 | ||||||
| Deferred tax liabilities |
27.3 | 48.5 | ||||||
| Current portion of long-term debt |
7.5 | — | ||||||
| Total current liabilities |
166.9 | 227.1 | ||||||
| Long-term debt, net |
944.2 | 419.7 | ||||||
| Long-term derivative liabilities, net |
— | 18.4 | ||||||
| Pension and other post-retirement liabilities |
106.4 | 116.0 | ||||||
| Other long-term liabilities |
55.5 | 57.9 | ||||||
| Deferred tax liabilities |
330.4 | 277.9 | ||||||
| Common stock subject to redemption (0.2 shares at December 31, 2009 and 2010) |
2.0 | 2.0 | ||||||
| Shareholders’ equity: |
||||||||
| Preferred stock (25.0 shares authorized, no shares outstanding) |
— | — | ||||||
| Common stock (200.0 shares authorized; $0.01 par value; 43.75 shares issued and outstanding at December 31, 2009; 66.81 shares issued and outstanding at December 31, 2010, including 0.2 shares subject to redemption at December 31, 2009 and 2010) |
0.4 | 0.7 | ||||||
| Capital in excess of par value |
16.1 | 227.7 | ||||||
| Accumulated deficit |
(75.1 | ) | (8.2 | ) | ||||
| Accumulated other comprehensive income |
144.8 | 69.5 | ||||||
| Total Noranda shareholders’ equity |
86.2 | 289.7 | ||||||
| Non-controlling interest |
6.0 | 6.0 | ||||||
| Total shareholders’ equity |
92.2 | 295.7 | ||||||
| Total liabilities and shareholders’ equity |
1,697.6 | 1,414.7 | ||||||
See accompanying notes to consolidated financial statements
63
Table of Contents
NORANDA ALUMINUM HOLDING CORPORATION
CONSOLIDATED STATEMENTS OF OPERATIONS
(in millions, except per share information)
| Year ended December 31, | ||||||||||||
| 2008 | 2009 | 2010 | ||||||||||
| $ | $ | $ | ||||||||||
| Sales |
1,266.4 | 769.9 | 1,294.9 | |||||||||
| Operating costs and expenses: |
||||||||||||
| Cost of sales |
1,122.7 | 779.9 | 1,113.4 | |||||||||
| Selling, general and administrative expenses |
73.8 | 75.6 | 114.0 | |||||||||
| Goodwill and other intangible asset impairment |
25.5 | 108.0 | — | |||||||||
| Excess insurance proceeds |
— | (43.5 | ) | — | ||||||||
| 1,222.0 | 920.0 | 1,227.4 | ||||||||||
| Operating income (loss) |
44.4 | (150.1 | ) | 67.5 | ||||||||
| Other (income) expense: |
||||||||||||
| Interest expense, net |
88.0 | 53.5 | 31.1 | |||||||||
| (Gain) loss on hedging activities, net |
69.9 | (111.8 | ) | (65.6 | ) | |||||||
| Equity in net (income) loss of investments in affiliates |
(7.7 | ) | 79.7 | — | ||||||||
| (Gain) loss on debt repurchase |
1.2 | (211.2 | ) | 0.1 | ||||||||
| Gain on business combination |
— | (120.3 | ) | — | ||||||||
| 151.4 | (310.1 | ) | (34.4 | ) | ||||||||
| Income (loss) before income taxes |
(107.0 | ) | 160.0 | 101.9 | ||||||||
| Income tax expense (benefit) |
(32.9 | ) | 58.6 | 35.0 | ||||||||
| Net income (loss) |
(74.1 | ) | 101.4 | 66.9 | ||||||||
| Net income (loss) per common share: |
||||||||||||
| Basic |
$ | (1.70 | ) | $ | 2.33 | $ | 1.30 | |||||
| Diluted |
$ | (1.70 | ) | $ | 2.33 | $ | 1.27 | |||||
| Weighted-average common shares outstanding: |
||||||||||||
| Basic |
43.44 | 43.53 | 51.56 | |||||||||
| Diluted |
43.44 | 43.53 | 52.80 | |||||||||
| Cash dividends declared per common share |
$ | 2.35 | $ | — | $ | — | ||||||
See accompanying notes to consolidated financial statements
64
Table of Contents
NORANDA ALUMINUM HOLDING CORPORATION
CONSOLIDATED STATEMENTS OF SHAREHOLDERS’ EQUITY (DEFICIENCY)
(in millions)
| Preferred stock |
Common stock |
Capital in excess of par value |
Retained earnings (accumulated deficit) |
Accumulated other comprehensive (loss) income |
Non-controlling interest |
Total shareholders’ equity (deficiency) |
||||||||||||||||||||||
| $ | $ | $ | $ | $ | $ | $ | ||||||||||||||||||||||
| Balance, December 31, 2007 |
0.4 | 11.8 | (0.2 | ) | (12.1 | ) | — | (0.1 | ) | |||||||||||||||||||
| For the year ended December 31, 2008: |
||||||||||||||||||||||||||||
| Net loss |
— | — | — | (74.1 | ) | — | — | (74.1 | ) | |||||||||||||||||||
| Net unrealized gains (losses): |
||||||||||||||||||||||||||||
| Pension loss, net of tax of $31.8 |
— | — | — | — | (53.4 | ) | — | (53.4 | ) | |||||||||||||||||||
| Unrealized gain on derivatives, net of tax of $150.3 |
— | — | — | — | 263.8 | — | 263.8 | |||||||||||||||||||||
| Total comprehensive income |
136.3 | |||||||||||||||||||||||||||
| Distribution to shareholders |
— | — | — | (102.2 | ) | — | — | (102.2 | ) | |||||||||||||||||||
| Issuance of common shares |
— | — | 0.3 | — | — | — | 0.3 | |||||||||||||||||||||
| Repurchase of common shares |
— | — | (0.1 | ) | — | — | — | (0.1 | ) | |||||||||||||||||||
| Stock compensation expense |
— | — | 2.4 | — | — | — | 2.4 | |||||||||||||||||||||
| Balance, December 31, 2008 |
— | 0.4 | 14.4 | (176.5 | ) | 198.3 | — | 36.6 | ||||||||||||||||||||
| For the year ended December 31, 2009: |
||||||||||||||||||||||||||||
| Net income |
— | — | — | 101.4 | — | — | 101.4 | |||||||||||||||||||||
| Net unrealized gains (losses): |
||||||||||||||||||||||||||||
| Pension gain, net of tax of $6.9 |
— | — | — | — | 11.3 | — | 11.3 | |||||||||||||||||||||
| Unrealized gain on derivatives, net of tax of $25.4 |
— | — | — | — | 45.1 | — | 45.1 | |||||||||||||||||||||
| Reclassification of derivative amounts realized in net income, net of tax of $62.4 |
— | — | — | — | (109.9 | ) | — | (109.9 | ) | |||||||||||||||||||
| Total comprehensive income |
— | 47.9 | ||||||||||||||||||||||||||
| Non-controlling interest |
— | — | — | — | — | 6.0 | 6.0 | |||||||||||||||||||||
| Repurchase of common shares |
— | — | (0.1 | ) | — | — | — | (0.1 | ) | |||||||||||||||||||
| Issuance of common shares |
— | — | 0.3 | — | — | — | 0.3 | |||||||||||||||||||||
| Stock compensation expense |
— | — | 1.5 | — | — | — | 1.5 | |||||||||||||||||||||
| Balance, December 31, 2009 |
— | 0.4 | 16.1 | (75.1 | ) | 144.8 | 6.0 | 92.2 | ||||||||||||||||||||
| For the year ended December 31, 2010: |
||||||||||||||||||||||||||||
| Net income |
— | — | — | 66.9 | — | — | 66.9 | |||||||||||||||||||||
| Net unrealized gains (losses): |
— | |||||||||||||||||||||||||||
| Pension loss, net of tax benefit of $4.6 |
— | — | — | — | (8.4 | ) | — | (8.4 | ) | |||||||||||||||||||
| Unrealized loss on derivatives, net of tax of $8.4 |
— | — | — | — | (14.7 | ) | — | (14.7 | ) | |||||||||||||||||||
| Reclassification of derivative amounts realized in net income, net of tax of $29.9 |
— | — | — | — | (52.2 | ) | — | (52.2 | ) | |||||||||||||||||||
| Total comprehensive income |
(8.4 | ) | ||||||||||||||||||||||||||
| Issuance of common shares |
— | 0.3 | 205.7 | — | — | — | 206.0 | |||||||||||||||||||||
| Stock compensation expense |
— | — | 5.9 | — | — | — | 5.9 | |||||||||||||||||||||
| Balance, December 31, 2010 |
— | 0.7 | 227.7 | (8.2 | ) | 69.5 | 6.0 | 295.7 | ||||||||||||||||||||
See accompanying notes to consolidated financial statements
65
Table of Contents
NORANDA ALUMINUM HOLDING CORPORATION
CONSOLIDATED STATEMENTS OF CASH FLOWS
(in millions)
| Year ended December 31, | ||||||||||||
| 2008 | 2009 | 2010 | ||||||||||
| $ | $ | $ | ||||||||||
| OPERATING ACTIVITIES |
||||||||||||
| Net income (loss) |
(74.1 | ) | 101.4 | 66.9 | ||||||||
| Adjustments to reconcile net income (loss) to net cash provided by operating activities: |
||||||||||||
| Depreciation and amortization |
98.3 | 93.4 | 98.7 | |||||||||
| Non-cash interest expense |
5.1 | 41.4 | 23.7 | |||||||||
| Loss on disposal of property, plant and equipment |
5.3 | 9.4 | 4.0 | |||||||||
| Insurance proceeds applied to capital expenditures |
— | (11.5 | ) | — | ||||||||
| Goodwill and other intangible asset impairment |
25.5 | 108.0 | — | |||||||||
| (Gain) loss on hedging activities, net of cash settlements |
46.9 | (68.9 | ) | (64.6 | ) | |||||||
| Settlements from hedge terminations, net |
— | 120.8 | 164.6 | |||||||||
| (Gain) loss on debt repurchase |
1.2 | (211.2 | ) | 0.1 | ||||||||
| Gain on business combination |
— | (120.3 | ) | — | ||||||||
| Equity in net (income) loss of investments in affiliates |
(7.7 | ) | 79.7 | — | ||||||||
| Deferred income taxes |
(73.4 | ) | 57.6 | 14.8 | ||||||||
| Stock compensation expense |
2.4 | 1.5 | 5.9 | |||||||||
| Changes in other assets |
7.5 | 0.9 | (10.0 | ) | ||||||||
| Changes in pension and other long-term liabilities |
0.2 | (2.9 | ) | (0.6 | ) | |||||||
| Changes in operating assets and liabilities: |
||||||||||||
| Accounts receivable, net |
22.7 | 8.5 | (45.3 | ) | ||||||||
| Inventories, net |
41.2 | 7.6 | (20.9 | ) | ||||||||
| Taxes receivable and taxes payable |
0.3 | 12.4 | 5.6 | |||||||||
| Other current assets |
(18.6 | ) | (12.7 | ) | 15.8 | |||||||
| Accounts payable |
9.0 | 5.0 | 19.5 | |||||||||
| Accrued liabilities and accrued interest |
(26.3 | ) | 0.4 | (7.3 | ) | |||||||
| Cash provided by operating activities |
65.5 | 220.5 | 270.9 | |||||||||
| INVESTING ACTIVITIES |
||||||||||||
| Capital expenditures |
(51.6 | ) | (46.7 | ) | (61.3 | ) | ||||||
| Proceeds from insurance related to capital expenditures |
— | 11.5 | — | |||||||||
| Proceeds from sale of property, plant and equipment |
0.5 | 0.1 | 0.2 | |||||||||
| Cash acquired in business combination |
— | 11.1 | — | |||||||||
| Cash used in investing activities |
(51.1 | ) | (24.0 | ) | (61.1 | ) | ||||||
| FINANCING ACTIVITIES |
||||||||||||
| Proceeds from issuance of common shares |
2.3 | 0.3 | 206.0 | |||||||||
| Distribution to shareholders |
(102.2 | ) | — | — | ||||||||
| Repurchase of common shares |
(0.1 | ) | (0.1 | ) | — | |||||||
| Borrowings on revolving credit facility |
225.0 | 13.0 | — | |||||||||
| Repayments on revolving credit facility |
— | (15.5 | ) | (215.9 | ) | |||||||
| Repayment of long-term debt |
(30.3 | ) | (211.7 | ) | (333.3 | ) | ||||||
| Cash provided by (used in) financing activities |
94.7 | (214.0 | ) | (343.2 | ) | |||||||
| Change in cash and cash equivalents |
109.1 | (17.5 | ) | (133.4 | ) | |||||||
| Cash and cash equivalents, beginning of period |
75.6 | 184.7 | 167.2 | |||||||||
| Cash and cash equivalents, end of period |
184.7 | 167.2 | 33.8 | |||||||||
See accompanying notes to consolidated financial statements
66
Table of Contents
NORANDA ALUMINUM HOLDING CORPORATION
NOTES TO CONSOLIDATED FINANCIAL STATEMENTS
| 1. | ACCOUNTING POLICIES |
Basis of Presentation
Noranda Aluminum Holding Corporation (“Noranda,” “Noranda HoldCo,” the “Company,” “we,” “our,” and “us”), and our wholly owned subsidiary, Noranda Aluminum Acquisition Corporation (“Noranda AcquisitionCo”), were formed by affiliates of Apollo Management, L.P. (“Apollo”) on March 27, 2007 for the purpose of acquiring Noranda Intermediate Holding Corporation (“Noranda Intermediate”), which owns all of the outstanding shares of Noranda Aluminum, Inc.
We are a vertically integrated producer of value-added primary aluminum products and high quality rolled aluminum coils. Our principal operations include an aluminum smelter in New Madrid, Missouri (“New Madrid”) and four rolling mills in the southeastern United States. New Madrid is supported by our alumina refinery in Gramercy, Louisiana (Noranda Alumina, LLC, or “Gramercy”) and a bauxite mining operation in St. Ann, Jamaica (Noranda Bauxite Limited, or “St. Ann”). As discussed further in the “Business Segment Information” note, we report our activities in five segments: our bauxite segment comprises the operations of St. Ann; our alumina refining segment comprises the operations of Gramercy; our primary aluminum products segment comprises the operations of New Madrid; and our flat rolled products segment comprises our four rolling mills, which are located in Huntingdon, Tennessee, Salisbury, North Carolina and Newport, Arkansas. Our corporate expenses represent our fifth segment.
On May 18, 2007, Noranda AcquisitionCo purchased all of the outstanding shares of Noranda Intermediate from Xstrata plc (together with its subsidiaries, “Xstrata”), and Xstrata (Schweiz) A.G., a direct wholly owned subsidiary of Xstrata. This transaction is referred to as the “Apollo Acquisition”. Noranda Intermediate, a wholly-owned subsidiary of Noranda HoldCo and its subsidiaries constituted the Noranda aluminum business of Xstrata. Noranda HoldCo and Noranda AcquisitionCo were formed by affiliates of Apollo Management, L.P. (collectively, “Apollo”) and had no assets or operations prior to the Apollo Acquisition.
Through August 31, 2009, we held a 50% interest in Gramercy and in St. Ann. Our investments in these non-controlled entities, in which we had the ability to exercise equal or significant influence over operating and financial policies, were accounted for by the equity method. On August 3, 2009, we entered into an agreement with Century Aluminum Company (together with its subsidiaries, (“Century”) whereby we would become the sole owner of both Gramercy and St. Ann. The transaction closed on August 31, 2009 and is referred to as the “Joint Venture Transaction” and is discussed further in Note 2, “Joint Venture Transaction.”
The accompanying consolidated financial statements have been prepared in accordance with accounting principles generally accepted in the United States of America (“U.S. GAAP”). In management’s opinion, the consolidated financial statements include all normal and recurring adjustments that are considered necessary for the fair presentation of our financial position and operating results including the elimination of all intercompany accounts and transactions among wholly owned subsidiaries. Certain reclassifications have been made to previously issued consolidated financial statements to conform to the current period presentation. These reclassifications had no impact on net income or net cash flows.
Apollo Acquisition
The Apollo Acquisition was consummated on May 18, 2007, when Noranda AcquisitionCo acquired the Noranda Aluminum business of Xstrata (Schweiz) A.G., or “Xstrata,” by acquiring the stock of Noranda Intermediate, an Xstrata subsidiary. In connection with the Apollo Acquisition, Noranda AcquisitionCo incurred $1,010.0 million of funded debt, consisting of (i) a $500.0 million term B loan; and (ii) $510.0 million of senior floating rate notes, and entered into a $250.0 million revolving credit facility which was undrawn at the date of the Apollo Acquisition. In addition to the debt incurred, affiliates of Apollo contributed cash of $214.2 million to us, which was contributed to Noranda AcquisitionCo. The purchase price for Noranda Intermediate was $1,150.0 million, excluding acquisition costs. Subsequent to the Apollo Acquisition, certain members of our management contributed $1.9 million in cash through the purchase of common shares.
Stock Split
On April 16, 2010, our Board of Directors approved a two-for-one split of our outstanding shares of common stock to be effected in the form of a stock dividend. Stockholders of record at the close of business on April 19, 2010, were issued one additional share of common stock for each share owned by such stockholder as of that date. The additional shares were issued on April 20, 2010. The stock split increased the number of shares of common stock outstanding from approximately 21.9 million to approximately 43.8 million. Share and per-share amounts shown in the consolidated financial statements and related notes reflect the split as though it occurred on January 1, 2008. The total number of authorized common shares and the par value thereof was not changed by the split.
Common Stock Offerings
On May 19, 2010, we completed an initial public offering (“IPO”) of 11.5 million shares of common stock at an $8.00 per share public offering price on the New York Stock Exchange (NYSE: NOR). The net proceeds after the underwriting discounts, commissions, fees and expenses amounted to $82.9 million. We used those net proceeds from the offering together with $95.9 million of proceeds from settling all outstanding fixed price aluminum hedges, to repurchase the $66.3 million remaining principal amount of
67
Table of Contents
NORANDA ALUMINUM HOLDING CORPORATION
NOTES TO CONSOLIDATED FINANCIAL STATEMENTS
outstanding Holdco Notes, and to repay $110.0 million principal amount outstanding under the term B loan. The remaining $2.5 million was used for other corporate purposes.
In connection with the IPO, pursuant to our amended and restated certificate of incorporation, our authorized capital stock increased from 100.0 million to 225.0 million, of which 200.0 million ($0.01 par value) is designated as common stock and 25.0 million (at $0.01 par value) is designated as preferred stock. As of December 31, 2010, no preferred stock is outstanding.
On December 10, 2010, we completed a follow-on public offering of 11.5 million shares of common stock at an $11.35 per share public offering price on the NYSE. The net proceeds after the underwriting discounts, commissions, fees and expenses amounted to $123.1 million. We used those proceeds to repay $122.3 million principal amount outstanding under the term B loan. The remaining $0.8 million was used for other corporate purposes.
Foreign Currency Translation
The primary economic currency of our Jamaican bauxite mining operation is the U.S. dollar. Certain transactions however, such as salary and wages and local vendor payments, are made in currencies other than the U.S. dollar. These transactions are recorded at the rates of exchange prevailing on the dates of the transactions.
Exchange differences arising on the settlement of monetary items and on the retranslation of monetary items are immaterial and are included in selling, general and administrative expenses on the consolidated statements of operations. Non-monetary items that are measured in terms of historical cost in a foreign currency are not retranslated.
Revenue Recognition
Revenue is recognized when title and risk of loss pass to customers in accordance with contract terms.
Cash Equivalents
Cash equivalents comprise cash and short-term highly liquid investments with initial maturities of three months or less.
Allowance for Doubtful Accounts
Trade accounts receivable are recorded at the invoiced amount and do not bear interest. The allowance for doubtful accounts is our best estimate of the amount of probable credit losses in our existing accounts receivable; however, changes in circumstances relating to accounts receivable may result in a requirement for additional allowances in the future. We determine the allowance based on historical write-off experience, current market trends and, in some cases, our assessment of the customer’s ability to pay outstanding balances. Account balances are charged against the allowance after all collection efforts have been exhausted and the potential for recovery is considered remote.
Inventories
Inventories are stated at the lower of cost or market (“LCM”). We use the last-in-first-out (“LIFO”) method of valuing raw materials, work-in-process and finished goods inventories at our New Madrid smelter and our rolling mills. Inventories at Gramercy and St. Ann and supplies at New Madrid are valued at weighted average cost. The remaining inventories (principally supplies) are stated at cost using the first-in, first-out (“FIFO”) method. Our flat-rolled products’ segment’s inventories, our bauxite inventory at St. Ann, and our alumina and bauxite inventories at Gramercy are valued using a standard costing system, which gives rise to cost variances. Variances are capitalized to inventory in proportion to the quantity of inventory remaining at period end to quantities produced during the period. Variances are recorded such that ending inventory reflects actual costs on a year-to-date basis. Maintenance supplies expected to be used in the next twelve months are included in inventories.
Property, Plant and Equipment
Property, plant and equipment are recorded at cost. Betterments, renewals and repairs that extend the life of the asset are capitalized; other maintenance and repairs are charged to expense as incurred. Major replacement spare parts are capitalized and depreciated over the lesser of the spare part’s useful life or remaining useful life of the associated piece of equipment. Assets, asset retirement obligations and accumulated depreciation accounts are relieved for dispositions or retirements with resulting gains or losses recorded as selling, general and administrative expenses in the consolidated statements of operations. Depreciation is based on the estimated service lives of the assets computed principally by the straight-line method for financial reporting purposes.
68
Table of Contents
NORANDA ALUMINUM HOLDING CORPORATION
NOTES TO CONSOLIDATED FINANCIAL STATEMENTS
Impairment of Long-Lived Assets
We evaluate the recoverability of our long-lived assets for possible impairment when events or circumstances indicate that the carrying amounts may not be recoverable. Long-lived assets are grouped and evaluated for impairment at the lowest levels for which there are identifiable cash flows that are independent of the cash flows of other groups of assets. If it is determined that the carrying amounts of such long-lived assets are not recoverable, the assets are written down to their estimated fair value.
We transfer net property and equipment to assets held for sale when a plan to dispose of the assets has been committed to by management. Assets transferred to assets held for sale are recorded at the lesser of their estimated fair value less estimated costs to sell or carrying amount. Depreciation expense is not recorded for an asset held for sale.
Intangible assets with a definite life (primarily customer relationships) are amortized over their expected lives and are tested for impairment whenever events or circumstances indicate that a carrying amount of an asset may not be recoverable.
Self-Insurance
We are primarily self-insured for workers’ compensation. The self-insurance liability is determined based on claims filed and an estimate of claims incurred but not yet reported. Based on actuarially determined estimates and discount rates of 1.0% in 2009 and 0.6% in 2010, as of December 31, 2009 and 2010, we had $4.8 million and $4.1 million, respectively, of accrued liabilities and $9.5 million and $11.6 million, respectively, of other long-term liabilities related to these claims.
As of December 31, 2009 and 2010, we held $3.4 million in a restricted cash account to secure the payment of workers’ compensation obligations. This restricted cash is included in non-current other assets in the accompanying consolidated balance sheets.
Goodwill and Other Intangible Assets
Goodwill represents the excess of acquisition consideration paid over the fair value of identifiable net tangible and identifiable intangible assets acquired. Goodwill and other indefinite-lived intangible assets are not amortized, but are reviewed for impairment at least annually, in the fourth quarter, or earlier upon the occurrence of certain triggering events.
Goodwill is allocated among and evaluated for impairment at the reporting unit level, which, in our circumstances are the same as our reportable segments. We evaluate goodwill for impairment using a two-step process provided by FASB ASC Topic 350, Intangibles — Goodwill and Other. The first step is to compare the fair value of each of our reporting units to their respective book values, including goodwill. If the fair value of a reporting unit exceeds its book value, reporting unit goodwill is not considered impaired and the second step of the impairment test is not required. If the book value of a reporting unit exceeds its fair value, the second step of the impairment test is performed to measure the amount of impairment loss, if any. The second step of the impairment test compares the implied fair value of the reporting unit’s goodwill with the book value of that goodwill. If the book value of the reporting unit’s goodwill exceeds the implied fair value of that goodwill, an impairment loss is recognized in an amount equal to that excess. The implied fair value of goodwill is determined in the same manner as the amount of goodwill recognized in a business combination. See Note 9, “Goodwill,” and Note 10, “Other Intangible Assets,” for further information.
Use of Estimates
The preparation of consolidated financial statements in conformity with U.S. GAAP requires management to make estimates and assumptions that affect the amounts reported in the consolidated financial statements and accompanying notes. These estimates affect the reported amounts of assets and liabilities and the disclosure of contingent assets and liabilities at the date of the consolidated financial statements and the reported amounts of revenue and expenses during the reporting period. Actual results could differ from these estimates.
In February 2011, we finalized negotiations with the third party owner of the ships which we contract with to transport bauxite to Gramercy from St. Ann. The negotiations were related to our obligation to reimburse certain maintenance costs incurred in the operation of the ships. The negotiations provided additional evidence with respect to conditions that existed at December 31, 2010. As a result, we reduced our recorded liability for these maintenance costs as of December 31, 2010. The effect of this change in estimate was to reduce cost of goods sold in the alumina refining segment by $4.5 million.
Financial Instruments
Our financial instruments with third parties consist of cash and cash equivalents, accounts receivable, derivative assets and liabilities, accounts payable and long-term debt due to third parties. The carrying values and fair values of our third-party debt outstanding are presented in “Long-Term Debt,” Note 13. The remaining financial instruments are carried at amounts that approximate fair value.
Deferred Financing Costs
Costs relating to obtaining debt are capitalized and amortized over the term of the related debt using the straight-line method, which approximates the effective interest method. When all or a portion of a loan is repaid, an associated amount of unamortized financing costs are removed from the related accounts and charged to interest expense.
Concentration of Credit Risk
Financial instruments, including cash and cash equivalents and accounts receivable, expose us to market and credit risks which, at times, may be concentrated with certain groups of counterparties. The financial condition of such counterparties is evaluated
69
Table of Contents
NORANDA ALUMINUM HOLDING CORPORATION
NOTES TO CONSOLIDATED FINANCIAL STATEMENTS
periodically. We generally do not require collateral for trade receivables. Full performance is anticipated. Cash investments are held with major financial institutions and trading companies including registered broker dealers.
Income Taxes
We account for income taxes using the liability method, whereby deferred income taxes reflect the net tax effect of temporary differences between the carrying amounts of assets and liabilities for financial reporting purposes and the amounts used for income tax purposes. In evaluating our ability to realize deferred tax assets, we use judgment in considering the relative impact of negative and positive evidence. The weight given to the potential effect of negative and positive evidence is commensurate with the extent to which it can be objectively verified. Based on the weight of evidence, both negative and positive, if it is more likely than not that some portion or all of a deferred tax asset will not be realized, a valuation allowance is established.
We must deal with uncertainties in the application of complex tax regulations in the calculation of tax liabilities. We are subject to routine income tax audits. We provide for uncertain tax positions and the related interest and penalties based upon management’s assessment of whether a tax benefit is more likely than not to be sustained upon examination by tax authorities. We make this assessment based on only the technical merits of the tax position. The technical merits of a tax position are derived from both statutory and judicial authority (legislation and statutes, legislative intent, regulations, rulings, and case law) and their applicability to the facts and circumstances of the tax position. If a tax position does not meet the more likely than not recognition threshold, the benefit of that position is not recognized in the financial statements and a liability for unrecognized tax benefits is established. A tax position that meets the more likely than not recognition threshold is measured to determine the amount of benefit to recognize in the financial statements. The tax benefit recognized is measured as the largest amount of benefit that is greater than 50 percent likely of being realized upon ultimate resolution with a taxing authority. To the extent that we prevail in matters for which a liability for an unrecognized tax benefit is established or are required to pay amounts in excess of the liability established, our effective tax rate in a given financial statement period may be affected.
Shipping and Handling
Shipping and handling costs are classified as a component of cost of sales in the consolidated statements of operations. Shipping and handling revenue is classified as a component of sales in the consolidated statements of operations.
Pensions and Other Post-Retirement Benefits
We sponsor defined benefit pension and other post-retirement benefit (“OPEB”) plans for which we recognize expenses, assets and liabilities based on actuarial assumptions regarding the valuation of benefit obligations and the future performance of plan assets. We recognize the funded status of the plans as an asset or liability in the consolidated financial statements, measure defined benefit pension and OPEB plan assets and obligations as of the end of our fiscal year, and recognize the change in the funded status of defined benefit pension and OPEB plans in other comprehensive income. The primary assumptions used in calculating pension and OPEB expense and liabilities are related to the discount rates at which the future obligations are discounted to value the liability, expected rate of return on plan assets, and projected salary increases. These rates are estimated annually as of December 31.
Pension and OPEB benefit obligations are actuarially calculated using management’s best estimates and based on expected service periods, salary increases and retirement ages of employees. Pension and OPEB benefit expense includes the actuarially computed cost of benefits earned during the current service periods, the interest cost on accrued obligations, the expected return on plan assets based on fair market value and the straight-line amortization of net actuarial gains and losses and adjustments due to plan amendments. All net actuarial gains and losses are amortized over the expected average remaining service life of the employees.
Post-Employment Benefits
We provide certain benefits to former or inactive employees after employment but before retirement and accrue for the related cost over the service lives of the employees. These benefits include, among others, disability, severance, and workers’ compensation. We are self-insured for these liabilities. At December 31, 2010, we carried a liability totaling $0.6 million for these benefits, based on actuarially determined estimates. These estimates have not been discounted due to the short duration of the future payments.
Environmental Liabilities and Remediation Costs
Environmental liabilities
We are subject to environmental regulations which create legal obligations to remediate or monitor certain environmental conditions present at our facilities. Liabilities for these environmental loss contingencies are accrued when it is probable that a liability has been incurred and the amount of loss can reasonably be estimated.
The measurement of environmental liabilities is based on an evaluation of currently available information with respect to each individual site and considers factors such as existing technology, presently enacted laws and regulations, and prior experience in remediation of contaminated sites. An environmental liability related to cleanup of a contaminated site might include, for example, an
70
Table of Contents
NORANDA ALUMINUM HOLDING CORPORATION
NOTES TO CONSOLIDATED FINANCIAL STATEMENTS
accrual for one or more of the following types of costs: site investigation and testing costs, cleanup costs, costs related to soil and water contamination, post-remediation monitoring costs, and outside legal fees.
As assessments and remediation progress at individual sites, the amount of projected cost is reviewed periodically, and the liability is adjusted to reflect additional technical and legal information that becomes available. Actual costs to be incurred at identified sites in future periods may vary from the estimates, given inherent uncertainties in evaluating environmental exposures. Refer to Note 23, “Commitments and Contingencies,” for additional information on our environmental liabilities.
Environmental liabilities are undiscounted. The long and short-term portions of the environmental liabilities are recorded on the balance sheet in other long-term liabilities and accrued liabilities, respectively.
Environmental remediation costs
Costs incurred to improve our property as compared to the condition of the property when originally acquired, or to prevent environmental contamination from future operations, are capitalized as incurred. We expense environmental costs related to existing conditions resulting from past or current operations and from which no current or future benefit is discernable.
Asset Retirement Obligations
We are subject to environmental regulations which create legal obligations related to the disposal of certain assets at the end of their lives. We recognize liabilities, at fair value, for existing legal asset retirement obligations. Such liabilities are adjusted for accretion costs and revisions in estimated cash flows. The related asset retirement costs are capitalized as increases to the carrying amount of the associated long-lived assets and accumulated depreciation on these capitalized costs is recognized.
Share-Based Payments
We account for employee equity awards under the fair value method. Accordingly, we measure the cost of employee services received in exchange for an award of equity instruments based on the grant date fair value of the award. We recognize that cost over the requisite service period.
Derivative Instruments and Hedging Activities
Derivatives are reported on the balance sheet at fair value. For derivatives that are designated and qualify as cash flow hedges, the effective portion of changes in fair value are initially recorded in other comprehensive income (“OCI”) as a separate component of stockholders’ equity and subsequently reclassified into earnings in the period during which the hedged transaction is recognized in earnings. The ineffective portion of changes in fair value is reported in (gain) loss on hedging activities immediately. For derivative instruments not designated as cash flow hedges, changes in the fair values are reported in (gain) loss on hedging activities in the period of change.
U.S. GAAP permits entities that enter into master netting arrangements with the same counterparty as part of their derivative transactions to offset in their consolidated financial statements net derivative positions against the fair value of amounts recognized for the right to reclaim cash collateral or the obligation to return cash collateral under those arrangements.
Earnings per Share
Basic earnings per share (“EPS”) is calculated as income available to common stockholders divided by the weighted-average number of shares outstanding during the period. Diluted EPS is calculated using the weighted-average outstanding common shares determined using the treasury stock method for options. EPS is the same calculation as net income (loss) per common share.
| 2. | JOINT VENTURE TRANSACTION |
On August 31, 2009, we became the sole owner of both Gramercy and St. Ann. Prior to the Joint Venture Transaction, our 50% investment interests in the joint ventures were accounted for by the equity method. The results of operations related to Gramercy and St. Ann are consolidated in our consolidated financial statements from the transaction closing date.
Gain Calculation
We measured the fair value of assets acquired and liabilities assumed in the Joint Venture Transaction utilizing valuation techniques based on the nature of the asset or liability being measured and the reliability of inputs used in arriving at fair value. See Note 22, “Fair Value Measurements,” for further discussion of significant assumptions used in measuring these fair values. Expenses related to the Joint Venture Transaction such as valuation, legal and consulting costs are included in selling, general and administrative expenses.
The Joint Venture Transaction was a business combination achieved in stages, since we owned 50% of both Gramercy and St. Ann prior to August 31, 2009. We recorded $18.5 million as a gain on business combination related to re-measuring our investment in affiliates to fair value as of the acquisition date. The $1.2 million tax effect of this gain was recorded as tax expense. The Joint Venture Transaction was also a bargain purchase. Based on the fair values assigned to the assets acquired and liabilities
71
Table of Contents
NORANDA ALUMINUM HOLDING CORPORATION
NOTES TO CONSOLIDATED FINANCIAL STATEMENTS
assumed, we recorded a $101.8 million (net of tax) gain on business combination related to the bargain purchase. The total gain on business combination recognized was $120.3 million.
The calculation of the gain on business combination is summarized below (in millions):
| August 31, 2009 | ||||||||
| $ | $ | |||||||
| Gain on business combination from acquired interests: |
||||||||
| Transaction date fair value of our previous 50% equity interest: |
||||||||
| Transaction date carrying value of our 50% equity interest |
126.8 | |||||||
| Revaluation of our previous 50% equity interest |
18.5 | 145.3 | ||||||
| Non-controlling interest in NJBP (see Note 21, “Non-Controlling Interest”) |
6.0 | |||||||
| 151.3 | ||||||||
| Fair value of assets acquired and liabilities assumed: |
||||||||
| Cash and cash equivalents |
11.1 | |||||||
| Accounts receivable, net |
61.3 | |||||||
| Inventories, net |
59.2 | |||||||
| Property, plant and equipment, net |
195.8 | |||||||
| Other intangible assets, nets |
19.8 | |||||||
| Other assets |
33.8 | |||||||
| Deferred tax liabilities |
(43.6 | ) | ||||||
| Accounts payable and accrued liabilities and other long-term liabilities |
(58.5 | ) | ||||||
| Environmental, land and reclamation liabilities |
(25.7 | ) | ||||||
| Other long-term liabilities |
(0.1 | ) | 253.1 | |||||
| 101.8 | ||||||||
| Total gain on business combination: |
||||||||
| Gain on business combination from acquired interests |
101.8 | |||||||
| Gain on business combination related to revaluing our previous 50% equity interest |
18.5 | |||||||
| 120.3 | ||||||||
The results of operations related to Gramercy and St. Ann are included in our consolidated financial statements from the closing date of the transaction. The operating results of Gramercy and St. Ann included in our consolidated statements of operations for the period from the transaction date of August 31, 2009 to December 31, 2009 are summarized below (in millions):
| $ | ||||
| Sales |
71.1 | |||
| Operating loss |
(32.7 | ) | ||
| Net loss |
(20.8 | ) | ||
Pro forma Information
The following table presents the unaudited pro forma condensed statements of operations data for the years ended December 31, 2008 and 2009 and reflects the results of operations as if the Joint Venture Transaction had been effective January 1, 2008. These amounts have been calculated by adjusting the results of Gramercy and St. Ann to reflect the additional inventory cost, depreciation and amortization that would have been charged assuming the fair value adjustments to inventory, property, plant and equipment and intangible assets had been applied on January 1, 2008, together with the consequential tax effects. The unaudited pro forma financial information is not intended to represent the consolidated results of operations we would have reported if the acquisition had been completed at January 1, 2008, nor is it necessarily indicative of future operating results.
72
Table of Contents
NORANDA ALUMINUM HOLDING CORPORATION
NOTES TO CONSOLIDATED FINANCIAL STATEMENTS
Unaudited pro forma condensed statements of operations are presented below (in millions, except per share data):
| Pro
forma Year ended December 31, |
||||||||
| 2008 | 2009 | |||||||
| Sales |
$ | 1,609.0 | $ | 879.1 | ||||
| Operating income (loss) |
74.7 | (175.0 | ) | |||||
| Net income (loss) |
(58.3 | ) | 19.2 | |||||
| Net income (loss) per common share: |
||||||||
| Basic |
$ | (1.34 | ) | $ | 0.44 | |||
| Diluted |
$ | (1.34 | ) | $ | 0.44 | |||
| Weighted-average common shares outstanding: |
||||||||
| Basic |
43.44 | 43.53 | ||||||
| Diluted |
43.44 | 43.53 | ||||||
| 3. | NEW MADRID POWER OUTAGE |
During the week of January 26, 2009, power supply to our New Madrid smelter was interrupted several times because of a severe ice storm in Southeastern Missouri. As a result of the power outage, we lost approximately 75% of the smelter capacity. The smelter became fully operational again during first quarter 2010.
We reached a $67.5 million settlement with our insurance carriers, all of which had been received by September 30, 2009. Insurance proceeds funded $11.5 million of capital expenditures at our New Madrid smelter through September 30, 2009.
The following table shows the insurance activity as presented in our consolidated financial statements through September 30, 2009 when we finalized all settlements and received related proceeds (in millions):
| Nine months ended September 30, 2009 | ||||||||||||
| Expenses incurred |
Related proceeds |
Net impact |
||||||||||
| $ | $ | $ | ||||||||||
| Cost of sales |
17.4 | (17.4 | ) | — | ||||||||
| Selling, general and administrative expenses |
6.6 | (6.6 | ) | — | ||||||||
| Excess insurance proceeds |
— | (43.5 | ) | (43.5 | ) | |||||||
| Total |
24.0 | (67.5 | ) | (43.5 | ) | |||||||
| Insurance cash receipts through September 30, 2009 |
(67.5 | ) | ||||||||||
The line item titled “Excess insurance proceeds” reflects the residual insurance recovery after applying total expected proceeds recognized against the losses incurred through September 30, 2009. We incurred costs in the fourth quarter of 2009 of $3.3 million related to bringing production back to full capacity. The excess insurance proceeds are not intended to represent a gain on the insurance claim, but only a timing difference between expected proceeds recognized and claim-related costs incurred.
| 4. | RESTRUCTURING |
In December 2008, we announced a Company-wide workforce and business process restructuring that reduced our operating costs, conserved liquidity and improved operating efficiencies. The workforce restructuring plan involved staff reductions at corporate, our smelter in New Madrid, and at our rolling mills. These reductions were substantially completed during fourth quarter 2008. Our restructuring liability as of December 31, 2008 was $6.8 million, all of which was paid to terminated employees during 2009.
On February 26, 2010, we announced a workforce and business process restructuring in our U.S. operations that reduced operating costs, conserved liquidity and improved operating efficiency. The U.S. workforce restructuring plan reduced headcount through a combination of voluntary retirement packages and involuntary terminations. Substantially all activities associated with this workforce reduction were completed as of February 26, 2010.
In connection with a decision to contract the substantial portion of our bauxite mining to third party contractors, on April 21, 2010, we announced a workforce reduction in our Jamaican bauxite mining operations. The workforce restructuring plan reduced headcount through involuntary terminations. Substantially all activities associated with this workforce reduction were completed as of April 21, 2010. The majority of 2010 restructuring benefits were paid as of December 31, 2010.
These 2010 actions resulted in $7.6 million of pre-tax charges recorded in the year ended December 31, 2010 primarily due to one-time termination benefits and early retirement benefits. These charges were recorded when employee service requirements, if any, were met and are reflected in the consolidated statements of operations as a component of selling, general and administrative expenses.
73
Table of Contents
NORANDA ALUMINUM HOLDING CORPORATION
NOTES TO CONSOLIDATED FINANCIAL STATEMENTS
The following table summarizes the impact of our restructuring activities (in millions):
| Total restructuring liability |
||||
| $ | ||||
| Balance, December 31, 2008 |
6.8 | |||
| Benefits paid in 2009 related to 2008 restructuring |
(6.8 | ) | ||
| Balance, December 31, 2009 |
— | |||
| 2010 restructuring expense: |
||||
| Bauxite |
3.1 | |||
| Alumina refining |
1.4 | |||
| Primary aluminum products |
1.6 | |||
| Flat rolled products |
1.1 | |||
| Corporate |
0.4 | |||
| Total |
7.6 | |||
| Benefits paid in 2010 |
(7.1 | ) | ||
| Balance, December 31, 2010 |
0.5 | |||
Restructuring costs are recorded in accrued liabilities on the consolidated balance sheets. The restructuring liability as of December 31, 2010 does not include window benefits recorded during first quarter 2010 of which $1.6 million was recorded in pension liabilities and adjusted through net periodic pension cost and $0.3 million was recorded in other accrued liabilities.
| 5. | SUPPLEMENTAL FINANCIAL STATEMENT INFORMATION |
Statements of operations (in millions):
| Year ended December 31, | ||||||||||||
| 2008 | 2009 | 2010 | ||||||||||
| $ | $ | $ | ||||||||||
| Interest expense |
89.9 | 53.7 | 31.2 | |||||||||
| Interest income |
(1.9 | ) | (0.2 | ) | (0.1 | ) | ||||||
| Interest expense, net |
88.0 | 53.5 | 31.1 | |||||||||
Statements of cash flows (in millions):
| Year ended December 31, | ||||||||||||
| 2008 | 2009 | 2010 | ||||||||||
| $ | $ | $ | ||||||||||
| Interest paid |
87.2 | 17.3 | 7.6 | |||||||||
| Income taxes paid (received) |
48.1 | (11.8 | ) | 14.2 | ||||||||
| Prepaid Jamaican income taxes |
— | — | 10.0 | |||||||||
See Note 13, “Long-Term Debt”, for a discussion of interest paid-in-kind during 2009, and 2010.
Purchases of property, plant and equipment accrued in accounts payable and not yet paid were $6.3 million for the year ended December 31, 2010 and are not reflected as capital expenditures on the statements of cash flows. Amounts in previous reported years are immaterial.
Depreciation and amortization in the accompanying consolidated statements of cash flows includes depreciation of property, plant and equipment, amortization of intangibles and amortization of other long-term assets.
| 6. | CASH AND CASH EQUIVALENTS |
Cash and cash equivalents consisted of the following (in millions):
| As of December 31, | ||||||||
| 2009 | 2010 | |||||||
| $ | $ | |||||||
| Cash |
12.3 | 12.4 | ||||||
| Money market funds |
154.9 | 21.4 | ||||||
| Total cash and cash equivalents |
167.2 | 33.8 | ||||||
Cash and cash equivalents include all cash balances and highly liquid investments with a maturity of three months or less at the date of purchase. We place our temporary cash investments with high credit quality financial institutions, which include money market funds invested in U.S. Treasury securities, short-term treasury bills and commercial paper. At December 31, 2009 and 2010, all domestic cash balances, excluding the money market funds, were fully insured by the Federal Deposit Insurance Corporation
74
Table of Contents
NORANDA ALUMINUM HOLDING CORPORATION
NOTES TO CONSOLIDATED FINANCIAL STATEMENTS
(“FDIC”). Cash balances held in non-FDIC insured foreign banks are immaterial as of December 31, 2009 and 2010. We consider our investments in money market funds to be available for use in our operations.
| 7. | INVENTORIES |
We use the LIFO method of valuing raw materials, work-in-process and finished goods inventories at our New Madrid smelter and our rolling mills. Supplies inventories at our rolling mills are valued at FIFO. Inventories at Gramercy and St. Ann and supplies at New Madrid are valued at weighted average cost and are not subject to the LIFO adjustment. Gramercy and St. Ann inventories comprise 30.0% and 24.9% of total inventories, at cost, at December 31, 2009 and 2010, respectively. Inventories, net, consisted of the following (in millions):
| As of December 31, | ||||||||
| 2009 | 2010 | |||||||
| $ | $ | |||||||
| Raw materials, at cost |
55.2 | 61.3 | ||||||
| Work-in-process, at cost |
50.7 | 66.1 | ||||||
| Finished goods, at cost |
24.7 | 27.7 | ||||||
| Total inventories, at cost |
130.6 | 155.1 | ||||||
| LIFO adjustment |
23.3 | 13.1 | ||||||
| LCM reserve |
(7.9 | ) | — | |||||
| Inventories, at lower of cost or market |
146.0 | 168.2 | ||||||
| Supplies |
36.4 | 32.9 | ||||||
| Total inventories, net |
182.4 | 201.1 | ||||||
Work-in-process and finished goods inventories consist of the cost of materials, labor and production overhead costs. Supplies inventory consists primarily of maintenance supplies expected to be used within the next twelve months. Non-current maintenance supplies are included in other assets in the accompanying consolidated balance sheets.
An actual valuation of inventories valued under the LIFO method is made at the end of each year based on inventory levels and costs at that time. Quarterly inventory determinations under LIFO are based on assumptions about projected inventory levels at the end of the year. During the years ended December 31, 2009 and 2010, we recorded LIFO losses of $10.8 million and $0.1 million, respectively, due to decrements in inventory quantities in these years.
| 8. | PROPERTY, PLANT AND EQUIPMENT |
Property, plant and equipment, net, consisted of the following (in millions):
| As of December 31, | ||||||||||||
| Estimated useful lives |
2009 | 2010 | ||||||||||
| (in years) | $ | $ | ||||||||||
| Land |
— | 45.5 | 47.5 | |||||||||
| Buildings and improvements |
10 — 47 | 114.9 | 127.0 | |||||||||
| Machinery and equipment |
3 — 50 | 784.6 | 817.6 | |||||||||
| Construction in progress |
— | 28.7 | 34.5 | |||||||||
| 973.7 | 1,026.6 | |||||||||||
| Accumulated depreciation |
(228.2 | ) | (306.7 | ) | ||||||||
| Total property, plant and equipment, net |
745.5 | 719.9 | ||||||||||
Cost of sales in our consolidated statements of operations includes depreciation expense on property, plant and equipment of the following amounts (in millions):
| Year ended December 31, |
$ | |||
| 2008 |
94.5 | |||
| 2009 |
87.3 | |||
| 2010 |
88.2 | |||
Depreciation expense for 2009 in the table above excludes the impact of any insurance recoveries related to the power outage discussed in Note 3, “New Madrid Power Outage.”
In August 2009, based on changes in expectations about the utilization of certain equipment, we wrote off excess equipment of the flat rolled products segment which was previously reported as construction in progress with a net book value of $3.0 million.
75
Table of Contents
NORANDA ALUMINUM HOLDING CORPORATION
NOTES TO CONSOLIDATED FINANCIAL STATEMENTS
| 9. | GOODWILL |
Changes in the carrying amount of goodwill were as follows (in millions):
| Primary aluminum products | Flat-rolled products | Total | ||||||||||||||||||
| Goodwill | Impairment losses | Goodwill | Impairment losses | Goodwill | ||||||||||||||||
| $ | $ | $ | $ | $ | ||||||||||||||||
| Balance, December 31, 2008 |
137.6 | — | 130.7 | (25.5 | ) | 242.8 | ||||||||||||||
| Impairment loss |
— | — | — | (105.2 | ) | (105.2 | ) | |||||||||||||
| Balance, December 31, 2009 |
137.6 | — | 130.7 | (130.7 | ) | 137.6 | ||||||||||||||
| Balance, December 31, 2010 |
137.6 | — | 130.7 | (130.7 | ) | 137.6 | ||||||||||||||
Impairments
During fourth quarter 2008, as the impact of the global economic contraction began to be realized, we recorded a $25.5 million impairment write-down of goodwill in our flat rolled products segment. In connection with the preparation of our consolidated financial statements for first quarter 2009, we concluded that it was appropriate to re-evaluate our goodwill and intangible assets for potential impairment in light of the power outage at our New Madrid smelter and the accelerated deterioration of demand volumes in both our primary aluminum products and flat rolled products segments. Based on our interim impairment analysis during first quarter 2009, we recorded an impairment charge of $40.3 million on goodwill in the flat rolled products segment. No further impairment indicators were noted in the second or third quarters of 2009 regarding the recoverability of goodwill; therefore, no goodwill impairment testing was necessary at June 30, 2009 or September 30, 2009.
Our impairment analysis in fourth quarter 2009 related to our annual impairment test (performed on October 1) and resulted in a $64.9 million write-down of the remaining goodwill in the flat rolled products segment. This write-down reflected our view that the flat rolled products markets would be increasingly competitive for the foreseeable future. The combination of price-based competition and increased demand for lighter gauge products were expected to limit our opportunities for achieving higher fabrication margins. Our annual impairment test performed in the fourth quarter of 2010 resulted in no impairment to goodwill.
Our impairment analyses include assumptions about future profitability and cash flows, which we believe reflect our best estimates at the date the valuations are performed. The estimates are based on information that is known or knowable at the date of the valuations. It is at least reasonably possible that the assumptions we employ will be materially different from the actual amounts or results, and that additional impairment charges may be necessary in the future.
| 10. | OTHER INTANGIBLE ASSETS |
Intangible assets, net, consisted of the following (in millions):
| Weighted average life |
As of December 31, | |||||||||||
| 2009 | 2010 | |||||||||||
| (in years) | $ | $ | ||||||||||
| Non-amortizable: |
||||||||||||
| Trade names |
Indefinite | 17.7 | 17.7 | |||||||||
| Amortizable: |
||||||||||||
| Customer relationships |
13.0 | 71.0 | 71.0 | |||||||||
| Other |
2.5 | 0.7 | 0.7 | |||||||||
| 89.4 | 89.4 | |||||||||||
| Accumulated amortization |
|
(10.4 | ) | (16.4 | ) | |||||||
| Total intangible assets, net |
|
79.0 | 73.0 | |||||||||
Selling, general, and administrative expenses in our consolidated statements of operations include amortization of intangible assets in the following amounts (in millions):
| Year ended December 31, |
$ | |||
| 2008 |
3.8 | |||
| 2009 |
4.3 | |||
| 2010 |
6.0 | |||
Expected amortization of intangible assets for each of the next five years is as follows (in millions):
| $ | ||||
| 2011 |
5.9 | |||
| 2012 |
5.9 | |||
| 2013 |
5.9 | |||
| 2014 |
5.9 | |||
| 2015 |
5.9 | |||
76
Table of Contents
NORANDA ALUMINUM HOLDING CORPORATION
NOTES TO CONSOLIDATED FINANCIAL STATEMENTS
Impairments
As part of our interim impairment analysis during first quarter 2009, which is discussed in Note 9, “Goodwill,” we recorded an impairment charge for intangible assets of $2.8 million related to the indefinite-lived trade names in the flat rolled products segment. Our impairment analysis of our indefinite-lived intangible assets in fourth quarter 2009 related to our annual impairment test (performed on October 1) and resulted in no write-downs. Further, as a result of the goodwill impairment write-down in the flat rolled products segment during fourth quarter 2009, we tested our flat rolled products segment amortizable intangible assets for impairment and determined that the carrying amounts of these long-lived assets was recoverable, so no write-down was necessary. Our annual impairment test performed in the fourth quarter of 2010 resulted in no impairment to our indefinite-lived intangible assets. Future impairment charges could be required if we do not achieve cash flow, revenue and profitability projections.
| 11. | SUPPLEMENTAL BALANCE SHEET INFORMATION |
Accounts receivable, net, consisted of the following (in millions):
| As of December 31, | ||||||||
| 2009 | 2010 | |||||||
| $ | $ | |||||||
| Trade |
85.7 | 131.8 | ||||||
| Allowance for doubtful accounts |
(0.2 | ) | (0.2 | ) | ||||
| Total accounts receivable, net |
85.5 | 131.6 | ||||||
Other current assets consisted of the following (in millions):
| As of December 31, | ||||||||
| 2009 | 2010 | |||||||
| $ | $ | |||||||
| Current foreign deferred tax asset |
5.9 | 2.8 | ||||||
| Employee loans receivable, net |
2.1 | 2.1 | ||||||
| Restricted cash (see Note 23, “Commitments and Contingencies”) |
1.9 | 9.8 | ||||||
| Other current assets |
5.8 | 4.5 | ||||||
| Total other current assets |
15.7 | 19.2 | ||||||
Other assets consisted of the following (in millions):
| As of December 31, | ||||||||
| 2009 | 2010 | |||||||
| $ | $ | |||||||
| Deferred financing costs, net of amortization |
17.9 | 11.0 | ||||||
| Cash surrender value of life insurance |
22.8 | 24.0 | ||||||
| Pension asset (see Note 14, “Pensions and Other Post-Retirement Benefits”) |
6.5 | 5.9 | ||||||
| Restricted cash (see Note 1, “Accounting Policies” and Note 20, “Reclamation, Land and Asset Retirement Obligations”) |
10.7 | 13.6 | ||||||
| Supplies |
17.0 | 16.1 | ||||||
| Prepaid income taxes |
— | 5.0 | ||||||
| Other |
10.3 | 10.0 | ||||||
| Total other assets |
85.2 | 85.6 | ||||||
77
Table of Contents
NORANDA ALUMINUM HOLDING CORPORATION
NOTES TO CONSOLIDATED FINANCIAL STATEMENTS
Accrued liabilities consisted of the following (in millions):
| As of December 31, | ||||||||
| 2009 | 2010 | |||||||
| $ | $ | |||||||
| Compensation and benefits |
31.8 | 26.7 | ||||||
| Workers’ compensation |
4.8 | 4.1 | ||||||
| Other operating expenses |
12.8 | 9.4 | ||||||
| Asset retirement obligations (see Note 20, “Reclamation, Land and Asset Retirement Obligations”) |
1.6 | 2.2 | ||||||
| Land obligation (see Note 20, “Reclamation, Land and Asset Retirement Obligations”) |
2.6 | 2.2 | ||||||
| Reclamation obligation (see Note 20, “Reclamation, Land and Asset Retirement Obligations”) |
1.7 | 2.8 | ||||||
| Environmental remediation obligations (see Note 23, “Commitments and Contingencies”) |
1.3 | 2.0 | ||||||
| Obligations to the Government of Jamaica (see Note 21, “Non-Controlling Interest”) |
4.9 | 4.0 | ||||||
| Pension and OPEB liabilities (see Note 14, “Pensions and Other Post-Retirement Benefits”) |
0.5 | 0.7 | ||||||
| Restructuring costs (see Note 4, “Restructuring”) |
— | 0.5 | ||||||
| Total accrued liabilities |
62.0 | 54.6 | ||||||
Other long-term liabilities consisted of the following (in millions):
| As of December 31, | ||||||||
| 2009 | 2010 | |||||||
| $ | $ | |||||||
| Reserve for uncertain tax positions (see Note 16, “Income Taxes”) |
10.1 | 10.5 | ||||||
| Workers’ compensation |
9.5 | 11.6 | ||||||
| Asset retirement obligations (see Note 20, “Reclamation, Land and Asset Retirement Obligations”) |
11.8 | 12.7 | ||||||
| Land obligation (see Note 20, “Reclamation, Land and Asset Retirement Obligations”) |
5.1 | 4.5 | ||||||
| Reclamation obligation (see Note 20, “Reclamation, Land and Asset Retirement Obligations”) |
7.2 | 6.6 | ||||||
| Environmental remediation obligations (see Note 23, “Commitments and Contingencies”) |
3.0 | 2.3 | ||||||
| Deferred interest payable |
2.9 | 2.3 | ||||||
| Deferred compensation and other |
5.9 | 7.4 | ||||||
| Total other long-term liabilities |
55.5 | 57.9 | ||||||
Accumulated other comprehensive income consisted of the following (in millions):
| As of December 31, | ||||||||
| 2009 | 2010 | |||||||
| $ | $ | |||||||
| Net unrealized gains on cash flow hedges, net of tax of $113.4 and $75.1, respectively |
199.1 | 132.1 | ||||||
| Pension adjustment, net of tax benefit of $32.2 and $36.8, respectively |
(54.3 | ) | (62.6 | ) | ||||
| Total accumulated other comprehensive income |
144.8 | 69.5 | ||||||
| 12. | RELATED PARTY TRANSACTIONS |
In connection with the Apollo Acquisition, we entered into a management consulting and advisory services agreement with our principal stockholders (affiliated with Apollo Management VI) for the provision of certain structuring, management and advisory services for an initial term ending on May 18, 2017. Terms of the agreement provided for annual fees of $2.0 million, payable in one lump sum annually. Historically, we expensed approximately $0.5 million of such fees each quarter within selling, general and administrative expenses in our consolidated statements of operations. Upon completion of our initial public offering in second quarter 2010, as permitted by the terms of that management agreement, Apollo terminated the agreement and received a $13.5 million fee from the Company. This payment consisted of $1.0 million in management fees accrued in 2010 prior to the termination of the management agreement, and $12.5 million in accelerated management fees due upon termination of the management agreement. Such fee is included in selling, general and administrative expenses in our consolidated statements of operations.
78
Table of Contents
NORANDA ALUMINUM HOLDING CORPORATION
NOTES TO CONSOLIDATED FINANCIAL STATEMENTS
We sell flat rolled aluminum products to Berry Plastics Corporation, a portfolio company of Apollo, under an annual sales contract. Sales to this entity were as follows (in millions):
| Year ended December 31, |
$ | |||
| 2008 |
8.6 | |||
| 2009 |
6.2 | |||
| 2010 |
10.6 | |||
Until the Joint Venture Transaction on August 31, 2009 (see Note 2, “Joint Venture Transaction,”) Gramercy was our 50% owned joint venture and purchases of alumina from Gramercy were considered related party transactions. Related party purchases from Gramercy prior to the Joint Venture Transaction were as follows (in millions):
| $ | ||||
| Year ended December 31, 2008 |
163.5 | |||
| Period from January 1, 2009 to August 31, 2009 |
56.0 | |||
| 13. | LONG-TERM DEBT |
The carrying values and fair values of our outstanding debt were as follows (in millions):
| As of December 31, 2009 | As of December 31, 2010 | |||||||||||||||||||||||
| Carrying value |
Fair value | Interest rate |
Carrying value |
Fair value | Interest rate |
|||||||||||||||||||
| $ | $ | % | $ | $ | % | |||||||||||||||||||
| Noranda HoldCo: |
||||||||||||||||||||||||
| Senior Floating Rate Notes due 2014 (“HoldCo Notes”) |
63.6 | 41.3 | 7.02 | — | — | — | ||||||||||||||||||
| Noranda AcquisitionCo: |
||||||||||||||||||||||||
| Senior Floating Rate Notes due 2015 (“AcquisitionCo Notes”) |
344.1 | 264.9 | 5.27 | 341.5 | 309.0 | 5.19 | ||||||||||||||||||
| Term B loan due 2014 |
328.1 | 328.1 | 2.23 | 78.2 | 78.2 | 2.01 | ||||||||||||||||||
| Revolving credit facility |
215.9 | 215.9 | 2.23 | — | — | — | ||||||||||||||||||
| Total debt, net |
951.7 | 419.7 | ||||||||||||||||||||||
| Less: current portion |
(7.5 | ) | — | |||||||||||||||||||||
| Long-term debt, net |
944.2 | 419.7 | ||||||||||||||||||||||
Debt maturities over each of the next five years and thereafter are as follows (in millions):
| $ | ||||
| 2011 |
— | |||
| 2012 |
— | |||
| 2013 |
— | |||
| 2014 |
78.2 | |||
| 2015 |
341.5 | |||
| Thereafter |
— | |||
| Total debt |
419.7 | |||
The debt maturity schedule above does not reflect the effect of any optional repayments we may elect to make on our outstanding debt, nor does it include additional indebtedness we may incur by electing to pay interest in kind.
Senior secured credit facilities
Noranda AcquisitionCo is a party to senior secured credit facilities, as follows:
| • | a term B loan that matures in May 2014 with an original principal amount of $500.0 million, of which $78.2 million remained outstanding as of December 31, 2010. |
| • | a $250.0 million revolving credit facility that matures in May 2013, which includes borrowing capacity available for letters of credit and for borrowing on same-day notice. We had no outstanding balance under the revolving credit facility at December 31, 2010. As a result of the revolving credit facility repurchase in 2009, our maximum borrowing capacity was reduced $7.3 million from $250.0 million to $242.7 million. As of December 31, 2010, we have $215.2 million available for borrowing, net of $27.5 million outstanding letters of credit. |
The senior secured credit facilities permit Noranda AcquisitionCo to incur incremental term and revolving loans under such facilities in an aggregate principal amount of up to $200.0 million. Incurrence of such incremental indebtedness under the senior secured credit facilities is subject to, among other things, Noranda AcquisitionCo’s compliance with a maximum senior secured net
79
Table of Contents
NORANDA ALUMINUM HOLDING CORPORATION
NOTES TO CONSOLIDATED FINANCIAL STATEMENTS
debt to Adjusted EBITDA ratio (in each case as defined in the credit agreement governing our senior secured credit facilities) of 3.0 to 1.0. As of December 31, 2010, our Senior Secured Net Debt to Adjusted EBITDA ratio was 0.2 to 1.0. Noranda AcquisitionCo has no commitments from any lender to provide such incremental loans.
The senior secured credit facilities are guaranteed by us and by all of the existing and future direct and indirect wholly owned domestic subsidiaries of Noranda AcquisitionCo that are not designated as “unrestricted” under the senior secured credit facilities. These guarantees are full and unconditional. NHB Capital LLC (“NHB”), in which we have 100% ownership interest, is the only unrestricted subsidiary and the only domestic subsidiary that has not guaranteed these obligations. The senior secured credit facilities are secured by first priority pledges of all of the equity interests in Noranda AcquisitionCo and all of the equity interests in each of the existing and future direct and indirect wholly owned domestic subsidiaries of Noranda AcquisitionCo other than subsidiaries of unrestricted subsidiaries. The senior secured credit facilities are also secured by first priority security interests in substantially all of the assets of Noranda AcquisitionCo, as well as those of each of our existing and future direct and indirect wholly owned domestic subsidiaries that have guaranteed the senior secured credit facilities.
Term B loan
Interest on the loan is based either on LIBOR or the prime rate, at Noranda AcquisitionCo’s election, in either case plus an applicable margin (1.75% over LIBOR at December 31, 2010) that depends upon the ratio of Noranda AcquisitionCo’s Senior Secured Net Debt to EBITDA (in each case as defined in the credit agreement governing the term B loan). The interest rate at December 31, 2010 was 2.01%. Interest on the term B loan is payable no less frequently than every six months and such loan amortizes at a rate of 1% per annum.
Noranda AcquisitionCo is required to prepay amounts outstanding under the credit agreement based on an amount equal to 50% of our Excess Cash Flow (as calculated in accordance with the terms of the credit agreement governing the term B loan) within 95 days after the end of each fiscal year. The required percentage of Noranda AcquisitionCo’s Excess Cash Flow payable to the lenders under the credit agreement governing the term B loan may be reduced from 50% to either 25% or 0% based on Noranda AcquisitionCo’s Senior Secured Net Debt to EBITDA ratio (in each case as defined in the credit agreement governing the term B loan) or the principal amount of term B loan that has been repaid. During 2010, Noranda AcquisitionCo made a mandatory prepayment of $7.5 million and optional prepayments of $242.4 million using available cash balances, proceeds from issuance of common shares and hedge termination proceeds. No mandatory prepayments are due in 2011 pursuant to the cash flow sweep provisions of the credit agreement.
Revolving credit facility
Interest on the revolving credit facility is based either on LIBOR or the prime rate, at Noranda AcquisitionCo’s election, in either case plus an applicable margin (1.75% over LIBOR at December 31, 2010) that depends upon the ratio of Noranda AcquisitionCo’s Senior Secured Net Debt to EBITDA (in each case as defined in the applicable credit facility) and is payable at least quarterly.
In addition to paying interest on outstanding principal under the revolving credit facility, Noranda AcquisitionCo is required to pay:
| • | a commitment fee to the lenders under the revolving credit facility in respect of unutilized commitments at a rate equal to 0.5% per annum subject to step down if certain financial thresholds are met, presently 0.38% at December 31, 2010; and |
| • | additional fees related to outstanding letters of credit under the revolving credit facility at a rate equal to the margin applicable to loans under the revolving credit facility, presently 1.75% per annum at December 31, 2010. |
Certain covenants
We have no financial maintenance covenants on any borrowings. Certain covenants contained in our debt agreements governing our senior secured credit facilities and the indentures governing our Notes restrict our ability to take certain actions if we are unable to meet certain ratios of Adjusted EBITDA to Fixed Charges and Senior Secured Net Debt to Adjusted EBITDA. These actions include incurring additional secured or unsecured debt, expanding borrowings under existing term loan facilities, paying dividends, engaging in mergers, acquisitions and certain other investments and retaining proceeds from asset sales. We met all financial ratio thresholds as of December 31, 2010.
In addition to the restrictive covenants described above, upon the occurrence of certain events, such as a change of control, our debt agreements could require that we repay or refinance our indebtedness.
Noranda AcquisitionCo Notes
In addition to the senior secured credit facilities, on May 18, 2007, Noranda AcquisitionCo issued $510.0 million senior floating rate notes due 2015. The AcquisitionCo Notes mature on May 15, 2015. Through May 15, 2011, Noranda AcquisitionCo may elect to pay interest: (i) entirely in cash, (ii) by increasing the principal amount of the AcquisitionCo Notes by paying interest
80
Table of Contents
NORANDA ALUMINUM HOLDING CORPORATION
NOTES TO CONSOLIDATED FINANCIAL STATEMENTS
entirely in kind (“PIK interest”) or (iii) 50% in cash and 50% in AcquisitionCo PIK Notes interest. We have notified the trustee for the AcquisitionCo Note bondholders of our election to pay the May 15, 2011 interest payment entirely in kind. For any subsequent period after May 15, 2011, Noranda AcquisitionCo must pay all interest in cash. The AcquisitionCo Notes cash interest accrues at six-month LIBOR plus 4.0% per annum, reset semi-annually, and the AcquisitionCo PIK interest, if any, will accrue at six-month LIBOR plus 4.75% per annum, reset semi-annually. The PIK interest rate at December 31, 2009 and 2010 was 5.27% and 5.19%, respectively.
The AcquisitionCo Notes are fully and unconditionally guaranteed on a senior unsecured, joint and several basis by the existing and future wholly owned domestic subsidiaries of Noranda AcquisitionCo that guarantee the senior secured credit facilities. NHB and St. Ann are not guarantors of the senior secured credit facilities and, therefore, are not guarantors of the AcquisitionCo Notes. Noranda HoldCo fully and unconditionally guarantees the AcquisitionCo Notes on a joint and several basis with the subsidiary guarantors. The guarantee by Noranda HoldCo is not required by the indenture governing the AcquisitionCo Notes and may be released by Noranda HoldCo at any time. Noranda HoldCo has no independent operations or any assets other than its interest in Noranda AcquisitionCo. Noranda AcquisitionCo is a wholly owned finance subsidiary of Noranda HoldCo with no operations independent of its subsidiaries.
In 2009 and 2010, we issued the following amounts of AcquisitionCo Notes as AcquisitionCo PIK interest due (in millions):
| AcquisitionCo Notes issued as PIK interest |
||||
| $ | ||||
| May 15, 2009 |
16.6 | |||
| November 15, 2009 |
11.9 | |||
| May 15, 2010 |
9.1 | |||
| November 15, 2010 |
8.9 | |||
The indenture governing the AcquisitionCo Notes limits Noranda AcquisitionCo’s and its subsidiaries’ ability, among other things, to (i) incur additional indebtedness; (ii) declare or pay dividends or make other distributions or repurchase or redeem our capital stock; (iii) make investments; (iv) sell assets, including capital stock of restricted subsidiaries; (v) enter into agreements restricting our subsidiaries’ ability to pay dividends; (vi) consolidate, merge, sell or otherwise dispose of all or substantially all of our assets; (vii) enter into transactions with our affiliates; and (viii) incur liens.
During third quarter 2010, we repurchased $20.6 million principal balance of AcquisitionCo Notes. As of December 31, 2010, we had $341.5 million in principal amount of AcquisitionCo Notes outstanding.
Noranda HoldCo Notes
On June 7, 2007, Noranda HoldCo issued senior floating rate notes due 2014 in aggregate principal amount of $220.0 million, with a discount of 1.0% of the principal amount. During second quarter 2010, we used a portion of the proceeds from our IPO to repurchase and retire all outstanding HoldCo Notes. While the HoldCo Notes were outstanding, Noranda HoldCo had the option to pay interest: (i) entirely in cash, (ii) in HoldCo Notes PIK interest or (iii) 50% in cash and 50% in HoldCo Notes PIK interest. The PIK interest rate was 7.02% at December 31, 2009.
In 2009 and 2010, we issued the following amounts of HoldCo Notes as HoldCo PIK interest due (in millions):
| HoldCo Notes issued as PIK interest |
||||
| $ | ||||
| May 15, 2009 |
3.3 | |||
| November 15, 2009 |
2.7 | |||
| May 15, 2010 |
2.3 | |||
Debt repurchase
For the year ended December 31, 2008, we made a mandatory prepayment of our term B loan of $30.3 million at face value and recorded a loss on debt repurchase of $1.2 million related entirely to the write-off of the HoldCo Notes unamortized debt discount.
For the year ended December 31, 2009, we repaid $65.4 million and $9.1 million of aggregate principal balances on the term B loan and revolving credit facility, respectively, and we repurchased $161.9 million and $194.5 million aggregate principal balance of our HoldCo Notes and AcquisitionCo Notes, respectively. The aggregate carrying amount of $426.5 million was repurchased or repaid for $215.3 million, including fees, resulting in a gain on debt repurchase of $211.2 million for the year ended December 31, 2009.
For the year ended December 31, 2010, we repaid $249.9 million and $215.9 million of aggregate principal balances on the term B loan and revolving credit facility, respectively, and we repurchased $66.3 million and $20.6 million aggregate principal
81
Table of Contents
NORANDA ALUMINUM HOLDING CORPORATION
NOTES TO CONSOLIDATED FINANCIAL STATEMENTS
balance of our HoldCo Notes and AcquisitionCo Notes, respectively. The aggregate carrying amount of $549.2 million was repurchased or repaid for $549.3 million, resulting in a loss on debt repurchase of $0.1 million for the year ended December 31, 2010.
The table below shows (gain) loss on debt repurchases for the years ended December 31, 2009 and 2010. For tax purposes, gains from our 2009 and 2010 debt repurchases will be deferred until 2014, and then included in taxable income ratably from 2014 to 2018. Net carrying amount of debt repurchased or repaid includes principal balance and accrued interest, net of any unamortized discount and deferred financing fees. For the year ended December 31, 2009, amount paid to repurchase debt includes $1.2 million of creditor fees paid to amend our credit agreement in 2009 to allow debt repurchases. (Gain) loss on debt repurchases for the years ended December 31, 2009 and 2010 were as follows:
| Year ended December 31, 2009 | ||||||||||||||||||||
| HoldCo Notes | AcquisitionCo Notes |
Term B loan | Revolving credit facility |
Total | ||||||||||||||||
| $ | $ | $ | $ | $ | ||||||||||||||||
| Net carrying amount of debt repurchased |
(159.8 | ) | (193.3 | ) | (64.5 | ) | (8.9 | ) | (426.5 | ) | ||||||||||
| Amount paid to repurchase debt |
43.7 | 109.9 | 55.2 | 6.5 | 215.3 | |||||||||||||||
| (Gain) loss on debt repurchase |
(116.1 | ) | (83.4 | ) | (9.3 | ) | (2.4 | ) | (211.2 | ) | ||||||||||
| Year ended December 31, 2010 | ||||||||||||||||||||
| HoldCo Notes | AcquisitionCo Notes |
Term B loan | Revolving credit facility |
Total | ||||||||||||||||
| $ | $ | $ | $ | $ | ||||||||||||||||
| Net carrying amount of debt repurchased |
(65.4 | ) | (20.7 | ) | (247.2 | ) | (215.9 | ) | (549.2 | ) | ||||||||||
| Amount paid to repurchase debt |
66.4 | 17.1 | 249.9 | 215.9 | 549.3 | |||||||||||||||
| (Gain) loss on debt repurchase |
1.0 | (3.6 | ) | 2.7 | — | 0.1 | ||||||||||||||
| 14. | PENSIONS AND OTHER POST-RETIREMENT BENEFITS |
We sponsor defined benefit pension plans for hourly and salaried employees. Benefits under those plans are based on years of service and/or eligible compensation prior to retirement. We also sponsor OPEB plans for certain employees. These benefits include life and health insurance. In addition, we provide supplemental executive retirement benefits (“SERP”) for certain executive officers.
In connection with the Joint Venture Transaction (see Note 2, “Joint Venture Transaction”), we acquired the plans in existence at Gramercy (“Gramercy pension” and “Gramercy OPEB,” collectively, the “Gramercy plans”) and St. Ann (“St. Ann pension” and “St. Ann OPEB,” collectively, the “St. Ann plans”) which include defined benefit pension plans and other post-retirement benefit plans. Disclosures for the year ended December 31, 2008 include only the plans reported in our consolidated financial statements prior to the Joint Venture Transaction. Disclosures as of and for the years ended December 31, 2009 and 2010 include the plans in existence prior to the Joint Venture Transaction and the Gramercy plans since the date of the Joint Venture Transaction. These plans are referred to collectively as “the Noranda Plans”.
Disclosures for the St. Ann plans as of December 31, 2009, as of and for the year ended December 31, 2010, and for the period since the date of the Joint Venture Transaction from September 1, 2009 through December 31, 2009 are shown separately, as we believe the assumptions related to the St. Ann plans are significantly different than those of the Noranda plans.
Noranda Plans
Our pension funding policy is to contribute annually an amount based on actuarial and economic assumptions designed to achieve adequate funding of the projected benefit obligations and to meet the minimum funding requirements of the Employee Retirement Income Security Act (“ERISA”). OPEB benefits are funded as retirees submit claims.
We use an annual measurement date of December 31 to determine the pension and OPEB liabilities.
In December 2008 and February 2010, we announced certain workforce and business process restructuring activities designed to reduce operating costs, conserve liquidity and improve operating efficiencies. See Note 4, “Restructuring,” for further information on the restructurings. As a result, we offered special voluntary termination benefits (“window benefits”) to employees that (1) met certain criteria for early retirement and (2) accepted the window benefit by the required deadline. For the year ended December 31, 2008, we recognized a termination benefit loss of $2.2 million and curtailment loss of $1.1 million within net periodic benefit cost. For the year ended December 31, 2010, we recognized a termination benefit loss of $1.6 million within net periodic benefit cost.
Noranda pension plan assets
During 2009, the Gramercy pension plan assets were held separately from the Noranda pension plan assets. As of December 31, 2010, both Gramercy and Noranda pension plan assets are held by the same financial institution. Our Noranda pension plans’ weighted-average asset allocations at December 31, 2009 and 2010 and the target allocations for 2011, by asset category are as follows:
82
Table of Contents
NORANDA ALUMINUM HOLDING CORPORATION
NOTES TO CONSOLIDATED FINANCIAL STATEMENTS
| Gramercy Pension | Noranda Pension | |||||||||||||||
| 2009 | 2009 | 2010 | Target Allocation 2011 |
|||||||||||||
| % | % | % | % | |||||||||||||
| Fixed income |
26 | 36 | 34 | 35 | ||||||||||||
| Equity securities |
65 | 64 | 66 | 65 | ||||||||||||
| Cash |
9 | — | — | — | ||||||||||||
We seek a balanced return on plan assets through a diversified investment strategy. Noranda pension plan assets consist principally of equities and fixed income accounts. In developing the long-term rate of return assumption for plan assets, we evaluate the plans’ historical cumulative actual returns over several periods, as well as long-term inflation assumptions. We anticipate that the plans’ will continue to generate long-term investment returns of at least 8% per annum.
Noranda other post-retirement benefit plans
The Noranda OPEB benefit obligation included estimated health insurance benefits of $0.2 million, $0.7 million and $0.8 million at December 31, 2008, 2009 and 2010 respectively. The healthcare cost trend rates used in developing the periodic cost and the projected benefit obligation are 8% grading to 5% over six years.
The change in benefit obligation and change in plan assets for the Noranda pension plans were as follows (in millions):
| As of December 31, | ||||||||||||
| 2008 | 2009 | 2010 | ||||||||||
| $ | $ | $ | ||||||||||
| Change in benefit obligation: |
||||||||||||
| Benefit obligation, beginning of period |
259.8 | 275.9 | 305.1 | |||||||||
| Service cost |
8.2 | 8.0 | 9.0 | |||||||||
| Interest cost |
16.5 | 17.0 | 17.8 | |||||||||
| Plan changes |
(0.9 | ) | — | 0.1 | ||||||||
| Benefit obligations recorded through Joint Venture Transaction |
— | 5.7 | — | |||||||||
| Actuarial loss |
1.6 | 13.5 | 25.6 | |||||||||
| Settlements |
(0.3 | ) | (2.3 | ) | — | |||||||
| Benefits paid |
(11.3 | ) | (12.8 | ) | (14.5 | ) | ||||||
| Special termination benefits |
2.1 | 0.1 | 1.6 | |||||||||
| Curtailments |
0.2 | — | — | |||||||||
| Benefit obligation, end of period |
275.9 | 305.1 | 344.7 | |||||||||
| Change in plan assets: |
||||||||||||
| Fair value of plan assets, beginning of period |
220.8 | 160.0 | 212.5 | |||||||||
| Actual return on plan assets |
(67.3 | ) | 39.6 | 30.4 | ||||||||
| Employer contributions |
18.2 | 24.7 | 20.2 | |||||||||
| Settlements |
(0.4 | ) | (2.3 | ) | — | |||||||
| Plan assets recorded through Joint Venture Transaction |
— | 3.3 | — | |||||||||
| Benefits paid |
(11.3 | ) | (12.8 | ) | (14.5 | ) | ||||||
| Fair value of plan assets, end of period |
160.0 | 212.5 | 248.6 | |||||||||
| Weighted-average assumptions: |
||||||||||||
| Discount rate |
6.1 | % | 5.8 | % | 5.3 | % | ||||||
| Rate of compensation increase |
4.3 | % | 4.3 | % | 4.0 | % | ||||||
83
Table of Contents
NORANDA ALUMINUM HOLDING CORPORATION
NOTES TO CONSOLIDATED FINANCIAL STATEMENTS
The change in benefit obligation and change in plan assets for the Noranda OPEB plans were as follows (in millions):
| Year ended December 31, | ||||||||||||
| 2008 | 2009 | 2010 | ||||||||||
| $ | $ | $ | ||||||||||
| Change in benefit obligation: |
||||||||||||
| Benefit obligation, beginning of period |
7.5 | 7.4 | 8.1 | |||||||||
| Service cost |
0.1 | 0.2 | 0.3 | |||||||||
| Interest cost |
0.4 | 0.4 | 0.5 | |||||||||
| Plan changes |
— | — | 0.6 | |||||||||
| Benefit obligations recorded through Joint Venture Transaction |
— | 0.5 | — | |||||||||
| Actuarial (gain) loss |
(0.3 | ) | (0.1 | ) | 0.9 | |||||||
| Benefits paid |
(0.3 | ) | (0.3 | ) | (0.4 | ) | ||||||
| Benefit obligation, end of period |
7.4 | 8.1 | 10.0 | |||||||||
| Change in plan assets: |
||||||||||||
| Fair value of plan assets, beginning of period |
— | — | 0.1 | |||||||||
| Plan assets recorded through Joint Venture Transaction |
— | 0.1 | — | |||||||||
| Actual return on plan assets |
— | — | — | |||||||||
| Employer contributions |
0.3 | 0.3 | 0.4 | |||||||||
| Benefits paid |
(0.3 | ) | (0.3 | ) | (0.4 | ) | ||||||
| Fair value of plan assets, end of period |
— | 0.1 | 0.1 | |||||||||
| Weighted-average assumptions: |
||||||||||||
| Discount rate |
6.1 | % | 5.8 | % | 5.3 | % | ||||||
| Rate of compensation increase |
4.3 | % | 4.3 | % | 4.3 | % | ||||||
The net liability for the Noranda plans was recorded in the consolidated balance sheets as follows (in millions):
| Noranda Pension | Noranda OPEB | |||||||||||||||
| As of December 31, | As of December 31, | |||||||||||||||
| 2009 | 2010 | 2009 | 2010 | |||||||||||||
| $ | $ | $ | $ | |||||||||||||
| Current liability |
(0.2 | ) | (0.3 | ) | (0.3 | ) | (0.4 | ) | ||||||||
| Non-current liability |
(92.4 | ) | (95.8 | ) | (7.7 | ) | (9.5 | ) | ||||||||
| Funded status |
(92.6 | ) | (96.1 | ) | (8.0 | ) | (9.9 | ) | ||||||||
Amounts related to the Noranda plans recognized in accumulated other comprehensive income were as follows (in millions):
| Noranda Pension | Noranda OPEB | |||||||||||||||
| As of December 31, | As of December 31, | |||||||||||||||
| 2009 | 2010 | 2009 | 2010 | |||||||||||||
| $ | $ | $ | $ | |||||||||||||
| Net actuarial (gain) loss |
79.4 | 86.3 | (0.5 | ) | 0.4 | |||||||||||
| Prior service cost |
3.1 | 2.9 | — | 0.5 | ||||||||||||
| Accumulated other comprehensive (income) loss |
82.5 | 89.2 | (0.5 | ) | 0.9 | |||||||||||
Net periodic benefit costs related to the Noranda pension plans included the following (in millions):
| Year ended December 31, | ||||||||||||
| 2008 | 2009 | 2010 | ||||||||||
| Service cost |
$ | 8.2 | $ | 8.0 | $ | 9.0 | ||||||
| Interest cost |
16.5 | 17.0 | 17.8 | |||||||||
| Expected return on plan assets |
(18.2 | ) | (12.5 | ) | (16.8 | ) | ||||||
| Actuarial loss |
0.2 | 7.2 | 5.0 | |||||||||
| Prior service cost |
0.4 | 0.3 | 0.3 | |||||||||
| Curtailment loss |
1.1 | 0.5 | — | |||||||||
| Settlement and termination benefits loss |
2.2 | 0.1 | 1.6 | |||||||||
| Net periodic cost |
$ | 10.4 | $ | 20.6 | $ | 16.9 | ||||||
| Weighted-average assumptions: |
||||||||||||
| Discount rate |
5.9 | % | 6.1 | % | 5.8 | % | ||||||
| Expected rate of return on plan assets |
8.3 | % | 8.0 | % | 8.0 | % | ||||||
| Rate of compensation increase |
4.3 | % | 4.3 | % | 4.3 | % | ||||||
84
Table of Contents
NORANDA ALUMINUM HOLDING CORPORATION
NOTES TO CONSOLIDATED FINANCIAL STATEMENTS
Net periodic benefit costs related to the Noranda OPEB plans included the following (in millions):
| Year ended December 31, | ||||||||||||
| 2008 | 2009 | 2010 | ||||||||||
| Service cost |
$ | 0.1 | $ | 0.2 | $ | 0.3 | ||||||
| Interest cost |
0.4 | 0.4 | 0.5 | |||||||||
| Expected return on plan assets |
— | — | — | |||||||||
| Actuarial gain |
— | (0.1 | ) | (0.1 | ) | |||||||
| Prior service cost |
— | — | 0.1 | |||||||||
| Net periodic cost |
$ | 0.5 | $ | 0.5 | $ | 0.8 | ||||||
| Weighted-average assumptions: |
||||||||||||
| Discount rate |
6.0 | % | 6.1 | % | 5.8 | % | ||||||
| Rate of compensation increase |
4.3 | % | 4.3 | % | 4.3 | % | ||||||
The effects of a one percentage point change in the assumed health care cost trend rate on our Noranda OPEB plans’ post-retirement benefit obligation were as follows (in millions):
| 1% decrease in rates | Assumed rates | 1% increase in rates | ||||||||||
| $ | $ | $ | ||||||||||
| Aggregated service and interest cost |
0.8 | 0.8 | 0.8 | |||||||||
| Accumulated post-retirement benefit obligation |
10.0 | 10.0 | 10.0 | |||||||||
The projected and accumulated benefit obligations in excess of plan assets for our Noranda pension plans were as follows (in millions):
| As of December 31, | ||||||||
| 2009 | 2010 | |||||||
| $ | $ | |||||||
| Projected benefit obligation |
(305.1 | ) | (344.7 | ) | ||||
| Accumulated benefit obligation |
(292.8 | ) | (331.9 | ) | ||||
| Fair value of plan assets |
212.5 | 248.6 | ||||||
St. Ann Plans
St. Ann operates a defined benefit pension plan and an OPEB plan. Our post-retirement benefits include life and health insurance and are funded as retirees submit claims.
In April 2010, we announced certain workforce and business process restructuring activities designed to reduce operating costs, conserve liquidity and improve operating efficiencies at St. Ann. Refer to Note 4, “Restructuring,” for further information on the restructuring. This restructuring resulted in curtailment gains of $1.5 million and $1.2 million recognized in net periodic pension cost of the St. Ann pension and OPEB plans, respectively, during the year ended December 31, 2010.
We use an annual measurement date of December 31 to determine the pension and OPEB liabilities for the St. Ann Plans.
St. Ann plan assets
The St. Ann pension plan is funded by employee and employer contributions. Employer contributions are made at a rate periodically determined by management, which is based, in part, on employee contributions. Our pension funding policy is to contribute annually an amount based on actuarial and economic assumptions designed to achieve adequate funding of the projected benefit obligations and to meet the funding requirements of the plan.
Our St. Ann pension plan’s weighted-average asset allocations at December 31, 2009 and 2010 and the target allocations for 2011 by asset category are as follows:
| As of December 31, | Target allocations 2011 |
|||||||||||
| 2009 | 2010 | |||||||||||
| % | % | % | ||||||||||
| Equity securities |
32 | 32 | 25 | |||||||||
| Property |
8 | 6 | 20 | |||||||||
| Fixed income |
25 | 28 | 30 | |||||||||
| Money market |
12 | 8 | 5 | |||||||||
| Foreign currency |
23 | 26 | 20 | |||||||||
We seek a balanced return on plan assets through a diversified investment strategy. In developing the long-term rate of return assumption for plan assets, we evaluate the plan’s historical cumulative actual returns over several periods, as well as long-term inflation assumptions. We anticipate that the plan’s investments will continue to generate long-term returns of at least 9% per annum.
85
Table of Contents
NORANDA ALUMINUM HOLDING CORPORATION
NOTES TO CONSOLIDATED FINANCIAL STATEMENTS
The change in benefit obligation and change in plan assets for the St. Ann plans since the Joint Venture Transaction were as follows (in millions):
| St. Ann Pension | St. Ann OPEB | |||||||||||||||
| Period from September 1, 2009 to December 31, 2009 |
Year
ended December 31, 2010 |
Period from September 1, 2009 to December 31, 2009 |
Year
ended December 31, 2010 |
|||||||||||||
| $ | $ | $ | $ | |||||||||||||
| Change in benefit obligation: |
||||||||||||||||
| Benefit obligation, beginning of period |
11.6 | 15.7 | 5.2 | 6.3 | ||||||||||||
| Service cost |
0.1 | 0.5 | 0.1 | 0.3 | ||||||||||||
| Interest cost |
0.6 | 1.6 | 0.2 | 0.7 | ||||||||||||
| Contributions |
0.2 | 0.7 | — | — | ||||||||||||
| Actuarial (gain) loss |
3.5 | 2.2 | 0.9 | 3.4 | ||||||||||||
| Foreign currency changes |
(0.1 | ) | 0.7 | — | 0.3 | |||||||||||
| Benefits paid |
(0.2 | ) | (3.2 | ) | (0.1 | ) | (0.3 | ) | ||||||||
| Benefit obligation, end of period |
15.7 | 18.2 | 6.3 | 10.7 | ||||||||||||
| Change in plan assets: |
||||||||||||||||
| Fair value of plan assets, beginning of period |
21.2 | 22.2 | — | — | ||||||||||||
| Employer contributions |
0.2 | 0.4 | 0.1 | 0.3 | ||||||||||||
| Member contributions |
0.2 | 0.7 | — | — | ||||||||||||
| Actual return on plan assets |
0.9 | 2.6 | — | — | ||||||||||||
| Benefits paid |
(0.2 | ) | (3.2 | ) | (0.1 | ) | (0.3 | ) | ||||||||
| Foreign currency changes |
(0.1 | ) | 1.4 | — | — | |||||||||||
| Fair value of plan assets, end of period |
22.2 | 24.1 | — | — | ||||||||||||
| Weighted-average assumptions: |
||||||||||||||||
| Discount rate |
13.0 | % | 8.0 | % | 13.0 | % | 8.0 | % | ||||||||
| Rate of compensation increase |
13.0 | % | 7.0 | % | 13.0 | % | 7.0 | % | ||||||||
The net asset (liability) for the St. Ann plans was recorded in the consolidated balance sheets as follows (in millions):
| St. Ann Pension | St. Ann OPEB | |||||||||||||||
| As of December 31, | As of December 31, | |||||||||||||||
| 2009 | 2010 | 2009 | 2010 | |||||||||||||
| $ | $ | $ | $ | |||||||||||||
| Long-term pension asset |
6.5 | 5.9 | — | — | ||||||||||||
| Non-current liability |
— | — | (6.3 | ) | (10.7 | ) | ||||||||||
| Funded status |
6.5 | 5.9 | (6.3 | ) | (10.7 | ) | ||||||||||
Amounts related to the St. Ann plans recognized in accumulated other comprehensive income were as follows (in millions):
| St. Ann Pension | St. Ann OPEB | |||||||||||||||
| As of December 31, | As of December 31, | |||||||||||||||
| 2009 | 2010 | 2009 | 2010 | |||||||||||||
| $ | $ | $ | $ | |||||||||||||
| Net actuarial loss |
3.7 | 4.9 | 0.8 | 4.5 | ||||||||||||
| Prior service cost |
— | — | — | — | ||||||||||||
| Accumulated other comprehensive income |
3.7 | 4.9 | 0.8 | 4.5 | ||||||||||||
86
Table of Contents
NORANDA ALUMINUM HOLDING CORPORATION
NOTES TO CONSOLIDATED FINANCIAL STATEMENTS
Net periodic benefit costs related to the St. Ann pension plans since the Joint Venture Transaction included the following (in millions):
| Period from September 1, 2009 to December 31, 2009 |
Year
ended December 31, 2010 |
|||||||
| Service cost |
$ | 0.1 | $ | 0.5 | ||||
| Interest cost |
0.6 | 1.6 | ||||||
| Expected return on plan assets |
(1.2 | ) | (2.3 | ) | ||||
| Recognized loss |
— | 1.5 | ||||||
| Actuarial loss |
— | 0.1 | ||||||
| Curtailment gain |
— | (1.5 | ) | |||||
| Net periodic cost |
$ | (0.5 | ) | $ | (0.1 | ) | ||
| Weighted-average assumptions: |
||||||||
| Discount rate |
16.0 | % | 13.0 | % | ||||
| Expected rate of return on plan assets |
17.5 | % | 15.0 | % | ||||
| Rate of compensation increase |
14.0 | % | 13.0 | % | ||||
Net periodic benefit costs related to the St. Ann OPEB Plan since the Joint Venture Transaction included the following (in millions):
| Period from September 1, 2009 to December 31, 2009 |
Year
ended December 31, 2010 |
|||||||
| Service cost |
$ | 0.1 | $ | 0.3 | ||||
| Interest cost |
0.2 | 0.7 | ||||||
| Expected return on plan assets |
— | — | ||||||
| Recognized loss |
— | 1.2 | ||||||
| Curtailment gain |
— | (1.2 | ) | |||||
| Net periodic cost |
$ | 0.3 | $ | 1.0 | ||||
| Weighted-average assumptions: |
||||||||
| Discount rate |
16.0 | % | 13.0 | % | ||||
| Rate of compensation increase |
14.0 | % | 13.0 | % | ||||
The effect of a one-percentage-point change in the assumed health care cost trend rate on our St. Ann OPEB plan’s benefit obligation was as follows (in millions):
| 1% decrease in rates | Assumed rates | 1% increase in rates | ||||||||||||||||||
| $ | $ | $ | ||||||||||||||||||
| Aggregated service and interest cost |
0.8 | 1.0 | 1.2 | |||||||||||||||||
| Projected post-retirement benefit obligation |
(9.1 | ) | (10.7 | ) | (12.7 | ) | ||||||||||||||
As of December 31, 2009 and 2010, St. Ann pension plan assets exceeded the projected benefit obligation and the accumulated benefit obligation.
Expected Employer Contributions
Required contributions approximate $19.3 million and $0.3 million for the Noranda pension plans and the St. Ann plans, respectively, in 2011. We may elect to make additional contributions to the plans.
Expected Future Benefit Payments
The following table provides our estimated future benefit payments for the pension and OPEB plans at December 31, 2010 (in millions):
| Noranda Plans | St. Ann Plans | |||||||||||||||||||
| Pension benefits | OPEB benefits | Pension benefits | OPEB benefits | |||||||||||||||||
| Year ended December 31, |
$ | $ | $ | $ | ||||||||||||||||
| 2011 |
15.3 | 0.3 | 0.5 | 0.3 | ||||||||||||||||
| 2012 |
16.3 | 0.4 | 0.5 | 0.3 | ||||||||||||||||
| 2013 |
17.3 | 0.4 | 0.5 | 0.3 | ||||||||||||||||
| 2014 |
18.4 | 0.4 | 0.5 | 0.4 | ||||||||||||||||
| 2015 |
19.7 | 0.5 | 0.6 | 0.4 | ||||||||||||||||
| 2016-2019 |
113.3 | 2.7 | 4.3 | 3.0 | ||||||||||||||||
| Total |
200.3 | 4.7 | 6.9 | 4.7 | ||||||||||||||||
87
Table of Contents
NORANDA ALUMINUM HOLDING CORPORATION
NOTES TO CONSOLIDATED FINANCIAL STATEMENTS
Defined Contribution Plans
We also have defined contribution retirement plans that cover our eligible employees. The purpose of these defined contribution plans is generally to provide additional financial security during retirement by providing employees with an incentive to make regular savings. Our contributions to these plans are based on employee contributions and were as follows (in millions):
| Year ended December 31, |
$ | |||
| 2008 |
2.6 | |||
| 2009 |
2.1 | |||
| 2010 |
3.3 | |||
| 15. | SHAREHOLDERS’ EQUITY AND SHARE-BASED PAYMENTS |
Common Stock Subject to Redemption
As part of his March 2008 employment agreement, our Chief Executive Officer (“CEO”) agreed to purchase 200,000 shares of common stock at $10 per share, for a total investment of $2.0 million. As amended in October 2010, his employment agreement provides that shares purchased carry a redemption feature which guarantees total realization on these shares of at least $8.0 million (since reduced to $7.5 million to reflect dividends to date) in the event a change in control occurs prior to March 3, 2013 and the CEO remains employed with us through the 12-month anniversary of such change in control or experiences certain qualifying terminations of employment.
Because of the existence of the conditional redemption feature, the carrying value of these 200,000 shares of common stock is reported outside of permanent equity. In accordance with FASB ASC Topic 718, Compensation — Stock Compensation (“ASC Topic 718”), the carrying amount of the common stock subject to redemption is reported as the $2.0 million proceeds. The carrying value of that common stock is not adjusted to the $8.0 million redemption amount because it is not considered probable that a change in control event will take place prior to March 3, 2013.
Noranda Long-Term Incentive Plan
We recorded stock compensation expense as follows (in millions):
| Year ended December 31, | ||||||||||||
| 2008 | 2009 | 2010 | ||||||||||
| $ | $ | $ | ||||||||||
| Compensation expense recognized: |
||||||||||||
| Stock option grants |
2.4 | 1.5 | 5.8 | |||||||||
| RSU grants |
— | — | 0.1 | |||||||||
| Total compensation expense before income taxes |
2.4 | 1.5 | 5.9 | |||||||||
| Income tax benefit |
(0.9 | ) | (0.6 | ) | (2.1 | ) | ||||||
| Total compensation expense, net of income taxes |
1.5 | 0.9 | 3.8 | |||||||||
In connection with our stock split effected on April 16, 2010, the number of shares of common stock reserved for issuance to employees and non-employee directors under our 2007 Long-Term Incentive Plan (the “2007 Incentive Award Plan”) increased from 1,900,000 shares to 3,800,000 shares. Of the amount available for issuance, employees and non-employee directors owned 968,561 shares and there were 2,227,056 option grants outstanding at December 31, 2010. The remaining 604,383 shares remained available for issuance as of December 31, 2010.
In May 2010, our Board of Directors adopted the Noranda 2010 Incentive Award Plan (the “2010 Incentive Award Plan”). This plan provides for a variety of share-based awards, including non-qualified stock options, incentive stock options, stock appreciation rights, restricted stock awards, restricted stock unit awards (“RSUs”), dividend equivalents, performance share awards, performance-based cash awards and stock payment awards. Option terms will be set by our Board of Directors subject to the condition that no option term shall be longer than ten years from the date of grant. Upon termination of an outstanding option holder’s services with us, the holder may exercise his or her options within the period of time specified in the option grant, to the extent that the options were vested at the time of termination. Our Board of Directors is generally authorized to adopt, amend and rescind rules relating to the administration of the 2010 Incentive Award Plan and our Board of Directors is authorized to amend, suspend and terminate the 2010 Incentive Award Plan. We expect that we will generally be required to obtain approval of our shareholders to increase the number of shares of our common stock that may be issued under the 2010 Incentive Award Plan. We reserved 5,200,000 shares of common stock for issuance under the 2010 Incentive Award Plan. Of this amount, 103,524 RSUs were outstanding and the remaining 5,096,476 shares were available for issuance as of December 31, 2010.
On June 13, 2008, we paid a $2.35 per share cash dividend to our shareholders. The fair value of our common stock was determined to be $10.00 per share prior to the distribution of $2.35 per share; the resulting value after the distribution was $7.65. The award holders were given $2.35 per share of value in the form of an immediately vested cash payment of $1.35 per share and a
88
Table of Contents
NORANDA ALUMINUM HOLDING CORPORATION
NOTES TO CONSOLIDATED FINANCIAL STATEMENTS
modification of the price of options held from $3 per share to $2 per share and $10 per share to $9 per share. The modification impacted 29 employees. The total incremental compensation cost resulting from this modification was $3.9 million.
In May 2010, in connection with the Company’s IPO, stock options were modified to remove a call option which had created an implicit seven year vesting period. The effect of this modification was to accelerate expense recognition for certain fully-vested options and to change the amount of expense to be recognized based on an assumed forfeiture rate. We recorded $3.2 million of compensation expense during the year ended December 31, 2010 in connection with this modification. The modification also shortened the period over which compensation expense is recognized for service awards which continue to vest, resulting in an immaterial amount of additional compensation expense during the year ended December 31, 2010.
In October 2010, stock options were modified in accordance with the terms of separation agreements for certain employees. The effect of this modification was to accelerate expense recognition to reflect the modified vesting schedule of the options. We recorded $1.1 million of compensation expense during the year ended December 31, 2010 in connection with these modifications.
A summary of our stock option activity and related information for our stock option plan is as follows, after reflecting the effects of modifications to exercise prices discussed above:
| Employee options and non-employee director options |
Investor director provider options | |||||||||||||||||||
| Common shares |
Weighted-average exercise price |
Common shares |
Weighted-average exercise price |
|||||||||||||||||
| Outstanding, December 31, 2007 |
1,327,686 | $ | 2.00 | 420,000 | $ | 2.34 | ||||||||||||||
| Granted |
617,000 | $ | 1.90 | 120,000 | $ | 9.00 | ||||||||||||||
| Modified |
— | — | (400,000 | ) | $ | 2.00 | ||||||||||||||
| Forfeited |
(124,238 | ) | $ | 3.02 | — | — | ||||||||||||||
| Outstanding, December 31, 2008 |
1,820,448 | $ | 1.90 | 140,000 | $ | 9.00 | ||||||||||||||
| Granted |
344,852 | $ | 0.98 | — | — | |||||||||||||||
| Forfeited |
(35,410 | ) | $ | 2.00 | — | — | ||||||||||||||
| Outstanding, December 31, 2009 |
2,129,890 | $ | 1.75 | 140,000 | $ | 9.00 | ||||||||||||||
| Granted |
35,400 | $ | 2.18 | — | — | |||||||||||||||
| Exercised |
(28,329 | ) | $ | 2.00 | — | — | ||||||||||||||
| Forfeited |
(49,905 | ) | $ | 1.51 | — | — | ||||||||||||||
| Outstanding, December 31, 2010 |
2,087,056 | $ | 1.76 | 140,000 | $ | 9.00 | ||||||||||||||
| Fully vested, end of period (weighted-average remaining contractual term of 6.8 years each) |
1,278,582 | $ | 1.92 | 140,000 | $ | 9.00 | ||||||||||||||
| Currently exercisable, end of period (weighted-average remaining contractual term of 6.9 years and 6.8 years, respectively) |
1,180,502 | $ | 1.91 | 140,000 | $ | 9.00 | ||||||||||||||
As of December 31, 2010, the aggregate intrinsic values (representing the number of in-the-money stock options multiplied by the difference between our closing stock price on the last trading day of the reporting period and the exercise price of the respective option) of vested, exercisable and exercised options were as follows (in millions):
| Employee options and non- employee director options |
Investor director provider options |
|||||||||||
| $ | $ | |||||||||||
| Fully vested options |
16.2 | 0.8 | ||||||||||
| Currently exercisable options |
15.0 | 0.8 | ||||||||||
| Options exercised during 2010 |
0.4 | — | ||||||||||
We estimate the grant date fair value of stock options using the Black-Scholes-Merton option pricing model. The following table summarizes the assumptions used concerning our stock option grants:
| Year ended December 31, | ||||||||||||||||||||||||
| 2008 | 2009 | 2010 | ||||||||||||||||||||||
| Employee | Non-Apollo director |
Employee | Non-Apollo director |
Employee | Non-Apollo director |
|||||||||||||||||||
| Expected price volatility |
44.9 | % | 45.7 | % | 77.3 | % | — | 90.9 | % | — | ||||||||||||||
| Risk-free interest rate |
3.1 | % | 3.2 | % | 3.3 | % | — | 3.1 | % | — | ||||||||||||||
| Weighted-average expected lives in years |
5.9 | 6.3 | 7.5 | — | 7.5 | — | ||||||||||||||||||
| Weighted-average fair value |
$ | 3.55 | $ | 4.90 | $ | 0.56 | — | $ | 1.76 | — | ||||||||||||||
| Dividend yield |
— | — | — | — | — | — | ||||||||||||||||||
89
Table of Contents
NORANDA ALUMINUM HOLDING CORPORATION
NOTES TO CONSOLIDATED FINANCIAL STATEMENTS
Expected price volatility is based on the historical volatility of representative peer companies’ stocks. The expected term assumption at the grant date is generally based on historical patterns of forfeitures and the contractual term of the option as well as forward looking factors, plus an estimated additional holding period until options are exercised. Expected dividend yield was based on management’s expectation of no dividend payments. Risk free interest rates were based on the U.S. Treasury yield curve in effect at the grant dates.
Restrictions on RSUs generally lapse over three years, on the anniversary of the grant dates, in the following increments: 25% on the first anniversary, 25% on the second anniversary, and 50% on the third anniversary. Our activity associated with RSUs follows:
| Non-vested RSUs |
Weighted-average grant date fair value |
|||||||
| Non-vested, December 31, 2009 |
— | — | ||||||
| Granted |
103,524 | $ | 11.63 | |||||
| Non-vested, December 31, 2010 |
103,524 | $ | 11.63 | |||||
As of December 31, 2010, unrecognized compensation expense related to non-vested options and RSUs was $3.5 million. This amount will be recognized over a weighted-average period of 1.6 years. Total fair value of options that vested for the years ended December 31, 2008, 2009 and 2010 was $6.5 million, $1.4 million and $2.1 million, respectively. No RSUs have vested as of December 31, 2010.
| 16. | INCOME TAXES |
The components of Income (loss) before income taxes were follows (in millions):
| Year ended December 31, | ||||||||||||
| 2008 | 2009 | 2010 | ||||||||||
| $ | $ | $ | ||||||||||
| United States |
(109.5 | ) | 129.9 | 91.6 | ||||||||
| Foreign |
2.5 | 30.1 | 10.3 | |||||||||
| Total |
(107.0 | ) | 160.0 | 101.9 | ||||||||
Income tax expense (benefit) was as follows (in millions):
| Year ended December 31, | ||||||||||||
| 2008 | 2009 | 2010 | ||||||||||
| $ | $ | $ | ||||||||||
| Current: |
||||||||||||
| Federal |
38.3 | (0.4 | ) | 18.9 | ||||||||
| Foreign |
— | — | — | |||||||||
| State |
2.2 | 1.0 | 1.3 | |||||||||
| 40.5 | 0.6 | 20.2 | ||||||||||
| Deferred: |
||||||||||||
| Federal |
(70.1 | ) | 53.6 | 11.9 | ||||||||
| Foreign |
— | (0.6 | ) | 2.8 | ||||||||
| State |
(3.3 | ) | 5.0 | 0.1 | ||||||||
| (73.4 | ) | 58.0 | 14.8 | |||||||||
| Total |
(32.9 | ) | 58.6 | 35.0 | ||||||||
As of December 31, 2010, we have state net operating loss carryforwards of approximately $111.9 million expiring in years 2017 through 2029. In addition, as of December 31, 2010, we have a foreign tax credit carryforward of $0.6 million with no expiration date and state tax credit carryforwards of $1.6 million expiring in years 2012 through 2026.
FASB ASC Topic 740, Income Taxes (“ASC Topic 740”), requires a valuation allowance against deferred tax assets if, based on available evidence, it is more likely than not that some or all of the deferred tax assets will not be realized. Accordingly, we recorded an additional $0.7 million valuation allowance on these assets in 2010.
As of December 31, 2010, we have not provided for withholding or United States federal income taxes on approximately $48.7 million of accumulated undistributed earnings of our foreign subsidiaries as they are considered by management to be permanently reinvested. If these undistributed earnings were not considered to be permanently reinvested, an approximately $17.5 million deferred income tax liability and a $16.1 million foreign tax credit asset would have been provided.
Deferred income taxes reflect the net tax effects of temporary differences between the carrying amount of assets and liabilities for financial reporting purposes and the amounts used for income tax purposes.
90
Table of Contents
NORANDA ALUMINUM HOLDING CORPORATION
NOTES TO CONSOLIDATED FINANCIAL STATEMENTS
Significant components of our deferred tax assets and liabilities as of December 31, 2009 and 2010 were as follows (in millions):
| As of December 31 | ||||||||
| 2009 | 2010 | |||||||
| $ | $ | |||||||
| Deferred tax liabilities: |
||||||||
| Property related |
162.8 | 150.7 | ||||||
| Debt related |
74.0 | 75.7 | ||||||
| Investments |
52.4 | 50.0 | ||||||
| Inventory |
16.1 | 17.5 | ||||||
| Intangibles |
22.6 | 21.3 | ||||||
| Derivatives |
103.5 | 68.8 | ||||||
| Other |
1.2 | 1.2 | ||||||
| Total deferred tax liabilities |
432.6 | 385.2 | ||||||
| Deferred tax assets: |
||||||||
| Compensation related |
52.4 | 54.0 | ||||||
| Capital and net operating loss carryforwards |
33.8 | 14.9 | ||||||
| Foreign and state tax credit carryforwards |
4.1 | 1.7 | ||||||
| Other |
4.0 | 5.2 | ||||||
| Total deferred tax assets |
94.3 | 75.8 | ||||||
| Valuation allowance for deferred tax assets |
(13.5 | ) | (14.2 | ) | ||||
| Net deferred tax assets |
80.8 | 61.6 | ||||||
| Net deferred tax liability |
351.8 | 323.6 | ||||||
Reconciliation of Income Taxes
The reconciliation of the income taxes, calculated at the rates in effect, with the effective tax rate shown in the statements of operations, was as follows:
| As of December 31, | ||||||||||||
| 2008 | 2009 | 2010 | ||||||||||
| % | % | % | ||||||||||
| Federal statutory income tax rate |
35.0 | 35.0 | 35.0 | |||||||||
| (Decrease) increase in tax rate resulting from: |
||||||||||||
| State and local income taxes, net of federal benefit |
0.9 | 2.3 | 0.8 | |||||||||
| Equity method investee income |
0.8 | (0.2 | ) | — | ||||||||
| IRC Sec. 199 manufacturing deduction |
1.8 | — | (1.8 | ) | ||||||||
| Goodwill impairment |
(8.3 | ) | 23.9 | — | ||||||||
| Bargain purchase accounting |
— | (25.3 | ) | — | ||||||||
| Other permanent items |
0.6 | 0.9 | 0.3 | |||||||||
| Effective tax rate |
30.8 | 36.6 | 34.3 | |||||||||
Upon adoption of the guidance in ASC Topic 740 related to accounting for uncertain tax positions, as part of the Apollo Acquisition, Xstrata indemnified us for tax exposures through the date of the Apollo Acquisition. Therefore, we had a receivable of $4.6 million and $4.5 million from Xstrata at December 31, 2009 and December 31, 2010, respectively, equal to our provision for uncertain tax positions (net of federal benefits) for the tax exposures related to tax positions occurring through the date of the Apollo Acquisition. As of December 31, 2008, 2009 and 2010, we had unrecognized income tax benefits of approximately $10.1 million, $10.2 million and $10.2 million, respectively.
91
Table of Contents
NORANDA ALUMINUM HOLDING CORPORATION
NOTES TO CONSOLIDATED FINANCIAL STATEMENTS
Changes in amounts of unrecognized tax benefits were as follows (in millions):
| As of December 31, | ||||||||||||
| 2008 | 2009 | 2010 | ||||||||||
| $ | $ | $ | ||||||||||
| Beginning of period |
10.1 | 10.1 | 10.2 | |||||||||
| Tax positions related to the current period: |
||||||||||||
| Gross additions |
— | 0.1 | 0.3 | |||||||||
| Gross reductions |
— | — | — | |||||||||
| Tax positions related to prior years: |
||||||||||||
| Gross additions |
— | — | — | |||||||||
| Gross reductions |
— | — | — | |||||||||
| Settlements |
— | — | — | |||||||||
| Lapses on statute of limitations |
— | — | (0.3 | ) | ||||||||
| End of period |
10.1 | 10.2 | 10.2 | |||||||||
The total amount of net unrecognized tax benefits as of December 31, 2009 and 2010 that, if recognized, would affect the effective tax rate was $7.5 million and $7.7 million, respectively. We elected to accrue interest and penalties related to unrecognized tax benefits in our provision for income taxes. As of December 31, 2009 and 2010, we have accrued interest and penalties related to unrecognized tax benefits of approximately $1.3 million and $1.6 million, respectively.
We file a consolidated federal and various state income tax returns. The earliest years open to examination in the Company’s major jurisdictions is 2007 for federal and state income tax returns. In August 2010, the Internal Revenue Service (“IRS”) concluded an examination of our U.S. income tax return for 2006 and did not propose a change. Within the next twelve months, we estimate that the unrecognized benefits could change by approximately $8.1 million as a result of tax audit closings, settlements and the expiration of statutes to examine such returns in various state jurisdictions.
| 17. | NET INCOME (LOSS) PER COMMON SHARE |
We present both basic and diluted EPS on the face of our consolidated statements of operations. Basic and diluted EPS are calculated as follows (in millions, except per share):
| As of December 31, | ||||||||||||
| 2008 | 2009 | 2010 | ||||||||||
| Net income (loss) |
$ | (74.1 | ) | $ | 101.4 | $ | 66.9 | |||||
| Weighted-average common shares outstanding: |
||||||||||||
| Basic |
43.44 | 43.53 | 51.56 | |||||||||
| Effect of dilutive options |
— | — | 1.24 | |||||||||
| Diluted |
43.44 | 43.53 | 52.80 | |||||||||
| Net income (loss) per common share: |
||||||||||||
| Basic |
$ | (1.70 | ) | $ | 2.33 | $ | 1.30 | |||||
| Diluted |
$ | (1.70 | ) | $ | 2.33 | $ | 1.27 | |||||
Certain stock options whose terms and conditions are described in Note 15, “Shareholders’ Equity and Share-Based Payments,” could potentially dilute basic EPS in the future, but were not included in the computation of diluted EPS because to do so would have been antidilutive. Those anti-dilutive options are as follows (in millions):
| As of December 31, | ||||||||||||
| 2008 | 2009 | 2010 | ||||||||||
| Antidilutive options |
1.96 | 2.27 | 0.10 | |||||||||
| 18. | OPERATING LEASES |
We operate certain office, manufacturing and warehouse facilities under operating leases. In most cases, we expect leases to be renewed or replaced with other leases when they expire.
92
Table of Contents
NORANDA ALUMINUM HOLDING CORPORATION
NOTES TO CONSOLIDATED FINANCIAL STATEMENTS
Future minimum rental payments required under operating leases that have initial or remaining non-cancelable lease terms in excess of one year as of December 31, 2010 follows (in millions):
| Year ending December 31, |
$ | |||
| 2011 |
2.9 | |||
| 2012 |
1.7 | |||
| 2013 |
0.7 | |||
| 2014 |
0.5 | |||
| 2015 |
0.6 | |||
| Thereafter |
1.3 | |||
The following schedule shows the composition of total rental expense for all operating leases except those with terms of one month or less that were not renewed (in millions):
| As of December 31, | ||||||||||||
| 2008 | 2009 | 2010 | ||||||||||
| $ | $ | $ | ||||||||||
| Minimum rentals |
2.6 | 2.6 | 3.7 | |||||||||
| Contingent rentals |
0.1 | — | — | |||||||||
| 2.7 | 2.6 | 3.7 | ||||||||||
| 19. | DERIVATIVE FINANCIAL INSTRUMENTS |
We use derivative instruments to mitigate the risks associated with fluctuations in aluminum prices, natural gas prices and interest rates. All derivatives are held for purposes other than trading.
Fixed price aluminum swaps. In 2007 and 2008, we implemented a hedging strategy designed to reduce commodity price risk and protect operating cash flows in the primary aluminum products segment through the use of fixed price aluminum sale swaps. In addition, during first quarter 2009, we entered into fixed price aluminum purchase swaps to lock in a portion of the favorable market position of our fixed price aluminum sale swaps. In March 2009, we entered into a hedge settlement agreement with Merrill Lynch to provide a mechanism for us to monetize our favorable net fixed price swap positions to fund debt repurchases, subject to certain limitations.
At the closing of our IPO in May 2010, we settled all of our remaining fixed price aluminum swaps and used the proceeds to repay indebtedness. As of December 31, 2010, we have no outstanding fixed price aluminum swaps.
Variable price aluminum swaps and other. From time to time, we enter into forward contracts with our customers to sell aluminum in the future at fixed prices in the normal course of business. Because these contracts expose us to aluminum market price fluctuations, we economically hedge this risk by entering into variable price aluminum swap contracts with various brokers, typically for terms not greater than one year. As of December 31, 2010, our outstanding variable price aluminum swaps were as follows:
| Average hedged price per pound |
Pounds hedged annually |
|||||||
| Year |
$ | (in millions) | ||||||
| 2011 |
1.02 | 28.2 | ||||||
| 2012 |
0.98 | 0.1 | ||||||
| 28.3 | ||||||||
During December 2010, we entered into “aluminum collars” related to five million pounds of rolled aluminum inventory. These hedges are designed to limit our exposure to gains or losses related to changes in LME price from the time of the inventory build until the anticipated delivery date of the metal (April through June of 2011). The carrying value of our aluminum collars was less than $0.1 million at December 31, 2010.
Natural gas swaps. We purchase natural gas to meet our production requirements. These purchases expose us to the risk of fluctuating natural gas prices. To offset changes in the Henry Hub Index Price of natural gas, we enter into financial swaps, by purchasing the fixed forward price for the Henry Hub Index and simultaneously entering into an agreement to sell the actual Henry Hub Index Price. As of December 31, 2010, our outstanding natural gas swaps were as follows:
| Average price per million BTU’s |
Million BTU’s hedged annually |
|||||||
| Year |
$ | (in millions) | ||||||
| 2011 |
7.28 | 8.0 | ||||||
| 2012 |
7.46 | 8.1 | ||||||
| 16.1 | ||||||||
93
Table of Contents
NORANDA ALUMINUM HOLDING CORPORATION
NOTES TO CONSOLIDATED FINANCIAL STATEMENTS
Interest rate swaps. We have floating-rate debt, which is subject to variations in interest rates. We have entered into an interest rate swap agreement to limit our exposure to floating interest rates through November 15, 2011. As of December 31, 2010, our outstanding interest rate swaps hedges were as follows:
| Hedged LIBOR rate | Variable rate debt hedged | |||||||
| % | ($ in millions) | |||||||
| May 15, 2011 |
4.98 | 100.0 | ||||||
| November 15, 2011 |
4.98 | 100.0 | ||||||
We recognize all derivative instruments as either assets or liabilities at their estimated fair value in our consolidated balance sheets. The following table presents the carrying values, which were recorded at fair value, of our derivative instruments outstanding (in millions):
| As of December 31, | ||||||||
| 2009 | 2010 | |||||||
| $ | $ | |||||||
| Fixed price aluminum swaps |
196.6 | — | ||||||
| Variable price aluminum swaps and other |
6.8 | 3.1 | ||||||
| Natural gas swaps |
(25.8 | ) | (40.3 | ) | ||||
| Interest rate swaps |
(13.3 | ) | (4.4 | ) | ||||
| 164.3 | (41.6 | ) | ||||||
Merrill Lynch is the counterparty for a substantial portion of our derivatives. All swap arrangements with Merrill Lynch are part of a master arrangement which is subject to the same guarantee and security provisions as the senior secured credit facilities. The master arrangement does not require us to post additional collateral, or cash margin. We present the fair values of derivatives where Merrill Lynch is the counterparty in a net position on the consolidated balance sheets as a result of our master netting agreement. The following is a presentation of the gross components of our net derivative balances (in millions):
| As of December 31, | ||||||||
| 2009 | 2010 | |||||||
| $ | $ | |||||||
| Current derivative assets |
97.4 | 3.4 | ||||||
| Current derivative liabilities |
(28.6 | ) | (26.6 | ) | ||||
| Current derivative assets (liabilities), net |
68.8 | (23.2 | ) | |||||
| Long-term derivative assets |
113.0 | 0.1 | ||||||
| Long-term derivative liabilities |
(17.5 | ) | (18.5 | ) | ||||
| Long-term derivative assets (liabilities), net |
95.5 | (18.4 | ) | |||||
The following is a gross presentation of the derivative balances segregated by type of contract and between derivatives that are designated and qualify for hedge accounting and those that are not (in millions):
| As of December 31, 2009 | As of December 31, 2010 | |||||||||||||||||||||||||||||||
| Hedges that qualify for hedge accounting |
Hedges that do not qualify for hedge accounting |
Hedges that qualify for hedge accounting |
Hedges that do not qualify for hedge accounting |
|||||||||||||||||||||||||||||
| Asset | Liability | Asset | Liability | Asset | Liability | Asset | Liability | |||||||||||||||||||||||||
| Fixed price aluminum swaps |
— | — | 202.7 | (6.1 | ) | — | — | — | — | |||||||||||||||||||||||
| Variable price aluminum swaps and other |
— | — | 6.9 | (0.1 | ) | — | — | 3.5 | (0.4 | ) | ||||||||||||||||||||||
| Natural gas swaps |
0.8 | (3.6 | ) | — | (23.0 | ) | — | (23.0 | ) | — | (17.3 | ) | ||||||||||||||||||||
| Interest rate swaps |
— | — | — | (13.3 | ) | — | — | — | (4.4 | ) | ||||||||||||||||||||||
| 0.8 | (3.6 | ) | 209.6 | (42.5 | ) | — | (23.0 | ) | 3.5 | (22.1 | ) | |||||||||||||||||||||
For derivative instruments that are designated and qualify as cash flow hedges, the effective portion of any gain or loss on the derivative is reported as a component of accumulated other comprehensive income (loss) and reclassified into earnings in the same period or periods during which the hedged transaction affects earnings.
| • | Fixed price aluminum swaps. From January 1, 2008 to January 29, 2009, fixed price aluminum-swaps were designated and qualified as cash flow hedges. As a result of the New Madrid power outage in January 2009, we concluded that certain hedged sale transactions were no longer probable of occurring, and we discontinued hedge accounting for all our aluminum fixed price sale swaps on January 29, 2009. At that date, amounts were frozen in AOCI until such time as they are reclassified into earnings in the period the hedged sales occur, or until it is determined that the original forecasted sales are probable of not occurring. |
94
Table of Contents
NORANDA ALUMINUM HOLDING CORPORATION
NOTES TO CONSOLIDATED FINANCIAL STATEMENTS
| • | Natural gas swaps. We entered into certain natural gas contracts during the fourth quarter of 2009 that qualified for and were designated as cash flow hedges based on a portion of estimated consumption of natural gas. |
The following table presents the net amount of unrealized gains (losses) on cash flow hedges that were reported as a component of AOCI at December 31, 2010, and the expected timing of those amounts being reclassified into earnings (in millions):
| Amounts expected to be reclassified into earnings |
Net unrealized gains (losses) on cash flow hedges, pre-tax, in AOCI at December 31, 2010 |
|||||||||||
| January 1, 2011 to December 31, 2011 |
Thereafter | |||||||||||
| $ | $ | $ | ||||||||||
| Fixed price aluminum swaps |
113.5 | 116.6 | 230.1 | |||||||||
| Natural gas swaps |
(12.2 | ) | (10.7 | ) | (22.9 | ) | ||||||
| 101.3 | 105.9 | 207.2 | ||||||||||
Gains and losses on the derivatives representing hedge ineffectiveness are recognized in current earnings, along with amounts that are reclassified from AOCI. Derivatives that do not qualify for hedge accounting or have not been designated for hedge accounting treatment are adjusted to fair value through earnings in gains (losses) on hedging activities in the consolidated statements of operations. The following table presents how our hedging activities affected our consolidated statements of operations for each period (in millions):
| Derivatives qualified as hedges | Derivatives not qualified as hedges |
|||||||||||||||
| Amount reclassified from AOCI |
Hedge ineffectiveness |
Change in fair value |
Total | |||||||||||||
| $ | $ | $ | $ | |||||||||||||
| Year ended December 31, 2008: |
||||||||||||||||
| Fixed price aluminum swaps |
24.2 | (13.4 | ) | (26.3 | ) | (15.5 | ) | |||||||||
| Variable price aluminum swaps |
— | — | 32.5 | 32.5 | ||||||||||||
| Natural gas swaps |
— | — | 37.1 | 37.1 | ||||||||||||
| Interest rate swaps |
— | — | 15.8 | 15.8 | ||||||||||||
| Total (gain) loss on hedging activities |
24.2 | (13.4 | ) | 59.1 | 69.9 | |||||||||||
| Year ended December 31, 2009: |
||||||||||||||||
| Fixed price aluminum swaps |
(172.2 | ) | — | 47.5 | (124.7 | ) | ||||||||||
| Variable price aluminum swaps |
— | — | (12.2 | ) | (12.2 | ) | ||||||||||
| Natural gas swaps |
— | — | 21.4 | 21.4 | ||||||||||||
| Interest rate swaps |
— | — | 3.7 | 3.7 | ||||||||||||
| Total (gain) loss on hedging activities |
(172.2 | ) | — | 60.4 | (111.8 | ) | ||||||||||
| Year ended December 31, 2010: |
||||||||||||||||
| Fixed price aluminum swaps |
(85.1 | ) | — | (1.2 | ) | (86.3 | ) | |||||||||
| Variable price aluminum swaps and other |
— | — | 0.9 | 0.9 | ||||||||||||
| Natural gas swaps |
4.8 | — | 12.9 | 17.7 | ||||||||||||
| Interest rate swaps |
— | — | 2.1 | 2.1 | ||||||||||||
| Total (gain) loss on hedging activities |
(80.3 | ) | — | 14.7 | (65.6 | ) | ||||||||||
| 20. | RECLAMATION, LAND AND ASSET RETIREMENT OBLIGATIONS |
Reclamation Obligations
For land disturbed by our bauxite mining operations, St. Ann has an obligation to return the land to a condition suitable for post-mining use (i.e., use for agricultural or housing purposes). The reclamation process is governed by GOJ’s regulations and includes filling the open mining pits and planting vegetation. GOJ regulations require the reclamation process to be completed within a certain period from the date a mining pit is mined-out, generally three years. Liabilities for reclamation are accrued as lands are disturbed and are based on the approximate acreage to be rehabilitated and the average expected cost per acre. Our current and long-term portions of reclamation obligation were $1.7 million and $7.2 million at December 31, 2009 and $2.8 million and $6.6 million at December 31, 2010 and are included in accrued liabilities and other long-term liabilities, respectively, in the accompanying consolidated balance sheets.
95
Table of Contents
NORANDA ALUMINUM HOLDING CORPORATION
NOTES TO CONSOLIDATED FINANCIAL STATEMENTS
A summary of our reclamation obligations activity at St. Ann follows (in millions):
| September 1, 2009 to December 31, 2009 |
Year
ended December 31, 2010 |
|||||||
| $ | $ | |||||||
| Reclamation liability, beginning of period |
8.5 | 8.9 | ||||||
| Additional liabilities incurred |
0.7 | 1.7 | ||||||
| Liabilities settled |
(0.5 | ) | (1.9 | ) | ||||
| Accretion |
0.2 | 0.7 | ||||||
| Reclamation liability, end of period |
8.9 | 9.4 | ||||||
Land Obligation
In cases where land to be mined is privately owned, St. Ann offers to purchase the residents’ homes for cash, relocate the residents to another area, or a combination of these two options. Estimates of these costs are recorded as liabilities as incurred. The current and long-term portions of our land obligation of $2.6 million and $5.1 million at December 31, 2009 and $2.2 million and $4.5 million at December 31, 2010 are included in accrued liabilities and other long-term liabilities, respectively, in the accompanying consolidated balance sheets.
Asset Retirement Obligations
Our asset retirement obligations consist of costs related to the disposal of certain spent pot liners associated with the New Madrid smelter, as well as costs associated with the future closure and post-closure care of “red mud lakes” at the Gramercy facility, where Gramercy disposes of wastes from its refining process.
The current portion of the liability of $1.6 million and $2.2 million at December 31, 2009 and 2010, respectively, relates to the disposal of spent pot-liners at New Madrid and is recorded in accrued liabilities in the accompanying consolidated balance sheets. The remaining non-current portion of $11.8 million and $12.7 million at December 31, 2009 and 2010, respectively, is included in other long-term liabilities in the accompanying consolidated balance sheets. Asset retirement obligations are estimated at fair value based on cash flows discounted at a credit-adjusted risk-free rate.
A summary of our asset retirement obligations activity follows (in millions):
| Year ended December 31, | ||||||||
| 2009 | 2010 | |||||||
| $ | $ | |||||||
| Balance, beginning of period |
8.8 | 13.4 | ||||||
| Additional liabilities incurred |
1.5 | 1.3 | ||||||
| Liabilities assumed in connection with the Joint Venture Transaction |
4.8 | — | ||||||
| Liabilities settled |
(2.9 | ) | (0.9 | ) | ||||
| Accretion |
1.2 | 1.1 | ||||||
| Balance, end of period |
13.4 | 14.9 | ||||||
At December 31, 2009 and 2010, we had $6.2 million and $9.2 million, respectively, of restricted cash in an escrow account as security for the payment of red mud lake closure obligations that will arise under state environmental laws upon the termination of operations at the Gramercy facility. This amount is included in other assets in the accompanying consolidated balance sheets. The remaining restricted cash relates primarily to funds for workers compensation claims.
The ongoing operations at the Gramercy facility generate hazardous materials that are disposed of according to long-standing environmental permits. We have not recorded an ARO for removing such material that may remain throughout the production process up until closure of the Gramercy facility as we do not currently believe there is a reasonable basis for estimating the liability. Our ability to form a reasonable estimate is impeded as we cannot predict the amount of hazardous materials that will be remaining at the time of such a closure, due to the fact that we are continuously removing and disposing of these materials as they are generated.
| 21. | NON-CONTROLLING INTEREST |
Through St. Ann, we hold a 49% partnership interest in Noranda Jamaica Bauxite Partners (“NJBP”), in which the GOJ holds a 51% interest. NJBP mines bauxite, approximately 60% of which is sold to Gramercy, with the balance sold to Sherwin Alumina Company.
St. Ann is a party to several agreements (collectively, the “Mining Agreements”) with the GOJ. St. Ann and the GOJ have equal voting rights in NJBP’s executive committee. St. Ann manages the mining operations under a management agreement. St. Ann receives bauxite from NJBP at NJBP’s cost and pays the GOJ a return on its investment in NJBP through fees paid by NBL pursuant to an establishment agreement that defines the negotiated fiscal structure. St. Ann has a special mining lease with the GOJ for the supply of bauxite. The lease ensures access to sufficient reserves to allow St. Ann to ship annually 4.5 million dry metric tonnes
96
Table of Contents
NORANDA ALUMINUM HOLDING CORPORATION
NOTES TO CONSOLIDATED FINANCIAL STATEMENTS
(“DMT”) of bauxite from mining operations in a specified concession area through September 30, 2030. We have reached agreement with the GOJ to mine 5.4 million DMT during each of the years 2011 and 2012.
In return for these rights, St. Ann is required to pay fees called for in the establishment agreement consisting of:
| • | Dedication fee — Base dedication fee of $0.6 million per year is tied to a total land base of 13,820 acres. The sum actually paid will vary with the current total of bauxite lands owned by the GOJ which is being used by NJBP expressed as a proportion of the total land base. |
| • | Depletion fee — A base depletion fee of $0.2 million is paid on a base shipment of 4,000,000 DMT per annum. Variations in amounts paid will be proportional to changes in shipments. |
| • | Asset usage fee — St. Ann also pays the GOJ 10% annually in respect of the GOJ’s 51% share of the mining assets. |
| • | Production levy — A production levy determined using the average realized price of primary aluminum as determined by regulation of the GOJ, is applied to all bauxite shipped from Jamaica other than sales to the GOJ and its agencies. |
| • | Royalty — Royalties are payable to any person for the mining of bauxite at a rate of US $1.50 per dry metric tonnes of monohydrate bauxite shipped and US $2.00 per dry metric tonnes of trihydrate bauxite shipped, provided that during any period when the production levy is payable the royalty shall be at a rate of US $0.50 per dry metric tonnes. |
As of December 31, 2009 and 2010, we recorded accrued liabilities of $4.9 million and $4.0 million, respectively, for these fees. Prepaid GOJ fees of $10.7 million and $2.3 million were recorded in prepaid assets as of December 31, 2009 and 2010, respectively.
On December 31, 2009, NBL arrived at an understanding with the GOJ to amend the establishment agreement. This amendment sets the fiscal regime structure of the establishment agreement from January 1, 2009 through December 31, 2014. The amendment provides for a commitment by NBL to make certain expenditures for haulroad development, maintenance, dredging, land purchases, contract mining, training and other general capital expenditures from 2009 through 2014. If we do not meet our commitment to the GOJ regarding these expenditures, we would owe to the GOJ a penalty that could be material to our financial statements. We believe there is a remote possibility that we will not meet the commitment. We signed the formal amendment with the GOJ on the fiscal structure in June 2010, which did not change the cost structure from the agreement reached in 2009. The terms of the agreement required us to make a $14.0 million prepayment of Jamaican income taxes for fiscal years 2011 through 2014, of which $10.0 million was paid in June 2010 and the remainder will be paid in April 2011. As of December 31, 2010, $5.0 million of the prepayment is recorded in prepaid assets and $5.0 million is in other assets.
We have determined that NJBP is a variable interest entity under U.S. GAAP, and St. Ann is NJBP’s primary beneficiary. The determination that St. Ann is the primary beneficiary was based on the fact that St. Ann absorbs the profits and losses associated with the partnership, while the GOJ receives certain fees from St. Ann (royalties, production and asset usage fees, etc.). Therefore, we consolidate NJBP into our consolidated financial statements beginning with the date of the Joint Venture Transaction. On January 1, 2010, we adopted Accounting Standards Update No. 2009-17, “Improvements in Financial Reporting by Enterprises Involved with Variable Interest Entities,” (“ASU 2009-17”) which replaced a quantitative approach for determining the primary beneficiary with a qualitative approach and did not change our previous conclusion that St. Ann is NJBP’s primary beneficiary. Due to the consolidation of NJBP, the following amounts are included in our consolidated balance sheets (in millions):
| December 31, 2009 | December 31, 2010 | |||||||||||||||||||||||
| NJBP balances |
Impact of eliminations |
Impact on consolidated statements |
NJBP balances |
Impact of eliminations |
Impact on consolidated statements |
|||||||||||||||||||
| $ | $ | $ | $ | $ | $ | |||||||||||||||||||
| Cash and cash equivalents |
0.1 | — | 0.1 | 0.5 | — | 0.5 | ||||||||||||||||||
| Accounts receivable, net |
12.4 | (12.4 | ) | — | 16.1 | (16.1 | ) | — | ||||||||||||||||
| Inventories, net (consisting of maintenance supplies, inventory and fuel) |
11.8 | — | 11.8 | 8.6 | — | 8.6 | ||||||||||||||||||
| Property, plant and equipment, net |
36.9 | — | 36.9 | 38.4 | — | 38.4 | ||||||||||||||||||
| Other assets |
2.3 | — | 2.3 | 4.1 | — | 4.1 | ||||||||||||||||||
| Accounts payable |
(42.7 | ) | 36.5 | (6.2 | ) | (43.1 | ) | 36.0 | (7.1 | ) | ||||||||||||||
| Accrued liabilities |
(0.8 | ) | — | (0.8 | ) | (4.6 | ) | — | (4.6 | ) | ||||||||||||||
| Environmental, land and reclamation liabilities |
(8.2 | ) | — | (8.2 | ) | (8.3 | ) | — | (8.3 | ) | ||||||||||||||
| Non-controlling interest |
(6.0 | ) | — | (6.0 | ) | (6.0 | ) | — | (6.0 | ) | ||||||||||||||
| NBP’s net investment and advances to NJBP |
5.8 | 24.1 | 29.9 | 5.7 | 19.9 | 25.6 | ||||||||||||||||||
97
Table of Contents
NORANDA ALUMINUM HOLDING CORPORATION
NOTES TO CONSOLIDATED FINANCIAL STATEMENTS
The liabilities recognized as a result of consolidating NJBP do not represent additional claims on our general assets. NJBP’s creditors have claims only on the specific assets of NJBP and St. Ann. Similarly, the assets of NJBP we consolidate do not represent additional assets available to satisfy claims against our general assets.
St. Ann receives bauxite from NJBP at cost, excluding the mining lease fees described above; therefore, NJBP operates at breakeven. Further, all returns to the GOJ are provided through the payments from St. Ann under the various fees, levies, and royalties described above. In these circumstances, no portion of NJBP’s net income (loss) or consolidated comprehensive income (loss) is allocated to the non-controlling interest. We do not expect the balance of the non-controlling interest to change from period to period unless there is an adjustment to the fair value of inventory or property, plant and equipment, as may occur in a LCM or asset impairment scenario.
| 22. | FAIR VALUE MEASUREMENTS |
Fair value is defined as the price that would be received to sell an asset or paid to transfer a liability in an orderly transaction between market participants at the measurement date (exit price). We incorporate assumptions that market participants would use in pricing the asset or liability, and utilize market data to the maximum extent possible. Our fair value measurements incorporate nonperformance risk (i.e., the risk that an obligation will not be fulfilled). In measuring fair value, we reflect the impact of our own credit risk on our liabilities, as well as any collateral. We also consider the credit standing of our counterparties in measuring the fair value of our assets.
We use any of three valuation techniques to measure fair value: the market approach, the income approach, and the cost approach. We determine the appropriate valuation technique based on the nature of the asset or liability being measured and the reliability of the inputs used in arriving at fair value.
The inputs used in applying valuation techniques include assumptions that market participants would use in pricing the asset or liability (i.e., assumptions about risk). Inputs may be observable or unobservable. We use observable inputs in our valuation techniques, and classify those inputs in accordance with the fair value hierarchy established by applicable accounting guidance, which prioritizes those inputs. The fair value hierarchy gives the highest priority to unadjusted quoted prices in active markets for identical assets or liabilities (Level 1 measurement) and the lowest priority to unobservable inputs (Level 3 measurement).
Level 1 inputs – Unadjusted quoted prices in active markets for identical assets or liabilities that we have access to as of the reporting date. Active markets are those in which transactions for the asset or liability occur in sufficient frequency and volume to provide pricing information on an ongoing basis. Fair value measurements that may be subject to Level 1 inputs include exchange-traded derivatives or listed equities.
Level 2 inputs – Inputs other than quoted prices included in Level 1, which are either directly or indirectly observable as of the reporting date. A Level 2 input must be observable for substantially the full term of the asset or liability. Fair value measurements that may fall into Level 2 could include financial instruments with observable inputs such as interest rates or yield curves.
Level 3 inputs – Unobservable inputs that reflect our own assumptions about the assumptions market participants would use in pricing the asset or liability. Fair value measurements that may be classified as Level 3 could, for example, be determined from our internally developed model that results in our best estimate of fair value. Fair value measurements that may fall into Level 3 could include certain structured derivatives or financial products that are specifically tailored to a customer’s needs.
Financial assets and liabilities are classified based on the lowest enumerated level of input that is significant to the fair value measurement in its entirety. Our assessment of the significance of a particular input to the fair value measurement requires judgment, and may affect the fair value of assets and liabilities and their placement within the fair value hierarchy.
Our policy is to recognize transfers between Level 1, 2 or 3 at the end of the reporting period. No significant transfers between fair value hierarchy levels occurred during 2010.
98
Table of Contents
NORANDA ALUMINUM HOLDING CORPORATION
NOTES TO CONSOLIDATED FINANCIAL STATEMENTS
Valuations on a recurring basis
The tables below set forth by level the fair value hierarchy of our assets and liabilities that were measured at fair value on a recurring basis (in millions):
| As of December 31, 2009 | ||||||||||||||||
| Level 1 | Level 2 | Level 3 | Total | |||||||||||||
| $ | $ | $ | $ | |||||||||||||
| Cash equivalents |
154.9 | — | — | 154.9 | ||||||||||||
| Derivative assets |
— | 210.4 | — | 210.4 | ||||||||||||
| Derivative liabilities |
— | (46.1 | ) | — | (46.1 | ) | ||||||||||
| Pension plan assets: |
||||||||||||||||
| Equity securities: |
||||||||||||||||
| Diversified common stock mutual fund |
47.6 | — | — | 47.6 | ||||||||||||
| Other diversified common stocks |
44.6 | 40.5 | 0.2 | 85.3 | ||||||||||||
| Global equity |
4.2 | 0.8 | — | 5.0 | ||||||||||||
| Fixed income securities: |
||||||||||||||||
| Diversified fixed income mutual fund |
75.6 | — | — | 75.6 | ||||||||||||
| Government of Jamaica bonds |
7.6 | 2.7 | — | 10.3 | ||||||||||||
| Global corporate bonds |
2.8 | — | — | 2.8 | ||||||||||||
| Real estate |
1.9 | — | — | 1.9 | ||||||||||||
| Cash and cash equivalents, and other |
4.9 | 1.4 | — | 6.3 | ||||||||||||
| Total |
344.1 | 209.7 | 0.2 | 554.0 | ||||||||||||
| As of December 31, 2010 | ||||||||||||||||
| Level 1 | Level 2 | Level 3 | Total | |||||||||||||
| $ | $ | $ | $ | |||||||||||||
| Cash equivalents |
21.4 | — | — | 21.4 | ||||||||||||
| Derivative assets |
— | 3.5 | — | 3.5 | ||||||||||||
| Derivative liabilities |
— | (45.1 | ) | — | (45.1 | ) | ||||||||||
| Pension plan assets: |
||||||||||||||||
| Equity securities: |
||||||||||||||||
| Diversified common stock mutual fund |
59.9 | — | — | 59.9 | ||||||||||||
| Other diversified common stocks |
51.0 | 49.8 | 3.6 | 104.4 | ||||||||||||
| Global equity |
5.4 | 1.3 | — | 6.7 | ||||||||||||
| Fixed income securities: |
||||||||||||||||
| Diversified fixed income mutual fund |
83.1 | — | — | 83.1 | ||||||||||||
| Government of Jamaica bonds |
7.7 | 5.0 | — | 12.7 | ||||||||||||
| Global corporate bonds |
1.3 | — | — | 1.3 | ||||||||||||
| Real estate |
1.4 | — | — | 1.4 | ||||||||||||
| Cash and cash equivalents, and other |
1.8 | 1.5 | — | 3.3 | ||||||||||||
| Total |
233.0 | 16.0 | 3.6 | 252.6 | ||||||||||||
Changes in the fair value of the pension plan assets classified as Level 3 for the year ended December 31, 2010 were as follows:
| Level 3 asset fair value |
||||
| $ | ||||
| Fair value, beginning of year |
0.2 | |||
| Additional investment |
0.5 | |||
| Return on assets |
2.9 | |||
| Fair value, end of year |
3.6 | |||
Cash equivalents are invested in U.S. treasury securities, short-term treasury bills and commercial paper. These instruments are valued based upon unadjusted, quoted prices in active markets and are classified within Level 1.
Fair values of all derivative instruments are classified as Level 2. Those fair values are primarily measured using industry standard models that incorporate inputs including quoted forward prices for commodities, interest rates, and current market prices for those assets and liabilities. Substantially all of the inputs are observable throughout the full term of the instrument. The counterparty of our derivative trades is Merrill Lynch, with the exception of a small portion of our variable price aluminum swaps.
Pension plan assets were valued based upon the fair market value of the underlying investments. Plan assets invested in debt and equity securities traded in active markets are classified within Level 1. Certain investments that do not have guaranteed liquidity
99
Table of Contents
NORANDA ALUMINUM HOLDING CORPORATION
NOTES TO CONSOLIDATED FINANCIAL STATEMENTS
and certain investments in limited partnerships, pooled investment funds, or unit trusts that have underlying investments classified as Level 1 or Level 2 securities are classified as Level 2. Our investment in a small capitalization equity fund that has underlying investments for which significant unobservable inputs were used to determine fair value is classified as Level 3 within the hierarchy.
The fair value of the underlying investments are measured based on the original transaction price or recent transactions involving the same or similar instruments. The fair value measurement of investments classified as Level 3 may also reflect adjustments for illiquidity or non-transferability of the underlying investments. To be consistent with current presentation, we reclassified $40.4 million of pension plan assets previously reported as level 1 assets as of December 31, 2009 to level 2. We determined these assets should be classified as level 2 because the investments are in a limited partnership or a pooled investment fund. We also reclassified $0.2 million of our investment in a small capitalization fund from level 1 to level 3 as the fund has underlying investments for which significant unobservable inputs were used to determine fair value. The valuation of the assets did not change.
In Note 13, “Long-Term Debt,” we disclose the fair values of our debt instruments. Those fair values are classified as Level 2 within the hierarchy. While the senior floating rates notes have quoted market prices, we do not believe transactions on those instruments occur in sufficient enough frequency or volume to warrant a Level 1 classification. Further, the fair values of the term B loan and revolving credit facility are based on interest rates available at each balance sheet date, resulting in a Level 2 classification as well.
Valuations on a non-recurring basis
Fair value of goodwill, trade names and investment in affiliates (prior to the Joint Venture Transaction) are classified as Level 3 within the hierarchy, as their fair values are measured using management’s assumptions about future profitability and cash flows. Such assumptions include a combination of discounted cash flow and market-based valuations. Discounted cash flow valuations require assumptions about future profitability and cash flows, which we believe reflects the best estimates at the date the valuations were performed. Key assumptions used to determine discounted cash flow valuations at March 31, 2009 and June 30, 2009 and December 31, 2009 include: (a) cash flow periods ranging from five to seven years; (b) terminal values based upon long-term growth rates ranging from 1.0% to 2.0%; and (c) discount rates based on a risk-adjusted weighted average cost of capital ranging from 12.5% to 13.8% for intangibles and to 19.0% for investment in affiliates.
The accounting for the Joint Venture Transaction involved a number of individual measurements based on significant inputs that are not observable in the market and, therefore, represent a Level 3 measurement.
| • | Fair value of consideration: |
| • | Fair value of 50% equity interest. The fair values of our existing 50% interests in Gramercy and St. Ann were based on discounted cash flow projections. These projections required assumptions about future profitability and cash flows, which we believe reflected the best estimates of a hypothetical market participant at August 31, 2009. Key assumptions included: (a) cash flow periods of five years; (b) terminal values based upon long-term growth rates ranging from 1.0% to 2.0%; and (c) discount rates based on a risk-adjusted weighted average cost of capital ranging from 17.0% to 20.0%. Revenues included in the discounted cash flow projections were based on forecasted aluminum prices (on which alumina prices are based) per the LME and per aluminum analysts’ estimates, while forecasted volumes were based on our projected alumina needs and estimated third party customer demand. Expenses were based primarily on historical experience adjusted for inflation and production volume projections. |
| • | Non-controlling interest. The value of GOJ’s non-controlling interest in NJBP was calculated as 51% of the net fair value of NJBP’s assets and liabilities. |
| • | Fair values of assets acquired and liabilities assumed: |
| • | Cash and cash equivalents, accounts receivable, other assets, accounts payable and accrued liabilities balances were recorded at their carrying values, which approximated fair value. |
| • | Inventories were valued at their net realizable value. Except for supplies inventory, the fair value of acquired inventories was a function of the inventories stage of production, with separate values established for finished goods, work-in-process, and raw materials. Key inputs included ultimate selling price, costs to complete in-process material, and disposal or selling costs, along with an estimate of the profit margin on the sales effort. |
| • | Property, plant and equipment were valued using a market approach where we were able to identify comparable sales of real estate and used machinery and equipment. Where comparable sales of used machinery and equipment were not available, we estimated fair value based on the replacement cost of new plant and equipment, less depreciation and decreases in value due to physical depreciation, functional obsolescence and economic obsolescence. Whether valuations were based on comparable sales or depreciated replacement cost, we considered the highest and best use for |
100
Table of Contents
NORANDA ALUMINUM HOLDING CORPORATION
NOTES TO CONSOLIDATED FINANCIAL STATEMENTS
| the assets being valued, which was determined to be their current use in the production of alumina or the mining of bauxite. |
| • | Intangible assets consist of contractual and non-contractual customer relationships. Valuations for these assets were based on discounted cash flow projections. These valuations require assumptions about future profitability and cash flows, which we believe reflected the best estimates of a hypothetical market participant at August 31, 2009. Key assumptions included: (a) cash flow periods over the estimated contract lives based on customer retention rates and (b) discount rates based on a risk-adjusted weighted-average cost of capital ranging 20.0% to 23.0%. |
| • | Asset retirement obligations and reclamation liabilities were valued at fair value using a discounted cash flow approach with credit-adjusted risk free rates ranging from 7.0% to 10.0%. |
| • | The fair values of the pension benefit obligations were actuarially determined using the Projected Unit Credit method with discount rates ranging from 5.3% to 5.7% for Gramercy and 16.0% for St. Ann. Pension plan assets were valued based on the fair market value of the underlying investments. Net pension asset and liabilities were calculated as the excess or deficiency of plan assets compared to benefit obligation. |
| 23. | COMMITMENTS AND CONTINGENCIES |
Labor Commitments
We are a party to six collective bargaining agreements that expire at various times within the next five years. As of December 31, 2010, approximately 1,600 of our employees (or 69%) were members of the following unions: the United Steelworkers of America (“USWA”); the International Association of Machinists and Aerospace Workers (“IAMAW”); the University and Allied Workers Union (“UAWU”); and the Union of Technical, Administrative and Supervisory Personnel (“UTASP”). We have completed the process of formalizing recognition of a third union at St. Ann with the Bustamante Industrial Trade Union (“BITU”). We are currently in negotiations to finalize terms of a three year agreement with the BITU.
| • | The agreement with the USWA at our Gramercy refinery expired in September 2010, and on October 1, 2010 a new five year labor agreement with the USWA was ratified by the refinery’s union members. |
| • | The agreement at St. Ann with the UAWU expired on April 30, 2010. We are currently in negotiation to finalize the terms of a three year agreement with the UAWU. |
| • | The agreement at St. Ann with the UTASP expired in December 2010. As of December 31, 2010, we have not received a new claim and have not begun negotiations with the UTASP. |
| • | The agreement at our Newport rolling mill with the IAMAW expires in May 2011. |
| • | All other collective bargaining agreements expire within the next five years. |
Legal Contingencies
We are a party to legal proceedings incidental to our business. In the opinion of management, the ultimate liability with respect to these actions will not materially affect our financial position, results of operations, and cash flows.
Environmental Matters
In addition to our asset retirement obligations discussed in Note 20, “Reclamation, Land and Asset Retirement Obligations,” we have identified certain environmental conditions requiring remedial action or ongoing monitoring at the Gramercy refinery. As of December 31, 2009 and 2010, we recorded undiscounted liabilities of $1.3 million and $2.0 million, respectively, in accrued liabilities and $3.0 million and $2.3 million, respectively, in other long-term liabilities, for remediation of Gramercy’s known environmental conditions. Approximately two-thirds of the recorded liability represents clean-up costs expected to be incurred during the next five years. The remainder represents monitoring costs which will be incurred ratably over a 30 year period. Because the remediation and subsequent monitoring related to these environmental conditions occurs over an extended period of time, these estimates are subject to change based on cost. No other responsible parties are involved in any ongoing environmental remediation activities.
We cannot predict what environmental laws or regulations will be enacted or amended in the future, how existing or future laws or regulations will be interpreted or enforced or the amount of future expenditures that may be required to comply with such laws or regulations. Such future requirements may result in liabilities which may have a material adverse effect on our financial condition, results of operations or cash flows.
Power Contract
Electricity is the largest cost component at our New Madrid smelter and is a key factor to our long-term competitive position in the primary aluminum business. We have a power purchase agreement with Ameren pursuant to which we have agreed to purchase substantially all of New Madrid’s electricity through May 2020. Included in the contract is a minimum purchase requirement equal to
101
Table of Contents
NORANDA ALUMINUM HOLDING CORPORATION
NOTES TO CONSOLIDATED FINANCIAL STATEMENTS
five mega watts, calculated at peak and non-peak demand charges, or approximately $4.2 million over the life of the contract. These minimum purchase requirements represent significantly less than we require, given the power-intensive nature of our smelter facility. Our current rate structure with Ameren consists of two components: a base rate and a fuel adjustment clause.
On June 21, 2010, the Missouri Public Service Commission (“MoPSC”) ruled on the power rate case filed by Ameren on July 24, 2009. The MoPSC’s ruling resulted in no significant change to the base electricity rate for the New Madrid smelter. The fuel adjustment clause resulted in additional fuel charges of $5.4 million recorded in cost of goods sold during the year ended December 31, 2010. We are not able to predict these fuel adjustment charges, as they are dependent on Ameren’s fuel costs and off system sales volume and prices.
On September 3, 2010, Ameren filed a new rate case with the MoPSC seeking an 11% base rate increase. We expect a ruling on this request by July 29, 2011.
We are currently appealing several rate-related issues, including the previous two rate rulings and the amount of cost increases related to the fuel adjustment clause. As of December 31, 2009 and 2010, other current assets (See Note 11, “Supplemental Balance Sheet Information”), includes $1.9 million and $9.8 million, respectively, held in escrow by the Missouri Circuit Court for disputed amounts related to these appeals.
| 24. | INVESTMENTS IN AFFILIATES |
Through August 31, 2009, we held a 50% interest in Gramercy and in St. Ann. On August 31, 2009, we became sole owner of Gramercy and St. Ann. See Note 2, “Joint Venture Transaction,” for further information.
Summarized financial information for the joint ventures (as recorded in their respective consolidated financial statements, at full value, excluding the amortization of the excess carrying values of our investments over the underlying equity in net assets of the affiliates), is presented through August 31, 2009, prior to the Joint Venture Transaction. The results of operations of Gramercy and St. Ann have been included in our consolidated financial statements since the Joint Venture Transaction date.
Summarized statements of operations information prior to the Joint Venture Transaction follows (in millions):
| Year ended December 31, 2008 |
Period
from January 1, 2009 to August 31, 2009 |
|||||||
| $ | $ | |||||||
| Net sales |
539.4 | 208.1 | ||||||
| Gross profit |
25.3 | 5.5 | ||||||
| Net income |
30.4 | 9.9 | ||||||
Net sales included sales to related parties, which include alumina sales to us and our previous joint venture partner and bauxite sales from St. Ann to Gramercy (in millions):
| Year ended December 31, 2008 |
Period from January 1, 2009 to August 31, 2009 |
|||||||
| $ | $ | |||||||
| St. Ann to Gramercy |
54.3 | 29.1 | ||||||
| St. Ann to third parties |
61.0 | 20.0 | ||||||
| Gramercy to us and our joint venture partner |
325.9 | 112.1 | ||||||
| Gramercy to third parties |
98.2 | 46.9 | ||||||
| 539.4 | 208.1 | |||||||
Impairment
In first quarter 2009 in response to the global economic contraction and the New Madrid power outage production was partially curtailed at Gramercy and St. Ann. These partial curtailments led us to evaluate our investment in the joint ventures for impairment in first quarter 2009, which resulted in a $45.3 million write-down ($39.3 million for St. Ann and $6.0 million for Gramercy). In second quarter 2009, we recorded a $35.0 million impairment charge related to our equity method investment in St. Ann. This impairment reflects second quarter 2009 revisions to our assumptions about St. Ann’s future profitability and cash flows. Each impairment is recorded within equity in net (income) loss of investments in affiliates in the consolidated statements of operations.
Our analyses included assumptions about future profitability and cash flows of the joint ventures, which we believe to reflect our best estimates at the date the valuations were performed. The estimates were based on information that was known or knowable at the date of the valuations, and it is at least reasonably possible that the assumptions employed by us will be materially different from the actual amounts or results. See Note 22, “Fair Value Measurements” for further discussion of significant assumptions used.
102
Table of Contents
NORANDA ALUMINUM HOLDING CORPORATION
NOTES TO CONSOLIDATED FINANCIAL STATEMENTS
Carrying Value Compared To Underlying Equity
Prior to the Joint Venture Transaction, the excess of the carrying values of our share of the joint venture investments over the amounts of underlying equity in net assets ($117.0 million at December 31, 2008) was amortized on a straight-line basis for each affiliate as part of recording our share of each joint venture’s earnings or losses. Amortization expense recorded in equity in net (income) loss of investments in affiliates follows (in millions):
| $ | ||||
| Year ended December 31, 2008 |
7.5 | |||
| Period from January 1, 2009 to August 31, 2009 |
4.3 | |||
| 25. | BUSINESS SEGMENT INFORMATION |
We manage and operate our business segments based on the markets we serve and the products we produce.
During first quarter 2010, in connection with continued integration activities of our alumina refinery in Gramercy and our bauxite mining operations in St. Ann, we changed the composition of our reportable segments. Those integration activities included a re-evaluation of the financial information provided to our Chief Operating Decision Maker, as that term is defined in U.S. GAAP. As a result we identified five reportable segments:
| • | Bauxite – Mines and produces the bauxite used for alumina production at our Gramercy refinery, and the remaining bauxite not taken by the refinery is sold to a third party. |
| • | Alumina refining – Chemically refines and converts bauxite into alumina, which is the principal raw material used in the production of primary aluminum products. The Gramercy refinery is the source for the vast majority of our New Madrid smelter’s alumina requirements. The remaining alumina production at the Gramercy refinery that is not taken by New Madrid is in the form of smelter grade alumina and alumina hydrate or chemical grade alumina and is sold to third parties. |
| • | Primary aluminum products – Produces value-added aluminum products in several forms, including billet, rod, high purity sow, and foundry. The primary aluminum products segment also produces commodity grade sow. |
| • | Flat rolled products – Has rolling mill facilities whose major foil products are: finstock and container stock. |
| • | Corporate – Reflects costs of corporate operations. |
During third quarter 2010, as we continued to formalize our internal reporting practices, we revised our segment performance measure to be “segment profit (loss)” rather than the previously reported U.S. GAAP basis segment operating income. Segment profit (in which certain items, primarily non-recurring costs or non-cash expenses, are not allocated to the segments and in which certain items, primarily the income statement effects of current period cash settlements of hedges, are allocated to the segments) is a measure used by management as a basis for resource allocation. We have retrospectively adjusted our segment results for 2008 and 2009 to conform to the updated segment performance measure. The segment changes discussed above had no impact on our historical consolidated financial position, results of operations or cash flows.
The accounting policies of the segments are the same as those described in Note 1, “Accounting Policies.”
Major Customer Information
For the years ended December 31, 2008, 2009 and 2010, there were no major customers from whom over 8% of consolidated revenue was derived.
Geographic Region Information
Substantially all of our sales are within the United States. Sales whose country of origin was outside of the United States represented less than 5% of our consolidated sales in 2009 and 2010. All long-lived assets are located in the United States except those assets of our bauxite mining operations in Jamaica, which totaled $52.9 million at December 31, 2009 and $56.3 million at December 31, 2010.
103
Table of Contents
NORANDA ALUMINUM HOLDING CORPORATION
NOTES TO CONSOLIDATED FINANCIAL STATEMENTS
Summary of Business by Segment
The following is our operating segment information for the years ended December 31, 2008, 2009, and 2010 and asset balances as of December 31, 2009 and 2010 (in millions):
| Year ended December 31, 2008 | ||||||||||||||||||||
| Primary aluminum products |
Flat rolled products |
Corporate | Eliminations | Consolidated | ||||||||||||||||
| $ | $ | $ | $ | $ | ||||||||||||||||
| Sales: |
||||||||||||||||||||
| External customers |
660.7 | 605.7 | — | — | 1,266.4 | |||||||||||||||
| Intersegment |
97.8 | — | — | (97.8 | ) | — | ||||||||||||||
| 758.5 | 605.7 | — | (97.8 | ) | 1,266.4 | |||||||||||||||
| Segment profit (loss) |
222.7 | 28.5 | (15.9 | ) | 7.4 | 242.7 | ||||||||||||||
| Depreciation and amortization |
72.0 | 26.1 | 0.2 | — | 98.3 | |||||||||||||||
| Capital expenditures |
42.3 | 8.8 | 0.5 | — | 51.6 | |||||||||||||||
| Year ended December 31, 2008 | ||||||||||||||||||||
| Primary aluminum products |
Flat rolled products |
Corporate | Eliminations | Consolidated | ||||||||||||||||
| $ | $ | $ | $ | $ | ||||||||||||||||
| Segment profit (loss) |
222.7 | 28.5 | (15.9 | ) | 7.4 | 242.7 | ||||||||||||||
| Depreciation and amortization |
(72.0 | ) | (26.1 | ) | (0.2 | ) | — | (98.3 | ) | |||||||||||
| Joint Venture EBITDA |
(21.3 | ) | — | — | — | (21.3 | ) | |||||||||||||
| LIFO/LCM |
(12.1 | ) | (5.5 | ) | — | (7.4 | ) | (25.0 | ) | |||||||||||
| Loss on asset disposal |
(5.0 | ) | (3.5 | ) | — | — | (8.5 | ) | ||||||||||||
| Non-cash pension, accretion and stock compensation |
(4.1 | ) | (0.5 | ) | (5.2 | ) | — | (9.8 | ) | |||||||||||
| Restructuring, relocation and severance |
(4.0 | ) | (3.8 | ) | (0.5 | ) | — | (8.3 | ) | |||||||||||
| Consulting and sponsor fees |
— | — | (10.2 | ) | — | (10.2 | ) | |||||||||||||
| Cash settlements on hedging transactions |
5.3 | 3.8 | — | — | 9.1 | |||||||||||||||
| Goodwill and other intangible asset impairment |
— | (25.5 | ) | — | — | (25.5 | ) | |||||||||||||
| Other, net |
(0.1 | ) | (1.4 | ) | 1.0 | — | (0.5 | ) | ||||||||||||
| Operating income (loss) |
109.4 | (34.0 | ) | (31.0 | ) | — | 44.4 | |||||||||||||
| Interest expense, net |
88.0 | |||||||||||||||||||
| Loss on hedging activities, net |
69.9 | |||||||||||||||||||
| Equity in net (income) of investments in affiliates |
(7.7 | ) | ||||||||||||||||||
| Loss on debt repurchase |
1.2 | |||||||||||||||||||
| Total other expense |
(151.4 | ) | ||||||||||||||||||
| Loss before income taxes |
(107.0 | ) | ||||||||||||||||||
104
Table of Contents
NORANDA ALUMINUM HOLDING CORPORATION
NOTES TO CONSOLIDATED FINANCIAL STATEMENTS
| Year ended December 31, 2009 | ||||||||||||||||||||||||||||
| Bauxite | Alumina refining |
Primary aluminum products |
Flat rolled products |
Corporate | Eliminations | Consolidated | ||||||||||||||||||||||
| $ | $ | $ | $ | $ | $ | $ | ||||||||||||||||||||||
| Sales: |
||||||||||||||||||||||||||||
| External customers |
14.6 | 56.5 | 290.4 | 408.4 | — | — | 769.9 | |||||||||||||||||||||
| Intersegment |
20.0 | 27.7 | 49.9 | — | — | (97.6 | ) | — | ||||||||||||||||||||
| 34.6 | 84.2 | 340.3 | 408.4 | — | (97.6 | ) | 769.9 | |||||||||||||||||||||
| Segment profit (loss) |
12.3 | (2.3 | ) | 4.9 | 35.1 | (28.4 | ) | (2.0 | ) | 19.6 | ||||||||||||||||||
| Depreciation and amortization |
4.6 | 6.1 | 59.2 | 23.1 | 0.4 | — | 93.4 | |||||||||||||||||||||
| Capital expenditures |
1.6 | 1.9 | 37.7 | 3.7 | 1.8 | — | 46.7 | |||||||||||||||||||||
| Year ended December 31, 2009 | ||||||||||||||||||||||||||||
| Bauxite | Alumina refining |
Primary aluminum products |
Flat rolled products |
Corporate | Eliminations | Consolidated | ||||||||||||||||||||||
| $ | $ | $ | $ | $ | $ | $ | ||||||||||||||||||||||
| Segment profit (loss) |
12.3 | (2.3 | ) | 4.9 | 35.1 | (28.4 | ) | (2.0 | ) | 19.6 | ||||||||||||||||||
| Depreciation and amortization |
(4.6 | ) | (6.1 | ) | (52.4 | ) | (23.1 | ) | (0.4 | ) | — | (86.6 | ) | |||||||||||||||
| Joint Venture EBITDA |
— | — | (10.4 | ) | — | — | — | (10.4 | ) | |||||||||||||||||||
| LIFO/LCM |
— | — | 6.5 | 8.9 | — | 2.0 | 17.4 | |||||||||||||||||||||
| Loss on asset disposal |
— | — | (4.0 | ) | (3.3 | ) | — | — | (7.3 | ) | ||||||||||||||||||
| Non-cash pension, accretion and stock compensation |
(0.2 | ) | (0.1 | ) | (4.4 | ) | (3.7 | ) | (2.4 | ) | — | (10.8 | ) | |||||||||||||||
| Restructuring, relocation and severance |
— | (0.8 | ) | (0.4 | ) | (0.7 | ) | (0.9 | ) | — | (2.8 | ) | ||||||||||||||||
| Consulting and sponsor fees |
— | — | — | — | (5.8 | ) | — | (5.8 | ) | |||||||||||||||||||
| Cash settlements on hedging transactions |
— | — | 10.1 | 13.2 | — | — | 23.3 | |||||||||||||||||||||
| Power outage |
— | — | 30.6 | — | — | — | 30.6 | |||||||||||||||||||||
| Goodwill and other intangible asset impairment |
— | — | — | (108.0 | ) | — | — | (108.0 | ) | |||||||||||||||||||
| Other, net |
(8.6 | ) | (0.3 | ) | (4.2 | ) | (1.1 | ) | 4.9 | — | (9.3 | ) | ||||||||||||||||
| Operating income (loss) |
(1.1 | ) | (9.6 | ) | (23.7 | ) | (82.7 | ) | (33.0 | ) | — | (150.1 | ) | |||||||||||||||
| Interest expense, net |
53.5 | |||||||||||||||||||||||||||
| Gain on hedging activities, net |
(111.8 | ) | ||||||||||||||||||||||||||
| Equity in net loss of investments in affiliates |
79.7 | |||||||||||||||||||||||||||
| Gain on debt repurchase |
(211.2 | ) | ||||||||||||||||||||||||||
| Gain on business combination |
(120.3 | ) | ||||||||||||||||||||||||||
| Total other income |
310.1 | |||||||||||||||||||||||||||
| Income before income taxes |
160.0 | |||||||||||||||||||||||||||
105
Table of Contents
NORANDA ALUMINUM HOLDING CORPORATION
NOTES TO CONSOLIDATED FINANCIAL STATEMENTS
| Year ended December 31, 2010 | ||||||||||||||||||||||||||||
| Bauxite | Alumina refining |
Primary aluminum products |
Flat rolled products |
Corporate | Eliminations | Consolidated | ||||||||||||||||||||||
| $ | $ | $ | $ | $ | $ | $ | ||||||||||||||||||||||
| Sales: |
||||||||||||||||||||||||||||
| External customers |
54.9 | 222.8 | 495.9 | 521.3 | — | — | 1,294.9 | |||||||||||||||||||||
| Intersegment |
65.5 | 142.6 | 125.4 | 0.1 | — | (333.6 | ) | — | ||||||||||||||||||||
| 120.4 | 365.4 | 621.3 | 521.4 | — | (333.6 | ) | 1,294.9 | |||||||||||||||||||||
| Segment profit (loss) |
23.8 | 61.9 | 112.2 | 50.0 | (26.9 | ) | (4.9 | ) | 216.1 | |||||||||||||||||||
| Depreciation and amortization |
9.6 | 19.3 | 48.3 | 20.5 | 1.0 | — | 98.7 | |||||||||||||||||||||
| Capital expenditures |
7.7 | 11.1 | 26.4 | 14.3 | 1.8 | — | 61.3 | |||||||||||||||||||||
| Year ended December 31, 2010 | ||||||||||||||||||||||||||||
| Bauxite | Alumina refining |
Primary aluminum products |
Flat rolled products |
Corporate | Eliminations | Consolidated | ||||||||||||||||||||||
| $ | $ | $ | $ | $ | $ | $ | ||||||||||||||||||||||
| Segment profit (loss) |
23.8 | 61.9 | 112.2 | 50.0 | (26.9 | ) | (4.9 | ) | 216.1 | |||||||||||||||||||
| Depreciation and amortization |
(9.6 | ) | (19.3 | ) | (48.3 | ) | (20.5 | ) | (1.0 | ) | — | (98.7 | ) | |||||||||||||||
| LIFO/LCM |
— | — | (6.1 | ) | 3.7 | — | 2.8 | 0.4 | ||||||||||||||||||||
| Loss on asset disposal |
— | — | (3.3 | ) | (0.6 | ) | (0.1 | ) | — | (4.0 | ) | |||||||||||||||||
| Non-cash pension, accretion and stock compensation |
(0.8 | ) | (1.1 | ) | (3.3 | ) | (2.4 | ) | (7.3 | ) | — | (14.9 | ) | |||||||||||||||
| Restructuring, relocation and severance |
(3.2 | ) | (1.5 | ) | (2.0 | ) | (1.5 | ) | (3.7 | ) | — | (11.9 | ) | |||||||||||||||
| Consulting and sponsor fees |
— | — | — | — | (18.9 | ) | — | (18.9 | ) | |||||||||||||||||||
| Cash settlements on hedging transactions |
— | — | 0.1 | (2.5 | ) | — | — | (2.4 | ) | |||||||||||||||||||
| Other, net |
0.1 | 1.1 | (0.1 | ) | — | 0.7 | — | 1.8 | ||||||||||||||||||||
| Operating income (loss) |
10.3 | 41.1 | 49.2 | 26.2 | (57.2 | ) | (2.1 | ) | 67.5 | |||||||||||||||||||
| Interest expense, net |
31.1 | |||||||||||||||||||||||||||
| Gain on hedging activities, net |
(65.6 | ) | ||||||||||||||||||||||||||
| Loss on debt repurchase |
0.1 | |||||||||||||||||||||||||||
| Total other income |
34.4 | |||||||||||||||||||||||||||
| Income before income taxes |
101.9 | |||||||||||||||||||||||||||
| As of December 31, | ||||||||
| 2009 | 2010 | |||||||
| Segment assets: |
$ | $ | ||||||
| Bauxite |
125.2 | 135.2 | ||||||
| Alumina refining |
237.9 | 229.2 | ||||||
| Primary aluminum products |
612.1 | 605.4 | ||||||
| Flat rolled products |
382.6 | 411.9 | ||||||
| Corporate |
373.6 | 74.3 | ||||||
| Eliminations |
(33.8 | ) | (41.3 | ) | ||||
| 1,697.6 | 1,414.7 | |||||||
106
Table of Contents
NORANDA ALUMINUM HOLDING CORPORATION
NOTES TO CONSOLIDATED FINANCIAL STATEMENTS
| 26. | SUBSIDIARY ISSUER OF GUARANTEED NOTES |
The following consolidating financial statements present separately the financial condition and results of operations and cash flows (condensed) for Noranda HoldCo (as parent guarantor), Noranda AcquisitionCo (as the issuer), the subsidiary guarantors, the subsidiary non-guarantors (NHB and St. Ann) and eliminations. These consolidating financial statements have been prepared and presented in accordance with SEC Regulation S-X Rule 3-10 “Financial Statements of Guarantors and Issuers of Guaranteed Securities Registered or Being Registered.”
As of December 31, 2009, NHB held an investment in HoldCo Notes totaling $105.7 million. During second quarter 2010, NHB delivered to Noranda HoldCo all of its investment in HoldCo Notes, which Noranda HoldCo immediately retired.
The accounting policies used in the preparation of these consolidating financial statements are consistent with those elsewhere in the consolidated financial statements. Intercompany transactions have been presented gross in the following consolidating financial statements; however these transactions eliminate in consolidation.
We have reduced the Parent guarantor’s and Issuer’s investments in affiliates as of December 31, 2009 by $6.0 million to remove the non-controlling interest which had been incorrectly included previously within investments in affiliates.
107
Table of Contents
NORANDA ALUMINUM HOLDING CORPORATION
NOTES TO CONSOLIDATED FINANCIAL STATEMENTS
NORANDA ALUMINUM HOLDING CORPORATION
Consolidating Balance Sheet
As of December 31, 2009
(in millions)
| Parent guarantor (Noranda HoldCo) |
Issuer (Noranda AcquisitionCo) |
Subsidiary guarantors |
Subsidiary non-guarantors |
Eliminations | Consolidated | |||||||||||||||||||
| $ | $ | $ | $ | $ | $ | |||||||||||||||||||
| Current assets: |
||||||||||||||||||||||||
| Cash and cash equivalents |
21.4 | 140.5 | 4.3 | 1.0 | — | 167.2 | ||||||||||||||||||
| Accounts receivable, net: |
||||||||||||||||||||||||
| Trade |
— | — | 82.0 | 3.5 | — | 85.5 | ||||||||||||||||||
| Affiliates |
— | 5.9 | — | 11.8 | (17.7 | ) | — | |||||||||||||||||
| Inventories, net, |
— | — | 155.7 | 26.7 | — | 182.4 | ||||||||||||||||||
| Derivative assets, net |
— | — | 68.8 | — | — | 68.8 | ||||||||||||||||||
| Taxes receivable |
— | — | 1.0 | (0.3 | ) | — | 0.7 | |||||||||||||||||
| Prepaid expenses |
0.2 | — | 22.5 | 11.8 | — | 34.5 | ||||||||||||||||||
| Other current assets |
— | 2.0 | 3.9 | 9.8 | — | 15.7 | ||||||||||||||||||
| Total current assets |
21.6 | 148.4 | 338.2 | 64.3 | (17.7 | ) | 554.8 | |||||||||||||||||
| Investments in affiliates |
272.8 | 1,285.4 | — | 105.7 | (1,663.9 | ) | — | |||||||||||||||||
| Advances due from affiliates |
— | 3.0 | 267.2 | 5.2 | (275.4 | ) | — | |||||||||||||||||
| Property, plant and equipment, net |
— | — | 692.6 | 52.9 | — | 745.5 | ||||||||||||||||||
| Goodwill |
— | — | 137.6 | — | — | 137.6 | ||||||||||||||||||
| Other intangible assets, net |
— | — | 79.0 | — | — | 79.0 | ||||||||||||||||||
| Long-term derivative assets, net |
— | — | 95.5 | — | — | 95.5 | ||||||||||||||||||
| Other assets |
0.6 | 17.3 | 57.8 | 9.5 | — | 85.2 | ||||||||||||||||||
| Total assets |
295.0 | 1,454.1 | 1,667.9 | 237.6 | (1,957.0 | ) | 1,697.6 | |||||||||||||||||
| Current liabilities: |
||||||||||||||||||||||||
| Accounts payable: |
||||||||||||||||||||||||
| Trade |
— | 2.0 | 64.4 | 3.5 | — | 69.9 | ||||||||||||||||||
| Affiliates |
1.4 | — | 10.4 | 5.9 | (17.7 | ) | — | |||||||||||||||||
| Accrued liabilities |
— | — | 45.8 | 16.2 | — | 62.0 | ||||||||||||||||||
| Accrued interest to third parties |
— | 0.2 | — | — | — | 0.2 | ||||||||||||||||||
| Deferred tax liabilities |
(6.5 | ) | (16.2 | ) | 45.4 | 4.6 | — | 27.3 | ||||||||||||||||
| Current portion of long-term debt |
— | 7.5 | — | — | — | 7.5 | ||||||||||||||||||
| Total current liabilities |
(5.1 | ) | (6.5 | ) | 166.0 | 30.2 | (17.7 | ) | 166.9 | |||||||||||||||
| Long-term debt, net |
221.4 | 880.6 | — | — | (157.8 | ) | 944.2 | |||||||||||||||||
| Pension and other post-retirement liabilities |
— | — | 100.1 | 6.3 | — | 106.4 | ||||||||||||||||||
| Other long-term liabilities |
0.7 | 2.4 | 39.9 | 12.5 | — | 55.5 | ||||||||||||||||||
| Advances due to affiliates |
2.9 | 272.4 | — | — | (275.3 | ) | — | |||||||||||||||||
| Deferred tax liabilities |
0.9 | 32.4 | 255.1 | 4.0 | 38.0 | 330.4 | ||||||||||||||||||
| Common stock subject to redemption |
2.0 | — | — | — | — | 2.0 | ||||||||||||||||||
| Shareholders’ equity: |
||||||||||||||||||||||||
| Common stock |
0.4 | — | — | — | — | 0.4 | ||||||||||||||||||
| Capital in excess of par value |
16.1 | 216.6 | 1,199.7 | 83.7 | (1,500.0 | ) | 16.1 | |||||||||||||||||
| Accumulated earnings (deficit) |
(142.0 | ) | (141.5 | ) | (240.6 | ) | 44.9 | 404.1 | (75.1 | ) | ||||||||||||||
| Accumulated other comprehensive income (loss) |
197.7 | 197.7 | 147.7 | 50.0 | (448.3 | ) | 144.8 | |||||||||||||||||
| Total Noranda shareholders’ equity |
72.2 | 272.8 | 1,106.8 | 178.6 | (1,554.2 | ) | 86.2 | |||||||||||||||||
| Non-controlling interest |
— | — | — | 6.0 | — | 6.0 | ||||||||||||||||||
| Total shareholders’ equity |
72.2 | 272.8 | 1,106.8 | 184.6 | (1,554.2 | ) | 92.2 | |||||||||||||||||
| Total liabilities and shareholders’ equity |
295.0 | 1,454.1 | 1,667.9 | 237.6 | (1,957.0 | ) | 1,697.6 | |||||||||||||||||
108
Table of Contents
NORANDA ALUMINUM HOLDING CORPORATION
NOTES TO CONSOLIDATED FINANCIAL STATEMENTS
NORANDA ALUMINUM HOLDING CORPORATION
Consolidating Balance Sheet
As of December 31, 2010
(in millions)
| Parent guarantor (Noranda HoldCo) |
Issuer (Noranda AcquisitionCo) |
Subsidiary guarantors |
Subsidiary non-guarantors |
Eliminations | Consolidated | |||||||||||||||||||
| $ | $ | $ | $ | $ | $ | |||||||||||||||||||
| Current assets: |
||||||||||||||||||||||||
| Cash and cash equivalents |
7.3 | 20.4 | 2.5 | 3.6 | — | 33.8 | ||||||||||||||||||
| Accounts receivable, net: |
||||||||||||||||||||||||
| Trade |
— | — | 128.1 | 3.5 | — | 131.6 | ||||||||||||||||||
| Affiliates |
21.4 | 11.9 | — | 14.4 | (47.7 | ) | — | |||||||||||||||||
| Inventories, net |
— | — | 176.0 | 27.2 | (2.1 | ) | 201.1 | |||||||||||||||||
| Prepaid expenses |
0.2 | — | 4.2 | 8.5 | — | 12.9 | ||||||||||||||||||
| Other current assets |
— | — | 12.5 | 6.7 | — | 19.2 | ||||||||||||||||||
| Total current assets |
28.9 | 32.3 | 323.3 | 63.9 | (49.8 | ) | 398.6 | |||||||||||||||||
| Investments in affiliates |
356.5 | 1,265.7 | — | — | (1,622.2 | ) | — | |||||||||||||||||
| Advances due from affiliates |
— | 19.3 | 516.7 | 63.5 | (599.5 | ) | — | |||||||||||||||||
| Property, plant and equipment, net |
— | — | 663.6 | 56.3 | — | 719.9 | ||||||||||||||||||
| Goodwill |
— | — | 137.6 | — | — | 137.6 | ||||||||||||||||||
| Other intangible assets, net |
— | — | 73.0 | — | — | 73.0 | ||||||||||||||||||
| Other assets |
— | 11.0 | 59.6 | 15.0 | — | 85.6 | ||||||||||||||||||
| Total assets |
385.4 | 1,328.3 | 1,773.8 | 198.7 | (2,271.5 | ) | 1,414.7 | |||||||||||||||||
| Current liabilities: |
||||||||||||||||||||||||
| Accounts payable: |
||||||||||||||||||||||||
| Trade |
0.1 | — | 88.1 | 7.5 | — | 95.7 | ||||||||||||||||||
| Affiliates |
— | 21.3 | 14.4 | 12.0 | (47.7 | ) | — | |||||||||||||||||
| Accrued liabilities |
— | — | 38.1 | 16.5 | — | 54.6 | ||||||||||||||||||
| Accrued interest to third parties |
— | 0.3 | — | — | — | 0.3 | ||||||||||||||||||
| Taxes payable |
(23.0 | ) | (27.4 | ) | 55.6 | 0.3 | (0.7 | ) | 4.8 | |||||||||||||||
| Derivative liabilities |
— | — | 23.2 | — | — | 23.2 | ||||||||||||||||||
| Deferred tax liabilities |
0.1 | — | 48.4 | — | — | 48.5 | ||||||||||||||||||
| Total current liabilities |
(22.8 | ) | (5.8 | ) | 267.8 | 36.3 | (48.4 | ) | 227.1 | |||||||||||||||
| Long-term debt, net |
— | 419.7 | — | — | — | 419.7 | ||||||||||||||||||
| Long-term derivative liabilities |
— | — | 18.4 | — | — | 18.4 | ||||||||||||||||||
| Pension and other post-retirement liabilities |
— | — | 105.3 | 10.7 | — | 116.0 | ||||||||||||||||||
| Other long-term liabilities |
0.1 | 2.3 | 44.3 | 11.2 | — | 57.9 | ||||||||||||||||||
| Advances due to affiliates |
78.0 | 521.5 | — | — | (599.5 | ) | — | |||||||||||||||||
| Deferred tax liabilities |
38.4 | 34.1 | 204.8 | 2.0 | (1.4 | ) | 277.9 | |||||||||||||||||
| Common stock subject to redemption |
2.0 | — | — | — | — | 2.0 | ||||||||||||||||||
| Shareholders’ equity: |
— | |||||||||||||||||||||||
| Common stock |
0.7 | — | — | — | — | 0.7 | ||||||||||||||||||
| Capital in excess of par value |
227.7 | 352.1 | 1,199.7 | 83.7 | (1,635.5 | ) | 227.7 | |||||||||||||||||
| Accumulated deficit |
(8.2 | ) | (65.1 | ) | (142.2 | ) | 55.1 | 152.2 | (8.2 | ) | ||||||||||||||
| Accumulated other comprehensive income (loss) |
69.5 | 69.5 | 75.7 | (6.3 | ) | (138.9 | ) | 69.5 | ||||||||||||||||
| Total Noranda shareholders’ equity |
289.7 | 356.5 | 1,133.2 | 132.5 | (1,622.2 | ) | 289.7 | |||||||||||||||||
| Non-controlling interest |
— | — | — | 6.0 | — | 6.0 | ||||||||||||||||||
| Total shareholders’ equity |
289.7 | 356.5 | 1,133.2 | 138.5 | (1,622.2 | ) | 295.7 | |||||||||||||||||
| Total liabilities and shareholders’ equity |
385.4 | 1,328.3 | 1,773.8 | 198.7 | (2,271.5 | ) | 1,414.7 | |||||||||||||||||
109
Table of Contents
NORANDA ALUMINUM HOLDING CORPORATION
NOTES TO CONSOLIDATED FINANCIAL STATEMENTS
NORANDA ALUMINUM HOLDING CORPORATION
Consolidating Statement of Operations
Year ended December 31, 2009
(in millions)
| Parent guarantor (Noranda HoldCo) |
Issuer (Noranda AcquisitionCo) |
Subsidiary guarantors |
Subsidiary non-guarantors |
Eliminations | Consolidated | |||||||||||||||||||
| $ | $ | $ | $ | $ | $ | |||||||||||||||||||
| Sales |
— | — | 755.3 | 34.6 | (20.0 | ) | 769.9 | |||||||||||||||||
| Operating costs and expenses: |
||||||||||||||||||||||||
| Cost of sales |
— | — | 767.0 | 32.9 | (20.0 | ) | 779.9 | |||||||||||||||||
| Selling, general and administrative expenses |
3.2 | 2.5 | 67.0 | 2.9 | — | 75.6 | ||||||||||||||||||
| Goodwill and other intangible asset impairment |
— | — | 108.0 | — | — | 108.0 | ||||||||||||||||||
| Excess insurance proceeds |
— | — | (43.5 | ) | — | — | (43.5 | ) | ||||||||||||||||
| 3.2 | 2.5 | 898.5 | 35.8 | (20.0 | ) | 920.0 | ||||||||||||||||||
| Operating income (loss) |
(3.2 | ) | (2.5 | ) | (143.2 | ) | (1.2 | ) | — | (150.1 | ) | |||||||||||||
| Other (income) expense: |
||||||||||||||||||||||||
| Interest expense (income), net |
18.1 | 48.2 | 0.3 | (13.1 | ) | — | 53.5 | |||||||||||||||||
| Gain on hedging activities, net |
— | — | (111.8 | ) | — | — | (111.8 | ) | ||||||||||||||||
| Equity in net loss of investments in affiliates |
— | — | 79.7 | — | — | 79.7 | ||||||||||||||||||
| Gain on debt repurchase |
(116.1 | ) | (95.1 | ) | — | — | — | (211.2 | ) | |||||||||||||||
| Gain on business combination |
— | — | (83.3 | ) | (37.0 | ) | — | (120.3 | ) | |||||||||||||||
| (98.0 | ) | (46.9 | ) | (115.1 | ) | (50.1 | ) | — | (310.1 | ) | ||||||||||||||
| Income (loss) before income taxes |
94.8 | 44.4 | (28.1 | ) | 48.9 | — | 160.0 | |||||||||||||||||
| Income tax expense |
33.6 | 16.7 | 4.3 | 4.0 | — | 58.6 | ||||||||||||||||||
| Equity in net income (loss) of subsidiaries |
40.2 | 12.5 | — | — | (52.7 | ) | — | |||||||||||||||||
| Net income (loss) |
101.4 | 40.2 | (32.4 | ) | 44.9 | (52.7 | ) | 101.4 | ||||||||||||||||
NORANDA ALUMINUM HOLDING CORPORATION
Consolidating Statement of Operations
Year ended December 31, 2010
(in millions)
| Parent guarantor (Noranda HoldCo) |
Issuer (Noranda AcquisitionCo) |
Subsidiary guarantors |
Subsidiary non-guarantors |
Eliminations | Consolidated | |||||||||||||||||||
| $ | $ | $ | $ | $ | $ | |||||||||||||||||||
| Sales |
— | — | 1,240.0 | 120.4 | (65.5 | ) | 1,294.9 | |||||||||||||||||
| Operating costs and expenses: |
||||||||||||||||||||||||
| Cost of sales |
— | — | 1,084.9 | 94.0 | (65.5 | ) | 1,113.4 | |||||||||||||||||
| Selling, general and administrative expenses |
7.3 | 18.7 | 72.0 | 16.0 | — | 114.0 | ||||||||||||||||||
| 7.3 | 18.7 | 1,156.9 | 110.0 | (65.5 | ) | 1,227.4 | ||||||||||||||||||
| Operating income (loss) |
(7.3 | ) | (18.7 | ) | 83.1 | 10.4 | — | 67.5 | ||||||||||||||||
| Other (income) expense: |
— | |||||||||||||||||||||||
| Interest expense (income), net |
6.0 | 29.0 | 0.2 | (4.1 | ) | — | 31.1 | |||||||||||||||||
| Gain on hedging activities, net |
— | — | (65.6 | ) | — | — | (65.6 | ) | ||||||||||||||||
| (Gain) loss on debt repurchase |
1.0 | (0.9 | ) | — | — | — | 0.1 | |||||||||||||||||
| 7.0 | 28.1 | (65.4 | ) | (4.1 | ) | — | (34.4 | ) | ||||||||||||||||
| Income (loss) before income taxes |
(14.3 | ) | (46.8 | ) | 148.5 | 14.5 | — | 101.9 | ||||||||||||||||
| Income tax (benefit) expense |
(5.1 | ) | (15.7 | ) | 51.5 | 4.3 | — | 35.0 | ||||||||||||||||
| Equity in net income (loss) of subsidiaries |
76.1 | 107.2 | — | — | (183.3 | ) | — | |||||||||||||||||
| Net income (loss) |
66.9 | 76.1 | 97.0 | 10.2 | (183.3 | ) | 66.9 | |||||||||||||||||
110
Table of Contents
NORANDA ALUMINUM HOLDING CORPORATION
NOTES TO CONSOLIDATED FINANCIAL STATEMENTS
NORANDA ALUMINUM HOLDING CORPORATION
Condensed Consolidating Statement of Cash Flows
Year ended December 31, 2009
(in millions)
| Parent guarantor (Noranda HoldCo) |
Issuer (Noranda AcquisitionCo) |
Subsidiary guarantors |
Subsidiary non-guarantors |
Eliminations | Consolidated | |||||||||||||||||||
| $ | $ | $ | $ | $ | $ | |||||||||||||||||||
| OPERATING ACTIVITIES |
||||||||||||||||||||||||
| Cash provided by (used in) operating activities |
(4.7 | ) | 229.7 | 37.2 | (41.0 | ) | (0.7 | ) | 220.5 | |||||||||||||||
| INVESTING ACTIVITIES |
||||||||||||||||||||||||
| Capital expenditures |
— | — | (45.1 | ) | (1.6 | ) | — | (46.7 | ) | |||||||||||||||
| Purchase of debt |
— | — | (40.3 | ) | 40.3 | — | ||||||||||||||||||
| Proceeds from insurance related to capital expenditures |
— | — | 11.5 | — | — | 11.5 | ||||||||||||||||||
| Proceeds from sale of property, plant and equipment |
— | — | 0.1 | — | — | 0.1 | ||||||||||||||||||
| Cash acquired in business combination |
— | 11.1 | — | — | — | 11.1 | ||||||||||||||||||
| Cash provided by (used in) investing activities |
— | 11.1 | (33.5 | ) | (41.9 | ) | 40.3 | (24.0 | ) | |||||||||||||||
| FINANCING ACTIVITIES |
||||||||||||||||||||||||
| Proceeds from issuance of common shares |
0.3 | — | — | — | — | 0.3 | ||||||||||||||||||
| Repurchase of common shares |
(0.1 | ) | — | — | — | — | (0.1 | ) | ||||||||||||||||
| Borrowings on revolving credit facility |
— | 13.0 | — | — | — | 13.0 | ||||||||||||||||||
| Repayments on revolving credit facility |
— | (15.5 | ) | — | — | — | (15.5 | ) | ||||||||||||||||
| Repayment of debt |
(2.7 | ) | (169.4 | ) | — | — | (39.6 | ) | (211.7 | ) | ||||||||||||||
| Intercompany advances |
3.0 | (3.2 | ) | — | 0.2 | — | — | |||||||||||||||||
| Capital contribution (to subsidiary) from parent |
— | (83.7 | ) | — | 83.7 | — | — | |||||||||||||||||
| Distribution (to parent) from subsidiary |
1.5 | (1.5 | ) | — | — | — | — | |||||||||||||||||
| Cash provided by (used in) financing activities |
2.0 | (260.3 | ) | — | 83.9 | (39.6 | ) | (214.0 | ) | |||||||||||||||
| Change in cash and cash equivalents |
(2.7 | ) | (19.5 | ) | 3.7 | 1.0 | — | (17.5 | ) | |||||||||||||||
| Cash and cash equivalents, beginning of period |
24.1 | 160.0 | 0.6 | — | — | 184.7 | ||||||||||||||||||
| Cash and cash equivalents, end of period |
21.4 | 140.5 | 4.3 | 1.0 | — | 167.2 | ||||||||||||||||||
111
Table of Contents
NORANDA ALUMINUM HOLDING CORPORATION
NOTES TO CONSOLIDATED FINANCIAL STATEMENTS
NORANDA ALUMINUM HOLDING CORPORATION
Condensed Consolidating Statement of Cash Flows
Year ended December 31, 2010
(in millions)
| Parent guarantor (Noranda HoldCo) |
Issuer (Noranda AcquisitionCo) |
Subsidiary guarantors |
Subsidiary non-guarantors |
Eliminations | Consolidated | |||||||||||||||||||
| $ | $ | $ | $ | $ | $ | |||||||||||||||||||
| OPERATING ACTIVITIES |
||||||||||||||||||||||||
| Cash provided by (used in) operating activities |
(154.7 | ) | 363.7 | 51.7 | 10.2 | — | 270.9 | |||||||||||||||||
| INVESTING ACTIVITIES |
||||||||||||||||||||||||
| Capital expenditures |
— | — | (53.6 | ) | (7.7 | ) | — | (61.3 | ) | |||||||||||||||
| Proceeds from sale of property, plant and equipment |
— | — | 0.1 | 0.1 | — | 0.2 | ||||||||||||||||||
| Cash used in investing activities |
— | — | (53.5 | ) | (7.6 | ) | — | (61.1 | ) | |||||||||||||||
| FINANCING ACTIVITIES |
||||||||||||||||||||||||
| Proceeds from issuance of common shares |
206.0 | — | — | — | — | 206.0 | ||||||||||||||||||
| Repayments on revolving credit facility |
— | (215.9 | ) | — | — | — | (215.9 | ) | ||||||||||||||||
| Repayment of long-term debt |
(66.3 | ) | (267.0 | ) | — | — | — | (333.3 | ) | |||||||||||||||
| Distribution (to parent) from subsidiary |
0.9 | (0.9 | ) | — | — | — | — | |||||||||||||||||
| Cash provided by (used in) financing activities |
140.6 | (483.8 | ) | — | — | — | (343.2 | ) | ||||||||||||||||
| Change in cash and cash equivalents |
(14.1 | ) | (120.1 | ) | (1.8 | ) | 2.6 | — | (133.4 | ) | ||||||||||||||
| Cash and cash equivalents, beginning of period |
21.4 | 140.5 | 4.3 | 1.0 | — | 167.2 | ||||||||||||||||||
| Cash and cash equivalents, end of period |
7.3 | 20.4 | 2.5 | 3.6 | — | 33.8 | ||||||||||||||||||
112
Table of Contents
| ITEM 9. | CHANGES IN AND DISAGREEMENTS WITH ACCOUNTANTS ON ACCOUNTING AND FINANCIAL DISCLOSURE |
Not applicable.
| ITEM 9A. | CONTROLS AND PROCEDURES |
Evaluation of Disclosure Controls and Procedures
We maintain a system of disclosure controls and procedures that are designed to provide reasonable assurance that information, which is required to be timely, disclosed, is accumulated and communicated to management in a timely fashion. In designing and evaluating such controls and procedures, we recognize that any controls and procedures, no matter how well designed and operated, can provide only reasonable assurance of achieving the desired control objectives. Our management is necessarily required to use judgment in evaluating controls and procedures. In the ordinary course of business, we review our system of internal control over financial reporting and make changes to our systems and processes to improve such controls and increase efficiency, while ensuring that we maintain an effective internal control environment. Changes may include such activities as implementing new, more efficient systems and automating manual processes.
An evaluation of the effectiveness of the design and operation of our disclosure controls and procedures was performed as of the end of the period covered by this report. This evaluation was performed under the supervision and with the participation of management, including our Chief Executive Officer and Chief Financial Officer. Based upon that evaluation, our Chief Executive Officer and Chief Financial Officer concluded that our disclosure controls and procedures are effective to provide reasonable assurance that information required to be disclosed by the Company in the reports that it files or submits under the Securities Exchange Act of 1934, as amended, is accumulated and communicated to management, including our Chief Executive Officer and Chief Financial Officer, as appropriate, to allow timely decisions regarding required disclosure and are effective to provide reasonable assurance that such information is recorded, processed, summarized and reported within the time periods specified by the SEC’s rules and forms.
Management’s Report On Internal Control Over Financial Reporting
Management’s report on internal control over financial reporting and the attestation report of Ernst & Young LLP, the Company’s independent registered public accounting firm, on the Company’s internal control over financial reporting are included on pages 58 and 60 of this Form 10-K.
Changes In Internal Control Over Financial Reporting
There has been no change in the Company’s internal control over financial reporting that occurred during the fiscal quarter ended December 31, 2010, that has materially affected, or is reasonably likely to materially affect, the Company’s internal control over financial reporting.
| ITEM 9B. | OTHER INFORMATION |
None.
113
Table of Contents
| ITEM 10. | DIRECTORS, EXECUTIVE OFFICERS AND CORPORATE GOVERNANCE |
Listed below are the names, ages and positions held by each of our executive officers and our Directors
| Name |
Age | Position | ||
| Layle K. Smith |
56 | President, Chief Executive Officer and Director | ||
| Robert B. Mahoney |
57 | Chief Financial Officer | ||
| Gail E. Lehman |
51 | Vice President of Human Resources, General Counsel and Corporate Secretary | ||
| Scott M. Croft |
47 | President of Norandal USA, Inc. | ||
| Peter Hartland |
53 | President of the Upstream Business | ||
| M. Ali Rashid |
34 | Director | ||
| William H. Brooks |
68 | Director and Chairman of the Board | ||
| Matthew R. Michelini |
29 | Director | ||
| Thomas R. Miklich |
63 | Director | ||
| Richard B. Evans |
63 | Director | ||
| Scott Kleinman |
38 | Director | ||
| Alan H. Schumacher |
64 | Director | ||
| Gareth Turner |
47 | Director | ||
| Robert Kasdin |
52 | Director | ||
| Matthew H. Nord |
31 | Director | ||
| Eric L. Press |
45 | Director |
All executive officers serve at the discretion of the Board of Directors.
Layle K. Smith has been our President and Chief Executive Officer and a director since March 2008. From April 2007 to December 2007, Mr. Smith held the position of Executive Director with the Berry Plastics Corporation. He was Chief Executive Officer and a member of the Board of Directors of Covalence Specialty Materials Corporation from June 2006 until it merged under common Apollo control with Berry Plastics Corporation in April 2007. In his role as Chief Executive Officer of Covalence, Mr. Smith was responsible for the executive leadership of the company, including accountability for achieving overall financial results. After its merger with Berry Plastics Corporation, Covalence was operated as a division of Berry Plastics, and Mr. Smith continued to be responsible for financial results as Executive Director of Berry Plastics. Mr. Smith was President and Chief Operating Officer of Resolution Performance Products LLC, an Apollo portfolio company, from September 2004 until that company merged under common Apollo control with Hexion Specialty Chemicals Inc. in May 2005. Mr. Smith served as a Divisional President at Hexion until his departure in June 2006. From February 2002 to February 2004, Mr. Smith was Chief Executive Officer and Director of NxtPhase Corporation, a manufacturer of high voltage digital optical sensors, relays and recorders. A receiver was appointed for NxtPhase in 2004. In his senior management roles, Mr. Smith was responsible for the executive management and operations of the company, including responsibility for achieving overall financial results. Previously, Mr. Smith held positions at Ballard Power Systems and The Dow Chemical Company. Mr. Smith graduated in 1981 from Harvard University with an MBA and in 1977 with a BA in Chemistry.
Mr. Smith’s intimate knowledge of our company, gained through his tenure as our Chief Executive Officer, coupled with his extensive management experience, enables him to provide important insights to our Board of Directors regarding our operations, including finance, production, marketing, strategic planning and risk assessment.
Robert B. Mahoney has been our Chief Financial Officer since May 2009. Prior to joining our Company, he most recently was Chief Executive Officer of Hi-P International Limited in Shanghai China, a publicly traded (Singapore Exchange Ltd.) supplier of plastic injection components and stamped parts, from 2007 to 2009. From 1995 to 2007, Mr. Mahoney was employed by Molex Inc. in a number of operating and financial positions. He was Chief Financial Officer of Molex from 1996 through 2003 and Executive Vice President and President of Molex Asia from 2003 through 2007. Mr. Mahoney received a BA in Economics and History from the University of Virginia and an MBA from the Graduate School of Business Administration at the University of Michigan.
Gail E. Lehman has been our General Counsel and Corporate Secretary since January 2010. In February, 2011, Ms. Lehman also assumed the role of Vice President of Human Resources. Prior to joining our company, she most recently was Vice President, General Counsel and Corporate Secretary of Hawker Beechcraft Corporation, a manufacturer of general aviation aircraft in Wichita, Kansas, from July 2007 until August 2008. From April 2006 until May 2007, Ms. Lehman served as Vice President, General Counsel and Corporate Secretary of Covalence Specialty Materials Corporation. From November 2001 through April 2006, Ms. Lehman was the Assistant General Counsel, Treasury and Finance, and Assistant Secretary for Honeywell International Inc. From 1993 through November 2001, Ms. Lehman held various positions of increasing responsibility in the Law Department of Honeywell International Inc. and its predecessor, AlliedSignal Inc. Before joining AlliedSignal, Ms. Lehman was an associate with the law firm of Lowenstein,
114
Table of Contents
Sandler in Roseland, New Jersey. Ms. Lehman holds a BA and M.Ed. from Rutgers University and a JD from Rutgers Law School in Newark, New Jersey.
Scott M. Croft has been President of the Rolling Mills division since 2006 and has been the President and a director of Norandal USA, Inc., our wholly owned subsidiary, since March 2006. His previous assignments with our predecessors include Site Manager of our Huntingdon, Tennessee facilities from 2002 to 2006, Director of Foil Operations from 2001 to 2002, Plant Manager at our Salisbury, North Carolina facility from 1995 to 2000 and Production Manager at Huntingdon, Tennessee from 1993 to 1995. Mr. Croft holds a BS in Metallurgical Engineering from the University of Pittsburgh and an MBA from Syracuse University.
Peter J. Hartland has been President of the Noranda Upstream division since December 2010. Prior to joining our Company Mr. Hartland had 25 years of combined service with Hexion Specialty Chemicals Inc. and one of its predecessor companies, Borden Chemicals Inc. Mr. Hartland served as President of the Coatings and Inks division of Hexion during 2009 and as Vice President of Hexion’s Global Phenolic Resins business from 2005 to 2006. Prior to 2005, Mr. Hartland served as European Managing Director, for Borden Chemicals’ European operations, based in the United Kingdom, from 2001 to 2005. Mr. Hartland is an industrial chemist by training.
M. Ali Rashid became a director in May 2007. Mr. Rashid is a partner of Apollo. He has been employed with Apollo since 2000. Prior to that time, Mr. Rashid was employed by the Goldman Sachs Group in the Financial Institutions Group of its Investment Banking Division. Mr. Rashid serves on the board of directors of Metals USA Holdings Corp., Quality Distribution, Inc. and Realogy Corporation. Mr. Rashid received an MBA from the Stanford Graduate School of Business and graduated Magna Cum Laude and Beta Gamma Sigma from Georgetown University with a BS in Business Administration.
Mr. Rashid has over eight years experience in financing, analyzing and investing in public and private companies. He has participated in numerous transactions across various segments of the metals industry and, as a result, has developed significant skill in identifying opportunities for, negotiating, and managing private equity investments in this industry. He worked with the Apollo diligence team for the acquisition of our business and has worked closely with our management following the acquisition.
William H. Brooks has been a director since July 2007 and Chairman of the Board of Noranda HoldCo since March 2008. Mr. Brooks was the President and Chief Executive Officer of Noranda HoldCo from May 2007 until he retired in March 2008. Prior to serving as our President and Chief Executive Officer, he was President of the Aluminum Business, President of the Rolling Mills Division, President of Primary Products Division and Plant Manager at our Huntingdon, Tennessee facility East and West. Mr. Brooks has 30 years of experience in the aluminum industry, including 22 years with Noranda Aluminum. Mr. Brooks holds a BS in Business from Cleveland State University and an MBA from the University of Tennessee. He is a Certified Public Accountant.
Having served as our former Chief Executive Officer and in a variety of senior management positions within our company, Mr. Brooks has extensive knowledge of all facets of our day-to-day operations. In addition, he has acquired a wealth of knowledge from over 30 years of experience in the aluminum industry, enabling him to provide important insights in evaluating our priorities and challenges.
Matthew R. Michelini has been a director of Noranda HoldCo since March 2007. Mr. Michelini joined Apollo in 2006. Prior to joining Apollo, Mr. Michelini was a member of the mergers and acquisitions group of Lazard Frères & Co. from 2004 to 2006. Mr. Michelini also serves on the board of directors of Metals USA Holdings Corp. and Athene Holding Ltd. Mr. Michelini graduated from Princeton University with a BS in Mathematics and a Certificate in Finance.
Mr. Michelini has significant experience identifying opportunities for, negotiating, and managing private equity investments on behalf of Apollo, and has over five years of experience financing, analyzing and investing in public and private companies. He has worked with an Apollo diligence team on several potential transactions in the metals and mining sector, including the acquisition of our business. In addition, he is also on the Apollo team responsible for monitoring other Apollo sponsored metals and mining companies, and in this role he works closely with our management.
Thomas R. Miklich has been a director since January 2008. He has been Vice President and Chief Financial Officer of Ferro Corporation since July 2010. He was a director, from 2002 to 2007, and Chief Financial Officer, from 2005 to 2007, of Titan Technology, Inc., a private IT consulting and outsourcing company. Mr. Miklich also was a director, from 1994 to 2002, and Chief Financial Officer, from 2002 to 2004, of OM Group, Inc., a specialty chemical company. He also served as Chief Financial Officer for The Sherwin-Williams Company from 1986 to 1991, and Chief Financial Officer of Invacare Corporation from 1993 to 2002. Mr. Miklich also is a director of Quality Distribution, Inc., and served as a director of United Agri Products from 2005 to 2007, as well as Chairman of United Agri Products Audit Committee.
Mr. Miklich’s extensive financial and legal experience enables him to provide to our Board of Directors valuable insights with regard to financial and legal issues, and also makes him a valued member of the Audit Committee.
Richard B. Evans became a director in March 2010. He is currently Non-Executive Chairman of AbitibiBowater, a forest products company based in Montreal, and an independent director of CGI, an IT consulting and outsourcing company. He retired in April 2009 as an Executive Director of London-based Rio Tinto plc and Melbourne-based Rio Tinto Ltd., and as Chief Executive
115
Table of Contents
Officer of Rio Tinto Alcan, a wholly-owned subsidiary of Rio Tinto and the world’s leading producer of aluminum. Previously, Mr. Evans was President and Chief Executive Officer of Montreal-based Alcan Inc. from March 2006 to October 2007 and led the negotiation of the acquisition of Alcan by Rio Tinto in October 2007. He was Alcan’s Executive Vice President and Chief Operating Officer from September 2005 to March 2006. Prior to joining Alcan in 1997, he held various senior management positions with the Kaiser Aluminum and Chemical Company during his 27 years with that company. Mr. Evans also is currently an Executive in Residence and Advisory Board member at the McGill University Faculty of Business, and is a member of the Advisory Board of the Global Economic Symposium based in Kiel, Germany. He is a past Chairman of the International Aluminum Institute (IAI) and is a past Chairman of the Washington, DC-based U.S. Aluminum Association. He previously served as Co-Chairman of the Environmental and Climate Change Committee of the Canadian Council of Chief Executives and as a member of the Board of USCAP, a Washington, DC-based coalition concerned with climate change.
Mr. Evans’ 40 years in the aluminum industry has provided him with extensive experience in executive management, including experience in engineering, operations, sales and strategy. His industry-specific knowledge, enhanced by his global perspective with respect to the aluminum market gained as a board member of the IAI, enables him to provide valuable insights to management and to the Board with respect to both global and domestic aspects of the aluminum industry. Moreover, Mr. Evans’ financial experience in his past management positions make him well qualified to serve on the Audit Committee.
Scott Kleinman has been a director since December 2007. Mr. Kleinman is a partner at Apollo, where he has worked since February 1996. Prior to that time, Mr. Kleinman was employed by Smith Barney Inc. in its Investment Banking division. Mr. Kleinman is also a director of Momentive Performance Materials, Inc., Realogy Corporation and Verso Paper Corp and serves on the board of LyondellBasell Industries NV. Mr. Kleinman received a BA from the University of Pennsylvania and a BS from the Wharton School of Business where he graduated magna cum laude and Phi Beta Kappa respectively.
Mr. Kleinman brings to Noranda his experience in identifying opportunities for, negotiating, and managing private equity investments on behalf of Apollo. He has led various diligence teams and overseen Apollo’s investments in several industrial and commodity companies, and has spent significant time advising corporate managers in his capacity as a director of Apollo-controlled companies. He also has over 16 years of experience financing, analyzing and investing in public and private companies.
Alan H. Schumacher has been a director since January 2008. From 1977 to 2000, Mr. Schumacher served in various financial positions at American National Can Group, Inc. and its subsidiary, American National Can Company, most recently serving as Executive Vice President and Chief Financial Officer of American National Can Group, Inc. Mr. Schumacher is currently a member of the Federal Accounting Standards Advisory Board. He is a director of BlueLinx Holdings, Inc., Quality Distribution, Inc., EAF, LLC, School Bus Holdings, Inc. and North American Bus Industries.
Mr. Schumacher’s past service as the Chief Financial Officer of American National Can Group, Inc., in addition to various other financial positions with that company, and his membership on the Federal Accounting Standards Advisory Board, enables him to provide important insights to our Board of Directors on matters affecting finance and accounting, strategic planning and risk management, and makes him well-qualified to serve as Chairman of the Audit Committee.
Gareth Turner has been a director since May 2007. Mr. Turner joined Apollo in 2005 and is based in London. From 1997 to 2005, Mr. Turner was employed by Goldman Sachs as a Managing Director in its investment banking group and in this capacity was based in London from 2003 to 2005, Mr. Turner was head of the Goldman Sachs Global Metals and Mining Group and managed the firm’s investment banking relationships with major companies in the metals and mining sector. He has a broad range of experience in both capital markets and mergers and acquisitions transactions. Prior to joining Goldman Sachs, Mr. Turner was employed at Lehman Brothers from 1992 to 1997. He also worked for Salomon Brothers from 1991 to 1992 and RBC Dominion Securities from 1986 to 1989. Mr. Turner serves on the board of directors of CEVA Group plc and serves as a director on the board of Monier Holdings GP S.A. Mr. Turner received an MBA, with distinction, from the University of Western Ontario in 1991 and a BA from the University of Toronto in 1986.
Mr. Turner has been actively involved in the aluminum sector as an advisor to many of the major aluminum and mining companies during his career and has over 20 years experience in financing, analyzing and investing in public and private companies, including many in the metals and mining sector. He also has managed private equity investments for Apollo. Moreover, his expertise has been enhanced by his London-based activities, as London is an important financial center for the metals industry. Mr. Turner assists our company in the evaluation of strategic alternatives and provides valuable insights to our Board of Directors on various capital markets issues. Mr. Turner worked with the Apollo diligence team for the acquisition of our company’s business and has worked closely with our management following the acquisition.
Robert Kasdin has been a director since February 2008. Mr. Kasdin has been Senior Executive Vice President of Columbia University since September 2002. Prior to joining Columbia University, he served as the Executive Vice President and Chief Financial Officer of the University of Michigan, Treasurer and Chief Investment Officer for The Metropolitan Museum of Art in New York City, and Vice President and General Counsel for Princeton University Investment Company. Mr. Kasdin started his career as a corporate attorney at Davis Polk & Wardwell. He is a trustee of the National September 11 Memorial and Museum. Mr. Kasdin earned his AB from Princeton and his JD from Harvard Law School.
116
Table of Contents
In his current role at Columbia University as well as in prior professional positions, Mr. Kasdin has been responsible for leading large-scale, complex organizations. His experience enables him to provide helpful insights to the Board of Directors on a variety of matters, including budgeting, strategic planning and compliance.
Matthew H. Nord has been a director since March 2007. Mr. Nord is a principal of Apollo and has been associated with Apollo since 2003. From 2001 to 2003, Mr. Nord was a member of the Investment Banking division of Salomon Smith Barney Inc. Mr. Nord serves on the board of directors of Affinion Group Inc., Hughes Telematics, Inc. and SOURCECORP, Inc. Mr. Nord received a BS in Economics from the Wharton School of the University of Pennsylvania.
Mr. Nord has over nine years experience in financing, analyzing and investing in public and private companies, including significant experience making and managing private equity investments on behalf of Apollo. He has worked on numerous metals industry transactions at Apollo, particularly in the aluminum sector. Together with Mr. Press, he led the Apollo diligence team for the acquisition of our business and has worked closely with our management since the acquisition.
Eric L. Press has been a director since March 2007. Mr. Press is a partner of Apollo and has been associated with Apollo since 1998. Prior to joining Apollo, Mr. Press was associated with the law firm of Wachtell, Lipton, Rosen & Katz, specializing in mergers, acquisitions, restructurings and related financing transactions. From 1987 to 1989, Mr. Press was a consultant with The Boston Consulting Group, a management consulting firm focused on corporate strategy. Mr. Press has been engaged in a broad range of Apollo’s lodging, leisure and entertainment investment activities, as well as Apollo’s investments in basic industries and financial services. Mr. Press serves on the boards of directors of Apollo Commercial Real Estate Finance, Inc., Athene Re, Prestige Cruise Holdings, Affinion Group, Metals USA Holdings Corp., Harrah’s Entertainment, Inc. and Verso Paper Corp. Mr. Press graduated magna cum laude from Harvard College with an AB in Economics, and from Yale Law School, where he was a Senior Editor of the Yale Law Review.
Mr. Press has approximately 20 years of experience in the process of financing, analyzing, investing in and advising public and private companies and their boards of directors. He is one of the leaders of Apollo’s private equity investments in Metals and Mining and has considerable experience making and managing private equity investments on behalf of Apollo. Together with Mr. Nord, he led the Apollo diligence team for the acquisition of our Company’s business and has worked closely with our management since the acquisition.
Corporate Governance
Election of Directors. During the fiscal year ended December 31, 2010, there were not any material changes to the procedures by which securityholders may recommend nominees to the Company’s Board of Directors. Procedures for nominating and electing Directors are described below.
Our amended and restated certificate of incorporation provides for the division of the Board of Directors into three classes, with the directors in each class serving for a term of three years. At the Annual Meeting, four directors will be elected to serve until the 2014 Annual Meeting and until their successors are elected and qualified. All nominees currently are members of the Board.
Under the amended and restated securityholders agreement among Noranda HoldCo, Apollo and management employees who hold our common stock or options to acquire our common stock, except as otherwise required by applicable law, if Apollo continues to hold (1) at least 30 percent but less than 50 percent of our outstanding common stock, it will have the right to designate at least six director nominees; (2) at least 20 percent but less than 30 percent of our outstanding common stock, it will have the right to designate at least five director nominees; and (3) at least 10 percent but less than 20 percent of our outstanding common stock, it will have the right to designate at least four director nominees. The number of director nominees Apollo has a right to designate based on the share ownership levels described above will decrease to at least four, three and two, respectively, if the Board of Directors decreases the size of the Board of Directors to nine or fewer directors. Once Apollo owns less than 10 percent of our outstanding common stock, it will no longer have any right to designate directors. Except as otherwise required by applicable law, Apollo will have the right to designate a replacement to fill a vacancy on Noranda HoldCo’s Board of Directors caused by the departure of a director who was designated by Apollo.
In considering individuals, other than affiliates of Apollo, as designees recommended for nomination as directors, our Nominating and Governance Committee seeks persons who collectively possess the range of attributes described below under ‘Corporate Governance - Governance and Nominating Committee.” The Governance and Nominating Committee and the Board believe that the nominees listed below collectively possess these attributes, which, together with the respective experience and attributes of our directors described in the biographical summaries below, make each of our directors well qualified to serve on our Board.
We do not anticipate that any of the nominees will become unavailable to serve as a director for any reason, but if they became unavailable, the persons named in the enclosed form of proxy will vote for any substitute nominee designated by the Board of Directors, unless the Board of Directors determines to reduce the number of directors in the relevant class. Information concerning the nominees and the continuing members of the Board of Directors is provided below:
117
Table of Contents
Audit Committee. The Audit Committee oversees risk policies and processes relating to the financial statements and financial reporting processes, as well as internal controls, key credit risks, liquidity risks, market risks and compliance, and the guidelines, policies and processes for monitoring and mitigating those risks. At least two times a year, the Audit Committee receives a risk update, which focuses on the company’s risk assessment and risk management policies and processes. In addition, the Audit Committee annually conducts an assessment of compliance issues and programs.
The members of the Audit Committee are Alan Schumacher (Chairman), Richard Evans, and Thomas Miklich. During 2010, the Audit Committee met 11 times.
The principal duties and responsibilities of our Audit Committee are to oversee and monitor the following:
| • | our financial reporting process and internal control system; |
| • | the integrity of our consolidated financial statements; |
| • | the retention, independence, qualifications, performance and compensation of our independent registered public accounting firm; |
| • | the performance of our internal audit function; and |
| • | our compliance with legal, ethical and regulatory matters, including our Code of Business Conduct. |
The Audit Committee has established procedures for the receipt, retention and treatment of complaints regarding accounting, internal accounting controls and auditing matters and the receipt of confidential, anonymous submissions by our employees with respect to concerns regarding questionable accounting or auditing matters. Such complaints and submissions may be made by contacting Listen Up via telephone at 1-866-398-0010 or via the internet at www.listenupreports.com. The complaints and submissions will be logged by Listen Up and forwarded to the members of the Audit Committee.
The Board has determined that Messrs. Schumacher and Miklich are “audit committee financial experts” within the meaning of Securities and Exchange Commission regulations.
Code of Business Conduct. We have adopted a Code of Business Conduct that applies to all employees of Noranda Aluminum Holding Corporation and its worldwide subsidiaries. Among other things, the Code of Business Conduct is designed to deter wrongdoing and to promote honest and ethical conduct, including the ethical handling of actual or apparent conflicts of interest between personal and professional relationships; to promote full, fair, accurate, timely and understandable disclosures in periodic reports we are required to file; and to promote compliance with applicable governmental laws, rules and regulations. The Code of Business Conduct provides for the prompt internal reporting of violations to an appropriate person identified in the Code of Business Conduct and contains provisions regarding accountability for adherence to the Code of Business Conduct. The Code of Business Conduct is available on the Investors page of our website at www.norandaaluminum.com. We intend to satisfy the disclosure requirements regarding any amendment to, or waiver from, a provision of the Code of Business Conduct by making disclosures concerning such matters available on the Investors page of our website.
118
Table of Contents
| ITEM 11. | EXECUTIVE COMPENSATION |
In this Compensation Discussion and Analysis, we discuss the compensation paid or awarded for 2010 to our executive officers listed in the Summary Compensation Table that follows this discussion. We sometimes refer to these executive officers as our “named executive officers.”
COMPENSATION DISCUSSION AND ANALYSIS
Objectives of Compensation Program
We designed our compensation program to retain our executives, motivate them to achieve specific financial objectives and to align their interests with our stockholders. In addition, we intend that our compensation program promote strong governance of our company, excellent cash management, long-term earnings growth and safety performance.
Our Process for Determining Compensation in 2010
Prior to the consummation of our initial public offering in May 2010, over 95% of our outstanding common stock was owned by Apollo, and Apollo continues to own a significant majority of our common stock. Our compensation structure prior to our public offering reflected policies and practices used by Apollo in its private investments, including a long-term strategy involving investments in our common stock by executives and the grant of stock options that, in most cases, covered a number of underlying shares that were determined based upon the number of shares purchased by the executives. However, following the completion of our initial public offering of common stock and as discussed in more detail below, we determined that our long term incentive compensation structure was not in line with other publicly traded companies. Therefore, we intend to modify our long-term incentive strategy in 2011.
In 2010, our Compensation Committee reviewed and approved all compensation paid to our executives. Generally, the Compensation Committee seeks to provide total cash compensation, which includes salary and target bonuses under our inventive compensation plan that is at or near the 50th percentile of the competitive marketplace.
The Compensation Committee retained Towers Watson to provide broad-based executive compensation surveys that provide useful information regarding pay practices of a large sample of industrial companies. The Compensation Committee also reviewed data regarding peer companies in our industry. These companies included:
However, while the Compensation Committee considers practices of the peer companies when it deliberates on compensation decisions, it does not mechanically benchmark our pay relative to specific comparative levels among these peer companies, as there are significant size and scope variations between our company and the peer companies. Instead, the Compensation Committee relied primarily, for benchmarking purposes, on the Towers Watson survey data referenced above, which include pay data from both public and private companies. Data collected from the surveys, which cover hundreds of companies, does not relate to specifically-named peer organizations, but rather reflects data for companies within objectively defined parameters, most significantly including corporate revenue levels.
Following the completion of our initial public offering of common stock, we retained Semler Brossy, a national compensation consulting firm that advises many public companies, to provide information regarding pay practices for executives at public companies. Semler Brossy also was asked to recommend any necessary adjustments to align executive compensation with public company competitive norms. While Semler Brossy determined that cash compensation for our executives generally is competitive, it recommended, beginning in 2010, institution of an annual equity program involving awards of time-based and performance-based restricted stock units as the principal vehicle for equity compensation. In addition, Semler Brossy provided recommendations regarding public company practices with respect to change-in-control and severance terms for our executives. Semler Brossy’s recommendations were based on Towers Watson’s data and on data relating to our peer group, expanded to include Cliffs Natural Resources, Inc. and Schnitzer Steel Industries, Inc. During 2010, Noranda HoldCo paid a total of $427,725 in fees to Towers Watson for consulting work relating to the company’s health and welfare plans, its pension plans, and for actuarial work performed by Towers Watson. During the same time period, a total of $43,104 was paid to Towers Watson for executive compensation consulting performed on behalf of the Compensation Committee. Semler Brossy did not provide any other services to us.
After consideration of the Semler Brossy recommendations and consultation with Towers Watson, the Compensation Committee determined generally to defer any action on long-term executive compensation until 2011, while generally accepting the
119
Table of Contents
recommendations regarding change-in-control and severance terms and entering into agreements with the named executive officers embodying the terms set forth in the recommendations, described below under “Change in Control and Severance Arrangements Under the Executive Term Sheets.” In determining to defer action on long-term compensation, the Compensation Committee considered that most of our executives were provided an opportunity to make meaningful investments in our common stock and receive related grants of stock options prior to our initial public offering. However, the Committee determined to provide a restricted stock unit grant to the named executive officer that did not previously invest in our common stock or receive any grant of stock options. We intend to begin an annual cycle of restricted stock unit grants in 2011.
2010 Compensation
Base Salaries. In setting executive officers’ base salaries, the Compensation Committee considers the executive officers’ position within our company and our subsidiaries, the scope of their responsibilities, the period during which they have been performing those responsibilities and their overall performance. Base salaries are reviewed on an annual basis, and are adjusted from time to time to realign salaries with market levels after taking into account the factors described above.
In October 2010, the Compensation Committee determined to adjust the base salaries of the named executive officers, effective July 1, 2010. The Committee determined to increase Mr. Smith’s base salary to $900,000, which is somewhat higher than the median when viewed against comparable executives at peer companies. However, the increase which, among other things, is designed to enable us to retain Mr. Smith’s services, reflects the Compensation Committee’s recognition of his effort and achievement since joining our company and of his critical role in the successful completion of the company’s initial public offering of common stock in 2010, as well as his significant oversight with respect to key issues such as our Missouri power contract and renegotiation of our fiscal regime arrangement with the Government of Jamaica. In determining to increase Mr. Lorentzen’s salary to $550,000, the Compensation Committee noted Semler Brossy’s observation that Mr. Lorentzen’s base salary was well below the median salary of similarly situated executives. In the case of Mr. Croft, the Compensation Committee considered Semler Brossy’s observation that his salary was only at approximately the 25th percentile of the surveyed executives in similar positions. Moreover, the Compensation Committee considered that Mr. Croft has had primary direct responsibility of our flat rolled products segment since 2006 and has performed notably in that capacity. In particular, the Compensation Committee recognized outstanding improvements in performance of the flat rolled products segment in the period from July 1, 2009 to July 1, 2010. Therefore, the Compensation Committee determined to increase Mr. Croft’s salary to $275,000, which was approximately equal to the median of the competitive market identified by Semler Brossy.
2010 Annual Incentive Plan. The Compensation Committee approved the performance metrics for the 2010 Annual Incentive Plan, which, with respect to senior executives, subsequently was incorporated into our Senior Executive Bonus Plan in March 2010. The metrics for 2010 were designed to be standardized for four of our business segments to the extent we deemed practical (a fifth segment, corporate, principally reflects our corporate – level expenses and is not separately referenced in annual incentive plan metrics). In addition, we selected metrics that we believed would reflect successful implementation of our strategy, so that superior performance is incentivized and rewarded. All of our employees participate in our annual incentive plan. We favor this approach because it aligns all employees with our company-wide goals, which we believe improves employee morale and motivation.
The standardization of our metrics, coupled with our determination in 2010 to divide our three reportable segments into five distinct segments resulted in an increase in the total number of metrics addressed by the plan. We previously reported three segments: upstream, downstream, and corporate. We have now identified five reportable segments, with the components previously comprising the upstream segment now representing three segments: primary aluminum products, alumina refining, and bauxite. The downstream segment is now referred to as the flat rolled products segment. Except as noted below, each of the following metrics was applied to each segment (other than the corporate segment, which is not separately addressed in the annual incentive plan), weighted as indicated in the respective descriptions below.
Adjusted EBITDA Cost – (50% weighting for the bauxite, alumina refining and primary aluminum products segments) – Adjusted EBITDA cost consists of the costs to produce a metric tonne of bauxite or alumina, or a pound of aluminum, if applicable, adjusted to correspond to “EBITDA,” as defined in our debt agreements (generally, these further adjustments eliminate related party management fees paid to Apollo, business optimization expenses and restructuring charges, certain charges resulting from the use of purchase accounting in connection with the transaction whereby Noranda became sole owner of our wholly owned alumina refinery in Gramercy, Louisiana and our bauxite mining operation in Jamaica, and other specified items of income or expense). We selected this measure because Adjusted EBITDA cost is used to measure the efficiency and cost effectiveness of the Company’s manufacturing assets.
120
Table of Contents
Enterprise Adjusted EBITDA – (20% weighting) – Enterprise Adjusted EBITDA represents consolidated net income before income taxes, net interest expense and depreciation and amortization, further adjusted to correspond to “EBITDA,” as defined in our debt agreements (as discussed above). We believe Enterprise Adjusted EBITDA is an important metric that should be a component of the award opportunity for employees in all segments because it underscores a principal objective for our company and employees, namely the ability of our company, as a consolidated enterprise, to realize a meaningful return from the sale of our products. It also provides an indication of our ability to realize efficiencies in operating our business. In addition, this metric is related to metrics that are relevant to our debt agreements.
Segment Adjusted EBITDA – (50% weighting for the Flat Rolled Products segment) – Segment Adjusted EBITDA is calculated in the same manner as described above for Enterprise Adjusted EBITDA, but is based on segment profit (loss) rather than consolidated net income before income taxes, and is subject only to those adjustments applicable to the segments. We include this measure because it is a reliable indicator of the overall performance of our segments.
Safety – (15% weighting) – We measure safety performance using the Total Recordable Injury Frequency rate, or “TRIF.” TRIF measures the number of work related injuries that require a certain level of medical treatment per 200,000 hours worked, including, but not limited to, lost time injuries. We selected this measure because we believe that safety is an important measurement of performance for any manufacturing company. In addition, we believe that the increased efficiency and cost reduction achieved as a result of improved safety performance is critical to the success of our company.
Free Cash Flow – (10% weighting) – Free cash flow is defined as, the aggregate of (i) Adjusted EBITDA, plus or minus (ii) changes in working capital (exclusive of cash), minus (iii) capital expenditures plus or minus (iv) any adjustments related to fluctuations in LME aluminum prices from the time of inventory purchase to the time of sale. We believe this measure provides a useful indicator of our ability to manage invested capital and generate cash.
Working Capital as a Percentage of Sales – (5% weighting) – Working capital is defined as accounts receivable plus inventory less accounts payable, but with respect to specific adjustments for each segment individually. This metric is calculated as the simple average of the four quarterly data points, where quarter-end working capital is divided by annualized revenue based on sales in the final month of the quarter. We selected this metric because we believe the ability to control accounts receivable, inventory and accounts payable are key elements in effective working capital management.
The target award for each of the named executive officers under the plan was based on a percentage of their annual salary, which generally reflects negotiations between the executive and the company at the commencement of their employment with us. Salary percentages and target awards were as follows for 2010:
| Target award as
a percentage of salary |
Target award | |||||||
| Name |
% | $ | ||||||
| Layle K. Smith |
100 | 825,000 | ||||||
| Kyle D. Lorentzen |
* | 348,173 | ||||||
| Robert B. Mahoney |
60 | 229,500 | ||||||
| Gail E. Lehman |
60 | 171,000 | ** | |||||
| Scott M. Croft |
50 | 129,862 | ||||||
| * | Mr. Lorentzen’s target award was based on 65% of his base salary from January 1, through June 30, 2010 and 75% of his base salary for the remainder of the year. |
| ** | Ms. Lehman’s target award was prorated for the portion of the year that she was employed by the Company. |
Targets were set for each metric based on amounts that were budgeted early in 2010. Actual achievement and targets, respectively, for certain metrics were as follows:
| Target amount | Actual amount | |||
| Metric |
$ | $ | ||
| Enterprise Adjusted EBITDA |
232.0 million | 279.7(1) million | ||
| Flat Rolled Products Adjusted EBITDA |
36.7 million | 44.9(2) million | ||
| Bauxite Adjusted EBITDA Cost |
20.68 per Mt | 21.45 per Mt | ||
| Alumina Refining Adjusted EBITDA Cost |
273.42 per Mt | 280.42 per Mt | ||
| Integrated Upstream Adjusted EBITDA Cost |
0.71 per lb | 0.73 per lb |
| (1) | Enterprise Adjusted EBITDA was adjusted $53.6 million to include certain non-cash hedge gains which are otherwise excluded from the calculation of Adjusted EBITDA under our credit agreement. |
| (2) | Flat rolled products Adjusted EBITDA was adjusted to give effect to the negative impacts of natural gas pricing and metal losses. |
121
Table of Contents
| Target amount | Actual amount | |||||||
| % | % | |||||||
| Bauxite Working Capital as a % of Sales |
31.3 | 36.8 | ||||||
| Alumina Refining Working Capital as a % of Sales |
17.0 | 7.7 | ||||||
| Primary Aluminum Products Working Capital as a % of Sales |
9.4 | 8.5 | ||||||
| Flat Rolled Products Working Capital as a % of Sales |
16.4 | 14.1 | ||||||
Information regarding the specific performance targets for other metrics described above and actual performance achieved with regard to the metrics are neither considered necessary to understand how compensation was paid under the 2010 Annual Incentive Plan nor material to an understanding of our compensation arrangements, and this information is not addressed in this discussion because it represents confidential business or financial information that is not otherwise disclosed to the public. Disclosing this information would cause significant competitive harm to our company.
With respect to the metrics under the plan, we aim to set performance targets that are aggressive, but sufficiently realistic to motivate the performance of our named executive officers. In that regard, we believe that the targets for each metric in the 2010 Annual Incentive Plan were set at appropriate levels at the beginning of the performance cycle and were considered more than sufficient to motivate the achievement of operational and financial performance. In addition, the targets represented a significant and appropriate challenge for management. Historical achievement rates provide some measure of the difficulty of achieving goals. As noted below, for 2010, the following percentages of target achievement were realized: Bauxite, 40%; Alumina Refining, 94%; Primary Aluminum Products, 114%; Flat Rolled Products, 150%; and Corporate, 116%. For the two prior years, during which performance metrics were directed to only two segments, the Upstream Business (consisting of what now is the Bauxite, Alumina Refining and Primary Aluminum Products segments) and the Downstream Business (the Flat Rolled Products segment), the following percentages of target achievement were realized: For 2009, 189% for the Upstream Business, 170% for the Downstream Business, and 179% for Corporate; for 2008, 99% for the Upstream Business; 64% for the Downstream Business and 81% for Corporate. Therefore, in some instances target performance was not achieved while in other instances target performance was exceeded. Overall, we believe that achievement of target goals under the annual incentive plan structure, while certainly motivational and aspirational in nature, is relatively difficult. In addition, bonuses are based on metrics that are determined to be critical to our success in any given year and that can be significantly affected by our executives’ superior performance.
Based on our actual performance, an achievement percentage is applied to each metric. The achievement percentage varies from 85% if the minimum performance threshold is met, to 200%, if the maximum performance level is achieved. If the target amount for a metric is achieved, the achievement percentage is 100%. The total achievement percentage for a segment equals the weighted average achievement percentage for all applicable performance metrics. The following tables show the metrics utilized for 2010, along with the weighting and achievement percentage reached for each measure:
| Bauxite metrics |
Weight % | Achievement % | ||||||
| Bauxite Adjusted EBITDA cost |
50 | — | ||||||
| Enterprise Adjusted EBITDA |
20 | 200 | ||||||
| Safety |
15 | — | ||||||
| Free Cash Flow |
10 | — | ||||||
| Working capital as a % of sales |
5 | — | ||||||
| Total bauxite |
100 | 40 | ||||||
| Alumina Refining metrics |
Weight % | Achievement % | ||||||
| Alumina Adjusted EBITDA Cost |
50 | 88 | ||||||
| Enterprise Adjusted EBITDA |
20 | 200 | ||||||
| Safety |
15 | — | ||||||
| Free Cash Flow |
10 | — | ||||||
| Working Capital as a % of Sales |
5 | 200 | ||||||
| Total Alumina Refining |
100 | 94 | ||||||
| Primary Aluminum Products metrics |
Weight % | Achievement % | ||||||
| Primary Adjusted EBITDA Costs |
50 | 88 | ||||||
| Enterprise Adjusted EBITDA |
20 | 200 | ||||||
| Safety |
15 | — | ||||||
| Free Cash Flow |
10 | 200 | ||||||
| Working Capital as a % of Sales |
5 | 200 | ||||||
| Total Primary Aluminum Products |
100 | 114 | ||||||
122
Table of Contents
| Flat Rolled Products metrics |
Weight % | Achievement % | ||||||
| Flat-Rolled Adjusted EBITDA |
50 | 200 | ||||||
| Enterprise Adjusted EBITDA |
20 | 200 | ||||||
| Safety |
15 | — | ||||||
| Free Cash Flow |
10 | — | ||||||
| Working Capital as a % of Sales |
5 | 200 | ||||||
| Total Flat Rolled Products |
100 | 150 | ||||||
| Corporate metrics |
Weight % | Achievement % | ||||||
| Total Bauxite |
16 | 2/3 | 40 | |||||
| Total Alumina Refining |
16 | 2/3 | 94 | |||||
| Total Primary Aluminum Products |
16 | 2/3 | 114 | |||||
| Total Flat Rolled Products |
50 | 150 | ||||||
| Total Corporate |
100 | 116 | ||||||
As indicated in the table above, the Corporate metric, which was applicable to Messrs. Smith, Lorentzen, Mahoney, and Ms. Lehman, was based on the indicated weighting of the total achievement for each of our segments, which reflects 50% for each of our legacy upstream and downstream businesses, with each of the three segments derived from the upstream business also given equal weighting. Mr. Croft’s award reflects 50% of the indicated Corporate weighting and 50% of the indicated Flat Rolled Products weighting.
Based on the applicable levels of achievement described above, payments to the named executive officers were as follows:
| Target award | Payout based on performance achieved (% of target award) |
Actual award | ||||||||||
| Named executive officer |
$ | % | $ | |||||||||
| Layle K. Smith |
825,000 | 116 | 959,722 | |||||||||
| Kyle D. Lorentzen |
348,173 | 116 | 405,030 | |||||||||
| Robert B. Mahoney |
229,500 | 116 | 266,977 | |||||||||
| Gail E. Lehman |
171,000 | * | 116 | 198,924 | ||||||||
| Scott M. Croft |
129,862 | 133 | 172,931 | |||||||||
| *Ms. Lehman’s target award was prorated for the portion of the year that she was employed by the Company. |
| |||||||||||
Long-Term Incentives
As noted above, the Compensation Committee determined generally to defer any action on long-term executive compensation until 2011. However, in light of our initial public offering of common stock in 2010 and advice from Semler Brossy that our method of providing equity compensation to our employees prior to our initial public offering of common stock is uncommon among publicly-traded companies, we anticipate that in 2011 we will make equity grants and awards that reflect customary publicly-traded company practices.
In 2010, the Compensation Committee authorized the grant of 26,762 restricted stock units to Ms. Lehman. Vesting terms are discussed in notes to the 2010 Outstanding Awards at Fiscal Year End table. The Compensation Committee took this action based on the fact that, unlike our other named executive officers, Ms. Lehman had not previously received stock options. We made no equity grants to our other named executive officers in 2010.
Ongoing and post-employment compensation
We have several plans and agreements addressing compensation for our named executive officers that accrue value as the executive officer continues to work for us, provide special benefits upon certain types of termination events or provide retirement benefits. These plans and agreements were designed to be part of a competitive compensation package, in some cases not only for executive officers, but for other employees as well.
Noranda Aluminum Group Savings Plan. Our executive officers are eligible to participate in our company-wide 401(k) qualified plan for salaried and non-union hourly employees. The Company matches 50% of employee contributions up to 6% of employee pay. Company matching contributions are 100% vested after three years of service.
Noranda Aluminum Group Retirement Plan (the “Qualified Pension Plan”). Our executive officers participate in this plan, which is a company-wide non-contributory defined benefit pension plan for salaried and non-union hourly employees. Benefits are vested after five years of service and are based on average annual compensation and length of service of the employee. See “2010 Pension Benefits” for further information.
Noranda Aluminum, Inc. Management Supplemental Benefit Plan (the “Supplemental Plan”). This is a separate supplemental non-qualified pension plan in which executive officers and other highly compensated company employees participate. The plan provides retirement benefits equal to the difference, if any, between the maximum benefit allowed under the Qualified Pension Plan under applicable Internal Revenue Code limits and the amount that would be provided under the Qualified Pension Plan if no such
123
Table of Contents
limits were applied. The Supplemental Plan also recognizes as covered earnings deferred salary and bonuses, which are not included as covered compensation under the Qualified Pension Plan. See “2010 Pension Benefits” for further information.
Noranda Aluminum, Inc and Participating Subsidiaries Non-Qualified Deferred Compensation Plan. Under our non-qualified deferred compensation plan, executive officers and other highly compensated employees may defer a portion of their base salary and annual bonus. Amounts deferred are not actually invested, but are credited with interest at a rate equal to the sum of the credited portfolio rate of return published annually by Northwestern Mutual Life Insurance Company (which for 2008, was 7.5%, for 2009 was 6.5%, for 2010 was 6.15% and for 2011 will be 6.0%) and 1.5%. The Company maintains a rabbi trust to provide for its obligations under the supplemental executive retirement plan and the deferred compensation plan. None of our named executive officers currently participates in this plan.
Change in Control and Severance Arrangements under Executive Term Sheets. In October 2010, we amended or entered into new term sheets with our named executive officers that included provisions addressing change in control and executive severance. We believe that change in control and severance protections can create management stability during potential periods of uncertainty. Absent such protections, there is an increased risk that executive officers may be encouraged to seek other employment opportunities if they became concerned about their employment security following or in anticipation of a change in control. We believe that the arrangements serve to provide financial security to a named executive officer in the event the named executive officer is terminated without cause in connection with a change in control by providing a meaningful payment to the named executive officer, and that this protection will help ensure the retention and continued focus of management at pivotal times. We also determined to provide severance protection to our named executive officers, although at lower levels, for certain terminations unrelated to a change in control. We believe these severance protections provide a means of security that offers a competitive benefit and enhances our ability to retain capable executive officers.
The change in control and severance arrangements provide for payments and other benefits if, within 18 months following a change of control, a named executive officer’s employment is terminated without cause and other than due to the named executive officer’s disability or death, if a named executive officer terminates employment for “good reason” (as defined in the term sheets). These change in control provisions thus require what is sometimes called a “double trigger,” namely both a change in control and a specified termination event before payment is made. The agreements also provide for lesser payments if these types of terminations occur outside of the context of a change in control. The arrangements do not include tax gross-up provisions, which involve additional payments to a named executive officer if the named executive officer becomes liable for payment of excise tax under Section 4999 of the Internal Revenue Code with respect to payments in connection with a change in control. Instead, if the severance payments to a named executive officer would be subject to the excise tax, we will reduce the payments to the highest amount that could be paid without triggering the excise tax unless the named executive officer would have a greater after-tax benefit if the payment is not reduced and the excise tax is paid, in which case the named executive officer will pay any applicable excise tax. See - “Potential Payments upon Termination or Change in Control” for additional information, including a discussion of the severance multiples on an individualized basis.
Separation of Employment Agreement with Kyle D. Lorentzen
On November 15, 2010, we entered into a separation of employment agreement with Mr. Lorentzen. As described in more detail below under “Potential Payments Upon Termination or Change in Control,” we agreed to pay Mr. Lorentzen an amount equivalent to the amount payable to him under his term sheet in connection with a termination of employment other than for cause, subject to limited modifications. In agreeing to these terms, we considered Mr. Lorentzen’s dedicated service to our company.
Tax Considerations
Section 162(m) of the Internal Revenue Code limits to $1 million the deductibility for federal income tax purposes of annual compensation paid by a publicly held company to its chief executive officer and other specified highest paid executive officers, unless certain conditions are met. We have structured certain portions of our executive compensation program to preserve deductibility for federal income tax purposes. Nevertheless, we believe that, in certain circumstances, factors other than tax deductibility take precedence in determining the forms and amount of compensation, and we retain the flexibility to authorize compensation that may not be deductible if we believe it is in the best interests of our company.
124
Table of Contents
2010 SUMMARY COMPENSATION TABLE
The following table sets forth information regarding the compensation of our Chief Executive Officer, Chief Financial Officer and each of the persons who were the three other most highly paid executive officers in 2010. We sometimes refer to these persons as the “named executive officers.”
| Salary | Bonus | Stock awards(1) |
Option awards (2) |
Non-equity incentive plan compensation(3) |
Change in pension value and nonqualified deferred compensation earnings(4) |
All
other compensation(5) |
Total | |||||||||||||||||||||||||||||
| Name and principal position |
Year | $ | $ | $ | $ | $ | $ | $ | $ | |||||||||||||||||||||||||||
| Layle K. Smith, |
2010 | 825,000 | — | — | — | 959,722 | 319,145 | 7,041 | 2,110,908 | |||||||||||||||||||||||||||
| President and Chief Executive Officer |
2009 | 750,000 | — | — | 212,480 | 1,337,775 | 150,776 | 7,041 | 2,458,072 | |||||||||||||||||||||||||||
| 2008 | 625,000 | — | — | 2,073,000 | 506,250 | 62,930 | 4,849 | 3,272,029 | ||||||||||||||||||||||||||||
| Kyle D. Lorentzen, |
2010 | 490,422 | — | — | — | 405,030 | 81,126 | 1,963,120 | 2,939,698 | |||||||||||||||||||||||||||
| Chief Operating Officer |
2009 | 396,250 | 200,000 | — | 83,886 | 459,414 | 32,276 | 8,339 | 1,180,165 | |||||||||||||||||||||||||||
| 2008 | 204,481 | — | 500,000 | 619,640 | 108,799 | 10,363 | 4,737 | 1,448,020 | ||||||||||||||||||||||||||||
| Robert B. Mahoney, |
2010 | 380,625 | — | — | — | 266,977 | 93,523 | 5,411 | 746,536 | |||||||||||||||||||||||||||
| Chief Financial Officer |
2009 | 241,477 | — | — | 45,685 | 252,889 | 28,926 | 47,909 | 616,886 | |||||||||||||||||||||||||||
| Gail E. Lehman, |
2010 | 287,500 | (6) | — | 308,031 | — | 198,924 | 28,666 | 40,584 | 863,705 | ||||||||||||||||||||||||||
| Vice President of Human Resources, General Counsel and Secretary |
||||||||||||||||||||||||||||||||||||
| Scott M. Croft, |
2010 | 257,945 | — | — | — | 172,931 | 176,225 | 7,042 | 614,143 | |||||||||||||||||||||||||||
| President, Norandal USA, Inc. |
2009 | 237,330 | — | — | — | 207,889 | 168,952 | 8,952 | 623,123 | |||||||||||||||||||||||||||
| 2008 | 210,785 | — | — | 284,739 | 67,936 | 28,421 | 24,107 | 615,988 | ||||||||||||||||||||||||||||
| (1) | The amounts shown for stock awards are equal to the grant date fair value of the awards, calculated in accordance with Financial Accounting Standards Board Accounting Standards Codification Topic 718 (“ASC Topic 718”). Ms. Lehman held 26,762 restricted stock units at December 31, 2010. |
| (2) | The amounts shown for option awards are equal to the grant date fair value of the awards (and any modifications of such option awards), calculated in accordance with ASC Topic 718. The assumptions used in determining the amounts in this column are set forth in Note 15, “Shareholder’s Equity and Share – Based Payments,” to our consolidated financial statements in our Annual Report on Form 10-K for the fiscal year ended December 31, 2010, filed with the Securities and Exchange Commission. |
| (3) | Represents payments under our annual incentive plan based on our achievement with respect to specified metrics. See “Compensation Discussion and Analysis—2010 Compensation—Annual Incentive Plan” for further information regarding payments for 2010. |
| (4) | Includes the aggregate change in the actuarial present values of the named executive officers’ accumulated benefit under the Noranda Aluminum Inc. Aluminum Group Retirement Plan and the Noranda Aluminum Inc. Management Supplemental Benefit Plan from January 1, 2010 to December 31, 2010. Messrs. Smith, Lorentzen, Mahoney, Croft and Ms. Lehman did not participate in our non-qualified deferred compensation plan in 2010 or in any prior years. The changes in pension values described above are based on the following calculations: |
| Name |
Plan name |
Change in pension value* | ||||
| $ | ||||||
| Layle K. Smith |
Noranda Aluminum Inc. Aluminum Group Retirement Plan | 36,867 | ||||
| Noranda Aluminum Inc. Management Supplemental Benefit Plan | 282,278 | |||||
| Total | 319,145 | |||||
| Kyle D. Lorentzen |
Noranda Aluminum Inc. Aluminum Group Retirement Plan | 21,822 | ||||
| Noranda Aluminum Inc. Management Supplemental Benefit Plan | 59,304 | |||||
| Total | 81,126 | |||||
| Robert B. Mahoney |
Noranda Aluminum Inc. Aluminum Group Retirement Plan | 35,629 | ||||
| Noranda Aluminum Inc. Management Supplemental Benefit Plan | 57,894 | |||||
| Total | 93,523 | |||||
| Gail E. Lehman |
Noranda Aluminum Inc. Aluminum Group Retirement Plan | 21,945 | ||||
| Noranda Aluminum Inc. Management Supplemental Benefit Plan | 6,721 | |||||
| Total | 28,666 | |||||
| Scott M. Croft |
Noranda Aluminum Inc. Aluminum Group Retirement Plan | 86,731 | ||||
| Noranda Aluminum Inc. Management Supplemental Benefit Plan | 89,494 | |||||
| Total | 176,225 | |||||
| * | Present values shown represent the increase in present value of accrued pension benefits from December 31, 2009 to December 31, 2010. Benefits are assumed to begin at age 65 (which is the plans’ earliest unreduced retirement age). Present values assume mortality in accordance with the IRS prescribed static table for 2010 for Healthy Annuitants as of December 31, 2009 and the IRS prescribed static table for 2011 for Healthy Annuitants as of December 31, 2010. Benefits are assumed payable as a joint and 75% survivor annuity if the executive is married, or as a five-year certain and life annuity if the executive is single. The discount rates at |
125
Table of Contents
| December 31, 2010 and December 31, 2009 for financial reporting purposes are 5.3% and 5.8% respectively for the Noranda Aluminum Inc. Aluminum Group Retirement Plan and 5.1% and 5.6% respectively for the Noranda Aluminum Inc. Management Supplemental Benefit Plan. |
| (5) | The amounts in the “All Other Compensation” column for 2010 include the following: |
| Named executive officer |
GTL(a) insurance |
Company 401(k) match (b) |
Moving allowance |
Severance | Vacation payout |
Total | ||||||||||||||||||
| $ | $ | $ | $ | $ | $ | |||||||||||||||||||
| Layle K. Smith |
3,366 | 3,675 | — | — | — | 7,041 | ||||||||||||||||||
| Kyle D. Lorentzen |
3,366 | 5,062 | — | 1,942,000 | 12,692 | 1,963,120 | ||||||||||||||||||
| Robert B. Mahoney |
3,014 | 2,397 | — | — | — | 5,411 | ||||||||||||||||||
| Gail E. Lehman |
2,277 | 3,375 | 34,932 | — | — | 40,584 | ||||||||||||||||||
| Scott M. Croft |
2,043 | 4,999 | — | — | — | 7,042 | ||||||||||||||||||
| (a) | Under our group term life insurance policies, we provide coverage in amounts up to two times the named executive officers’ base pay (limited to $850,000). Amounts reported in the table above represent the dollar value of insurance premiums paid on behalf of each named executive officer in 2010. |
| (b) | Our named executive officers are eligible to participate in our company-wide 401(k) qualified plan for salaried employees. We match 50% of employee contributions up to 6% of employee pay. Our matching contributions are 100% vested after three years of service. Amounts reported in the table above represent the amount of our matching contributions made in 2010. |
| (6) | Ms. Lehman joined the Company on January 18, 2010. |
Employment Arrangements
On October 26, 2010, we amended and restated or entered into new term sheets relating to the employment of our named executive officers. Under the term sheets, our named executive officers will continue to serve in the capacities listed below their names on the Summary Compensation Table. We also agreed to pay to the named executive officers, effective July 1, 2010, the base salaries listed in the table below, and to set a target bonus under our 2010 bonus plan (which was reflected in the executive’s target bonuses under our 2010 Annual Incentive Plan), as indicated in the table below:
| Name |
Base salary | 2010 Target bonus as a percentage of base salary |
||||||
| Layle K. Smith |
$ | 900,000 | 100 | % | ||||
| Kyle D. Lorentzen |
$ | 550,000 | * | |||||
| Robert B. Mahoney |
$ | 382,500 | 60 | % | ||||
| Gail E. Lehman |
$ | 300,000 | 60 | % | ||||
| Scott M. Croft |
$ | 275,000 | 50 | % | ||||
| * | Mr. Lorentzen’s target award was based on 65% of his base salary from January 1 through June 30, 2010, and 75% of his base salary from July 1, 2010 through December 31, 2010. |
In addition, the named executive officers agreed to confidentiality, non-competition and non-solicitation covenants address in the term sheets.
See “Potential Payments Upon Termination or Change of Control” for a description of change of control and severance provisions included in the named executive officers’ term sheets.
2010 Grants of Plan-Based Awards
The following table provides information regarding plan-based awards granted to the named executive officers in 2010:
| All other share awards: number of shares or units |
All other option awards: number of shares underlying options |
Exercise or base price of option awards |
Grant date fair value of share and option awards |
|||||||||||||||||||||||||||||
| Estimated possible payouts under non-equity incentive plan awards(1) |
||||||||||||||||||||||||||||||||
| Threshold | Target | Maximum | ||||||||||||||||||||||||||||||
| Name |
Grant date | $ | $ | $ | # | # | $/share | $ | ||||||||||||||||||||||||
| Layle K. Smith |
3/31/2010 | 701,250 | 825,000 | 1,650,000 | — | — | — | — | ||||||||||||||||||||||||
| Kyle D. Lorentzen |
3/31/2010 | 295,947 | 348,173 | 696,346 | — | — | — | — | ||||||||||||||||||||||||
| Robert B. Mahoney |
3/31/2010 | 195,075 | 229,500 | 459,000 | — | — | — | — | ||||||||||||||||||||||||
| Gail E. Lehman |
3/31/2010 | 145,350 | 171,000 | 342,000 | — | — | — | — | ||||||||||||||||||||||||
| 12/01/2010 | — | — | — | 26,762 | — | — | 308,031 | |||||||||||||||||||||||||
| Scott M. Croft |
3/31/2010 | 110,383 | 129,862 | 259,724 | — | — | — | — | ||||||||||||||||||||||||
| (1) | These awards were made under our 2010 Annual Incentive Plan. See “Compensation Discussion and Analysis - 2010 Annual Incentive Plan.” |
126
Table of Contents
2010 Outstanding Equity Awards at Fiscal Year End
The following table provides information regarding outstanding stock options and restricted stock units held by the named executive officers at December 31, 2010:
| Option awards | Stock awards | |||||||||||||||||||||||
| Number of shares underlying unexercised options Exercisable |
Number of shares underlying unexercised options Unexercisable |
Option exercise price |
Option expiration date |
Number of shares or units that have not vested |
Market value of shares or units that have not vested |
|||||||||||||||||||
| Name |
# | # | $ | # | $ | |||||||||||||||||||
| Layle K. Smith(1) |
110,000 | 290,000 | 1.14 | March 3, 2018 | — | — | ||||||||||||||||||
| Kyle D. Lorentzen |
147,500 | — | 1.14 | June 18, 2011 | — | — | ||||||||||||||||||
| Robert B. Mahoney(2) |
18,000 | 102,000 | 0.69 | June 9, 2019 | — | — | ||||||||||||||||||
| Gail E. Lehman(3) |
— | — | — | — | 26,762 | (3) | 390,725 | |||||||||||||||||
| Scott M. Croft(4) |
98,080 | 24,520 | 2.00 | May 18, 2017 | — | — | ||||||||||||||||||
| (1) | Mr. Smith’s options are scheduled to vest as follows: |
| Date |
Number of shares underlying options that vest |
|||
| March 3, 2011 |
40,000 | |||
| November 12, 2011 |
30,000 | |||
| March 3, 2012 |
40,000 | |||
| November 12, 2012 |
40,000 | |||
| March 3, 2013 |
40,000 | |||
| November 12, 2013 |
50,000 | |||
| November 12, 2014 |
50,000 | |||
| (2) |
Mr. Mahoney’s options are scheduled to vest as follows: |
| Date |
Number of shares underlying options that vest |
|||
| June 9, 2011 |
18,000 | |||
| June 9, 2012 |
24,000 | |||
| June 9, 2013 |
30,000 | |||
| June 9, 2014 |
30,000 | |||
| (3) | Ms. Lehman’s restricted stock units are scheduled to vest in increments of 25%, 25% and 50% on December 1, 2011, 2012 and 2013, respectively. |
| (4) |
Mr. Croft’s unvested options are scheduled to vest with respect to 12,260 shares on each of May 18, 2011 and May 18, 2012. |
Subject to certain limited exceptions set forth in the applicable stock option award agreement or in a separation agreement, unvested options will automatically expire upon the date of the optionee’s termination of employment, and vested options generally will expire 90 days following the termination of the optionee’s employment without “cause” or with “good reason” (each as defined in the applicable stock option agreement), 60 days following the optionee’s termination of employment without good reason and 180 days following the optionee’s death or disability. All options will be forfeited upon a termination of the optionee’s employment for cause.
2010 Pension Benefits
The Noranda Aluminum Inc. Aluminum Group Retirement Plan, which we refer to below as the “Aluminum Group Retirement Plan” is a tax-qualified defined benefit pension plan that provides a benefit of 1.75% of final five-year average compensation, with an offset of 0.75% of the executive’s Social Security benefit for each year of credited service (maximum 40 years). Pay reflected in the formula is total compensation, excluding deferred compensation, and is subject to certain limits required by the Internal Revenue Code. Benefits commence at age 65, or as early as age 55 with a reduction of 3% for each year by which commencement precedes age 65. Accrued benefits are vested when the employee has completed 5 years of service. None of the named executive officers are currently eligible for early retirement benefits. Messrs. Smith, Lorentzen, Mahoney and Ms. Lehman, do not yet have 5 years of service, and Mr. Croft is not yet 55 years of age. Upon disability before retirement, the accrued benefit is payable immediately and is reduced for early commencement before age 65, and, if the employee remains disabled until age 65, a benefit is payable at age 65 equal to the benefit the employee would have earned had he remained employed until age 65 at his last rate of pay. Upon retirement, the benefit is paid as a monthly annuity for the employee’s life, with 5 years of payments guaranteed. Alternatively, employees can elect an actuarially equivalent benefit in the form of a joint and 50% survivor annuity (which married participants must elect unless they obtain spousal consent), a 75% and 100% joint survivor annuity, a life annuity, a life annuity with 10 years guaranteed, or, if the present value of the benefit is less than $25,000, a lump sum payment. If a married employee dies before retirement, a survivor benefit is paid to the surviving spouse equal to the benefit the spouse would have received if the employee had retired and chosen the 50% joint and survivor annuity.
The Noranda Aluminum Inc. Management Supplemental Benefit Plan, which we refer to below as the “Management Supplemental Benefit Plan,” is a non-qualified defined benefit pension plan that uses the same benefit formula as the Aluminum Group Retirement Plan and provides any benefit accruals that would have been provided under the qualified plan if not for the pay and
127
Table of Contents
benefit limits of the Internal Revenue Code and if the executive had not deferred compensation. Executives can elect to receive non-qualified plan payments in an actuarially equivalent lump sum or in two, three, five or ten annual installments, and can elect to begin receiving benefits at age 55, 60, 65 or 70 (but not before 6 months after termination of employment).
The chart below sets forth, for each of our named executive officers, the present value of the officer’s accumulated benefit, and the officer’s years of credited service as of December 31, 2010 under each of our defined benefit pension plans.
| Name |
Plan name (1) |
Number of years credited service |
Present value of accumulated benefit (1) |
Payment during last fiscal year |
||||||||||
| # | $ | $ | ||||||||||||
| Layle K. Smith |
Aluminum Group Retirement Plan Management Supplemental Benefit Plan |
|
2.8 2.8 |
|
|
82,833 450,018 |
|
|||||||
| Total | 532,851 | — | ||||||||||||
| Kyle D. Lorentzen |
Aluminum Group Retirement Plan Management Supplemental Benefit Plan |
|
2.7 2.7 |
|
|
44,519 79,246 |
|
|||||||
| Total | 123,765 | — | ||||||||||||
| Robert B. Mahoney |
Aluminum Group Retirement Plan Management Supplemental Benefit Plan |
|
1.7 1.7 |
|
|
54,612 67,837 |
|
|||||||
| Total | 122,449 | — | ||||||||||||
| Gail E. Lehman |
Aluminum Group Retirement Plan Management Supplemental Benefit Plan |
|
0.9 0.9 |
|
|
21,945 6,721 |
|
|||||||
| Total | 28,666 | — | ||||||||||||
| Scott M. Croft |
Aluminum Group Retirement Plan Management Supplemental Benefit Plan |
|
19.7 19.7 |
|
|
357,908 141,224 |
|
|||||||
| Total | 499,132 | — | ||||||||||||
| (1) | Present values shown represent the present value of accrued pension benefits at December 31, 2010. Benefits are assumed to begin at age 65 (which is the earliest retirement age for which full plan benefits are payable). Present values assume mortality in accordance with the IRS prescribed static table for 2011 for Healthy Annuitants as of December 31, 2010. Retirement Plan benefits are assumed payable as a joint and 75% survivor annuity if the executive is married, or as a five-year certain and life annuity if the executive is single. Management Supplemental Benefit Plan benefits are assumed payable as lump sums. The discount rates at December 31, 2010 for financial reporting purposes are 5.3% for the Aluminum Group Retirement Plan and 5.1% for the Management Supplemental Benefit Plan. |
Potential Payments upon Termination or Change of Control
In this section, we describe payments that may be made to our named executive officers upon several events of termination, including termination in connection with a change in control, assuming the termination event occurred on December 31, 2010 (except as otherwise noted). The information in this section does not include information relating to the following:
| • | distributions under our defined benefit pension plans – See “2010 Pension Benefits” for information regarding these plans, |
| • | other payments and benefits provided on a nondiscriminatory basis to salaried employees generally upon termination of employment, including payments under the Noranda Aluminum Group Savings Plan, |
| • | restricted shares and shares underlying options that vested prior to the termination event—see the 2010 Outstanding Equity Awards at Fiscal Year End table, and |
| • | Short-term incentive payments that would not be increased due to the termination event. |
As noted above, on October 26, 2010, we amended and restated or entered into new term sheets relating to the employment of our named executive officers. The term sheets provide for benefits upon specified termination of employment events within 18 months following a change in control and lesser benefits upon specified termination of employment events at any time for reasons unrelated to a change in control.
In the event that the named executive officer is terminated other than for “cause” or if the executive resigns for “good reason” (each as defined in the applicable term sheet), he or she will be entitled, subject to his or her execution and non-revocation of a general release, to (i) two times annual base salary plus target bonus (an amount equal to annual base salary plus target bonus for Mr. Mahoney, Ms. Lehman, and Mr. Croft), (ii) a pro-rated annual bonus, based on our actual performance, and (iii) continued health benefits for a period of 18 months (12 months in the case of Mr. Mahoney, Ms. Lehman, and Mr. Croft). In the event such termination occurs in connection with, in anticipation of, or within the 18 month period following a change in control (a “CIC Termination”), the executive generally would be entitled to the same severance benefits as described above, except that the severance payment would be in an amount equal to three times annual base salary plus target bonus (two times annual base salary plus target bonus for Mr. Mahoney, Ms. Lehman, and Mr. Croft), and all executives would be provided continued health benefits or a period of 18 months.
In addition, in the event that a named executive officer is terminated without cause or resigns for good reason, the vesting provisions of options granted to the executive officer prior to our initial public offering of common stock would be modified as follows: all options held by named executive officers other than Mr. Lorentzen would be credited with an additional 12 months of vesting; Mr. Lorentzen’s options would be fully vested. In the event of a CIC Termination, all options granted to the named executive officers prior to our initial public offering of common stock would fully vest. Under provisions of either a term sheet or a stock option agreement, all options that were granted to a named executive officer prior to our initial public offering of common stock also will fully vest if the executive remains employed by us through the 18 month anniversary of a change in control. In addition, Mr. Smith’s options also would fully vest following a change in control that occurs prior to March 3, 2013.
Each of the stock option agreements for the named executive officers other than Mr. Mahoney provides that in the event of a named executive officer’s death or disability, the options will vest with respect to the next tranche of underlying shares that would have vested if the named executive officer remained employed by us through the vesting date of the tranche.
Mr. Smith’s amended and restated term sheet provides that in the event a change in control occurs on or prior to March 3, 2013 and Mr. Smith remains employed by us through the 12 month anniversary of the change in control (or through such earlier time as he is terminated without cause or for good reason), he generally will have the following rights with respect to 200,000 shares of our common stock he previously acquired from us in March 2008 (the “Invested Shares”): (i) in a transaction where consideration paid for our common stock is cash, the Invested Shares will be sold for the greater of $7,530,000 or the amount otherwise payable for such shares in the transaction and (ii) in a transaction where stock of another entity is provided as consideration for our common stock, he has the option of receiving $7,530,000 or (to the extent permitted by the other entity) shares of the other entity receivable on conversion of the Invested Shares. The $7,530,000 amount will be reduced by any amounts otherwise realized with respect to the Invested Shares. If Mr. Smith terminates employment at least six months, but less than 12 months, following the change in control (and such termination is not without cause or for good reason), he will be entitled to 50 percent of the cash amount he otherwise would be able to receive with respect to the Invested Shares, as described above.
Ms. Lehman’s restricted stock unit agreement provides that, in the event of her death or disability, of if she is terminated for cause or is resigning for good reason, her restricted stock units will vest with respect to the next tranche of restricted stock units that would have vested if she remained employed through the vesting date of the tranche. Moreover, following a change in control, all of her unvested restricted stock units will vest unless she is provided with a replacement award satisfying specified conditions. However, all unvested restricted stock units underlying the replacement award also will vest in the event of her death or disability, of if she is terminated for cause or resigns for good reason, within 24 months of the change of control.
128
Table of Contents
Under the term sheets, in the event any payments would be subject to the golden parachute excise tax under the Internal Revenue Code, the payments will be reduced such that no payments will become subject to the excise tax, unless the executive officer would be in a better after-tax position by receiving all payments and paying the applicable excise tax.
A “change in control” under the term sheets generally means:
| • | the acquisition by any individual, entity or group (other than Apollo, a person who was an affiliate of ours prior to such acquisition, or any employee benefit plan sponsored or maintained by us or any of our subsidiaries) of beneficial ownership of more than 50% of the voting power of our company. |
| • | a merger or other business combination involving our company or any of our subsidiaries, or a sale of all or substantially all of our or their assets following which our voting securities outstanding immediately prior to the transaction no longer represent at least 50% of the combined voting power of our securities or, if we are not the surviving entity, such surviving entity (or the entity that purchased all or substantially all of our assets), or any parent or other affiliate of the entity, outstanding immediately after the transaction. |
The term “good reason” under the term sheets is defined as:
| • | in the case of Mr. Smith, his voluntary resignation after any of the following actions are taken by Noranda HoldCo or any of its subsidiaries without Mr. Smith’s consent (i) a material reduction in base salary or bonus potential (but not including any pre-change in control diminution related to an across-the-board compensation reduction applying to senior management of the company generally), (ii) the assignment to Mr. Smith of duties materially inconsistent with his duties as set forth in the term sheet or a material diminution of his responsibilities, (iii) a material breach by Noranda HoldCo of the term sheet, (iv) a requirement that Mr. Smith relocate his principal place of employment by more than 50 miles (other than in connection with a pre-change in control relocation of the company’s headquarters, if he is relocated to the new headquarters), or (v) a notice by Noranda HoldCo of non-extension of the term of employment (other than under circumstances where employment is to be continued subsequent to such non-extension with terms of employment and severance protections that are consistent with peer group market practice, as determined by Noranda HoldCo in reasonable good faith); provided, however, that no termination shall be for good reason unless (x) Mr. Smith notifies Noranda HoldCo, or its applicable subsidiary, in writing within 60 days of the occurrence of the applicable event which constitutes good reason, (y) Noranda HoldCo or such subsidiary fails to cure such event within 30 days after receipt of such written notice, and (z) Mr. Smith terminates for good reason within 60 days of the conclusion of such cure period. |
| • | in the case of all other named executive officers, the executive’s voluntary resignation after any of the following actions are taken by Noranda HoldCo or any of its subsidiaries without the executive’s consent (i) a material reduction in base salary or bonus potential (but not including any pre-change in control diminution related to an across-the-board compensation reduction applying to senior management of the company and its subsidiaries generally), (ii) a material adverse change in the executive’s title, duties, or responsibilities, (iii) a requirement that the executive relocate his or her principal place of employment by more than 50 miles (other than in connection with a pre-change in control relocation of the company’s headquarters, if the executive is relocated to the new headquarters), or (iv) a notice by Noranda HoldCo of non-extension of the term of employment (other than under circumstances where employment is to be continued subsequent to such non-extension with terms of employment and severance protections that are consistent with peer group market practice, as determined by Noranda HoldCo in reasonable good faith); provided, however, that no termination shall be for good reason unless (x) the executive notifies Noranda HoldCo, or its applicable subsidiary, in writing within 60 days of the occurrence of the applicable event which constitutes good reason, (y) Noranda HoldCo or such subsidiary fails to cure such event within 30 days after receipt of such written notice, and (z) the executive terminates for good reason within 60 days of the conclusion of such cure period. |
Separation Agreement with Mr. Lorentzen
On November 15, 2010, Mr. Lorentzen entered into a separation agreement with us. Under the agreement, Mr. Lorentzen resigned from all positions he held with us. We agreed to pay Mr. Lorentzen an amount equivalent to the amount payable to
129
Table of Contents
Mr. Lorentzen under his term sheet in connection with a termination of employment other than for cause, except that we calculated his target bonus under the 2010 Annual Incentive Plan at 75% of his $550,000 salary (reflecting the amount of his target bonus effective on July 1, 2010), and made an additional payment of $17,000 in lieu of matching contributions to his 401(k) that we would have made if his employment continued. All payments were made on December 31, 2010, except for Mr. Lorentzen’s actual bonus under the 2010 Annual Incentive Plan, which will be paid in March 2011. He also will be provided continued health benefits through 2012, or until such earlier date as he and his dependents are covered by a successor employee’s plan. In addition, all unvested options held by Mr. Lorentzen were vested on December 31, 2010, and we agreed to extend the termination date of the options until June 18, 2011, which is 30 days following the expiration of the lock up agreement he signed in connection with the December 2010 offering of our common stock.
Mr. Lorentzen has provided a general release to us and has agreed to certain confidentiality, non-competition and non-disparagement provisions.
Tables of Benefits Upon Termination and Change of Control Events
The following tables show potential payments to the named executive officers upon termination of employment, including without limitation a change in control, assuming a December 31, 2010 termination date. In connection with the amounts shown in the table:
| • | Stock option benefit for each option as to which vesting will be accelerated with respect to some or all of the shares underlying the option upon the occurrence of the termination event are equal to the product of the affected number of shares underlying the option multiplied by the difference between the exercise price per share of the option and the $14.60 closing price per share of our common stock on December 31, 2010, as reported by the New York Stock Exchange. |
| • | Restricted stock unit benefit amounts are equal to the product of the number of restricted stock units as to which vesting will be accelerated upon the occurrence of the termination event multiplied by the $14.60 closing price per share of our common stock on December 31, 2010, as reported by the New York Stock Exchange. |
| • | Mr. Smith’s resale right with respect to his Invested Shares was calculated based on the difference between the minimum $7,530,000 amount he is entitled to receive and the value of such shares based on the $14.60 closing price per share of our common stock on December 31, 2010, as reported by the New York Stock Exchange (which, for purposes of the amount in the table below, is assumed to be the consideration otherwise payable for Mr. Smith’s Invested Shares in a change of control transaction.) As noted above, the resale right is available only with respect to a change of control that occurs on or prior to March 3, 2013. |
| • | Health benefits are equal to the costs we would incur to maintain such benefits for the applicable period. |
| • | Mr. Lorentzen’s severance payments reflect actual amounts paid to him based on the terms of his separation agreement. |
| Layle K. Smith |
||||||||||||||||
| Benefit type |
Change in control termination without cause or for good reason |
Non-change in control termination without cause or for good reason |
Continued employment 18 months following a change in control |
Death or disability | ||||||||||||
| $ | $ | $ | $ | |||||||||||||
| Severance payments |
5,400,000 | 3,600,000 | — | 900,000 | ||||||||||||
| Stock options |
3,903,400 | 942,200 | 2,422,800 | 942,200 | ||||||||||||
| Invested Shares resale right |
4,610,000 | — | — | — | ||||||||||||
| Health benefits |
12,978 | 12,978 | — | — | ||||||||||||
| Total |
13,926,378 | 4,555,178 | 2,422,800 | 1,842,200 | ||||||||||||
| Kyle D. Lorentzen |
||||||||||||||||
| Benefit type |
Payment under separation agreement |
|||||||||||||||
| $ | ||||||||||||||||
| Severance payments(1) |
2,347,030 | |||||||||||||||
| Stock options |
1,519,298 | |||||||||||||||
| Health benefits |
24,120 | |||||||||||||||
| Total |
3,890,448 | |||||||||||||||
| (1) | Includes severance payments of $1,942,000 and non-equity incentive plan compensation of $405,030. |
130
Table of Contents
| Robert B. Mahoney |
||||||||||||||||
| Benefit type |
Change in control termination without cause or for good reason |
Non-change in control termination without cause or for good reason |
Continued employment 18 months following a change in control |
Death or disability | ||||||||||||
| $ | $ | $ | $ | |||||||||||||
| Severance payments |
1,224,000 | 612,000 | — | — | ||||||||||||
| Stock options |
1,418,820 | 250,380 | 807,600 | — | ||||||||||||
| Health benefits |
28,538 | 19,025 | — | — | ||||||||||||
| Total |
2,671,358 | 881,405 | 807,600 | — | ||||||||||||
| Gail E. Lehman |
||||||||||||||||
| Benefit type |
Change in control termination without cause or for good reason |
Non-change in control termination without cause or for good reason |
Continued employment 18 months following a change in control |
Death or disability | ||||||||||||
| $ | $ | $ | $ | |||||||||||||
| Severance payments |
960,000 | 480,000 | — | — | ||||||||||||
| Restricted stock units |
390,725 | 97,689 | 390,725 | 97,689 | ||||||||||||
| Health benefits |
18,090 | 12,060 | — | — | ||||||||||||
| Total |
1,368,815 | 589,749 | 390,725 | 97,689 | ||||||||||||
| Scott M. Croft |
||||||||||||||||
| Benefit type |
Change in control termination without cause or for good reason |
Non-change in control termination without cause or for good reason |
Continued employment 18 months following a change in control |
Death or disability | ||||||||||||
| $ | $ | $ | $ | |||||||||||||
| Severance payments |
825,000 | 412,500 | — | — | ||||||||||||
| Stock options |
308,952 | 154,476 | — | 154,476 | ||||||||||||
| Health benefits |
28,538 | 19,025 | — | — | ||||||||||||
| Total |
1,162,490 | 586,001 | — | 154,476 | ||||||||||||
Director Compensation
Compensation for Service on the Board of Directors. Each of our non-employee directors, other than an Apollo affiliate, as described below, receives an annual retainer of $75,000, paid quarterly in advance, plus $2,000 for each meeting of the Board of Directors attended in person ($1,000 if attended by telephone). In addition, each of our non-employee directors, other than an affiliate of Apollo, received a grant of 10,000 restricted stock units in 2010, and it is anticipated that each director will be granted 5,000 restricted stock units annually, beginning in 2011. The restricted stock units vest on the first anniversary of the date of grant or, if earlier, under certain termination of service events.
Compensation for Service on a Board Committee. Each of our non-employee directors, who is a member of a committee of the Board, other than an Apollo affiliate is entitled to receive $2,000 for each committee meeting attended in person ($1,000 if attended by telephone).
Compensation in Respect of Apollo Affiliates. A director who is an Apollo affiliate does not receive any annual retainer and meeting fees, including any equity grants (whether as a director or as a committee member). Instead, in consideration for providing the services of such Apollo designee, Apollo Management VI, L.P. receives 87.5% of the amount of such retainer or fees that would otherwise be payable to the non-employee director and Apollo Alternative Assets, L.P. receives the remaining 12.5%.
Former Compensation Arrangement with Mr. Brooks. In connection with the Apollo Acquisition in May 2007, Apollo entered into a term sheet with Mr. Brooks, who was then serving as our Chief Executive Officer. Mr. Brooks retired from his position as Chief Executive Officer and President in March 2008, and now serves as Chairman of our Board of Directors. Under the term sheet, after his retirement as Chief Executive Officer, Mr. Brooks was entitled to receive $300,000 per year until May 17, 2010, the third anniversary of the consummation of the Apollo Acquisition subject to Mr. Brooks’ agreement to serve on the Company’s Board of Directors if requested by Apollo. Mr. Brooks received no additional compensation for serving as a director of Noranda HoldCo prior to termination of the term sheet. Subsequent to the termination of the term sheet, Mr. Brooks has been compensated in the same manner as other non-employee directors who are Apollo affiliates.
The following table provides information regarding compensation for our non-employee directors in 2010, which reflects the directors’ fees and other arrangements described above. The table does not include compensation to Layle K. Smith, our President and Chief Executive Officer, which is included in the Summary Compensation Table above. Mr. Smith receives no additional compensation in respect of his service on the Board.
131
Table of Contents
2010 Director Compensation
| Fees earned or paid in cash(1) |
Stock awards(2) | Option awards(3) | All other compensation |
Total | ||||||||||||||||
| Name |
$ | $ | $ | $ | $ | |||||||||||||||
| William H. Brooks(4) |
174,659 | 115,100 | — | — | 289,759 | |||||||||||||||
| Richard B. Evans |
99,958 | 115,100 | — | — | 215,058 | |||||||||||||||
| Robert A. Kasdin |
87,000 | 115,100 | — | — | 202,100 | |||||||||||||||
| Scott Kleinman |
— | — | — | — | — | |||||||||||||||
| Matthew R. Michelini |
— | — | — | — | — | |||||||||||||||
| Thomas R. Miklich |
98,000 | 115,100 | — | — | 213,100 | |||||||||||||||
| Matthew H. Nord |
— | — | — | — | — | |||||||||||||||
| Eric L. Press |
— | — | — | — | — | |||||||||||||||
| M. Ali Rashid |
— | — | — | — | — | |||||||||||||||
| Alan H. Schumacher |
101,000 | 115,100 | — | — | 216,100 | |||||||||||||||
| Gareth Turner |
— | — | — | — | — | |||||||||||||||
| (1) | As described above, Messrs Kleinman, Michelini, Nord, Press, Rashid and Turner, who are affiliates of Apollo, received no compensation for their services in 2010. Rather, director fees were paid to Apollo Management VI, L.P. and Apollo Alternative Assets, L.P. for making these persons available to serve as non-employee directors in 2010. In 2010, Apollo Management VI, L.P. and Apollo Alternative Assets, L.P. received $464,625 and $66,375, respectively, in retainers and fees, in respect of Messrs. Kleinman, Michelini, Nord, Press, Rashid and Turner. |
| (2) | The amounts shown for stock awards are equal to the grant date value of the awards, calculated in accordance with ASC Topic 718. Each of Messrs. Brooks, Evans, Kasdin, Miklich and Schumacher held 10,000 restricted stock units at December 31, 2010. |
| (3) | As described in note 1 above, Messrs. Harris, Kleinman, Michelini, Nord, Press, Rashid and Turner received no compensation for their services in 2010. Rather, options were granted to Apollo Management VI, L.P. and Apollo Alternative Assets, L.P. in 2007 for making available for service our non-employee directors in future years (including 2010). Apollo Management VI, L.P. and Apollo Alternative Assets, L.P. were granted 122,500 and 17,500 options, respectively, in 2007. Additionally, in January 2011, Apollo Management VI, L.P. and Apollo Alternative Assets, L.P. were granted 52,500 and 7,500 restricted stock units, respectively, for the continued future service of the Apollo affiliates as non-employee directors. These restricted stock units will vest on December 1, 2011 and will be settled in cash based on the fair market value of our common shares on the vesting date. |
| (4) | As described above, Mr. Brooks was compensated in accordance with the provisions of his term sheet prior to the termination of the term sheet in May 2010. |
Compensation Programs and Risk
Our cross-disciplinary risk management function monitors risk generally, including the relationship between risk and compensation, and the compensation committee reviews with management the relationship between the compensation programs across our organization and risk management on a periodic basis. We have concluded that our compensation programs do not create risks that are reasonably likely to have a material adverse effect on us. In reaching this determination, we are especially focused on the balanced and diversified compensation program that we maintain. The program includes meaningful components that do not promote risk, such as market-appropriate base salaries and deferred compensation and pension arrangements, as well as performance-based incentives that should promote a healthy, but not excessive, amount of risk taking. In this regard, we also believe that our actual incentive metrics and the use of multiple metrics ensures that executives are incentivized only to take risks that are in the interests of our stockholders and other constituents.
132
Table of Contents
Compensation Committee Report
The Compensation Committee has reviewed and discussed with Company management the Compensation Discussion and Analysis included in this Item 11 of the Company’s Annual Report on From 10-K for the fiscal year ended December 31, 2010, and based on this review and discussion, the Compensation Committee has recommended to the Board that the Compensation Discussion and Analysis be included in this Annual Report on Form 10-K and in the Company’s proxy statement for its 2011 annual meeting of stockholders.
| Eric L Press, Chairman |
| Matthew H. Nord |
133
Table of Contents
| ITEM 12. | SECURITY OWNERSHIP OF CERTAIN BENEFICIAL OWNERS AND MANAGEMENT AND RELATED STOCKHOLDER MATTERS |
The following table sets forth information about beneficial ownership of our common stock as of February 28, 2011 (unless otherwise noted) by (i) each stockholder that has indicated in public filings that the stockholder beneficially owns more than five percent of our common stock; (ii) each director and each nominee for election as a director; (iii) each executive officer named in the Summary Compensation Table below; and (iv) all directors and executive officers as a group. Except as otherwise noted, each person listed below, either alone or together with members of the person’s family sharing the same household, had, to our knowledge, sole voting and investment power with respect to the shares listed next to the person’s name.
| Name(2) |
Number of shares beneficially owned(1) |
Percent
of class(1) |
||||||
| Apollo Funds and affiliates(3)(4) |
42,980,000 | 64.2 | % | |||||
| Layle K. Smith |
355,000 | * | ||||||
| Kyle D. Lorentzen |
229,000 | * | ||||||
| Robert B. Mahoney |
88,000 | * | ||||||
| Gail E. Lehman(5) |
— | * | ||||||
| Scott M. Croft |
148,080 | * | ||||||
| William H Brooks(6) |
226,200 | * | ||||||
| Eric L. Press |
— | — | ||||||
| Gareth Turner |
— | — | ||||||
| M. Ali Rashid |
— | — | ||||||
| Matthew H. Nord |
— | — | ||||||
| Matthew R. Michelini |
— | — | ||||||
| Scott Kleinman |
— | — | ||||||
| Alan H. Schumacher(6) |
12,000 | * | ||||||
| Thomas R. Miklich(6) |
12,000 | * | ||||||
| Robert Kasdin(6) |
12,000 | * | ||||||
| Richard B. Evans(6) |
10,000 | * | ||||||
| All executive officers and directors as a group (16 persons) |
1,092,280 | 1.6 | % | |||||
| * | Less than 1%. |
| (1) | Applicable percentage of ownership is based on 66,826,561 shares of our common stock outstanding as of February 28, 2011. Beneficial ownership is determined in accordance with rules of the Securities and Exchange Commission and means voting or investment power with respect to securities. Shares of our common stock issuable upon the exercise of stock options exercisable currently or within 60 days of February 28, 2011 are deemed outstanding and to be beneficially owned by the person holding such option for purposes of computing such person’s percentage ownership, but are not deemed outstanding for the purpose of computing the percentage ownership of any other person. Beneficial ownership amounts for Messrs. Smith, Lorentzen, Brooks, Croft, Schumacher, Miklich and Kasdin include 150,000, 147,500, 136,200, 98,080, 12,000, 12,000, and 12,000 shares, respectively, that may be acquired upon the exercise of options. |
| (2) | Unless otherwise indicated, the address of each person listed is c/o Noranda Aluminum Holding Corporation, 801 Crescent Centre Drive, Suite 600, Franklin, Tennessee 37067. |
| (3) | Represents all equity interests in Noranda HoldCo held of record by Apollo Investment Fund VI, L.P. (“AIF VI”) and Noranda Holdings, LP (“Holdings LP”). Also includes an aggregate of 140,000 shares issuable upon the exercise of outstanding options, issued to Apollo Management VI, L.P. (“Apollo Management VI”) and Apollo Alternative Assets, L.P. (“Alternative Assets”). Apollo Advisors VI, L.P. (“Advisors VI”) is the general partner of AIF VI, and Apollo Capital Management VI, LLC (“ACM VI”) is the general partner of Advisors VI. Apollo Principal Holdings I, L.P. (“Apollo Principal”) is the sole member of ACM VI and Apollo Principal Holdings, I GP, LLC (“Apollo Principal GP”) is the general partner of Apollo Principal. Noranda Holdings LLC (“Holdings LLC”) is the general partner of Holdings LP. Apollo Management VI serves as the investment manager of AIF VI and of Holdings LLC, and as such has voting and investment power over the shares of Noranda HoldCo held by AIF VI and Holdings LP. AIF VI Management, LLC (“AIF VI Management”) is the general partner of Apollo Management VI, Apollo Management, L.P. (“Apollo Management”) is the sole member and manager of AIF VI Management, and Apollo Management GP, LLC (“Apollo Management GP”) is the general partner of Apollo Management. Apollo International Management, L.P. (“AIM LP”) is the managing general partner of Alternative Assets, and Apollo International Management GP, LLC (“International Management GP”) is the general partner of AIM LP. Apollo Management Holdings, LP (“AMH”) is the sole member and manager of Apollo Management GP and International Management GP. Apollo Management Holdings GP, LLC (“AMH GP,” and together with the investment funds affiliated or managed by Apollo Management VI, the “Apollo Funds”), Alternative Assets, Advisors VI, ACM VI, Apollo Principal, Apollo Principal GP, Holdings LLC, Apollo Management VI, AIF VI Management, Apollo Management, Apollo Management GP, AIM LP, International Management GP and AMH, the “Apollo Entities”) is the general partner of AMH. Each of the Apollo Entities disclaims beneficial ownership of all shares of Noranda HoldCo held by the Apollo Funds or beneficially owned by Apollo Management VI or Alternative Assets, except to the extent of any pecuniary interest therein. The address of AIF VI, Advisors VI, ACM VI, Apollo Principal and Apollo Principal GP is 1 Manhattanville Road, Suite 201, Purchase, New York 10577. The address of Apollo Management VI, AIF VI Management, AMH, AMH GP, Apollo Management, Apollo Management GP, AIM LP and International Management GP is 9 West 57th Street, 43rd Floor, New York, NY 10019. The address of Alternative Assets is c/o Walkers SPV Limited, PO Box 908GT, Walker House, Mary Street, George Town, Grand Cayman, Cayman Islands, B.W.I. Leon Black, Joshua Harris and Marc Rowan are the members of the board of managers of Apollo Principal GP and AMH GP. Each of Messrs. Black, Harris and Rowan disclaims beneficial ownership of all shares of Noranda HoldCo held or beneficially owned by the Apollo Entities, except to the extent of any pecuniary interest therein. The address of Messrs. Black, Harris and Rowan is c/o Apollo Management, L.P., 9 West 57th Street, 43rd Floor, New York, New York 10019. Each of Messrs. Kleinman, Michelini, Nord, Press, Rashid and Turner are affiliated with Apollo, and disclaim beneficial ownership of any shares of Noranda HoldCo that may be deemed beneficially owned by any of the Apollo Entities, except to the extent of any pecuniary interest therein. The address of Messrs. Press, Turner, Rashid, Nord, Michelini and Kleinman is c/o Apollo Management, L.P., 9 West 57th Street, 43rd Floor, New York, New York 10019. |
| (4) | Excludes 60,000 unvested, cash-settled RSUs. |
| (5) | Excludes 26,762 unvested RSUs. |
| (6) | Excludes 10,000 unvested RSUs. |
134
Table of Contents
Equity Compensation Plan Information
The following table provides information as of December 31, 2010 regarding the number of shares of our common stock that may be issued under our equity compensation plans. For additional information on our equity compensation program, see the notes to our consolidated financial statements included elsewhere in this report.
| Plan category |
Number of securities to be issued upon exercise of outstanding options, warrants and rights(1) |
Weighted-average exercise price of outstanding options, warrants and rights |
Number of securities remaining available for future issuance under equity compensation plans (excluding securities reflected in the first column) (2) |
|||||||||
| Equity compensation plans approved by securityholders (3) |
2,227,056 | $ | 2.21 | 5,700,859 | ||||||||
| (1) | This amount includes shares subject to outstanding options. This amount does not include 103,524 outstanding non-vested restricted share units (“RSUs”) issued under The Noranda Aluminum Holding Corporation 2010 Long-Term Incentive Plan (“Noranda 2010 Long-Term Incentive Plan”) as RSUs do not constitute options, warrants or rights. However, the outstanding non-vested RSUs reduce the number of securities remaining available for future issuance. |
| (2) | The Amended and Restated Noranda Aluminum Holding Corporation 2007 Long-Term Incentive Plan (“Noranda 2007 Long-Term Incentive Plan”) and the Noranda 2010 Long-Term Incentive Plan provide that the number of shares of ccommon stock available for issuance there under 3,800,000 and 5,200,000, respectively. |
| (3) | We have no equity compensation plans that have not been approved by our stockholders. |
Changes in Control
We are unaware of any arrangement the operation of which may at a subsequent date result in a change in control of the Company.
135
Table of Contents
| ITEM 13. | CERTAIN RELATIONSHIPS AND RELATED TRANSACTIONS, AND DIRECTOR INDEPENDENCE |
Amended and Restated Securityholders Agreement
Noranda HoldCo, Apollo and those members of our management team who hold shares of our common stock, options to acquire shares of our common stock or restricted stock units are party to the amended and restated securityholders agreement, which provides for, among other things, a restriction on the transferability of each management member’s equity ownership in Noranda until May 19, 2011, piggyback registration rights, repurchase rights by Noranda HoldCo and Apollo in certain circumstances, demand registration rights for Apollo, and certain restrictions on each such person’s ability to compete with us or solicit our employees or customers.
See Item 10, “Directors, Executive Officers and Corporate Governance – Corporate Governance – Election of Directors,” for information regarding Apollo’s right to designate director nominees under the terms of the amended and restated securityholders agreement.
Apollo Management Agreement and Transaction Fee
On May 18, 2007, Apollo acquired the Noranda Aluminum business of Xstrata (Schweiz) A.G., which we refer to as the “Apollo Acquisition.” In connection with the Apollo Acquisition, we entered into a management consulting and advisory services agreement with our principal stockholders (affiliated with Apollo Management VI) for the provision of certain structuring, management and advisory services for an initial term ending on May 18, 2017. Terms of the agreement provided for annual fees of $2.0 million, payable in one lump sum annually. Upon completion of our initial public offering of common stock in second quarter of 2010, as permitted by the terms of that management agreement, Apollo terminated the agreement and received $13.5 million from us. This payment consisted of $1.0 million in management fees accrued in 2010 prior to the termination of the management agreement, and $12.5 million in accelerated management fees due upon termination of the management agreement.
Other Transactions
Apollo owns approximately 76% of Berry Plastics Corporation. We sell rolled aluminum products to subsidiaries of Berry Plastics under sales contracts which are renegotiated annually. The original contract was entered into prior to our affiliation with Apollo. Subsequent contracts were the result of arm’s-length negotiations, and we believe they are on terms at least as favorable to us as those we could have obtained from unaffiliated third parties at the time. During the fiscal year ended December 31, 2010, sales to these subsidiaries totaled $10.6 million. Mr. Smith, who became our Chief Executive Officer in March 2008, was the Executive Director at Berry Plastics Corporation from April 2007 to December 2007. Mr. Lorentzen, who became our Chief Operating Officer in May 2008 and resigned from employment with us on December 31, 2010, was the Vice President of Corporate Development at Berry Plastics Corporation from April 2007 to May 2008.
Review and Approval of Related Person Transactions
Our Audit Committee is responsible for the review and approval of all related-party transactions; however, the Audit Committee does not have a written policy regarding the approval of related person transactions. As part of its review and approval of a related person transaction, the Audit Committee considers:
| • | the nature of the related-person’s interest in the transaction; |
| • | the material terms of the transaction, including the amount involved and type of transaction; |
| • | the importance of the transaction to the related person and to us; |
| • | whether the transaction would impair the judgment of a director or executive officer to act in our best interest; and |
| • | any other matters the audit committee deems appropriate. |
Director Independence
The Board has affirmatively determined that Messrs. Evans, Schumacher, Miklich and Kasdin are independent within the meaning of the New York Stock Exchange (“NYSE”) listing standards. The Board has further determined that each of the members of the Audit Committee are independent within the meaning of the NYSE listing standards, and that the members of the Audit Committee meet the additional independence requirements of the NYSE applicable to audit committee members.
Messrs. Smith and Brooks are not considered independent due to their current and past employment relationships with us, and Messrs. Press, Turner, Rashid, Nord, Michelini and Kleinman are not considered independent due to their relationship with Apollo, our largest stockholder. As Apollo controls a majority of our voting stock, we qualify as a “controlled company” under NYSE listing standards and, accordingly, we are exempt from its requirements to have a majority of independent directors and a nominating/corporate governance committee and a compensation committee each composed entirely of independent directors.
136
Table of Contents
| ITEM 14. | PRINCIPAL ACCOUNTING FEES AND SERVICES |
Fees Paid to Ernst Young, LLP
Fees related to the 2009 and 2010 fiscal years payable to Ernst & Young, LLP (“E&Y”) for professional services rendered to Noranda HoldCo and its subsidiaries were (in millions):
| 2009 | 2010 | |||||||
| $ | $ | |||||||
| Audit fees |
2.3 | 1.9 | ||||||
| Audit-related fees |
0.1 | 0.1 | ||||||
| Tax fees |
0.4 | 0.1 | ||||||
| Total |
2.8 | 2.1 | ||||||
Audit Fees. Audit fees relate to professional services rendered by E&Y for the audit of our consolidated financial statements and internal control over financial reporting, for the reviews of the unaudited interim consolidated financial statements included in our Quarterly Reports on Form 10-Q, and for services normally provided by our independent registered public accounting firm in connection with statutory or regulatory filings or engagements, including reviews of registration statements.
Audit-Related Fees. Audit-related fees were related to the performance of the audits of the financial statements of the Company’s employee benefit plans.
Tax Fees. Tax fees were related to services for tax compliance, tax planning and tax advice.
Audit Committee Pre-Approval Procedures
The Audit Committee Charter provides that the Audit Committee preapproves all audit and permitted non-audit services provided by the independent public registered accounting firm, subject to a “de minimis” exception provided by law for limited services that meet specified conditions and that are approved by the Audit Committee prior to completion of the audit. In addition, the Audit Committee Charter provides that the Audit Committee may delegate the authority to preapprove audit and permitted non-audit services to a subcommittee consisting of one or more members of the Audit Committee, provided that any such preapprovals are presented to the full committee at its next scheduled meeting. The Audit Committee did not delegate this authority to any member of the committee in 2010.
137
Table of Contents
| ITEM 15. | EXHIBITS AND FINANCIAL STATEMENT SCHEDULES |
| (a) | (1) Financial Statement Schedules |
No financial schedules are required under the related instructions, or are inapplicable and therefore have been omitted.
| (a) | (2) Exhibits |
See the Index to Exhibits, which appear on pages 140 through 141 of this report.
138
Table of Contents
Pursuant to the requirements of Section 13 or 15(d) of the Securities Exchange Act of 1934, the registrant has duly caused this report to be signed on its behalf by the undersigned, thereunto duly authorized on March 7, 2011.
| NORANDA ALUMINUM HOLDING CORPORATION | ||
| By: | /S/ LAYLE K. SMITH | |
| Name: | Layle K. Smith | |
| Title: | President and Chief Executive Officer | |
POWER OF ATTORNEY
Each of the undersigned directors and officers of Noranda Aluminum Holding Corporation hereby constitutes and appoints Layle K. Smith, Robert B. Mahoney and Gail E. Lehman, and each of them, his true and lawful attorneys-in-fact and agents with full power of substitution and resubstitution, for him and his name, place and stead, in any and all capacities, to execute any and all amendments to this annual report, and to cause the same to be filed with all exhibits thereto, and all documents in connection therewith, with the Securities and Exchange Commission, granting unto said attorneys-in-fact and agents, and each of them, full power and authority to do and perform each and every act and thing requisite and desirable to be done in and about the premises as fully and to all intents and purposes as the undersigned might or could do in person, hereby ratifying and confirming all acts and things that said attorneys-in-fact and agents or any of them, or their or his substitute or substitutes may lawfully do or cause to be done by virtue hereof.
Pursuant to the requirements of the Securities Exchange Act of 1934, this report has been signed below by the following persons on behalf of the registrant and in the capacities and on the dates indicated.
| Signature |
Title |
Date | ||
| /S/ LAYLE K. SMITH Layle K. Smith |
President, Chief Executive Officer and Director (Principal Executive Officer) |
March 7, 2011 | ||
| /S/ ROBERT B. MAHONEY Robert B. Mahoney |
Chief Financial Officer (Principal Financial Officer and Principal Accounting Officer) |
March 7, 2011 | ||
| /S/ WILLIAM H. BROOKS William H. Brooks |
Director | March 7, 2011 | ||
| /S/ ERIC L. PRESS Eric L. Press |
Director | March 7, 2011 | ||
| /S/ GARETH TURNER Gareth Turner |
Director | March 7, 2011 | ||
| /S/ M. ALI RASHID M. Ali Rashid |
Director | March 7, 2011 | ||
| /S/ MATTHEW H. NORD Matthew H. Nord |
Director | March 7, 2011 | ||
| /S/ MATTHEW R. MICHELINI Matthew R. Michelini |
Director | March 7, 2011 | ||
| /S/ SCOTT KLEINMAN Scott Kleinman |
Director | March 7, 2011 | ||
| /S/ ALAN SCHUMACHER Alan Schumacher |
Director | March 7, 2011 | ||
| /S/ THOMAS MIKLICH Thomas Miklich |
Director | March 7, 2011 | ||
| /S/ ROBERT KASDIN Robert Kasdin |
Director | March 7, 2011 | ||
| /S/ RICHARD B. EVANS Richard B. Evans |
Director | March 7, 2011 | ||
139
Table of Contents
INDEX TO EXHIBITS
| Exhibit |
Description | |
| 2.1 | Stock Purchase Agreement, dated April 10, 2007, by and among Noranda Aluminum Acquisition Corporation, Noranda Finance, Inc. and Xstrata (Schweiz) A.G. (incorporated by reference to Exhibit 2.1 of Noranda Aluminum Holding Corporation’s Registration Statement on Form S-4 filed on January 31, 2008) | |
| 3.1 | Amended and Restated Certificate of Incorporation of Noranda Aluminum Holding Corporation (incorporated by reference to Exhibit 4.1 of the Company’s Registration Statement on Form S-8 (File No. 333-166947), filed on May 19, 2010) | |
| 3.2 | Amended and Restated By-Laws, of Noranda Aluminum Holding Corporation (incorporated by reference to Exhibit 4.2 of the Company’s Registration Statement on Form S-8 (File No. 333-166947), filed on May 19, 2010) | |
| 4.1 | Indenture, dated May 18, 2007, by and among Noranda Aluminum Acquisition Corporation, the Guarantors named therein, and Wells Fargo Bank, as Trustee (incorporated by reference to Exhibit 4.1 of Noranda Aluminum Holding Corporation’s Registration Statement on Form S-4 filed on January 31, 2008) | |
| 4.2 | Supplemental Indenture, dated as of September 7, 2007, among Noranda Aluminum Holding Corporation, Noranda Aluminum Acquisition Corporation and Wells Fargo Bank, National Association, as Trustee (incorporated by reference to Exhibit 4.2 of Noranda Aluminum Holding Corporation’s Registration Statement on Form S-4 filed on January 31, 2008) | |
| 4.3 | Form of Senior Floating Rate Note due 2015 (incorporated by reference to Exhibit 4.4 of Noranda Aluminum Holding Corporation’s Registration Statement on Form S-4 filed on January 31, 2008) | |
| 4.4 | Form of common stock certificate of the Company (incorporated by reference to Exhibit 4.6 of Amendment No. 6 to the Company’s Registration Statement on Form S-1 (File No. 333-150760), filed on April 26, 2010) | |
| 10.1 | Credit Agreement, dated as of May 18, 2007, among Noranda Aluminum Holding Corporation, Noranda Aluminum Acquisition Corporation, the lenders party thereto from time to time, Merrill Lynch Capital Corporation, as Administrative Agent and the other parties thereto (incorporated by reference to Exhibit 10.1 of Noranda Aluminum Holding Corporation’s Registration Statement on Form S-4 filed on January 31, 2008) | |
| 10.2 | Guarantee and Collateral Agreement, dated as of May 18, 2007, among Noranda Aluminum Holding Corporation, Noranda Aluminum Acquisition Corporation, each of its Subsidiaries identified therein, and Merrill Lynch Capital Corporation, as Administrative Agent and Collateral Agent (incorporated by reference to Exhibit 10.2 of Noranda Aluminum Holding Corporation’s Registration Statement on Form S-4 filed on January 31, 2008) | |
| 10.3 | Management Incentive Compensation Plan Term Sheet, dated May 24, 2007, between William Brooks and Apollo Management VI, L.P. (incorporated by reference to Exhibit 10.3 of Noranda Aluminum Holding Corporation’s Registration Statement on Form S-4 filed on January 31, 2008) | |
| 10.4 | Amended and Restated Noranda Aluminum Holding Corporation 2007 Long-Term Incentive Plan, dated April 16, 2010 (incorporated by reference to Exhibit 10.1 of Noranda Aluminum Holding Corporation’s Current Report on Form 8-K filed on April 21, 2010) | |
| 10.5 | Non-Qualified Stock Option Agreement, dated as of May 29, 2007, between Noranda Aluminum Holding Corporation and William Brooks (incorporated by reference to Exhibit 10.5 of Noranda Aluminum Holding Corporation’s Registration Statement on Form S-4 filed on January 31, 2008) | |
| 10.6 | Form of Non Qualified Stock Option Agreement (Management Holders) (incorporated by reference to Exhibit 10.6 of Noranda Aluminum Holding Corporation’s Registration Statement on Form S-4 filed on January 31, 2008) | |
| 10.7 | Form of Subscription Agreement (incorporated by reference to Exhibit 10.7 of Noranda Aluminum Holding Corporation’s Registration Statement on Form S-4 filed on January 31, 2008) | |
| 10.8 | Form of Non Qualified Stock Option Agreement (Investor Director Providers) (incorporated by reference to Exhibit 10.8 of Noranda Aluminum Holding Corporation’s Registration Statement on Form S-4 filed on January 31, 2008) | |
| 10.9 | Management Equity Investment and Incentive Term Sheet, dated February 22, 2008, by and among Noranda Aluminum, Inc., Noranda Aluminum Holding Corporation and Layle K. Smith (incorporated by reference to Exhibit 10.9 of Amendment No. 1 to Noranda Aluminum Holding Corporation’s Registration Statement on Form S-4 filed on April 11, 2008) | |
| 10.10 | Amended and Restricted Non Qualified Stock Option Agreement, dated as of November 12, 2009, between Noranda Aluminum Holding Corporation and Layle K. Smith (incorporated by reference to Exhibit 10.3 of Noranda Aluminum Holding Corporation’s Quarterly Report on Form 10-Q filed on November 16, 2009) | |
| 10.11 | Management Equity Investment and Incentive Term Sheet, dated May 8, 2008, by and among Noranda Aluminum, Inc., Noranda Aluminum Holding Corporation and Kyle D. Lorentzen (incorporated by reference to Exhibit 10.11 of Noranda Aluminum Holding Corporation’s Annual Report on Form 10-K filed on February 25, 2009) | |
| 10.12 | Special Mining Lease No. 165, dated October 1, 2004, granted by the Government of Jamaica to St. Ann Bauxite Limited (incorporated by reference to Exhibit 10.13 of Noranda Aluminum Holding Corporation’s Annual Report on Form 10-K filed on February 25, 2009) | |
| 10.13 | Agreement, dated as of December 14, 2004, by and between Union Electric Company d/b/a AmerenUE and Noranda Aluminum, Inc. (incorporated by reference to Exhibit 10.15 of Noranda Aluminum Holding Corporation’s Annual Report on Form 10-K filed on February 25, 2009) | |
| 10.14 | Amendment to the Management Equity Investment and Incentive Term Sheet, dated November 12, 2009, between Noranda Aluminum Holding Corporation and Layle K. Smith (incorporated by reference to Exhibit 10.2 of Noranda Aluminum Holding Corporation’s Quarterly Report on Form 10-Q filed on November 16, 2009) | |
| 10.15 | Amended and Restated Non Qualified Stock Option Agreement, dated as of November 12, 2009, between Noranda Aluminum Holding Corporation and Kyle D. Lorentzen (incorporated by reference to Exhibit 10.4 of Noranda Aluminum Holding Corporation’s Quarterly Report on Form 10-Q filed on November 16, 2009) | |
| 10.16 | Form of Amended and Restated Non Qualified Stock Option Agreement (Management Holders) (incorporated by reference to Exhibit | |
140
Table of Contents
| Exhibit |
Description | |
| 10.5 of Noranda Aluminum Holding Corporation’s Quarterly Report on Form 10-Q filed on November 16, 2009) | ||
| 10.17 | Form of Non Qualified Stock Option Agreement (Management Holders) (incorporated by reference to Exhibit 10.6 of Noranda Aluminum Holding Corporation’s Quarterly Report on Form 10-Q filed on November 16, 2009) | |
| 10.18 | 2010 Incentive Award Plan (incorporated by reference to Exhibit 10.1 of the Noranda Aluminum Holding Corporation’s Current Report on Form 8-K filed on May 10, 2010) | |
| 10.19 | Senior Executive Bonus Plan (incorporated by reference to Exhibit 10.2 of the Noranda Aluminum Holding Corporation’s Current Report on Form 8-K filed on May 10, 2010) | |
| 10.20 | Amended and Restated Securityholders Agreement, by and among Noranda Aluminum Holding Corporation and the other Holders that are parties thereto, dated as of May 19, 2010 (incorporated by reference to Exhibit 10.1 of the Noranda Aluminum Holding Corporation’s Current Report on Form 8-K filed on May 19, 2010) | |
| 10.21 | Amended Establishment Agreement, dated as of June 24, 2010, between the Government of Jamaica and Noranda Bauxite Limited (incorporated by reference to Exhibit 10.5 of Noranda Aluminum Holding Corporation’s Quarterly Report on Form 10-Q filed on July 30, 2010) | |
| 10.22† | Amended and Restated Management Equity Investment and Incentive Term Sheet, dated October 26, 2010, between Noranda Aluminum Holding Corporation and Layle K. Smith (incorporated by reference to Exhibit 10.1 of Noranda Aluminum Holding Corporation’s Quarterly Report on Form 10-Q filed on October 29, 2010) | |
| 10.23 | Amended and Restated Management Equity Investment and Incentive Term Sheet, dated October 26, 2010, between Noranda Aluminum Holding Corporation and Kyle D. Lorentzen (incorporated by reference to Exhibit 10.2 of Noranda Aluminum Holding Corporation’s Quarterly Report on Form 10-Q filed on October 29, 2010) | |
| 10.24 | Amended and Restated Management Equity Investment and Incentive Term Sheet, dated October 26, 2010, between Noranda Aluminum Holding Corporation and Robert B. Mahoney (incorporated by reference to Exhibit 10.3 of Noranda Aluminum Holding Corporation’s Quarterly Report on Form 10-Q filed on October 29, 2010) | |
| 10.25 | Amended and Restated Management Equity Investment and Incentive Term Sheet, dated October 26, 2010, between Noranda Aluminum Holding Corporation and Gail E. Lehman (incorporated by reference to Exhibit 10.4 of Noranda Aluminum Holding Corporation’s Quarterly Report on Form 10-Q filed on October 29, 2010) | |
| 10.26 | Equity Investment and Incentive Term Sheet, dated October 26, 2010, between Noranda Aluminum Holding Corporation and Alan K Brown (incorporated by reference to Exhibit 10.5 of Noranda Aluminum Holding Corporation’s Quarterly Report on Form 10Q filed on October 29, 2010) | |
| 10.27 | Equity Investment and Incentive Term Sheet, dated October 26, 2010, between Noranda Aluminum Holding Corporation and Scott Croft (incorporated by reference to Exhibit 10.6 of Noranda Aluminum Holding Corporation’s Quarterly Report on Form 10-Q filed on October 29, 2010) | |
| 10.28 | Management Incentive Term Sheet, dated November 12, 2010, between Peter Hartland and Noranda Aluminum Holding Corporation (incorporated by reference to Exhibit 10.1 of the Noranda Aluminum Holding Corporation’s Current Report on Form 8-K filed on November 16, 2010) | |
| 10.29 | Separation of Employment Agreement and General Release between Kyle D. Lorentzen and Noranda Aluminum Holding Corporation, dated as of November 15, 2010 (incorporated by reference to Exhibit 10.2 of the Noranda Aluminum Holding Corporation’s Current Report on Form 8-K filed on November 16, 2010) | |
| 10.30 | Separation of Employment Agreement and General Release between Alan K. Brown and Noranda Aluminum Holding Corporation, dated as of November 15, 2010 (incorporated by reference to Exhibit 10.3 of the Noranda Aluminum Holding Corporation’s Current Report on Form 8-K filed on November 16, 2010) | |
| 10.31 | Consulting Agreement between Alan K. Brown and Noranda Aluminum Holding Corporation, dated as of November 15, 2010 (incorporated by reference to Exhibit 10.4 of the Noranda Aluminum Holding Corporation’s Current Report on Form 8-K filed on November 16, 2010) | |
| 21.1 | List of Subsidiaries | |
| 23.1 | Consent of Ernst & Young LLP | |
| 23.2 | Consent of Deloitte & Touche LLP (New Orleans) | |
| 23.3 | Consent of Deloitte & Touche (Jamaica) | |
| 23.4 | Consent of CRU | |
| 24.1 | Power of Attorney (included in signature pages) | |
| 31.1 | Chief Executive Officer Certification | |
| 31.2 | Chief Financial Officer Certification | |
| 32.1 | Certification of Chief Executive Officer and Chief Financial Officer | |
| † | Certain portions of this document have been omitted pursuant to a confidential treatment request. |
141