Attached files
| file | filename |
|---|---|
| 8-K - 8-K - MAINSOURCE FINANCIAL GROUP | a12-4933_18k.htm |
Exhibit 99.1
|
|
b 1 Meeting the financial needs of our customers...for life! |

|
|
We will achieve our vision by: Disclosure Regarding Forward Looking Statements This presentation may include forward-looking statements regarding, among other things, MainSource’s business strategy, financial position and prospects, dividend policy, business results, strategic initiatives, credit quality including reserve levels, capital expenditures, and various other matters. These statements can be identified by the use of forward-looking terminology such as “believes,” “estimates,” “expects,” “intends,” “may,” “will,” “should,” “could” or “anticipates”, or the negative or other variation of these similar words, or by discussions of strategy or risks and uncertainties. These statements are based on current expectations of future events. Actual results could differ materially from those indicated by these statements because the realization of those results is subject to many risks and uncertainties, and because the assumptions underlying these statements could prove inaccurate. Factors that could cause actual results to differ materially from such forward-looking statements include, without limitation, general economic conditions, legislative and regulatory initiatives, changes in the quality of MainSource’s loan portfolios, and other risks set forth in MainSource’s Annual Report on Form 10-K for the fiscal year ending December 31, 2010, on file with the SEC. MainSource does not undertake to update any forward looking statements as a result of new information or future events or developments. 2 |
|
|
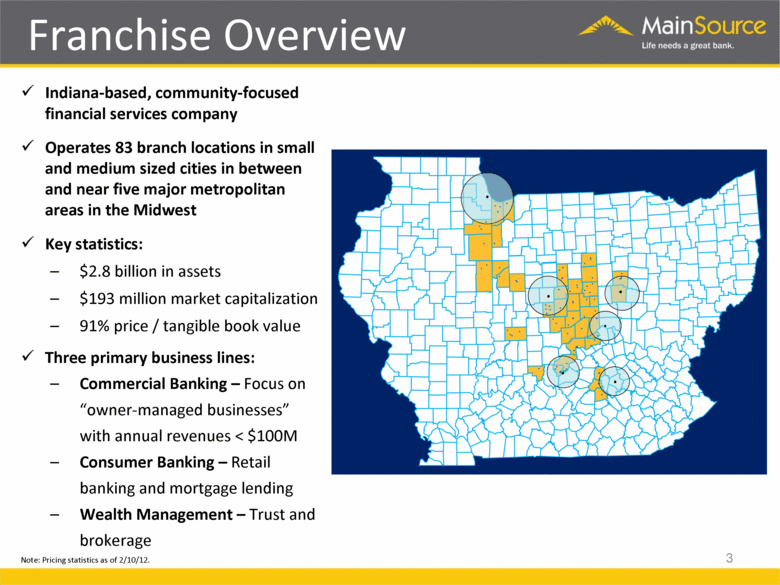
Indiana-based, community-focused financial services company Operates 83 branch locations in small and medium sized cities in between and near five major metropolitan areas in the Midwest Key statistics: $2.8 billion in assets $193 million market capitalization 91% price / tangible book value Three primary business lines: Commercial Banking – Focus on “owner-managed businesses” with annual revenues < $100M Consumer Banking – Retail banking and mortgage lending Wealth Management – Trust and brokerage Franchise Overview 3 Note: Pricing statistics as of 2/10/12. |
|
|
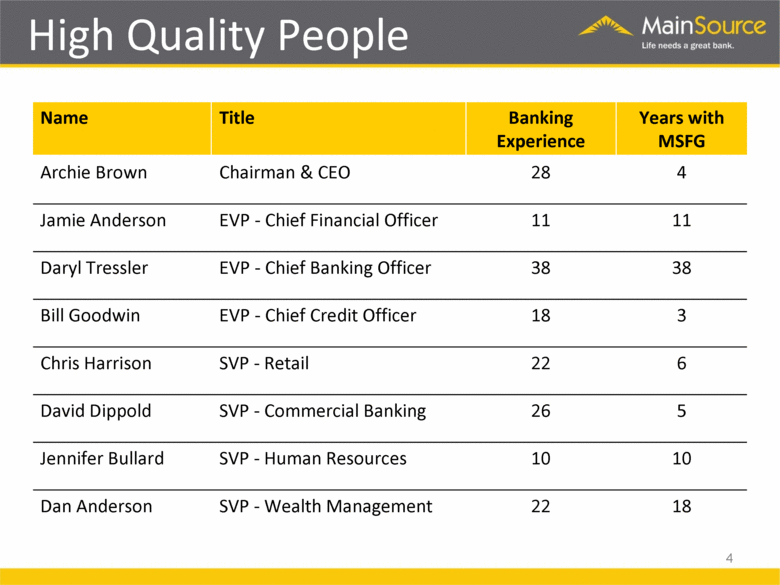
Name Title Banking Experience Years with MSFG Archie Brown Chairman & CEO 28 4 Jamie Anderson EVP - Chief Financial Officer 11 11 Daryl Tressler EVP - Chief Banking Officer 38 38 Bill Goodwin EVP - Chief Credit Officer 18 3 Chris Harrison SVP - Retail 22 6 David Dippold SVP - Commercial Banking 26 5 Jennifer Bullard SVP - Human Resources 10 10 Dan Anderson SVP - Wealth Management 22 18 4 High Quality People |
|
|
Local leadership and involvement Drive growth in core checking accounts and checking related services Target mass market consumers and “owner-managed” businesses in our geographical footprint Expand core services to existing households Increase market share in existing and adjacent footprints Focus on execution 5 Core Strategy |
|
|
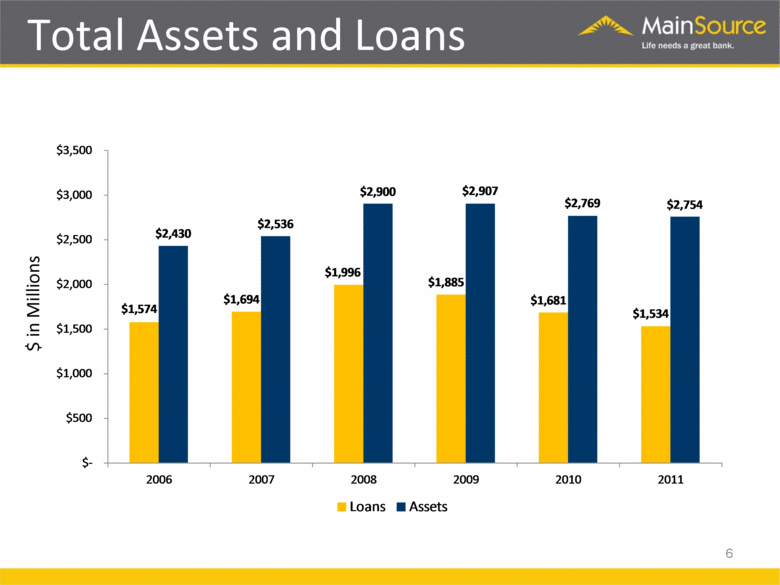
$ in Millions 6 Total Assets and Loans $1,574 $1,694 $1,996 $1,885 $1,681 $1,534 $2,430 $2,536 $2,900 $2,907 $2,769 $2,754 $- $500 $1,000 $1,500 $2,000 $2,500 $3,000 $3,500 2006 2007 2008 2009 2010 2011 Loans Assets |
|
|
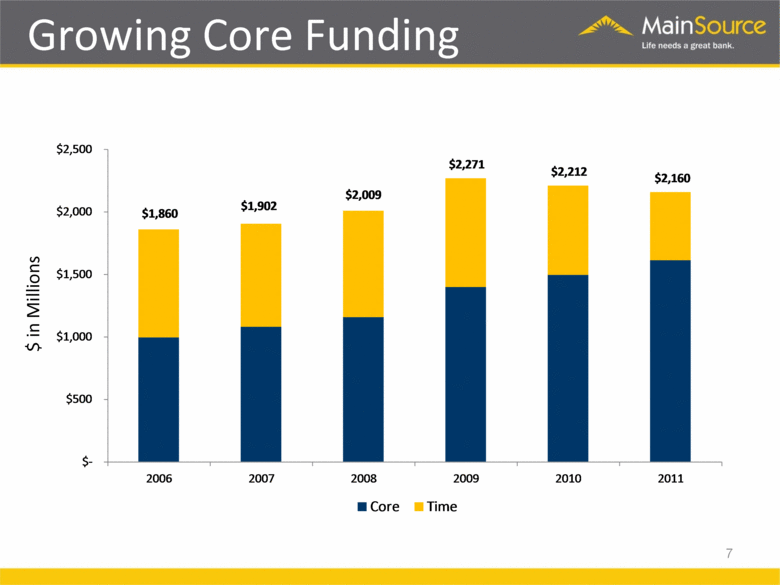
$ in Millions 7 Growing Core Funding $1,860 $1,902 $2,009 $2,271 $2,212 $2,160 $- $500 $1,000 $1,500 $2,000 $2,500 2006 2007 2008 2009 2010 2011 Core Time |
|
|
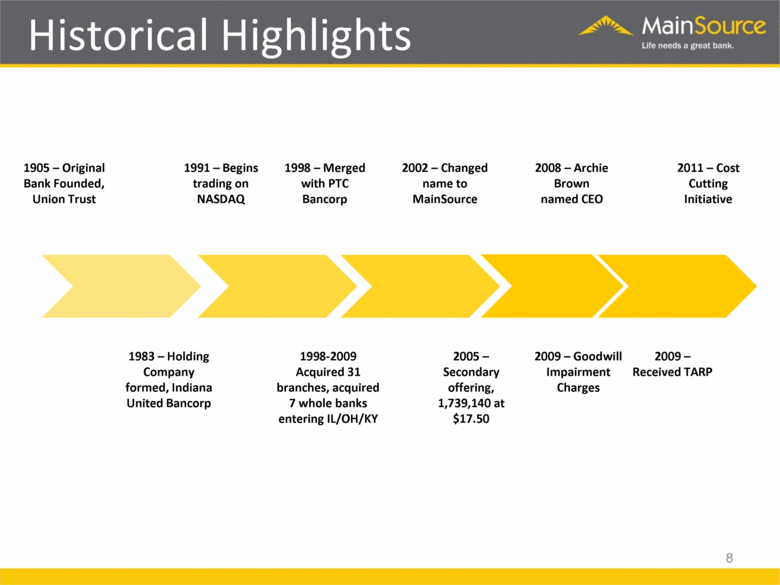
8 Historical Highlights 1905 – Original Bank Founded, Union Trust 1983 – Holding Company formed, Indiana United Bancorp 1991 – Begins trading on NASDAQ 1998 – Merged with PTC Bancorp 1998-2009 Acquired 31 branches, acquired 7 whole banks entering IL/OH/KY 2002 – Changed name to MainSource 2005 – Secondary offering, 1,739,140 at $17.50 2008 – Archie Brown named CEO 2009 – Received TARP 2009 – Goodwill Impairment Charges 2011 – Cost Cutting Initiative |
|
|
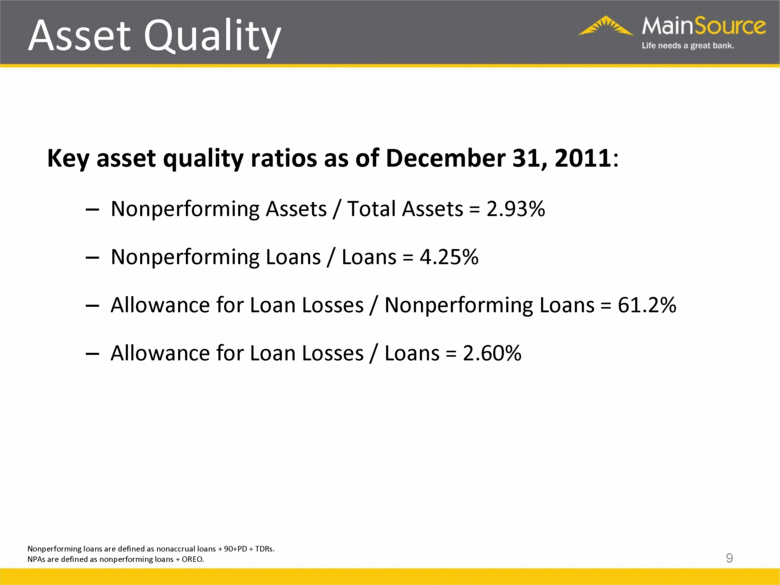
Key asset quality ratios as of December 31, 2011: Nonperforming Assets / Total Assets = 2.93% Nonperforming Loans / Loans = 4.25% Allowance for Loan Losses / Nonperforming Loans = 61.2% Allowance for Loan Losses / Loans = 2.60% Nonperforming loans are defined as nonaccrual loans + 90+PD + TDRs. NPAs are defined as nonperforming loans + OREO. 9 Asset Quality |
|
|
10 Loan Portfolio Total Loans $1,534 2011 ($ in Millions) Residential RE, $578 , 38% Other CRE, $541 , 35% Hotel, $146 , 10% C&I, $114 , 7% Agricultural, $67 , 4% Consumer, $57 , 4% C&D, $31 , 2% |

|
|
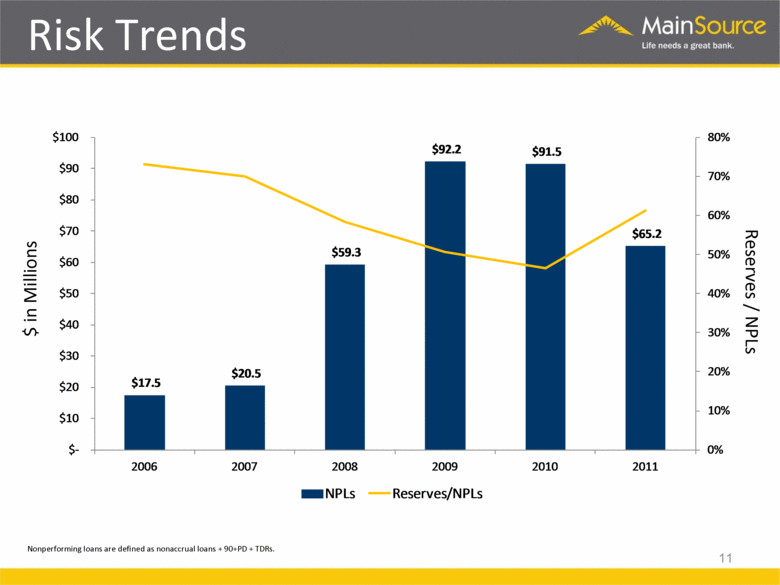
$ in Millions 11 Reserves / NPLs Risk Trends Nonperforming loans are defined as nonaccrual loans + 90+PD + TDRs. $17.5 $20.5 $59.3 $92.2 $91.5 $65.2 0% 10% 20% 30% 40% 50% 60% 70% 80% $- $10 $20 $30 $40 $50 $60 $70 $80 $90 $100 2006 2007 2008 2009 2010 2011 NPLs Reserves/NPLs |
|
|
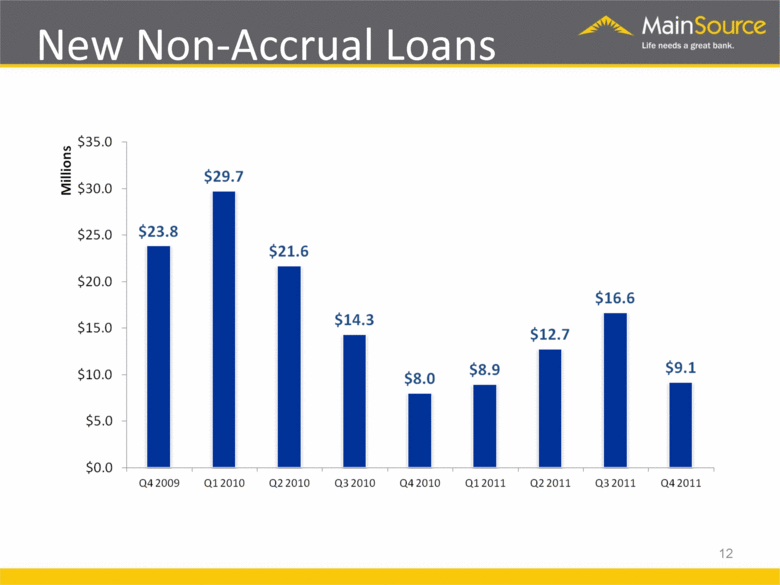
New Non-Accrual Loans 12 Millions $35.0 $30.0 $25.0 $15.0 $10.0 $5.0 $0.0 $23.8 $29.7 $21.6 $14.3 $8.0 $8.9 $12.7 $16.6 $9.1 Q4 2009 Q1 2010 Q2 2010 Q3 2010 Q4 2010 Q1 2011 Q2 2011 Q3 2011 Q4 2011 |
|
|
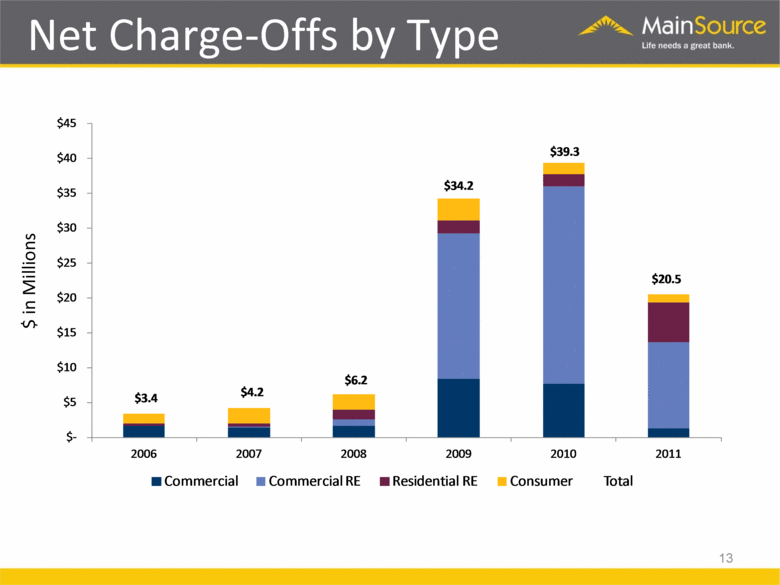
$ in Millions 13 Net Charge-Offs by Type $3.4 $4.2 $6.2 $34.2 $39.3 $20.5 $- $5 $10 $15 $20 $25 $30 $35 $40 $45 2006 2007 2008 2009 2010 2011 Commercial Commercial RE Residential RE Consumer Total |
|
|
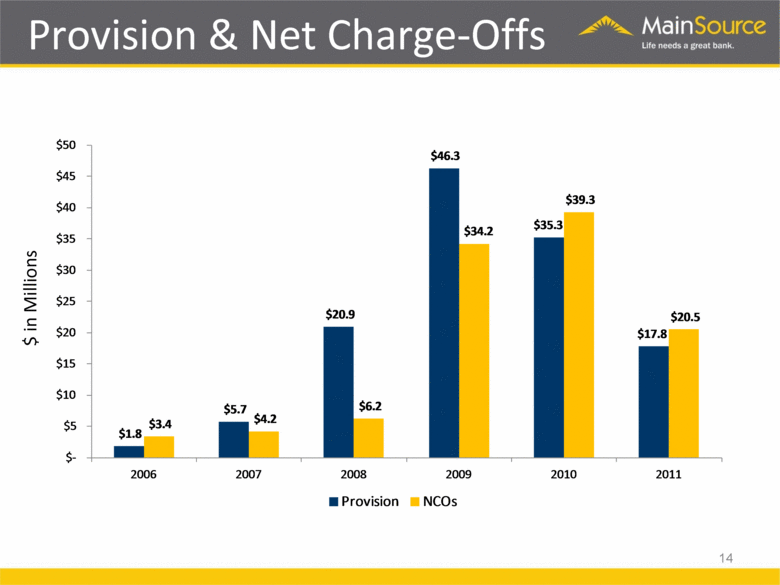
$ in Millions 14 Provision & Net Charge-Offs $1.8 $5.7 $20.9 $46.3 $35.3 $17.8 $3.4 $4.2 $6.2 $34.2 $39.3 $20.5 $- $5 $10 $15 $20 $25 $30 $35 $40 $45 $50 2006 2007 2008 2009 2010 2011 Provision NCOs |
|
|
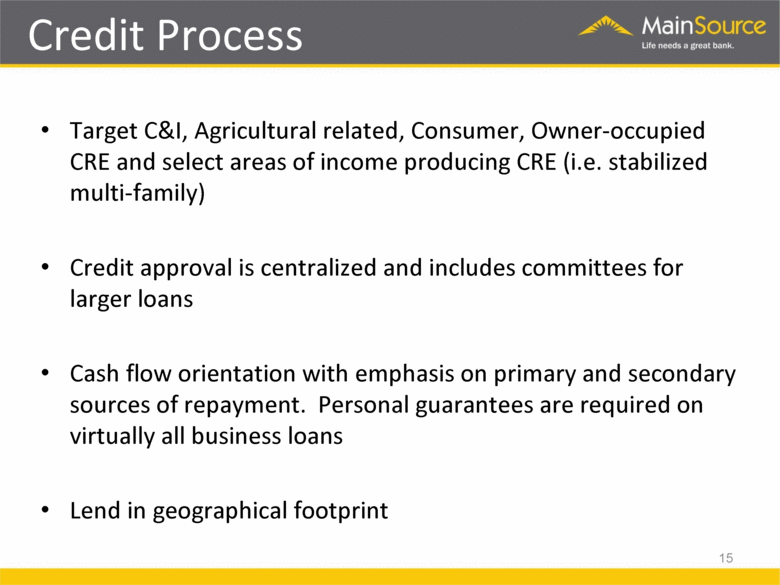
Target C&I, Agricultural related, Consumer, Owner-occupied CRE and select areas of income producing CRE (i.e. stabilized multi-family) Credit approval is centralized and includes committees for larger loans Cash flow orientation with emphasis on primary and secondary sources of repayment. Personal guarantees are required on virtually all business loans Lend in geographical footprint 15 Credit Process |
|
|
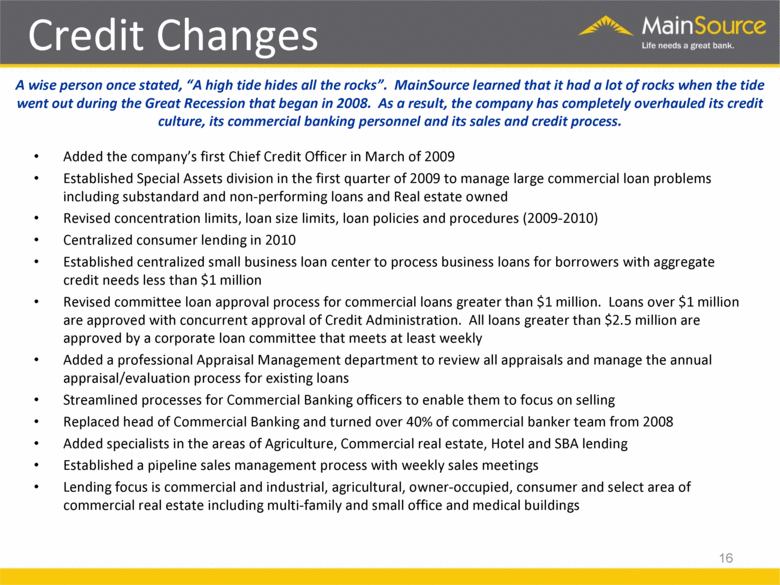
A wise person once stated, “A high tide hides all the rocks”. MainSource learned that it had a lot of rocks when the tide went out during the Great Recession that began in 2008. As a result, the company has completely overhauled its credit culture, its commercial banking personnel and its sales and credit process. Added the company’s first Chief Credit Officer in March of 2009 Established Special Assets division in the first quarter of 2009 to manage large commercial loan problems including substandard and non-performing loans and Real estate owned Revised concentration limits, loan size limits, loan policies and procedures (2009-2010) Centralized consumer lending in 2010 Established centralized small business loan center to process business loans for borrowers with aggregate credit needs less than $1 million Revised committee loan approval process for commercial loans greater than $1 million. Loans over $1 million are approved with concurrent approval of Credit Administration. All loans greater than $2.5 million are approved by a corporate loan committee that meets at least weekly Added a professional Appraisal Management department to review all appraisals and manage the annual appraisal/evaluation process for existing loans Streamlined processes for Commercial Banking officers to enable them to focus on selling Replaced head of Commercial Banking and turned over 40% of commercial banker team from 2008 Added specialists in the areas of Agriculture, Commercial real estate, Hotel and SBA lending Established a pipeline sales management process with weekly sales meetings Lending focus is commercial and industrial, agricultural, owner-occupied, consumer and select area of commercial real estate including multi-family and small office and medical buildings Credit Changes 16 |
|
|
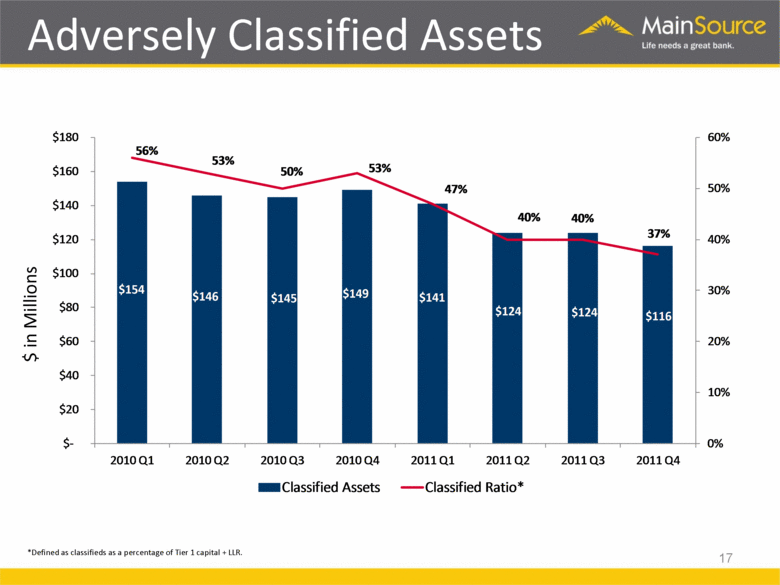
*Defined as classifieds as a percentage of Tier 1 capital + LLR. $ in Millions 17 Adversely Classified Assets $154 $146 $145 $149 $141 $124 $124 $116 56% 53% 50% 53% 47% 40% 40% 37% 0% 10% 20% 30% 40% 50% 60% $- $20 $40 $60 $80 $100 $120 $140 $160 $180 2010 Q1 2010 Q2 2010 Q3 2010 Q4 2011 Q1 2011 Q2 2011 Q3 2011 Q4 Classified Assets Classified Ratio* |
|
|
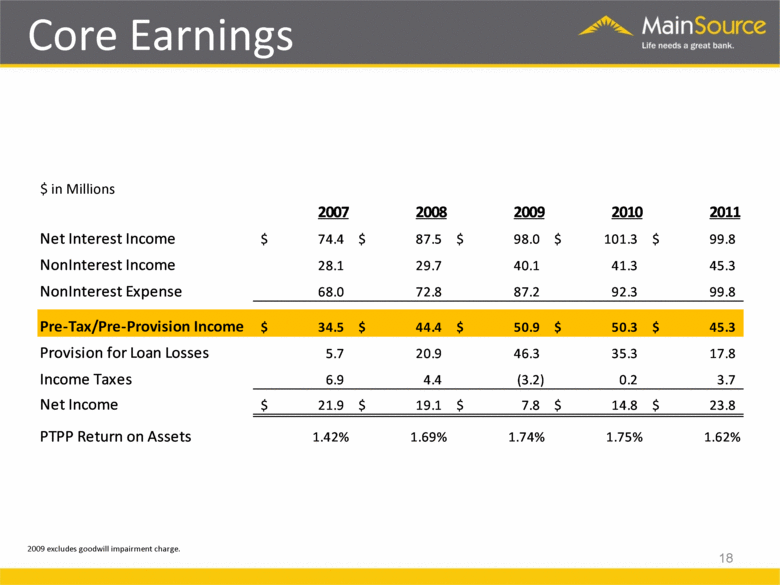
$ in Millions 2009 excludes goodwill impairment charge. 18 Core Earnings 2007 2008 2009 2010 2011 Net Interest Income 74.4 $ 87.5 $ 98.0 $ 101.3 $ 99.8 $ NonInterest Income 28.1 29.7 40.1 41.3 45.3 NonInterest Expense 68.0 72.8 87.2 92.3 99.8 Pre-Tax/Pre-Provision Income 34.5 $ 44.4 $ 50.9 $ 50.3 $ 45.3 $ Provision for Loan Losses 5.7 20.9 46.3 35.3 17.8 Income Taxes 6.9 4.4 (3.2) 0.2 3.7 Net Income 21.9 $ 19.1 $ 7.8 $ 14.8 $ 23.8 $ PTPP Return on Assets 1.42% 1.69% 1.74% 1.75% 1.62% |
|
|
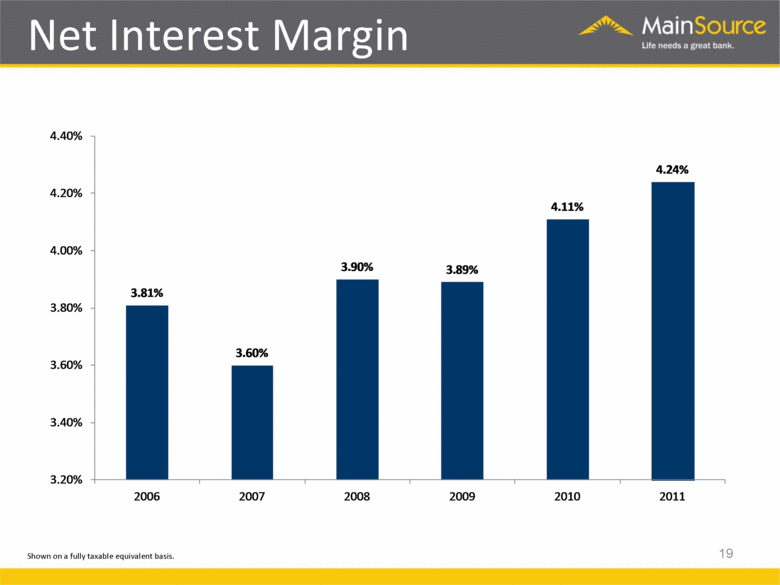
Shown on a fully taxable equivalent basis. 19 Net Interest Margin 3.81% 3.60% 3.90% 3.89% 4.11% 4.24% 3.20% 3.40% 3.60% 3.80% 4.00% 4.20% 4.40% 2006 2007 2008 2009 2010 2011 |
|
|
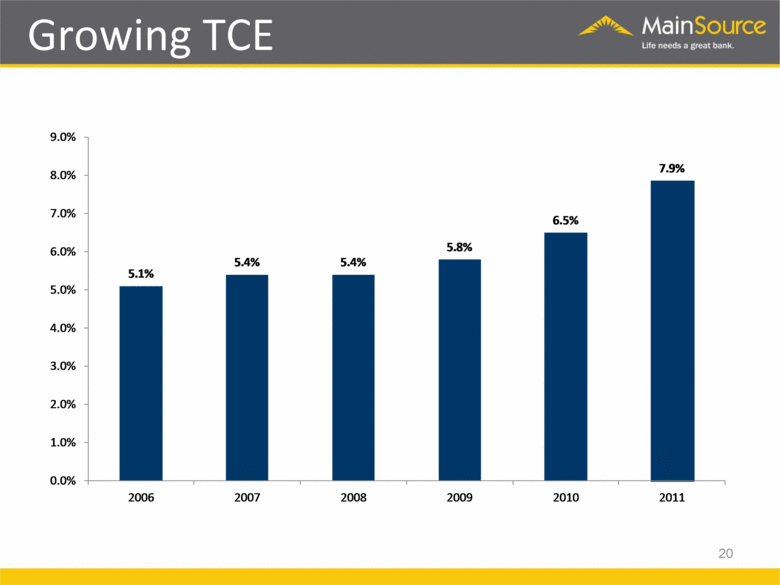
20 Growing TCE 5.1% 5.4% 5.4% 5.8% 6.5% 7.9% 0.0% 1.0% 2.0% 3.0% 4.0% 5.0% 6.0% 7.0% 8.0% 9.0% 2006 2007 2008 2009 2010 2011 |
|
|
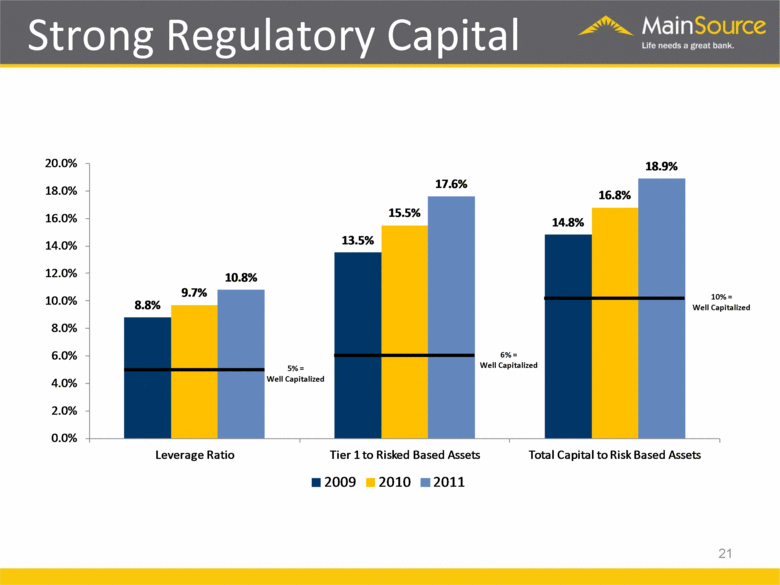
5% = Well Capitalized 6% = Well Capitalized 10% = Well Capitalized 21 Strong Regulatory Capital 8.8% 13.5% 14.8% 9.7% 15.5% 16.8% 10.8% 17.6% 18.9% 0.0% 2.0% 4.0% 6.0% 8.0% 10.0% 12.0% 14.0% 16.0% 18.0% 20.0% Leverage Ratio Tier 1 to Risked Based Assets Total Capital to Risk Based Assets 2009 2010 2011 |
|
|
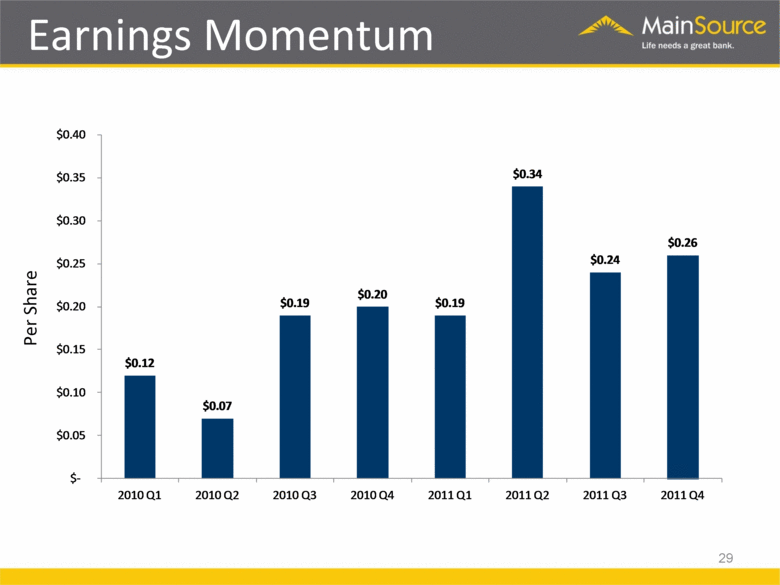
2011 earnings increased by 80% over 2010 due to improved credit quality and lower provision Fourth quarter earnings of $6.0 million, or $0.26 per common share Meaningful improvement in cost structure Efficiency project completed = $6.9 million of cost savings (16% reduction in FTEs) 4Q Non-interest expense lower by 7.9% from last year (ex. expenses related to the efficiency project) NPAs declined 21.6% from 12/31/10 (13.4% on an annualized basis from linked quarter) New non-performing loans slowed to $9 million Tangible common equity improved to 7.86% at 12/31/11 (+136 basis points from 12/31/10) Consumer and business loan pipelines building for the first time since the 2008 recession began 2012 incremental impact of efficiency project is anticipated to be $4.5 million pre-tax in expense savings and expected increases in non-interest income in service charges and check card income 4Q Core earnings run rate of $0.26 per common share 2011 Highlights 22 |

|
|
Improve credit quality metrics to top quartile of peer group Finalize plan for TARP repurchase Continue to aggressively grow checking household base Continue build-out of the Columbus, Indiana market Expand commercial loan balances 23 2012 Strategic Priorities |
|
|
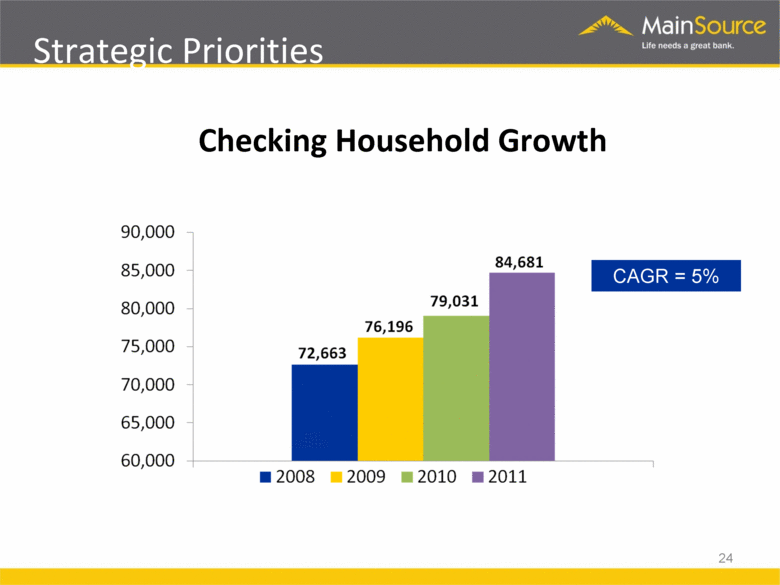
Strategic Priorities Checking Household Growth CAGR = 5% 24 |
|
|
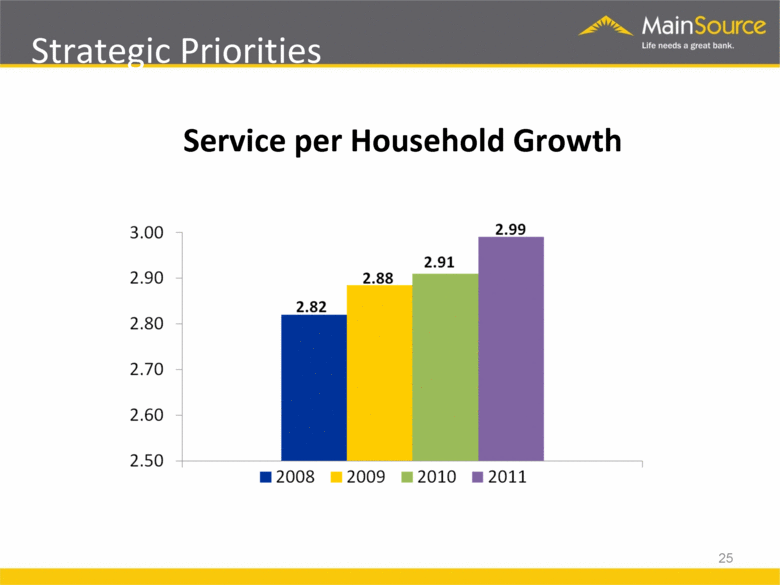
Strategic Priorities Service per Household Growth 25 |
|
|
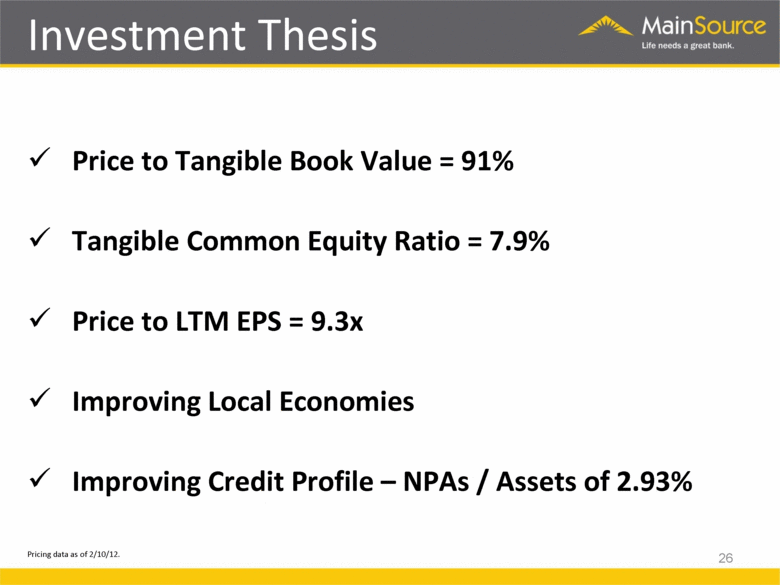
Price to Tangible Book Value = 91% Tangible Common Equity Ratio = 7.9% Price to LTM EPS = 9.3x Improving Local Economies Improving Credit Profile – NPAs / Assets of 2.93% Pricing data as of 2/10/12. 26 Investment Thesis |
|
|
New Jobs 27 |

|
|
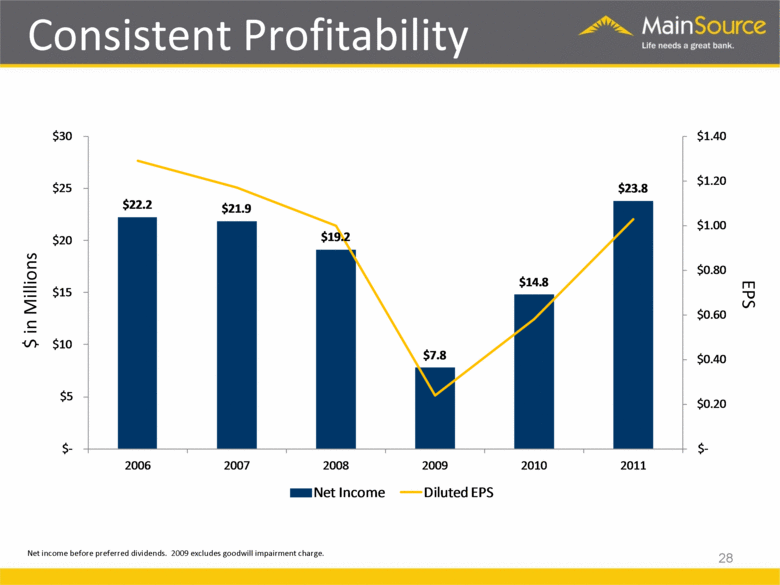
Net income before preferred dividends. 2009 excludes goodwill impairment charge. $ in Millions 28 EPS Consistent Profitability $22.2 $21.9 $19.2 $7.8 $14.8 $23.8 $ - $0.20 $0.40 $0.60 $0.80 $1.00 $1.20 $1.40 $ - $5 $10 $15 $20 $25 $30 2006 2007 2008 2009 2010 2011 Net Income Diluted EPS |
|
|
Per Share 29 Earnings Momentum $0.12 $0.07 $0.19 $0.20 $0.19 $0.34 $0.24 $0.26 $ - $0.05 $0.10 $0.15 $0.20 $0.25 $0.30 $0.35 $0.40 2010 Q1 2010 Q2 2010 Q3 2010 Q4 2011 Q1 2011 Q2 2011 Q3 2011 Q4 |
|
|
High quality deposit franchise Positive asset quality trends Proven and experienced management team Focus on shareholder value Attractive valuation 30 Investment Highlights |
|
|
31 |