Attached files
| file | filename |
|---|---|
| 8-K - 8-K - FOREST CITY ENTERPRISES INC | d301692d8k.htm |
 Investor
Update February 2012
EXHIBIT 99.1 |
 2
|
 Information
Related to Forward-Looking Statements Statements made in this presentation that state
the Company’s or management's intentions, hopes, beliefs, expectations or
predictions of the future are forward-looking statements. It is important to note
that the Company's future events and actual results, financial or otherwise, could
differ materially from those projected in such forward-looking statements. Additional
information
concerning
factors
that
could
cause
future
events
or
actual
results
to
differ
materially from those in the forward-looking statements are included in the “Risk
Factors” section
of
the
Company's
SEC
filings,
including,
but
not
limited
to,
the
Company's
Annual
Report
and quarterly reports. You are cautioned not to place undue reliance on such
forward-looking statements.
Use of non-GAAP measures
We frequently use the non-GAAP measures of earnings before depreciation, amortization and
deferred taxes (“EBDT”), comparable net operating income (“NOI”)
and measures based on the pro-rata consolidation method (“pro-rata”)
to explain operating performance and assist investors
in
evaluating
our
business.
In
addition,
we
present
a
schedule
of
components
to
assist
investors in determining the “net asset value”
(“NAV”) of the Company, also a non-GAAP
measure. For a more thorough discussion of EBDT, NOI, pro-rata measures and NAV,
including how we reconcile these measures to their GAAP counterparts, please refer to
the Supplemental Package furnished to the SEC on Form 8-K on December 8, 2011 and
the NAV Components Schedule attached to the Company’s press release announcing
strategic actions and enhanced disclosure furnished to the SEC on Form 8-K on
February 2, 2012. Copies of our quarterly and annual Supplemental Packages and the
press release containing the NAV Components Schedule can be found on our website at
www.forestcity.net, or on the SEC’s website at www.sec.gov. 3
|
 Mission
Forest City is a leading owner, operator, and developer
of distinctive and diversified real estate projects in
select core markets, which create value for our
shareholders, customers, and communities through
place creation, sustainable practices, and long-term
investment perspective.
We operate by developing meaningful relationships and
leveraging our entrepreneurial capabilities with
creative and talented associates who embrace our
core values.
Vision
To be the real estate leader and partner-of-choice in
creating distinctive places to live, work, and shop.
4 |
 Our Strategic
Foundation 5
Develop
unique,
differentiated real estate
that fuels growth, creates
a “sense of place”
and
builds communities in
strong core markets
Be a value-added
owner and operator
of a diverse portfolio of
profitable real estate
assets
Build a strong,
sustaining capital
structure
and balance
sheet that allow us to
further create value
and profitable growth |
 2012-2015
Strategic Plan 6
Key Themes:
•
Increase shareholder value by:
Continuing
to
improve
the
balance
sheet
and
reduce risk
Driving
operational
excellence
through
all
aspects
of our company
Great focus on the core,
both markets and
products |
 Investment
Profile: “Core-PLUS” 7
Core
Products:
•
Diverse portfolio of 220+ income-producing assets
•
Apartment, office, retail, life science, mixed use, military housing
•
Consistent NOI growth, stable occupancy, low tenant concentration
Core
Markets:
•
Gateway cities with strong growth/demographics, barriers to entry
•
76% + of assets in New York, D.C., Boston, Chicago, Denver, California
•
Selective expansion in new growth markets, including Texas
PLUS:
•
Signature development capability to fuel future growth
•
Substantial entitlement at large, mixed-use projects in core markets
•
Expertise in public/private partnerships, urban infill, adaptive reuse
•
90-year+ track record, 50 years as a public company
|
 NOI
by Product Type: 514,029
$
Casino Land Sale
42,622
The Nets
(14,969)
Corporate Activities
(37,452)
Other
(1)
(9,543)
Grand Total NOI
494,687
$
Pro-Rata Consolidation (dollars in thousands)
Net Operating Income by Product Type
Nine Months Ended October 31, 2011
Retail
$179,866
35.0%
Office
$188,680
36.7%
Apartments
(2)
$109,821
21.4%
Military Housing
$19,458
3.8%
Hotels
$9,898
1.9%
Land
$6,306
1.2%
NOI by Market:
514,029
$
Casino Land Sale
42,622
The Nets
(14,969)
Corporate Activities
(37,452)
Other
1
(9,543)
Grand Total NOI
494,687
$
Net Operating Income by Core Market
Pro-Rata Consolidation (dollars in thousands)
Nine Months Ended October 31, 2011
Boston
$31,418
6.1%
California
$79,436
15.5%
Chicago
$17,472
3.4%
Denver
$24,785
4.8%
Washington, D.C.
$51,134
9.9%
Philadelphia
$18,071
3.5%
Non-Core
Markets
$131,408
25.6%
New York
$160,305
31.2%
(1)
Includes write
-offs of abandoned development projects, non-capitalizable development
costs and unallocated management and service company overhead, net of tax
credit income. (2)
Includes subsidized senior housing.
Balanced, Diverse NOI Sources
8 |
 NOI by Market
and Product Type* 9
Office
Retail
Apartments
New York
71%
24%
5%
California
10%
70%
20%
Washington DC
32%
42%
26%
Cleveland
38%
10%
52%
Boston
77%
0%
23%
Denver
5%
58%
37%
Pittsburgh
23%
73%
4%
Chicago
15%
31%
54%
Philadelphia
20%
25%
55%
Florida
0%
64%
36%
Las Vegas
0%
100%
0%
Other
7%
54%
39%
40%
38%
22%
* Excludes Senior Housing, Military Housing,
Supported Living, Land, Land Sales, Hotels, and
Other |
 NOI by Product
Type and Market* 10
Office
Retail
Apartments
New York
59%
21%
7%
California
4%
30%
14%
Washington DC
9%
12%
13%
Cleveland
8%
2%
21%
Boston
13%
0%
7%
Denver
0%
5%
6%
Pittsburgh
2%
8%
1%
Chicago
1%
3%
9%
Philadelphia
2%
2%
10%
Florida
0%
4%
4%
Las Vegas
0%
6%
0%
Other
2%
7%
8%
100%
100%
100%
* Excludes Senior Housing, Military Housing,
Supported Living, Land, Land Sales, Hotels, and
Other |
 Average
Comparable
Occupancy
%
Consistent Operations
Comparable
NOI
Growth
–
Year-over-Year,
Pro
Rata
%
Source: Supplemental Packages for the nine months ended October 31 2011, and the year ended
January 31, 2011, 2010, and 2009. Historical Operations
(1) Prior periods have been recasted to exclude subsidized senior housing. The
Company believes this change will improve disclosure by allowing investors to see
results for the conventional apartment portfolio separated from those of the limited-dividend senior-housing properties.
11
“We are pleased with where we are through the first nine months of the year. We continue
to see solid fundamentals in our core product types and markets, and our residential
multi-family portfolio, in particular, continues to perform very well.”
–
David LaRue, President and CEO
92
90
91
91
91
90
89
90
92
91
94
95
86
88
90
92
94
96
YE 1/31/09
YE 1/31/10
YE 1/31/11
YTD 10/31/11
Retail
Office
Residential (1)
0.3
(3.9)
2.2 2.1
1.1
1.2
5.4
(3.1)
1.4
(3.9)
4.3
6.7
(6.0)
(4.0)
(2.0)
-
2.0
4.0
6.0
8.0
YE 1/31/09
YE 1/31/10
YE 1/31/11
YTD 10/31/11
Retail
Office
Residential (1) |
 Consistent
Operations EBDT
per
Share
($
per
share)
(1)
(2)
Historical Operations
EBDT
($
in
millions)
12
(1)
Refer to the Investors section of Forest City’s web site
(http://ir.forestcity.net/phoenix.zhtml?c=88464&p=IROL-reportsother) for Supplemental Packages for the periods referenced above,
which provide reconciliation of EBDT to its nearest GAAP equivalent.
(2)
Per–share data reflects new Class A common shares and the
“if-converted” effect of convertible debt and convertible preferred stock issued in 2009 and 2010. |
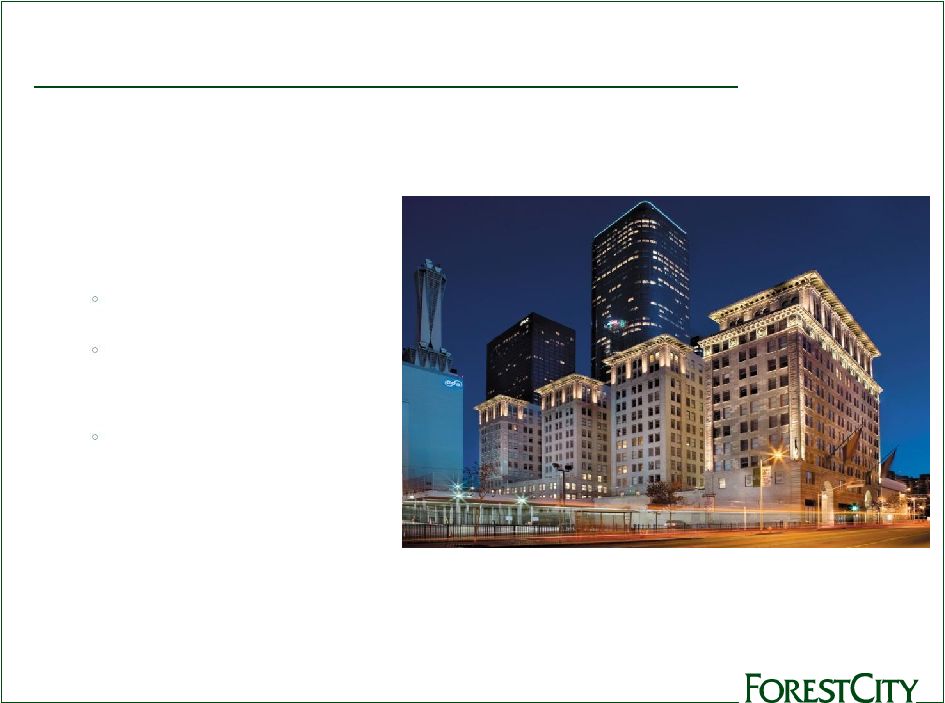
 Portfolio
Highlights - Office
•
49 properties, 13.5M s.f. in conventional and
life science office
•
Concentrations in New York and Boston
•
Key properties:
New York Times, Manhattan (shown)
MetroTech Center, Brooklyn
University Park at MIT, Cambridge
13 |
 Portfolio
Highlights - Apartments
•
123 apartment communities,
34,200 total units
•
Key properties:
DKLB BKLN, Brooklyn
River Lofts at Tobacco
Row, Richmond
Metro 417, Los Angeles
(shown)
14 |
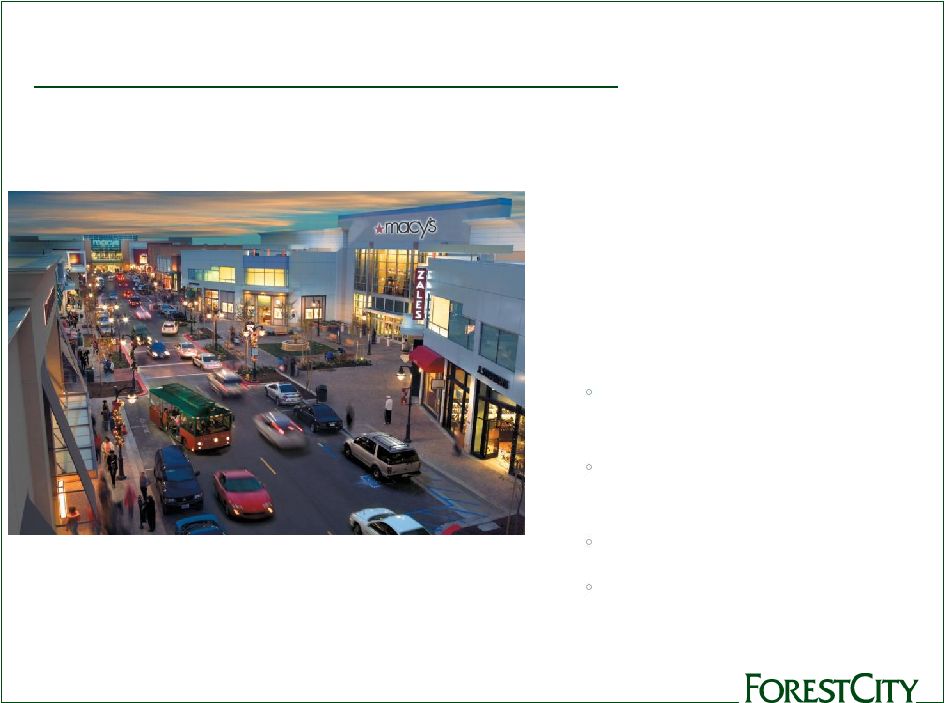 Portfolio
Highlights – Retail
•
46
centers, 26.5M total s.f.,
16.0 M GLA
•
Enclosed regional malls,
open-air lifestyle centers,
big-box/power centers,
specialty centers
•
Key properties:
San Francisco Centre/
The Emporium
Short Pump Town Center,
Richmond
42nd Street, New York
Victoria Gardens, Rancho
Cucamonga, CA (shown)
15 |
 Forest City
is proud to be participating in the privatization of rental residential communities
for military families.
Our portfolio includes more than 14,000 military
family homes located in eight states. These
include the Southern Group Air Force bases, the
U.S. Air Force Academy, and Naval installations
in Hawaii, Washington, Illinois, Indiana and
Tennessee.
Military
Housing
Fees
(NOI
In
Thousands)
Military Housing
16
$
$5,000
$10,000
$15,000
$20,000
$25,000
2005
2006
2007
2008
2009
2010
Property Management Fees
$1,776
$4,092
$3,379
$6,834
$9,881
$9,872
Asset Management Fees
$316
$559
$1,141
$2,272
$2,192
$2,993
Construction Fees
$1,149
$3,344
$9,033
$12,345
$8,783
$5,634
Development Fees
$3,334
$8,983
$16,624
$23,541
$11,169
$5,883
Total
$6,573
$16,978
$30,177
$44,992
$32,025
$24,381
- |
 Recent
Openings, 2010 •
Waterfront
Station
(former
mall),
Washington,
DC.
Two office buildings, 631K s.f., fully leased, w/street-
level retail. Sold in May 2011. LEED Gold.
Substantial entitlement for future phases.
•
East
River
Plaza
(former
wire
factory),
NYC.
Urban, big-box retail center, 527K s.f., w/Manhattan’s
first Costco and Target.
•
Presidio
Landmark
(former
hospital),
San
Francisco.
161 luxury apartments in Presidio National Park.
LEED Gold and Platinum.
•
Village
at
Gulfstream
Park,
Hallandale
Beach,
FL.
Retail/mixed-use center, 511K s.f., anchored by a
thoroughbred racetrack. Serves Miami/Ft. Lauderdale.
17 |
 Recent
Openings, 2011 •
8
Spruce
Street,
*
New
York
City
(Lower
Manhattan)
Frank Gehry-designed apartment tower. 76 stories,
903 market-rate units.
550+ executed leases
Lower floors include a K-8 public school and an
ambulatory care center for the New York
Downtown Hospital
•
Foundry
Lofts,
the
first
residential
building
at
The
Yards mixed-use project in the Capitol Riverfront
district of Washington D.C.
170
loft-style
apartments
in
an
adaptive
reuse
of a former Navy Yard industrial building.
Initial move-ins began in December, with
commitments for more than half of the units
already.
* Over 680 units are open, remaining units on upper floors are under construction 18 |
 Under
Construction •
Barclays
Center
Arena,
Brooklyn
State-of-the-art sports and entertainment
venue
Future home of the NBA Nets
First phase of the Atlantic Yards mixed-use project,
which will feature more that 6,400 housing units,
approximately 250K s.f. of retail, and more than 8 acres
of open space.
Set to open September, 2012
•
Westchester’s
Ridge
Hill,
Yonkers,
NY
1.3M s.f. mixed-use retail project
Currently opening in phases, culminating in Lord + Taylor
grand opening of a new 80K s.f store in Spring 2012.
The complex now features a National Amusements
“Cinema de Lux,”
and retailers and eateries including
REI, Cheesecake Factory, Dick’s Sporting Goods, Gap,
GapKids, Guitar Center, H&M, L.L.Bean, Sephora, Sur La
Table, Texas de Brazil, and Whole Foods Market, as well
as WESTMED Medical Group, the project’s anchor office
tenant.
19 |
 Enhanced
Disclosure: Net Asset Value Components 20
*Footnotes provided in Appendix Section
*
(Dollars in millions at Pro-Rata)
Q3 2011 NOI
(1)
Annualized
NOI
(2)
Net Stabilized
Adjustments
(3)
Annualized
Stabilized NOI
Non Recourse
Debt
(4)
A
B
=A + B
Commercial Real Estate
Retail
57.8
$
231.2
$
10.3
$
241.5
$
(2,620.1)
$
Office
60.7
242.8
1.3
244.1
(2,336.5)
Other
(1.7)
(6.8)
5.5
(1.3)
Total Commercial Real Estate
116.8
$
467.2
$
17.1
$
484.3
$
(4,956.6)
$
Residential Real Estate
Apartments
35.3
$
141.2
$
2.2
$
143.4
$
(1,850.5)
$
Senior Housing
4.3
17.2
-
17.2
Military Housing
8.5
34.0
-
34.0
Other
(3.4)
(13.6)
0.3
(13.3)
Total Residential Real Estate
44.7
$
178.8
$
2.5
$
181.3
$
(1,850.5)
$
Total Rental Properties
161.5
$
646.0
$
19.6
$
665.6
$
(6,807.1)
$
Westchester's
Ridge
Hill
and
8
Spruce
Street
Debt
Adj.
NET
(5)
318.6
Adjusted Total Rental Properties
161.5
$
646.0
$
19.6
$
665.6
$
(6,488.5)
$
Book
Value
Non
Recourse
Debt
(4)
Westchester's
Ridge
Hill
(Adjusted
for
amounts
included
in
"CRP")
(5)
217.5
$
(124.3)
$
8
Spruce
Street
(Adjusted
for
amounts
included
in
"CRP")
(5)
307.4
(194.3)
Projects under construction
(4)
1,025.8
(509.1)
Adjusted projects under construction
1,550.7
$
(827.7)
$
Projects under development
(4)
884.3
$
(146.2)
$
Land held for development or sale
(4)
339.2
$
(57.3)
$
Book Value
(4)
Cash and equivalents
281.4
$
Restricted cash and escrowed funds
502.5
$
Notes and accounts receivable, net
409.5
$
Net investments and advances to unconsolidated entities
213.4
$
Prepaid expenses and other deferred costs, net
208.0
$
Book Value
(4)
Bank revolving credit facility
-
$
Senior and subordinated debt
(1,038.5)
$
Less: convertible debt
599.1
$
Construction payables
(131.0)
$
Operating accounts payable and accrued expenses
(763.3)
$
Number
of
shares
for
the
three
months
ended
October
31,
2011
(In
millions)
221.4
Weighted
average
shares
outstanding
-
Diluted
Net
Asset
Value
Components
-
October
31,
2011
Completed
Rental
Properties
("CRP")
Development
Pipeline
Other Tangible Assets
Recourse
Debt
and
Other
Liabilities |
 Appendix
Recourse Debt Maturities
22
Asset Sales
23
Lease Expirations
24
Pipeline
26
The Yards –
Project Site Plan
32
Sustainability
33
Net Asset Value Components Footnotes
34 |
 Addressing
Recourse Debt Maturities 22
-150
50
250
450
650
850
1050
1250
1450
1650
2010
2011
2012
2013
2014
2015
2016
2017
2018
2034
Total
1/31/09
Debt/Capacity
10/31/11
Convertible
Debt
10/31/11
NonConvertible
Debt/Capacity
Change
in
Recourse
Debt
Capacity
-
10/31/11
Compared
to
1/31/09 |
 Asset
Sales ($ in millions)
23
Cash
Net
Annualized
Cap
EBDT Year
EBDT/
Count
Proceeds
Sales Price
NOI
rate
Prior to Sale
Proceeds
Leverage
Total (10 Yr + YTD 2011: 2001-2011)
96
1,314,148
3,104,672
205,509
6.6%
97,009
7.4%
58%
Total (10 Yr: 2001-2010)
76
1,032,955
2,426,636
162,967
6.7%
73,598
7.1%
57%
Total (7 Yr: 2004-2010)
62
932,271
2,168,450
141,999
6.5%
63,439
6.8%
57%
Total (5 Yr: 2006-2010)
45
728,572
1,644,114
109,915
6.7%
50,342
6.9%
56% |
 Office
Lease
Expirations
(as
of
October
31,
2011)
0.00%
2.00%
4.00%
6.00%
8.00%
10.00%
2011
2012
2013
2014
2015
Office Lease Expirations
Percentage of Net Base Rent Expiring
As of October 31, 2011
EXPIRATION
YEAR
NUMBER OF
EXPIRING
LEASES
SQUARE FEET
OF EXPIRING
LEASES
PERCENTAGE
OF TOTAL
LEASED GLA
NET
BASE RENT
EXPIRING
PERCENTAGE
OF TOTAL
BASE RENT
AVERAGE
BASE
RENT PER
SQUARE FEET
EXPIRING
2011
34
233,788
2.10
%
$
4,603,027
1.55
%
$
20.10
2012
95
971,527
8.73
24,991,425
8.41
31.54
2013
92
1,130,969
10.16
24,730,917
8.32
22.53
2014
69
752,511
6.76
15,576,502
5.24
32.44
2015
44
481,535
4.32
8,911,541
3.00
21.33
24 |
 Retail
Lease
Expirations
(as
of
October
31,
2011)
0.0%
2.0%
4.0%
6.0%
8.0%
10.0%
2011
2012
2013
2014
2015
Retail Lease Expirations
Percentage of Net Base Rent Expiring
As of October 31, 2011
EXPIRATION
YEAR
NUMBER OF
EXPIRING
LEASES
SQUARE FEET
OF EXPIRING
LEASES
PERCENTAGE
OF TOTAL
LEASED GLA
NET
BASE RENT
EXPIRING
PERCENTAGE
OF TOTAL
BASE RENT
AVERAGE
BASE
RENT PER
SQUARE FEET
EXPIRING
2011
167
603,127
4.66
%
$
12,703,390
4.98
%
$
29.31
2012
274
968,441
7.48
19,620,106
7.70
27.65
2013
317
1,162,062
8.97
25,115,259
9.85
27.22
2014
270
1,119,901
8.65
21,137,490
8.29
27.74
2015
206
830,644
6.41
18,655,790
7.32
29.60
25 |
 Pipeline:
Projects Opened or Acquired Note: See pages 33 -
34 in the Supplemental Package for the quarter ended October 31, 2011 for
footnotes. 26
Openings and Acquisitions as of October 31, 2011
Cost at FCE
Date
Pro-Rata
Cost at Full
Total Cost
Pro-Rata Share
Sq. ft./
Gross
Dev (D)
Opened /
FCE Legal
FCE % (a)
Consolidation
at 100%
(Non-GAAP) (c)
No. of
Leasable
Lease
Property
Location
Acq (A)
Acquired
Ownership % (a)
(1)
(GAAP) (b)
(2)
(1) X (2)
Units
Area
Commitment %
2011 (2)
Retail Centers:
Westchester's Ridge Hill (d) (q)
Yonkers, NY
D
Q2-11/12
70.0%
100.0%
$
0.0
$
0.0
$
0.0 400,000
400,000
Residential:
8 Spruce Street (f) (j)
Manhattan, NY
D
Q1-11/12
35.7%
51.0%
$
0.0 875.7
$
446.6
$
903
61%
(in millions) |
 Pipeline:
Projects Under Construction Note: See page 33 -
34 in the Supplemental Package for the quarter ended October 31, 2011 for
footnotes. 27
Projects Under Construction as of October 31, 2011 (8)
Cost at FCE
Pro-Rata
Cost at Full
Total Cost
Pro-Rata Share
Sq. ft./
Gross
Anticipated
FCE Legal
FCE % (a)
Consolidation
at 100%
(Non-GAAP) (c)
No. of
Leasable
Lease
Property
Location
Opening
Ownership % (a)
(1)
(GAAP) (b)
(2)
(1) X (2)
Units
Area
Commitment %
Retail Centers:
(m)
Westchester's Ridge Hill (e)
Yonkers, NY
Q2-11/12
70.0%
100.0%
842.4
$
842.4
$
842.4
$
1,336,000
1,336,000
(l)
56%
The Yards -
Boilermaker Shops
Washington, D.C.
Q3-12
100.0%
100.0%
19.4
19.4
19.4
41,000
41,000
73%
861.8
$
861.8
$
861.8
$
1,377,000
1,377,000
Office:
Johns Hopkins Parking Garage
Baltimore, MD
Q3-12
100.0%
100.0%
30.1
$
30.1
$
30.1
$
492,000
Residential:
Foundry Lofts (r)
Washington, D.C.
Q4-11
100.0%
100.0%
61.4
61.4
61.4
170
The Aster Town Center (formerly Novella)
Denver, CO
Q3-12
90.0%
90.0%
10.9
10.9
9.8
85
Botanica Eastbridge
Denver, CO
Q4-12
90.0%
90.0%
15.4
15.4
13.9
118
Continental Building
Dallas, TX
Q1-13
100.0%
100.0%
54.3
54.3
54.3
203
142.0
$
142.0
$
139.4
$
576
Arena:
Barclays Center
Brooklyn, NY
Q3-12
33.8%
33.8%
904.3
$
904.3
$
305.9
$
670,000
18,000 seats
(n)
56% (o)
Total Under Construction (k)
1,938.2
$
1,938.2
$
1,337.2
$
Fee Development Project
Las Vegas City Hall
Las Vegas, NV
Q1-12
-
(p)
-
(p)
$
0.0
146.2
$
$
0.0
270,000
(in millions) |
 Pipeline:
Equity Requirements 28
Equity
Requirements
for
Projects
Under
Construction
(a)
As of October 31, 2011
Less
Plus
Unconsolidated
Full
Less
Unconsolidated
Pro-Rata
Investments
Consolidation
Noncontrolling
Investments
Consolidation
100%
at 100%
(GAAP) (b)
Interest
at Pro-Rata
(Non-GAAP) (c)
Total Cost Under Construction
1,938.2
$
-
$
1,938.2
$
601.0
$
-
$
1,337.2
$
Total Loan Draws and Other Sources
at Completion (d)
1,229.3
-
1,229.3
378.3
-
851.0
Net Equity at Completion
708.9
-
708.9
222.7
-
486.2
Net
Costs
Incurred
to
Date
(e)
1,309.2
-
1,309.2
328.3
-
980.9
Loan
Draws
and
Other
Sources
to
Date
(e)
649.8
-
649.8
105.6
-
544.2
Net
Equity
to
Date
(e)
659.4
-
659.4
222.7
-
436.7
% of Total Equity
93%
93%
90%
Remaining Costs
629.0
-
629.0
272.7
-
356.3
Remaining Loan Draws and Other Sources
579.5
-
579.5
272.7
-
306.8
Remaining Equity
49.5
$
-
$
49.5
$
-
$
-
$
49.5
$
% of Total Equity
7%
7%
10%
(dollars in millions)
(a ) This schedule includes only the
eight properties listed on the previous page. This does not include costs associated with phased-in units, operating property renovations and military housing.
(b) Amounts are presented on the full consolidation method of
accounting, a GAAP measure. Under full consolidation, costs are reported as consolidated at 100 percent if we are deemed to have
control or to be the
primary beneficiary of our investments in the variable interest entity ("VIE").
(c) Cost at pro-rata share represents Forest City's share of cost,
based on the Company's pro-rata ownership of each property (a non-GAAP measure). Under the pro-rata consolidation method of
accounting the Company
determines its pro-rata share by multiplying its pro-rata ownership by the total cost of the applicable property.
(d) "Other Sources" includes estimates of third party subsidies
and tax credit proceeds. The timing and the amounts may differ from our estimates.
(e) Reflects activity through October 31, 2011. |
 Projects
Opened or Acquired: Prior Two Years Note:
See
page
33
-
34
in
the
Supplemental
Package
for
the
quarter
ended
October
31,
2011
for
footnotes.
29
Cost at FCE
Date
Pro-Rata
Cost at Full
Total Cost
Pro-Rata Share
Sq. ft./
Gross
Dev (D)
Opened /
FCE Legal
FCE % (a)
Consolidation
at 100%
(Non-GAAP) (c)
No. of
Leasable
Lease
Property
Location
Acq (A)
Acquired
Ownership % (a)
(1)
(GAAP) (b)
(2)
(1) X (2)
Units
Area
Commitment %
Prior Two Years Openings (7)
Retail Centers:
Village at Gulfstream Park (f)
Hallandale Beach, FL
D
Q1-10
50.0%
50.0%
$
198.9
$
99.5
$
511,000
511,000
70%
East River Plaza (f)
Manhattan, NY
D
Q4-09/Q2-10
35.0%
50.0%
0.0
390.6
195.3
527,000
527,000
90%
Promenade in Temecula Expansion
Temecula, CA
D
Q1-09
75.0%
100.0%
113.4
113.4
113.4
127,000
127,000
89%
113.4
$
702.9
$
408.2
$
1,165,000
1,165,000
Office:
Waterfront Station
-
East 4th & West 4th Buildings (g)
Washington, D.C.
D
Q1-10
45.0%
45.0%
245.9
$
245.9
$
110.7
$
631,000
99%
Residential:
(h)
Presidio Landmark
San Francisco, CA
D
Q3-10
100.0%
100.0%
96.5
$
96.5
$
96.5
$
161
70% (r)
North Church Towers
Parma Heights, OH
A
Q3-09
100.0%
100.0%
5.1
5.1
5.1
399
86%
DKLB BKLN (f)
Brooklyn, NY
D
Q4-09/Q2-10
40.8%
51.0%
0.0
161.8
82.5
365
96%
101.6
$
263.4
$
184.1
$
925
Total Prior Two Years Openings (i)
460.9
$
1,212.2
$
703.0
$
Recap of Total Prior Two Years
Openings Total 2010
342.4
$
931.9
$
502.0
$
Total 2009
118.5
280.3
201.0
Total Prior Two Years Openings (i)
460.9
$
1,212.2
$
703.0
$
0.0 |
 Projects Under
Development (full descriptions) 30
Projects Under Development
As of October 31, 2011
1)
Atlantic
Yards
-
Brooklyn,
NY
2)
LiveWork
Las
Vegas
-
Las
Vegas,
NV
3) The Yards -
Washington, D.C.
4)
The
Science
+
Technology
Park
at
Johns
Hopkins
-
Baltimore,
MD
5)
Colorado
Science
+
Technology
Park
at
Fitzsimons
-
Aurora,
CO
6)
Waterfront
Station
-
Washington,
D.C.
7)
300
Massachusetts
Avenue
-
Cambridge,
MA
Below is a summary of our active large scale development projects,
which have yet to commence construction, often referred to as our "shadow pipeline" which are
crucial to our long-term growth. While we cannot make any
assurances on the timing or delivery of these projects, our track record speaks to our ability to bring large,
complex projects to fruition when there is demand and available
construction financing. The projects listed below represent pro-rata costs of $755.9 million
($946.3 million at full consolidation) of Projects Under Development
("PUD") on our balance sheet and pro-rata mortgage debt of $132.7 million ($176.8 million at full consolidation).
Atlantic Yards is adjacent to the state-of-the art arena, the
Barclays Center, which is designed by the award-winning firms Ellerbe Becket and SHoP Architects and is currently under
construction. In addition, Atlantic Yards is expected to feature more
than 6,400 units of housing, including over 2,200 affordable units, approximately 250,000 square feet of retail space, and
more than 8 acres of landscaped open space. The Yards is a 42-acre mixed-use
project, located in the neighborhood of the Washington Nationals baseball park in Southeast D.C. The full development is expected to include up to 2,700
residential units, 1.8 million square feet of office space, and 300,000
square feet of retail and dining space. The Yards features a 5.5-acre publicly funded public park that is a gathering place
and recreational focus for the community. The first residential
building, Foundry Lofts, remained under construction as of October 31, 2011 and subsequently opened in November 2011.
Located in Southwest Washington, D.C., Waterfront Station is adjacent
to the Waterfront/Southeastern University MetroRail station. Waterfront Station is expected to include 660,000 square
feet of office space, an estimated 400 residential units and 40,000
square feet of stores and restaurants.
LiveWork Las Vegas is a mixed-use project on a 13.5-acre parcel
in downtown Las Vegas. At full build-out, the project will have a new 260,000-square-foot City Hall for Las Vegas and is
also expected to include up to 1 million square feet of office space
and approximately 300,000 square feet of retail. The City Hall is owned by the city of Las Vegas and is a fee-development
project.
The 31-acre Science + Technology Park at Johns Hopkins is a new
center for collaborative research directly adjacent to the world-renowned Johns Hopkins medical and research complex.
Initial plans call for 1.1 million square feet in five buildings, with
future phases that could support additional expansion. In 2008, the Company opened the first of those buildings, 855 North
Wolfe Street, a 279,000-square-foot office building anchored by
the Johns Hopkins School of Medicine’s Institute for Basic Biomedical Sciences. Development of a 492,000-square-foot
garage at 901 N. Washington Street is currently underway and will
provide approximately 1,450 parking spaces for Johns Hopkins and the active buildings at the Science + Technology Park
when it is completed in Q3-12. Construction of a second
commercial building totaling 234,000-square-feet is expected to commence by the beginning of 2012. The new building, which will
be developed on a fee basis, will be fully leased to the Department of
Health & Mental Hygiene (DHMH) when it is expected to open in Q2-14. The
184-acre Colorado Science + Technology Park at Fitzsimons is becoming a hub for the biotechnology industry in the Rocky Mountain region. Anchored by the University of Colorado at
Denver Health Science Center, the University of Colorado Hospital and
The Denver Children’s Hospital, the park will offer cost-effective lease rates; build-to-suit office and research sites; and
flexible lab and office layouts in a cutting-edge research park.
The park is also adjacent to Forest City’s 4,700-acre Stapleton mixed-used development.
Located in the science and technology hub of Cambridge, MA, the 300
Massachusetts Avenue block represents an expansion of University Park @ MIT. In a 50/50 partnership with MIT,
Forest City is presently focused on a project that reflects a
development program of approximately 260,000 square feet of lab and office space. Potential redevelopment of the entire block is
possible with the acquisition of adjacent parcels in future phases, and
would result in an approximately 400,000 square foot project. |
 Military
Housing 31
Military Housing as of October 31, 2011
Below
is
a
summary
of
our
Military
Housing
development
projects.
The
Company
provides
development,
construction
and
management
services
for these projects and receives agreed upon fees for these
services. The following phases still have a percentage of units opened and under construction:
Anticipated
FCE
Cost at Full
Total Cost
No.
Property
Location
Opening
Pro-Rata %
Consolidation
at 100%
of Units
Military
Housing
-
Recent
Openings(2)
Navy, Hawaii Increment III
Honolulu, HI
2007-Q1-11
*
$
0.0 464.8
$
2,520
Marines, Hawaii Increment II
Honolulu, HI
2007-Q2-11
*
0.0
292.7
1,175
Total Recent Openings
$
0.0 757.5
$
3,695
Military Housing Under Construction (9)
Pacific Northwest Communities
Seattle, WA
2007-2011
*
$
0.0 280.5
$
2,985
Navy Midwest
Chicago, IL
2006-2012
*
0.0
200.3
1,401
Midwest Millington
Memphis, TN
2008-2012
*
0.0
33.1
318
Air Force Academy
Colorado Springs, CO
2007-2013
50.0%
0.0
69.5
427
Hawaii Phase IV
Kaneohe, HI
2007-2014
*
0.0
475.1
1,141
Air Force –
Southern Group
Keesler Air Force Base
Biloxi, MS
Q3-Q4/2011
0.0%
0.0
5.0
1,188
Shaw Air Force Base
Sumter, SC
2011-2015
0.0%
0.0
156.5
630
Joint Base Charleston
Charleston, SC
2011-2015
0.0%
0.0
72.0
345
Arnold Air Force Base
Tullahoma, TN
2011-2015
0.0%
0.0
10.1
22
Subtotal Air Force –
Southern Group
$
0.0 243.6
$
2,185
Total Under Construction
$
0.0 1,302.1
$
8,457
* The Company's share of residual cash flow ranges from 0-20%
during the life cycle of the project. Commitment Executed
Summary of Military Housing Net Operating Income (14,104 end-state
units) (in millions)
Air Force – Southern Group was awarded on August 30, 2010.
This project is expected to include 2,185 end state units at four Air Force bases in Sumter, SC, Tullahoma, TN, Charleston, SC and Biloxi, MS. There are 330
financially excluded units that will not be encumbered by debt and which may be removed from
the end state at the sole discretion of the Air Force. The financial closing of the project was executed on September 30,
2011 with property management and construction beginning on October 1, 2011.
Development fees related to our military housing projects are earned
based on a contractual percentage of the actual development costs incurred. We also recognize additional development incentive fees upon successful completion
of certain criteria, such as incentives to realize development
cost savings, encourage small and local business participation, comply with specified safety standards and other project management incentives as specified in the
development agreements. NOI from development and development incentive
fees is $2,408,000 and $4,225,000 for the three and nine months ended October 31, 2011 respectively, and $1,818,000 and $5,137,000 for the three and
nine months ended October 31, 2010, respectively.
Construction management fees are earned based on a contractual
percentage of the actual construction costs incurred. We also recognize certain construction incentive fees based upon successful completion of certain criteria as set
forth in the construction contracts. NOI from construction and incentive
fees is $911,000 and $2,937,000 for the three and nine months ended October 31, 2011 respectively, and $1,694,000 and $4,754,000 recognized during the
three and nine months ended October 31, 2010, respectively.
Property management and asset management fees are earned based on a
contractual percentage of the annual net rental income and annual operating income, respectively, that is generated by the military housing privatization
projects as defined in the agreements. We also recognize certain
property management incentive fees based upon successful completion of certain criteria as set forth in the property management agreements. Property management,
management incentive and asset management fees generated NOI of
$3,905,000 and $9,552,000 during the three and nine months ended October 31, 2011, respectively, and $3,563,000 and $9,805,000 during the three and nine
months ended October 31, 2010, respectively.
|
 The Yards
– Project Site Plan
In total, a 42-acre mixed-use project in the Capitol Riverfront district of Washington
D.C. Expected to include up to 2,700 residential units, 1.8 million square
feet of office space, and 300,000 square feet of retail and dining space.
32
Riverfront Park
Completed Fall 2010
Boilermaker Shops
Retail/Office
Opening mid-2012
Foundry Lofts Apts.
Completed late 2011 |
 Sustainability
at Forest City 33
•
Commitment
o
A corporate core value since 2003
o
Dedicated Sustainability Dept. and Commercial Energy Services Dept.
o
Accountability
and
verification
–
all
projects
prepare
a
sustainability
“scorecard”
•
Results
o
30+ projects certified or seeking certification (LEED, Energy Star, others)
o
Approx. 18% of total portfolio is certified (based on cost at pro-rata)
o
A leader in breadth of LEED certifications by project type:
•
New Construction
•
Core & Shell
•
Neighborhood Development
•
Homes
•
Existing Buildings
•
Value-added
o
Leveraging portfolio opportunities for energy generation/sale, reduced cost
o
Forest City included in Calvert Social Index since September, 2010
•
New Developments
o
Focus on results, not specific certifications, however use them to benchmark performance and
stay on top of best practices
o
December 2011 –
Joined National Better Buildings Challenge, a private sector initiative to increase
energy efficiency by 20% by 2020 across 14m SF of the overall portfolio
•
Renewable Energy
o
In-house capability to develop and manage alternative energy projects (solar, wind,
waste- to-energy) deployed on existing Forest City Assets as well as new
projects |
 Net Asset
Value Components Footnotes 1)
Pro-rata Q3 2011 Net Operating Income (“NOI”) agrees to the respective amounts
in the NOI by Product Group for the three months ended October
31,
2011, as previously disclosed in our October 31, 2011 Supplemental Package furnished with the
Securities and Exchange Commission on Form 8-K on December
8,
2011.
2)
The pro-rata annualized NOI is calculating by taking the Q3 2011 NOI times a multiple of
four. 3)
The net stabilized adjustments column represents net adjustments
required to arrive at a fully stabilized NOI for those
properties currently in initial lease up periods, net of the removal of partial period NOI for
recently sold properties. For those properties currently in initial lease up
periods we have included a stabilization adjustment to reflect NOI equal to 5% of the
pro-rata cost disclosed in our Development Pipeline disclosure (Prior Two Year
Openings). This assumption does not reflect Forest City’s anticipated NOI, but
rather is used in order to establish a hypothetical basis for valuation of lease up properties.
The net stabilized adjustments are not comparable to any GAAP measure and therefore do not
have a reconciliation to its nearest comparable GAAP measure.
4)
Amounts agree to the respective pro-rata balance of the applicable financial statement
line item. 5)
In
our
October
31,
2011
Form
8K,
we
disclosed
the
phased
openings
of
two
projects
in
New
York.
Westchester’s
Ridge
Hill,
as
of October 31, 2011 had $217.5 million of costs incurred at pro-rata consolidation and
$124.3 million of mortgage debt at pro- rata
consolidation
which
were
transferred
to
completed
rental
properties.
8
Spruce
Street,
as
of
October
31,
2011,
had
$307.4
million of costs incurred at pro-rata consolidation and $194.3 million of mortgage debt at
pro-rata consolidation which were transferred
to
completed
rental
properties
(“CRP”).
In
order
to
account
for
the
phased
openings
of
Westchester’s
Ridge
Hill
and
8
Spruce
Street
as
NAV
components
we
have
made
the
following
adjustments:
•
All
costs
and
associated
debt
for
Westchester’s
Ridge
Hill
and
8
Spruce
Street,
for
purposes
exclusive
to
this
disclosure, are accounted for as a component of “Adjusted Projects Under
Construction” in the Development
Pipeline section of this schedule. Accordingly all NOI and debt
have been removed from CRP.
34 |
 Forest City
Enterprises, Inc., an NYSE-listed national real estate company with $10.5 billion
in total assets (10/31/2011) . The Company is principally engaged in the ownership,
development, management and acquisition of commercial and residential real estate and land
throughout the United States.
Founded in 1920 and based in Cleveland, Ohio, Forest City’s diverse portfolio includes
hundreds of premier properties located throughout the United States. We are especially
active in our Core Markets – the New York City metropolitan area, Boston, Greater
Washington, D.C./Baltimore, Denver, California, and Chicago – where we have
overcome high barriers to entry and developed a unique franchise. These are great urban
markets with strong demographics and good growth potential.
Investor Relations Contact:
Jeff Linton
Senior Vice President, Corporate Communication
Forest City Enterprises
216-416-3558
jefflinton@forestcity.net |