Attached files
| file | filename |
|---|---|
| 8-K - FORM 8-K - RAILAMERICA INC /DE | d297621d8k.htm |
| EX-99.1 - EX-99.1 - RAILAMERICA INC /DE | d297621dex991.htm |
 Fourth Quarter
2011 Earnings Conference Call
February 9, 2012
Exhibit 99.2 |
 Forward-Looking Statements
2
Certain items in this presentation and other information we provide from time to time may
constitute forward-looking statements within the meaning of the Private Securities
Litigation Reform Act of 1995 including, but not necessarily limited to, statements
relating to future events and financial performance. Words such as
“anticipates,” “expects,”
“intends,”
“plans,”
“projects,”
“believes,”
“appears,”
“may,”
“will,”
“would,”
“could,”
“should,”
“seeks,”
“estimates”
and variations on these words and similar
expressions are intended to identify such forward-looking statements. These statements are
based on management’s current expectations and beliefs and are subject to a number
of factors that could lead to actual results materially different from those described
in the forward-looking statements in this presentation, including operating ratio goals. RailAmerica, Inc. can give no
assurance that its expectations will be attained. Accordingly, you should not place undue
reliance on any forward-looking statements contained in this presentation. Factors
that could have a material adverse effect on our operations and future prospects or
that could cause actual results to differ materially from RailAmerica, Inc.’s expectations include, but are not limited to, prolonged
capital markets disruption and volatility, general economic conditions and business
conditions, our relationships with Class I railroads and other connecting carriers, our
ability to obtain railcars and locomotives from other providers on which we are
currently dependent, legislative and regulatory developments including rulings by the Surface
Transportation Board or the Railroad Retirement Board, strikes or work stoppages by our
employees, our transportation of hazardous materials by rail, rising fuel costs,
goodwill assessment risks, acquisition risks, competitive pressures within the industry, risks
related to the geographic markets in
which we operate; and other risks detailed in RailAmerica, Inc.'s filings with the Securities
and Exchange Commission, including our
Annual Report on Form 10-K and our Quarterly Reports on Form 10-Q. In addition,
new risks and uncertainties emerge from time to time, and it is not possible for
RailAmerica, Inc. to predict or assess the impact of every factor that may cause its
actual results to differ from those contained in any forward-looking statements.
Such forward-looking statements speak only as of the date of this presentation.
RailAmerica, Inc. expressly disclaims any obligation to release publicly any updates or revisions to any forward-
looking statements contained herein to reflect any change in its
expectations with regard thereto or change in events, conditions or
circumstances on which any statement is based. |
 Executive
Summary John Giles, President and Chief Executive Officer
3 |
 Fourth quarter
2011 overview 4
Strategic Focus
Accomplishments
Organic Growth
External Growth
Financial Flexibility
Revenue increased 15%
•
Carloads declined 2%
•
Average freight revenue per car up 7%
•
Non-freight revenue up 48%
Operating income (excl. 45G, impairments & asset sales) up
30%¹ Adjusted net income²
of $0.33 per share
Announced acquisitions
•
Marquette Railroad
•
Wellsboro & Corning Railroad and Industrial Waste Group
Repurchased $12.9 million of shares in Q4
Redeemed $74 million of Senior Notes in January, 2012
Announced tender offer in February, 2012 for Senior Notes
______________________
Note:
(1)
See page 27 to 28 for a reconciliation to GAAP. Reported operating income
down 15% for Q4 2011 versus Q4 2010. (2)
See page 29 for a reconciliation to GAAP. Reported net income of $0.29 per
share for Q4 2011. |
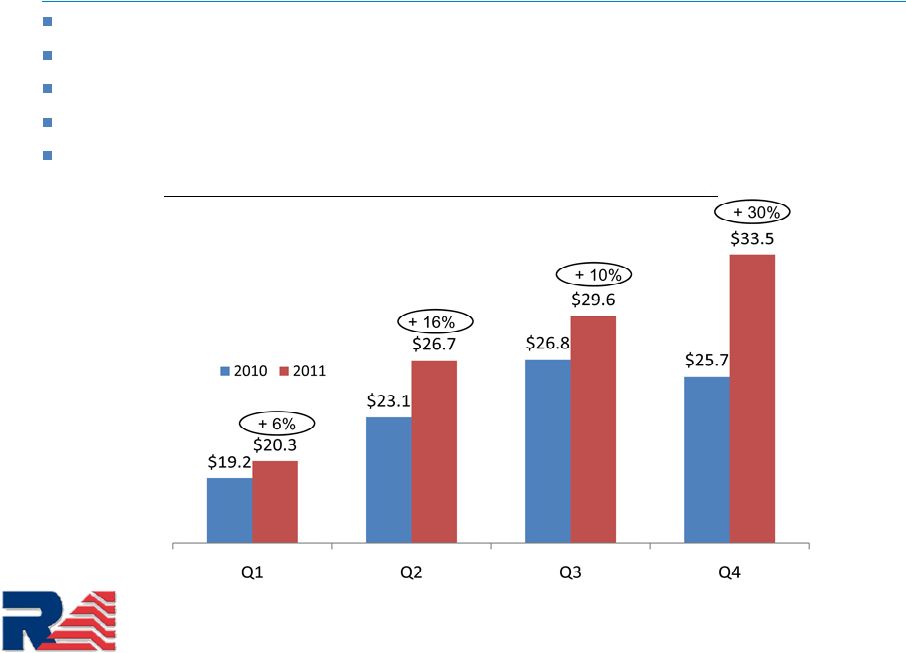 Strong 2011 drives
momentum into 2012 5
______________________
Note:
(1)
See page 27 to 28 for a reconciliation to GAAP.
(2)
See page 29 for a reconciliation to GAAP.
Operating income (excl. 45G, impairments & asset sales) up 16%
1
and full year adjusted net income per share up 39%
2
Core operations performing well and positioned for growth
Announced acquisitions will add incremental growth
Acquisition pipeline is strong
Opportunities to lower debt costs (redemption and tender offer)
Operating income (excl. 45G, impairments & asset sales) ¹
$’s in millions |
 Commercial
Update 6 |
 7
($in millions)
Q4 2011 revenue up $19.7 million versus Q4 2010.
Strong pricing plus higher fuel surcharge and non-freight revenue growth offset lower
volume.
$127.6
($1.5)
$4.5
$2.3
$14.4
$147.3
Q4 2010
Volume
Rev. Per Car
Fuel Surcharge
Non-Freight
Q4 2011
Freight Revenue up $5.3
Fourth quarter 2011 revenue up 15%
______________________
Note:
Numbers may not add or recalculate due to rounding.
+15% |
 Fourth quarter
2011 carloads declined 2% 8
______________________
Note:
Numbers may not add or recalculate due to rounding.
Revenue
Q4
Q4
Q4 2011 vs.
Q4 2011 vs.
2010
2011
Q4 2010
Q4 2010
Industrial Products Subtotal
90,709
90,785
0%
8%
Chemicals
24,197
21,180
-12%
-3%
Pulp, Paper & Allied Products
16,258
14,878
-8%
-13%
Metallic Ores and Metals
15,412
17,436
13%
29%
Waste & Scrap Materials
13,760
14,884
8%
17%
Petroleum
10,946
9,776
-11%
-6%
Other
7,785
8,021
3%
38%
Motor Vehicles
2,351
4,610
96%
104%
Agricultural & Food Products Subtotal
49,443
47,507
-4%
-1%
Agricultural Products
35,248
32,827
-7%
-6%
Food or Kindred Products
14,195
14,680
3%
11%
Coal
44,593
40,925
-8%
-9%
Construction Products Subtotal
30,709
32,631
6%
17%
Non-Metallic Minerals and Products
19,752
20,482
4%
12%
Forest Products
10,957
12,149
11%
24%
Total
215,454
211,848
-2%
5%
Total (excluding coal)
170,861
170,923
0%
7%
"Same Railroad"
215,454
210,359
-2%
5%
Carloads |
 Fourth quarter
2011 average freight revenue per carload up 7% 9
Change in Average Freight Revenue per Carload
(Versus Prior Year Period)
7.2%
5.1%
Q4 2011 vs. Q4 2010
Reported
Excl Fuel Surcharge & Foreign Exchange
Core price increases of + 4%. |
 Fourth quarter
non-freight revenue up 48% 10
______________________
Note:
Numbers may not add or recalculate due to rounding.
Non-freight revenue increase was broad based.
Strong increase in engineering services revenue.
($ millions)
Q4 2010
Q4 2011
% Change
Non-Freight Revenue
$29.6
$44.0
48%
Non-Freight Revenue Detail:
Engineering Services
$6.5
$19.9
204%
Car Storage
4.9
3.7
-25%
Demurrage
3.0
4.7
57%
Car Repair
3.0
3.2
5%
Real Estate Lease Income
2.8
3.0
6%
Switching
1.6
2.5
56%
Car Hire Revenue
1.0
1.0
5%
Other
6.8
6.1
-11% |
 2012 Commercial
Overview 11
Growth Component
Opportunity Pipeline
Organic Growth
Over 400 active commercial opportunities
Industrial Development
•
Two new facilities already under construction
•
Three plant expansions
•
Three new transload facilities
Modest GDP growth
Headwinds for coal
Promising outlook for 2012 harvest
Favorable outlook for international trade |
 12 |
 Q4 2010
Q4 2011
Operating Ratio - Reported
65.7%
74.7%
Gain/Loss on Sale of Assets
0.4%
0.1%
Operating Ratio - excluding asset sales and impairments
66.1%
74.9%
45G Credit
13.8%
2.4%
Operating Ratio - excluding 45G benefit, asset sales and impairments
¹ 79.9%
77.3%
Fuel
9.2%
8.8%
Severance
0%
1.1%
Remaining expenses excluding fuel
70.6%
67.4%
% of Operating Revenue
Continued focus on operating ratio improvement
13
Operating
Ratio
–
excluding
45G
benefit,
asset
sales
and
impairments
improved
significantly
despite
severance
costs
and
the
unfavorable
margin
impact
of
strong
engineering
services
growth.
Fuel improved 40 basis points.
Other expenses excluding fuel and severance improved 320
basis points.
______________________
Note:
(1)
See page 27 to 28 for a reconciliation to GAAP.
(2)
Numbers may not add or recalculate due to rounding. |
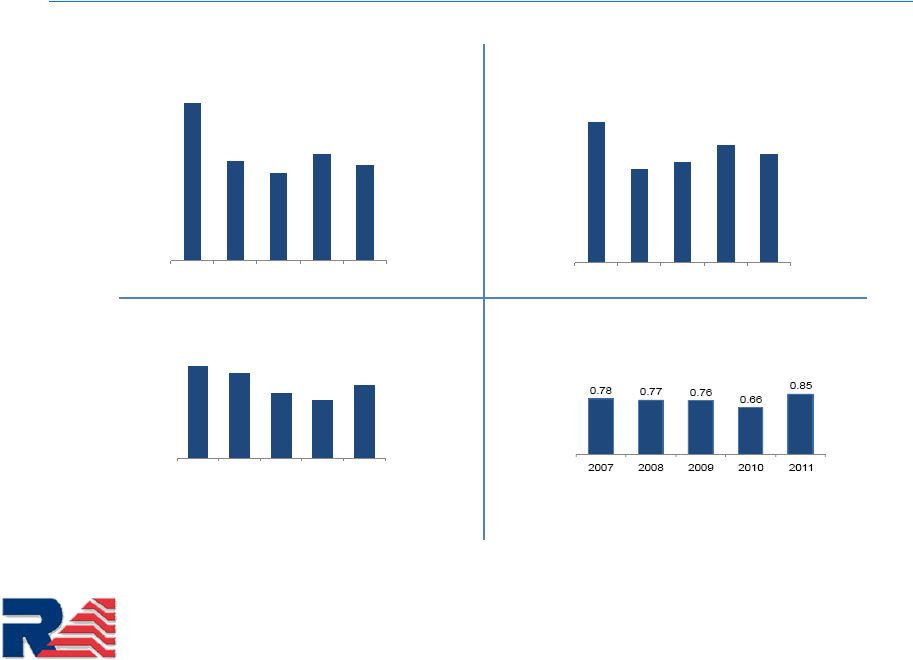 Safety
trends 14
41
26
23
28
25
2007
2008
2009
2010
2011
FRA Reportable Personal
Injuries
2.5
1.6
1.8
2.1
1.9
2007
2008
2009
2010
2011
Personal Injury (PI) Ratio
______________________
Note:
RailAmerica includes Canadian railroads and excludes Atlas.
PI ratio rate per 200,000 man hours worked.
FRA = Federal Railroad Administration.
48
44
34
30
38
2007
2008
2009
2010
2011
FRA Reportable Train
Accidents
FRA Reportable Train
Accident Ratio |
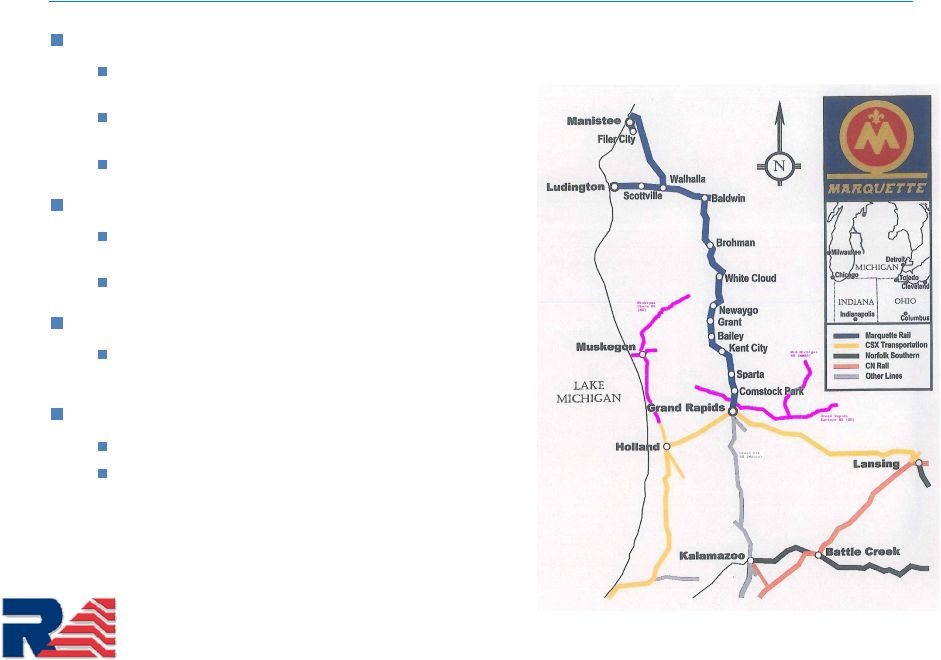 Marquette Rail
Acquisition 15
Property
126 miles of track in Western Michigan near RA’s Mid Michigan
Railroad
~15,000 cars a year of chemicals, pulp & paper and non-metallics
with long term, stable customers
Quality infrastructure
Investment Rationale
Modest organic growth combined with some large new business
opportunities
Quality property near RA roads drives operating synergies
Transaction
$40 million purchase price subject to adjustments for working
capital
Projections next twelve months
~ $13 million of revenue
~ $4 million of operating income (excluding closing costs) and
~ $2 million of depreciation and amortization |
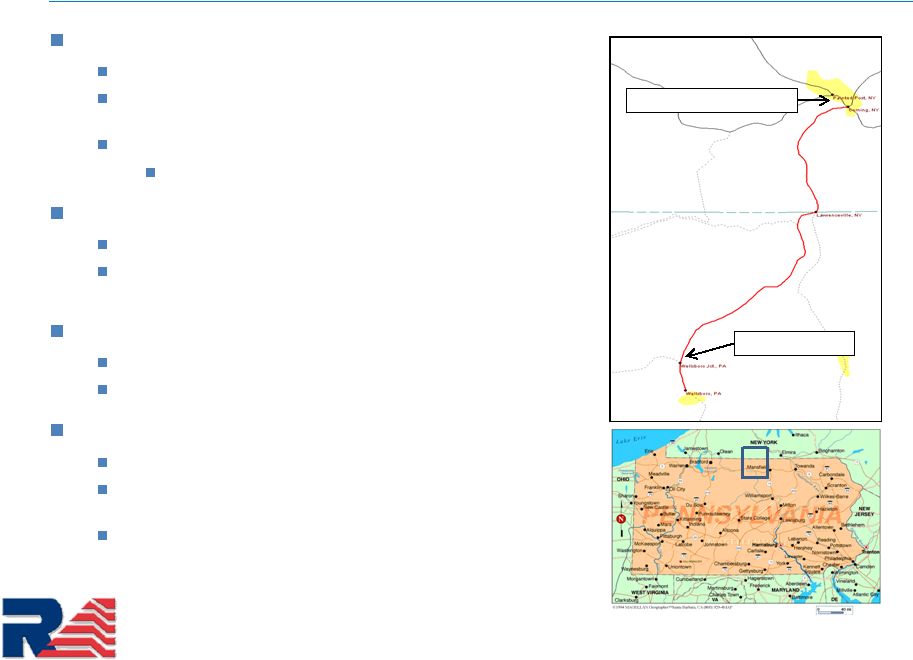 Wellsboro &
Corning Railroad (WCOR) and Industrial Waste Group (IWG) 16
Property
38 miles of track between Corning, NY and Wellsboro, PA
~5,700 carloads in 2011 of frac sand, drill cuttings and
agricultural products
Four transload facilities serving gas industry and metal recyclers
Wellsboro, PA; Corning, NY; Toledo, OH; and Amelia, VA
Investment Rationale
Exposure to the growing Marcellus shale macro-economy
Bring on transload expertise and combine with existing
RailAmerica network and customers
Transaction
$18 million purchase price for 70% interest
Expected close in early Q2
Projections next twelve months
~ $17
million of revenue (100% of entity)
~ $3.5 million of operating income (excluding closing costs) and
~ $1.3 million of depreciation and amortization (100% of entity)
30% minority interest elimination from RA’s net income
Interchange with NS / CPRS
Sand Delivery Site |
 17 |
 Fourth quarter
2011 EPS totaled $0.29 per share including 45G benefit 18
______________________
Note:
Numbers may not add due to rounding.
($ in millions except EPS)
Q4 2010
Q4 2011
($)
(%)
Operating revenue
$127.6
$147.3
$19.7
15%
Operating expenses
(83.9)
(110.1)
(26.2)
31%
Operating income
$43.8
$37.2
($6.5)
-15%
Interest expense
(19.2)
(17.4)
Other income (loss)
0.4
0.5
Income before taxes
$25.0
$20.4
($4.6)
-19%
Provision for income taxes
7.1
5.3
Net Income
$17.9
$15.0
($2.9)
-16%
EPS - diluted
$0.33
$0.29
Change |
 Fourth quarter
2011 adjusted net income was $0.33 per share including $0.04 per share from 45G
benefit 19
______________________
Note:
(1)
Q4 2011 cash taxes paid were $1.0
million .
(2)
Numbers may not add due to rounding.
(In thousands, except per share data)
After Tax
Per Share
Net income (loss)
$15,025
$0.29
Add:
Amortization of swap termination costs
1,393
0.03
Acquisition costs
332
0.01
Adjusted net income
$16,750
$0.33
Weighted Average common shares outstanding (diluted)
51,059
Q4 2011 |
 Fourth quarter
2011 detailed results compared to prior year 20
______________________
Note:
(1)
See page 27 to 28 for a reconciliation to GAAP.
(2)
Numbers may not add due to rounding.
(in thousands, except carloads and revenue per carload)
Q4 2010
% of
Revenue
Q4 2011
% of
Revenue
($)
(%)
Carloads
215,454
211,848
(3,606)
-2%
Average Freight Revenue/Carload
$455
$488
$33
7%
Freight revenue
$97,987
$103,289
$5,302
5%
Non-freight revenue
29,649
44,017
14,368
48%
Operating revenue
$127,636
$147,306
$19,670
15%
Labor & benefits
$39,612
31%
$39,819
27%
$207
Equipment rents
8,262
6%
8,215
6%
(47)
Purchased services
9,913
8%
16,646
11%
6,733
Diesel fuel
11,794
9%
12,974
9%
1,180
Casualties & insurance
4,319
3%
2,749
2%
(1,570)
Materials
5,026
4%
9,004
6%
3,978
Joint facilities
2,122
2%
2,453
2%
331
Other expenses
9,064
7%
9,538
6%
474
Track maintenace expense reimbursement
(17,589)
-14%
(3,552)
-2%
14,037
Loss (gain) on sales of assets
(474)
0%
(201)
0%
273
Impairment of assets
-
0%
-
0%
-
Depreciation expense
11,832
9%
12,428
8%
596
Operating expenses
$83,881
65.7%
$110,073
74.7%
$26,192
31%
Operating income
$43,755
34.3%
$37,233
25.3%
($6,522)
-15%
$25,692
20.1%
$33,480
22.7%
$7,788
30%
Change
Operating income excluding 45G benefit, asset sales and
impairments
(1) |
 Capital
expenditures 21
Capital Expenditures
______________________
Note:
Numbers may not add due to rounding.
($ in millions)
2010
2011
2010
2011
Maintenance
$10.0
$25.7
$50.0
$66.3
Project (non-NECR)
4.8
4.8
11.6
17.4
NECR High Speed Rail Project *
2.9
8.1
2.9
52.5
45G Credit
(4.2)
(1.4)
(4.2)
(5.4)
Reported Capex
$13.5
$37.3
$60.3
$130.8
* Sources of NECR Project Fundin
$2.9
$8.1
$2.9
$52.5
NECR Grant
2.5
5.9
2.5
37.2
Scrap Sales Related to NECR Project
-
7.2
-
12.1
RA Contribution
0.4
(5.0)
0.4
3.2
Fourth Quarter
Full Year |
 Favorable tax
attributes enhance cash flow and value to shareholders 22
Significant federal net operating loss carryforwards (NOL’s)
Unused 45G credits of $95 million
Minimal cash tax payer
Fourth quarter 2011 summary
•
Financial statement income tax expense: $5.3 million
•
Cash taxes paid:
$1.0 million |
 Strong capital
structure supports organic growth and strategic investments 23
Capitalization
______________________
Note:
Numbers may not add due to rounding.
Share repurchase program
Redeemed $74 million of notes in January, 2012
Tender offer announced in February, 2012 for up to $444 million of Senior Notes
($ in millions)
At December
31, 2010
At December
31, 2011
Cash & equivalents
$153.0
$91.0
Senior Secured Notes due 2017
571.2
573.6
Other debt
2.6
2.1
Total debt
$573.7
$575.7
Stockholders equity
$704.7
$680.1
Total capitalization
$1,278.4
$1,255.8
Total debt / Total capitalization
45%
46%
Net debt / Total capitalization
33%
39% |
 Q1 and Full Year
Estimates 24
______________________
Note:
(1)
Assumes WCOR and IWG closes May and Marquette closes July
(2)
Assumes Senior notes remain in place at current balance and acquisitions financed
with 25% cash ($ in millions)
Q1 2012
FY 2012
Carload Growth (incl announced acquisitions)
(1)
1% to 3%
4% to 5%
Core Pricing
~ 4%
~ 4%
Non-freight Revenue $'s (incl announced acquisitions)
(1)
$27 to $29
$146 to $149
Operating Ratio (excluding 45G, Asset Sales & Impairments)
~ 81%
78% to 79%
Interest expense:
(2)
Swap loss amortization
$1.6
$5.3
Deferred loan costs
0.6
2.3
Original issue discount
0.6
2.3
Senior note interest
12.1
48.0
Other interest
0.2
1.7
Total
$15.1
$59.6
45G credits:
Operating expense benefit
$0.0
$0.0
Capital expenditure benefit
$0.0
$0.0
Capital expenditures:
Capex excluding 45G & NECR High Speed Rail Project
(1)
$23 to $26
~ $76
NECR Project (net of grants & scrap sales)
~ $1
~ $4
Effective tax rate
37% to 38%
37% to 38%
Cash taxes
~ $1.5
$4 to $5 |
 25 |
 26 |
 Operating Income
and Operating Ratio Excluding 45G Benefit Reconciliation to GAAP & Operating Income
and Operating Ratio Excluding 45G Benefit, Asset Sales & Impairments Reconciliation to GAAP
27
______________________
Note:
(1)
Numbers may not add due to rounding.
Operating
Income
Excluding
45G
Benefit,
Operating
Ratio
Excluding
45G
Benefit,
Operating
Income
Excluding
45G
Benefit,
Asset
Sales
&
Impairments
and
Operating
Ratio
Excluding
45G
Benefit,
Asset
Sales
&
Impairments
are
supplemental
measures
of
profitability
that
are
not
calculated
or
presented
in
accordance
with
U.S.
generally
accepted
accounting
principles
(“GAAP”).
We
use
non-GAAP
financial
measures
as
a
supplement
to
our
GAAP
results
in
order
to
provide
a
more
complete
understanding
of
the
factors
and
trends
affecting
our
business.
However,
Operating
Income
Excluding
45G
Benefit,
Operating
Ratio
Excluding
45G
Benefit,
Operating
Income
Excluding
45G
Benefit,
Asset
Sales
&
Impairments
and
Operating
Ratio
Excluding
45G
Benefit,
Asset
Sales
&
Impairments
have
limitations
as
analytical
tools.
They
are
not
measurements
of
our
profitability
under
GAAP
and
should
not
be
considered
as
alternatives
to
Operating
Income
or
Operating
Ratio
as
measures
of
profitability.
Operating
Income
Excluding
45G
Benefit
and
Operating
Ratio
Excluding
45G
Benefit
assist
us
in
measuring
our
performance
and
profitability
of
our
operations
without
the
impact
of
monetizing
the
45G
tax
benefit.
Operating
Income
Excluding
45G
Benefit,
Asset
Sales
&
Impairments
and
Operating
Ratio
Excluding
45G
Benefit,
Asset
Sales
&
Impairments
assist
us
in
measuring
our
performance
and
profitability
of
our
operations
without
the
impact
of
monetizing
the
45G
tax
benefit,
Asset
Sales
and
Impairments.
The
following
table
sets
forth
the
reconciliation
of
Operating
Income
Excluding
45G
Benefit
from
our
Operating
Income,
Operating
Ratio
Excluding
45G
Benefit
from
our
Operating
Ratio,
Operating
Income
Excluding
45G
Benefit,
Asset
Sales
&
Impairments
from
our
Operating
Income
and
Operating
Ratio
Excluding
45G
Benefit,
Asset
Sales
&
Impairments
from
our
Operating
Ratio.
($ in thousands)
Operating revenue
$124,937
$139,215
$139,665
$147,306
$551,123
Operating expense
100,734
110,517
108,177
110,073
429,501
Operating Income, reported
24,203
28,698
31,488
37,233
121,622
Operating ratio Reported
80.6%
79.4%
77.5%
74.7%
77.9%
Less: Benefit from 45G credits
(4,150)
3.3%
(5,133)
3.7%
(3,879)
2.8%
(3,552)
2.4%
(16,714)
3.0%
Operating income excluding 45G Benefit
20,053
23,565
27,609
33,681
104,908
Operating ratio excluding 45G Benefit
83.9%
83.1%
80.3%
77.1%
81.0%
Net (gain) loss on sale of assets
207
-0.2%
(64)
0.0%
8
0.0%
(201)
0.1%
(50)
0.0%
Impairment of assets
-
0.0%
3,220
-2.3%
1,949
-1.4%
-
0.0%
5,169
-0.9%
Operating income excluding 45G Benefit, Asset Sales & Impairments
$20,260
$26,721
$29,566
$33,480
$110,027
Operating ratio, excluding 45G Benefit, Asset Sales & Impairments
83.8%
80.8%
78.9%
77.3%
80.0%
2011
Q1
Q2
Q3
Q4
FY |
 Operating Income
and Operating Ratio Excluding 45G Benefit Reconciliation to GAAP & Operating Income
and Operating Ratio Excluding 45G Benefit, Asset Sales & Impairments Reconciliation to GAAP
(cont) 28
______________________
Note:
(1)
Numbers may not add due to rounding.
($ in thousands)
Operating revenue
$114,941
$119,457
$128,257
$127,636
$490,291
Operating expense
95,740
96,397
99,766
83,881
375,784
Operating Income, reported
19,201
23,060
28,491
43,755
114,507
Operating ratio Reported
83.3%
80.7%
77.8%
65.7%
76.6%
Less: Benefit from 45G credits
-
0.0%
-
0.0%
-
0.0%
(17,589)
13.8%
(17,589)
3.6%
Operating income excluding 45G Benefit
19,201
23,060
28,491
26,166
96,918
Operating ratio excluding 45G Benefit
83.3%
80.7%
77.8%
79.5%
80.2%
Net (gain) loss on sale of assets
(34)
0.0%
25
0.0%
(1,708)
1.3%
(474)
0.4%
(2,191)
0.4%
Addback IPO charge
-
0.0%
-
0.0%
-
0.0%
-
0.0%
-
0.0%
Operating income excluding 45G Benefit, Asset Sales & Impairments
$19,167
$23,085
$26,783
$25,692
$94,727
Operating ratio, excluding 45G Benefit, Asset Sales & Impairments
83.3%
80.7%
79.1%
79.9%
80.7%
2010
Q1
Q2
Q3
Q4
FY |
 Adjusted income
from continuing operations reconciliation to GAAP 29
______________________
Note:
(1)
Numbers may not add due to rounding.
Adjusted net income (loss) is a supplemental measure of profitability that is not
calculated or presented in accordance with U.S. generally accepted accounting
principles (“GAAP”). We use non-GAAP financial measures as a supplement to our GAAP results in order to provide a more complete
understanding of the factors and trends affecting our business.
However, Adjusted net income (loss) has limitations as an analytical tool.
It is not a measurement of our profitability under GAAP and should not be
considered as an alternative to Net income (loss) as a measure of profitability.
Adjusted net income (loss) assists us in measuring our performance and
profitability of our operations without the impact of transaction costs related to debt
and credit facility extinguishment, acquisitions, impairment of assets and swap
termination. The following table sets forth the reconciliation of Adjusted net
income (loss).
(In thousands, except per share data)
After Tax
Per Share
After Tax
Per Share
After Tax
Per Share
After Tax
Per Share
After Tax
Per Share
Net income (loss)
$4,085
$0.07
$8,700
$0.17
$9,058
$0.17
$15,025
$0.29
$36,868
$0.70
Add:
Amortization of swap termination costs
2,243
0.04
1,953
0.04
1,675
0.03
1,393
0.03
7,264
0.14
Impairment of assets
-
-
1,964
0.04
1,189
0.02
-
-
3,153
0.06
Loss on extinguishment of credit facility
-
-
-
-
439
0.01
-
-
439
0.01
Acquisition expense
44
0.00
148
0.00
124
0.00
332
0.01
648
0.01
Adjusted net income (loss)
$6,372
$0.12
$12,765
$0.24
$12,485
$0.24
$16,750
$0.33
$48,372
$0.92
Weighted Average common shares outstanding (diluted)
54,651
52,282
52,083
51,059
52,519
(In thousands, except per share data)
After Tax
Per Share
After Tax
Per Share
After Tax
Per Share
After Tax
Per Share
After Tax
Per Share
Net income (loss)
($2,514)
($0.05)
($4,221)
($0.08)
$7,968
$0.15
$17,884
$0.33
$19,117
$0.35
Add:
Amortization of swap termination costs
3,644
0.07
3,437
0.06
2,973
0.05
2,628
0.05
12,682
0.23
Loss on extinguishment of debt
-
-
5,098
0.09
-
-
-
-
5,098
0.09
Acquisition (income) expense
-
-
159
0.00
(1,043)
(0.02)
91
0.00
(793)
(0.01)
Adjusted net income (loss)
$1,130
$0.02
$4,473
$0.08
$9,898
$0.18
$20,603
$0.38
$36,104
$0.66
Weighted Average common shares outstanding (diluted)
54,568
54,869
54,872
54,864
54,793
2011
2010
Q1
Q2
Q3
Q4 YTD
Q1
Q2
Q3
Q4 YTD
Q4
Q4 |
 Adjusted EBITDA
reconciliation to GAAP 30
Adjusted EBITDA, is a supplemental measure of liquidity that is not calculated or
presented in accordance with U.S. generally accepted accounting principles
(“GAAP”). We use non-GAAP financial measures as a supplement to our GAAP results in order to provide a more complete
understanding of the factors and trends affecting our business. However, Adjusted
EBITDA has limitations as an analytical tool. It is not a measurement of our
cash flows from operating activities under GAAP and should not be considered as an alternative to cash flow from operating
activities as a measure of liquidity.
Adjusted EBITDA assists us in monitoring our ability to undertake key investing and
financing functions such as making investments, transferring property,
paying dividends, and incurring additional indebtedness, which are generally prohibited by the covenants under our senior secured notes
unless we meet certain financial ratios and tests. Adjusted EBITDA represents
EBITDA before impairment of assets, equity compensation costs and
acquisition costs. EBITDA, also a non-GAAP financial measure, is defined as net income (loss) before interest expense, provision for (benefit
from) income taxes and depreciation and amortization.
The following tables set forth the reconciliation of Adjusted EBITDA from our cash
flow from operating activities (in thousands): Q1 2011
Q2 2011
Q3 2011
Q4 2011
YTD 2011
Cash flows from operating activities to Adjusted EBITDA
Reconciliation:
Net cash provided by operating activities
$ 23,123
$ 29,605
$ 19,011
$ 30,550
$102,289
Changes in working capital accounts
1,015
1,659
13,940
9,156
25,770
Depreciation and amortization, including amortization of debt
issuance costs classified in interest expense
(12,945)
(12,919)
(13,148)
(13,690)
(52,702)
Amortization of swap termination costs
(3,677)
(3,201)
(2,747)
(2,283)
(11,908)
Net (loss) gain on sale or disposal of properties
(207)
64
(8)
201
50
Impairment of assets
-
(3,220)
(1,949)
-
(5,169)
Equity compensation costs
(2,609)
(2,370)
(2,402)
(2,838)
(10,219)
Financing costs
-
-
(719)
-
(719)
Deferred income taxes
(615)
(918)
(2,920)
(6,071)
(10,524)
Net income
4,085
8,700
9,058
15,025
36,868
Add:
-
Provision for income taxes
2,067
2,350
4,407
5,338
14,162
Interest expense, including amortization costs
18,591
18,143
17,792
17,397
71,923
Depreciation and amortization
11,764
11,736
11,921
12,428
47,849
EBITDA
36,507
40,929
43,178
50,188
170,802
Add:
-
Equity compensation costs
2,609
2,370
2,402
2,838
10,219
Severance - non equity
1,210
-
-
1,141
2,351
Impairment of assets
-
3,220
1,949
-
5,169
Financing costs
-
-
719
-
719
Acquisition costs
72
243
203
545
1,063
Adjusted EBITDA
$ 40,398
$ 46,762
$ 48,451
$ 54,712
$190,323 |
 Adjusted EBITDA
reconciliation to GAAP (continued) 31
Q1 2010
Q2 2010
Q3 2010
Q4 2010
YTD 2010
Cash flows from operating activities to Adjusted EBITDA Reconciliation:
Net cash provided by operating activities
$ 25,440
$ 33,290
$ 9,142
$ 49,297
$117,169
Changes in working capital accounts
(10,191)
(13,583)
18,975
(6,050)
(10,849)
Depreciation and amortization, including amortization of debt issuance costs
classified in interest expense
(12,151)
(11,988)
(12,724)
(12,984)
(49,847)
Amortization of swap termination costs
(6,073)
(5,635)
(4,874)
(4,309)
(20,891)
Net gain (loss) on sale or disposal of properties
34
(25)
1,708
474
2,191
Loss on extinguishment of debt
-
(8,357)
-
-
(8,357)
Equity compensation costs
(1,525)
(1,965)
(2,035)
(2,009)
(7,534)
Deferred income taxes
1,952
4,042
(2,224)
(6,535)
(2,765)
Net income
(2,514)
(4,221)
7,968
17,884
19,117
Add:
(Benefit from) provision for income taxes
(530)
(2,772)
3,052
7,106
6,856
Interest expense, including amortization costs
22,704
22,153
19,735
19,183
83,775
Depreciation and amortization
10,923
10,755
11,581
11,832
45,091
EBITDA
30,583
25,915
42,336
56,005
154,839
Add:
Equity compensation costs
1,525
1,965
2,035
2,009
7,534
Loss on extinguishment of debt
-
8,357
-
-
8,357
Acquisition costs
-
261
(1,710)
149
(1,300)
Adjusted EBITDA
$ 32,108
$ 36,498
$ 42,661
$ 58,163
$169,430 |
  45G tax credit
32
______________________
Note:
(1)
Numbers may not add due to rounding.
($ in millions)
Q1
Q2
Q3
Q4
FY
2009 Actual
Income Statement Benefit
4.1
4.1
4.5
3.9
16.7
Capital Expenditure Benefit
-
-
-
5.2
5.2
2010 Actual
Income Statement Benefit
-
-
-
17.6
17.6
Capital Expenditure Benefit
-
-
-
4.2
4.2
2011 Actual
Income Statement Benefit
4.2
5.1
3.9
3.6
16.7
Capital Expenditure Benefit
-
4.0
-
1.4
5.4
Financial Impact of 45G Credit Assignment |
 Swap
amortization 33
______________________
Note:
(1)
Numbers may not add due to rounding.
($ in millions)
2012
2013
2014
Q1
$1.6
$0.8
$0.2
Q2
$1.4
$0.7
Q3
$1.3
$0.6
Q4
$1.1
$0.5
FY
(1)
$5.3
$2.5
$0.2 |