Attached files
| file | filename |
|---|---|
| 8-K - 8-K - NATIONAL FUEL GAS CO | d296144d8k.htm |
 Investor Presentation
Fiscal 2012 First Quarter Financial & Operational Update
February 8, 2012
Exhibit 99 |
 February 8,
2012 National Fuel Gas Company
2
Safe Harbor For Forward Looking Statements
www.sec.gov.
www.nationalfuelgas.com.
You can also obtain this from on the SEC’s website at
This presentation may contain “forward-looking statements” as defined by the
Private Securities Litigation Reform Act of 1995, including statements regarding future prospects, plans,
performance and capital structure, anticipated capital expenditures and completion of
construction projects, as well as statements that are identified by the use of the words “anticipates,”
“estimates,” “expects,” “forecasts,” “intends,”
“plans,” “predicts,” “projects,” “believes,” “seeks,” “will,” “may,” and similar expressions. Forward-looking statements involve risks and
uncertainties, which could cause actual results or outcomes to differ materially from those
expressed in the forward-looking statements. The Company’s expectations, beliefs and projections
contained herein are expressed in good faith and are believed to have a reasonable basis, but
there can be no assurance that such expectations, beliefs or projections will result or be achieved
or accomplished.
In addition to other factors, the following are important factors that could cause actual
results to differ materially from results referred to in the forward-looking statements: factors
affecting the Company’s ability to successfully identify, drill for and produce
economically viable natural gas and oil reserves, including among others geology, lease availability, title
disputes, weather conditions, shortages, delays or unavailability of equipment and services
required in drilling operations, insufficient gathering, processing and transportation
capacity, the need to obtain governmental approvals and permits, and compliance with
environmental laws and regulations; changes in laws, regulations or judicial interpretations to
which the Company is subject, including those involving derivatives, taxes, safety, employment,
climate change, other environmental matters, real property, and exploration and
production activities such as hydraulic fracturing; changes in the price of natural gas or oil;
uncertainty of oil and gas reserve estimates; significant differences between the Company’s
projected and actual production levels for natural gas or oil; impairments under the SEC’s
full cost ceiling test for natural gas and oil reserves; changes in the availability, price or
accounting treatment of derivative financial instruments; governmental/regulatory actions,
initiatives and proceedings, including those involving rate cases (which address, among
other things, allowed rates of return, rate design and retained natural gas),
environmental/safety requirements, affiliate relationships, industry structure, and franchise renewal;
delays or changes in costs or plans with respect to Company projects or related projects of
other companies, including difficulties or delays in obtaining necessary governmental
approvals, permits or orders or in obtaining the cooperation of interconnecting facility
operators; financial and economic conditions, including the availability of credit, and
occurrences affecting the Company’s ability to obtain financing on acceptable terms for
working capital, capital expenditures and other investments, including any downgrades in the
Company’s credit ratings and changes in interest rates and other capital market conditions;
changes in economic conditions, including global, national or regional recessions, and their
effect on the demand for, and customers’ ability to pay for, the Company’s products
and services; the creditworthiness or performance of the Company’s key suppliers, customers and
counterparties; economic disruptions or uninsured losses resulting from major accidents, fires,
severe weather, natural disasters, terrorist activities, acts of war, cyber attacks or pest
infestation; changes in price differential between similar quantities of natural gas at
different geographic locations, and the effect of such changes on the demand for pipeline
transportation capacity to or from such locations; other changes in price differentials between
similar quantities of oil or natural gas having different quality, heating value, geographic
location or delivery date; significant differences between the Company’s projected and
actual capital expenditures and operating expenses; changes in actuarial assumptions, the
interest rate environment and the return on plan/trust assets related to the Company’s
pension and other post-retirement benefits, which can affect future funding obligations and
costs and plan liabilities; changes in demographic patterns and weather conditions; the cost and
effects of legal and administrative claims against the Company or activist shareholder
campaigns to effect changes at the Company; increasing health care costs and the resulting
effect on health insurance premiums and on the obligation to provide other post-
retirement benefits; or increasing costs of insurance, changes in coverage and the ability to
obtain insurance.
Forward-looking statements include estimates of oil and gas quantities. Proved oil and
gas reserves are those quantities of oil and gas which, by analysis of geoscience and engineering data, can
be estimated with
reasonable certainty to be economically producible under existing economic conditions,
operating methods and government regulations. Other estimates of oil and gas
quantities, including estimates of probable reserves, possible reserves, and resource potential,
are by their nature more speculative than estimates of proved reserves. Accordingly, estimates
other than proved reserves are subject to substantially greater risk of being actually realized.
Investors are urged to consider closely the disclosure in our Form 10-K available at
For a discussion of the risks set forth above and other factors that could cause actual results
to differ materially from results referred to in the forward-looking statements, see “Risk Factors” in
the Company’s Form 10-K for the fiscal year ended September 30, 2011 and Form 10-Q
for the period ended December 31, 2011. The Company disclaims any obligation to update any forward-
looking statements to reflect events or circumstances after the date thereof or to reflect the
occurrence of unanticipated events.
|
 February 8,
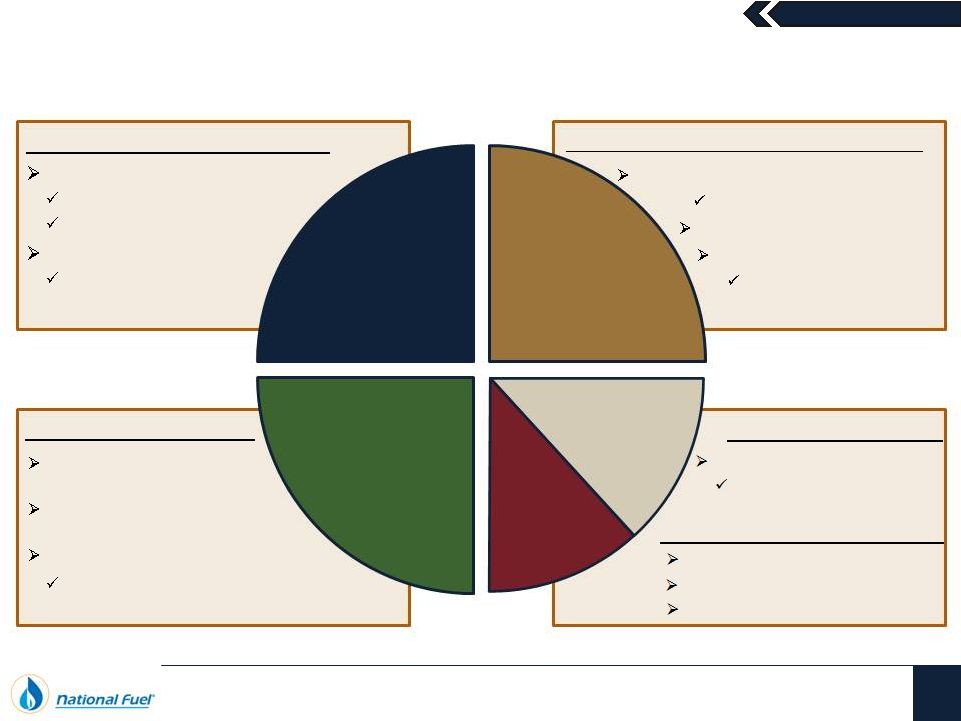
2012 NFG Midstream Corp.
National Fuel Resources, Inc.
NFG Distribution Corp.
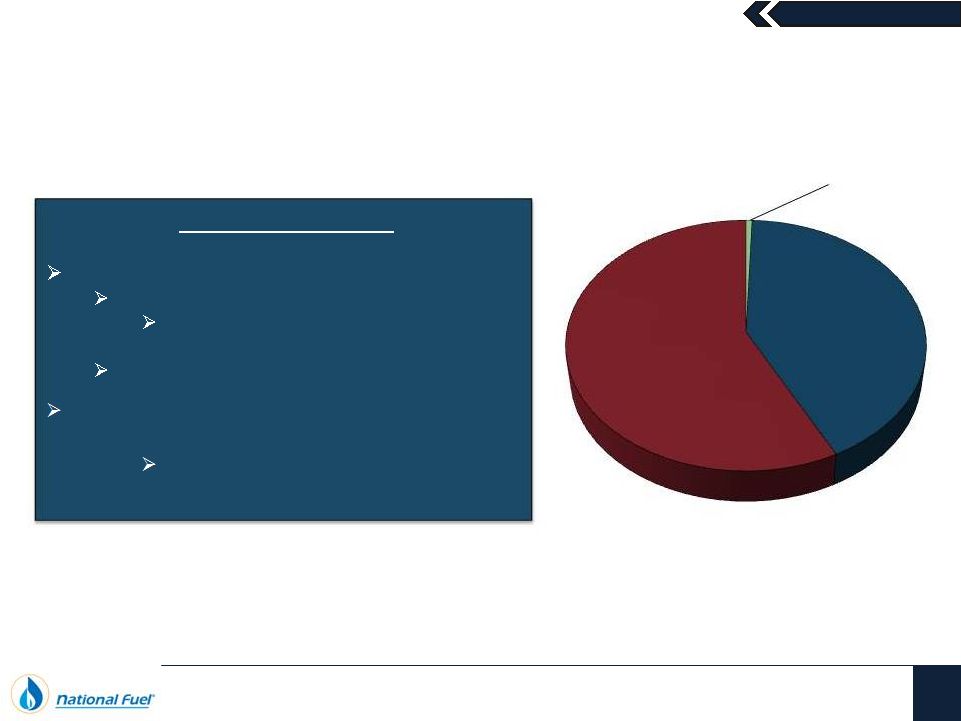
Supports Dividend and Credit Profile
Seneca Resources Corporation
Significant Appalachian Growth
Leading Marcellus Shale Position
Evaluate Utica/Geneseo Shales
Stable Oil Production
Significant Cash Flow
Core Businesses
3
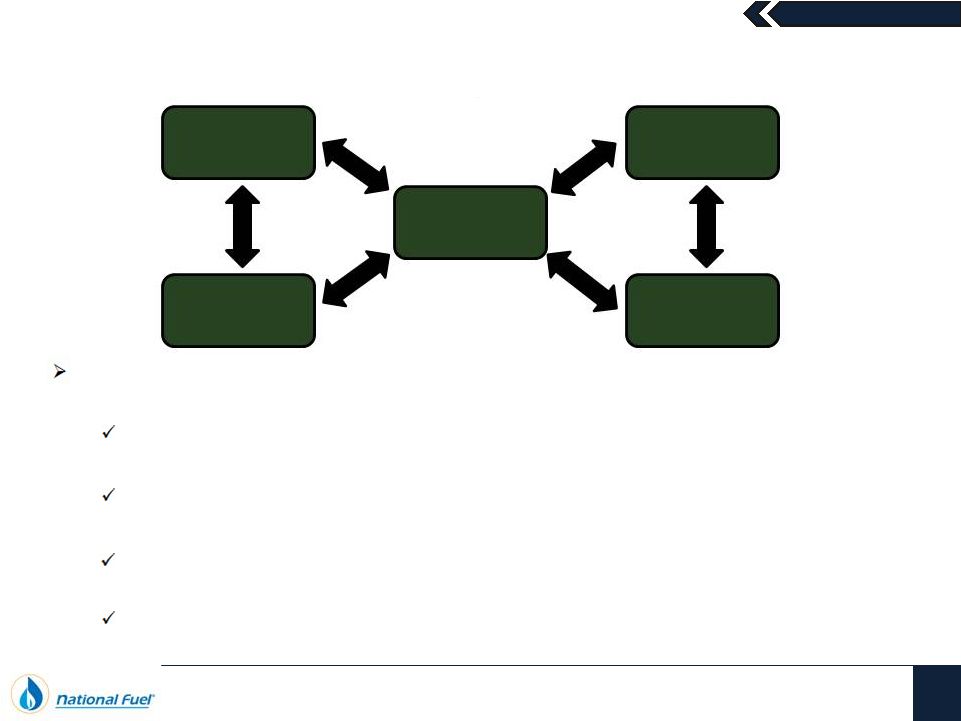
Integrated Business Structure
Utility
Exploration
&
Production
Pipeline
&
Storage
Energy
Marketing
Midstream
Appalachian Gathering Growth
Initial
Focus on Seneca Acreage Limited Capital, Limited Risk Expand into Neighboring
Markets
Maintain Customer Contact
Focus on Customer Service
and Safety
Cost Control and Revenue
Protection
Stable, Predictable Earnings Empire Pipeline &
NFG Supply Corp. Appalachian Pipeline Growth
Delivery to Growth Markets
Create Flexible System
Growing/Predictable EPS
Supports Dividend and
Credit Profile |
 February 8,
2012 National Fuel Gas Company
4
Integrated Business Structure |
 February 8,
2012 National Fuel Gas Company
5
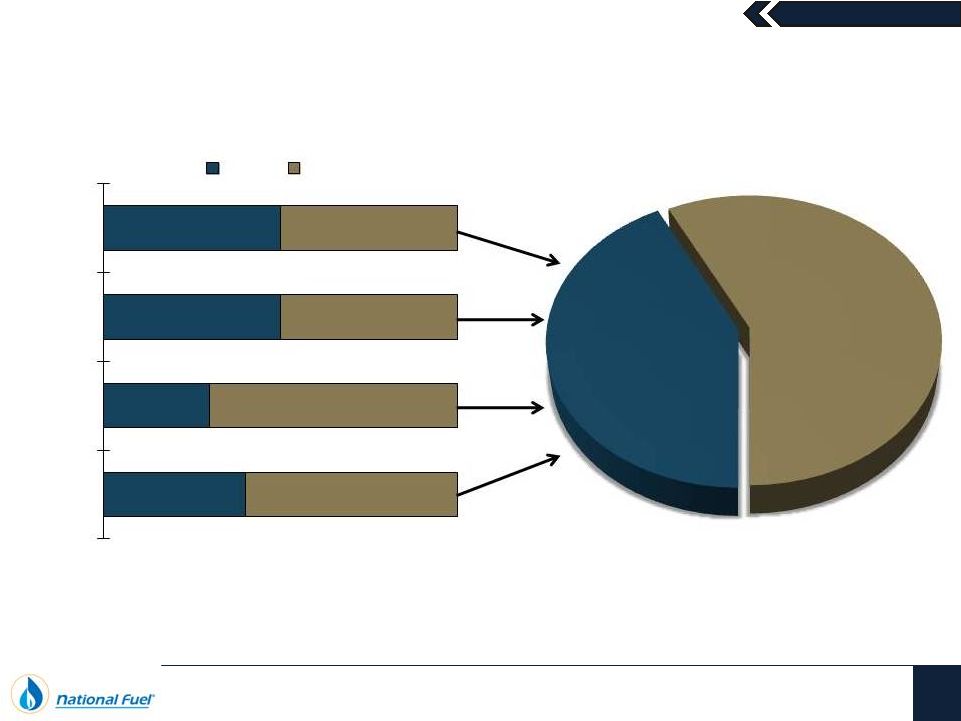
Our Business Mix Leads to Long-Term Value Creation
The strategic and financial benefits created by the integrated mix of businesses has continued
to generate significant long-term value for the Company
The mix of rate-regulated and non-regulated businesses have generated total
shareholder returns that have outperformed over the long-term
The
rate-regulated
returns
–
which
are
not
commodity
price
sensitive
–
provide downside
protection while unregulated returns provide significant upside opportunity
Coordinated development of infrastructure and Marcellus acreage improves the present
value of all operations
The Company’s strong credit profile lowers the cost of capital for all of our
businesses Seneca
Resources
Utility
Energy
Marketing
Pipeline &
Storage
Midstream
Gathering |
 February 8,
2012 Exploration & Production
6 |
 February 8,
2012 Seneca Resources
7
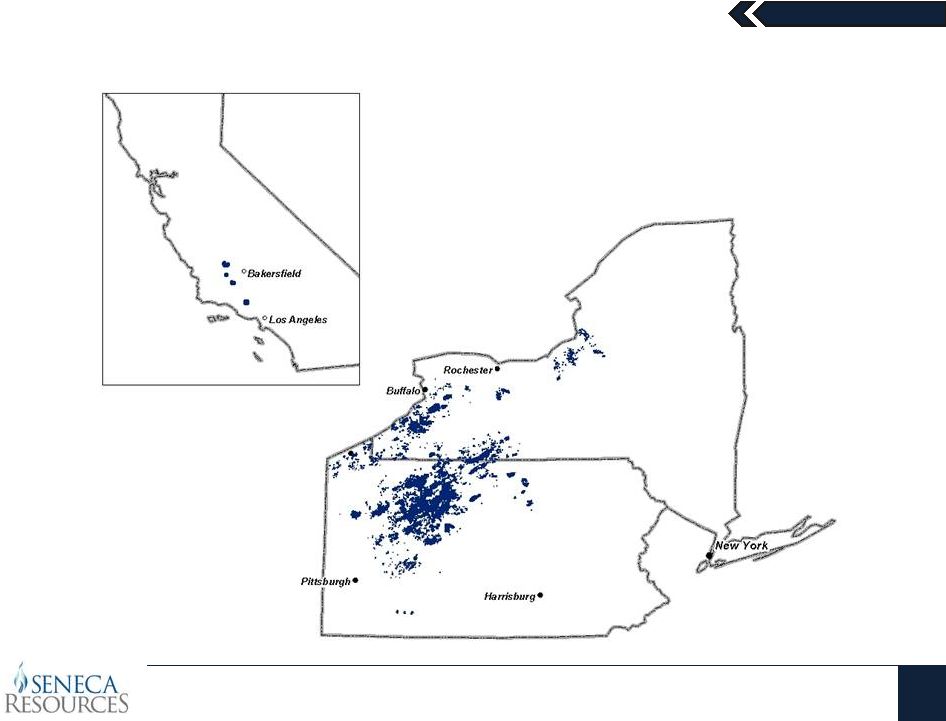
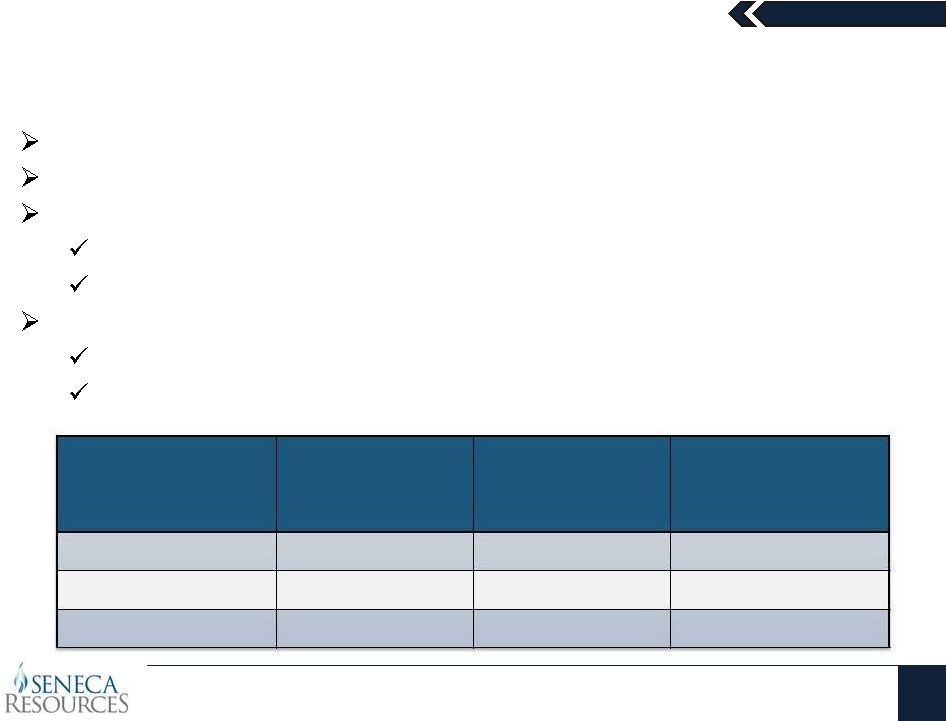
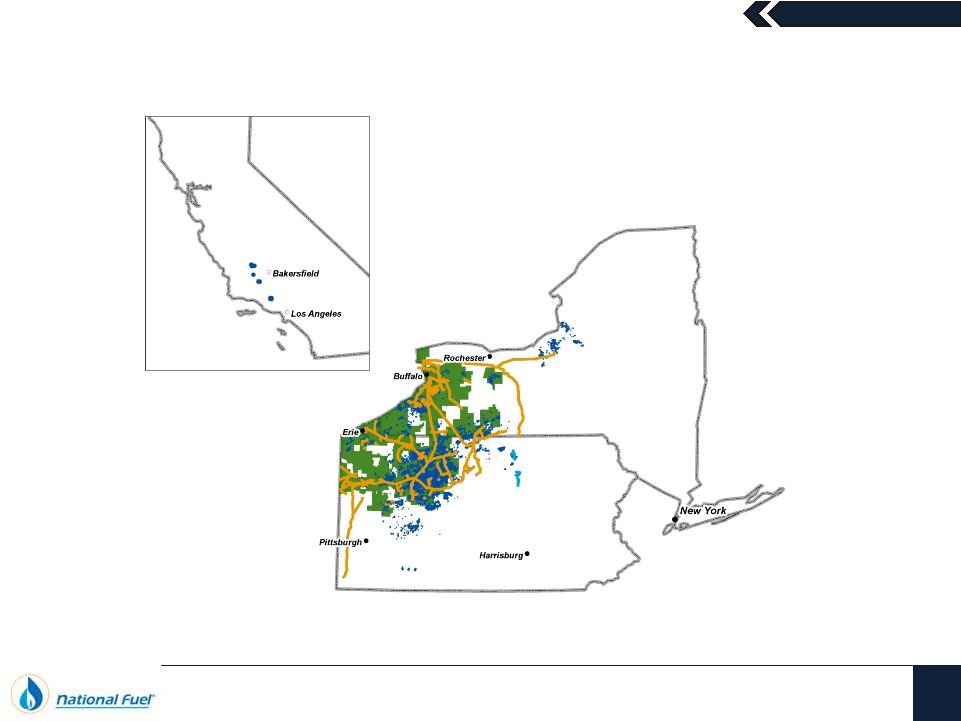
Uniquely Positioned in Pennsylvania
Held over 700,000 Marcellus acres before the play received any attention
Have since added another 45,000 acres in the core of the play
80% of acreage is held in fee
No royalty
No lease expirations
In addition to Marcellus, Seneca has a major position in emerging plays:
Utica Shale
Geneseo Shale (Upper Devonian)
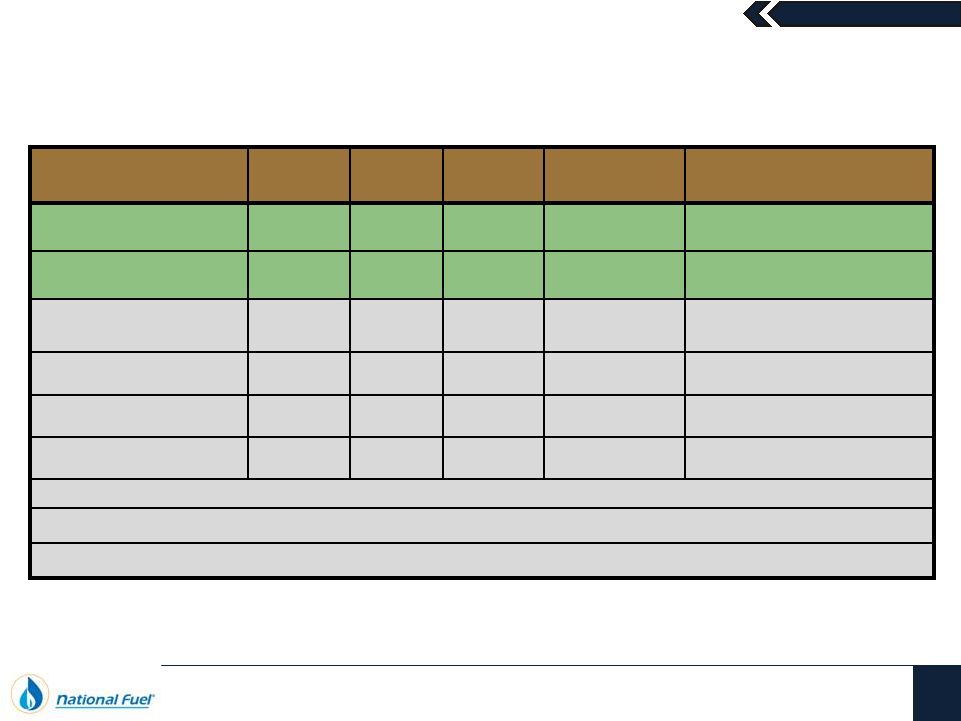
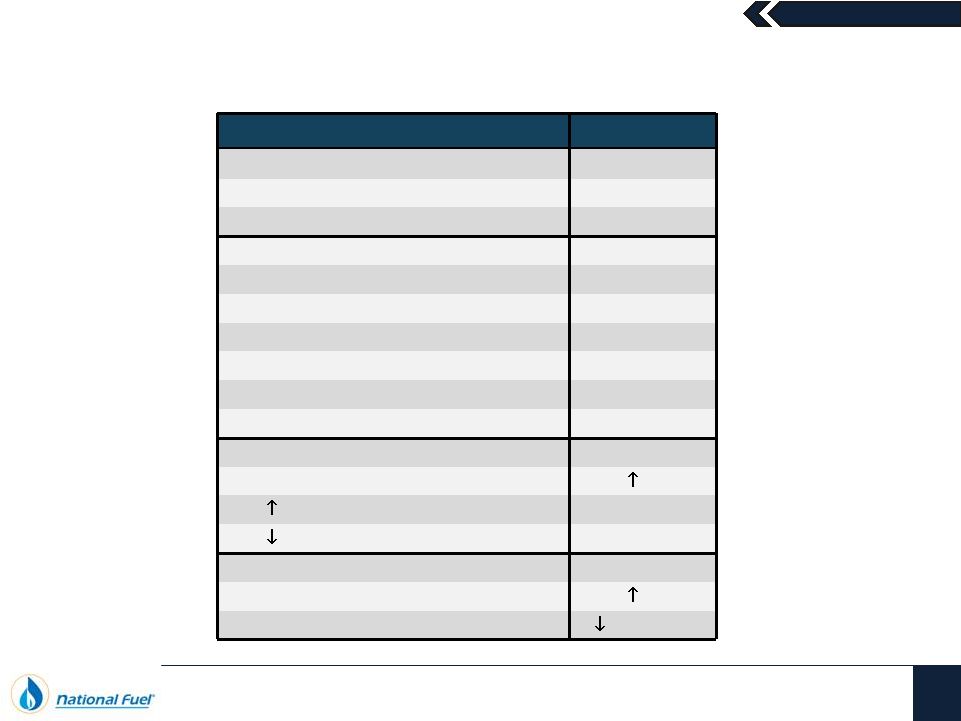
Prospective
Net Acres
Proved Reserves
at 9/30/11
(BCFE)
Risked
Resource
Potential
Marcellus Shale
Geneseo Shale
Utica Shale
745,000
300,000
TBD
491
-
-
TBD
TBD
8-15 TCFE |
 February 8,
2012 Seneca Resources
8
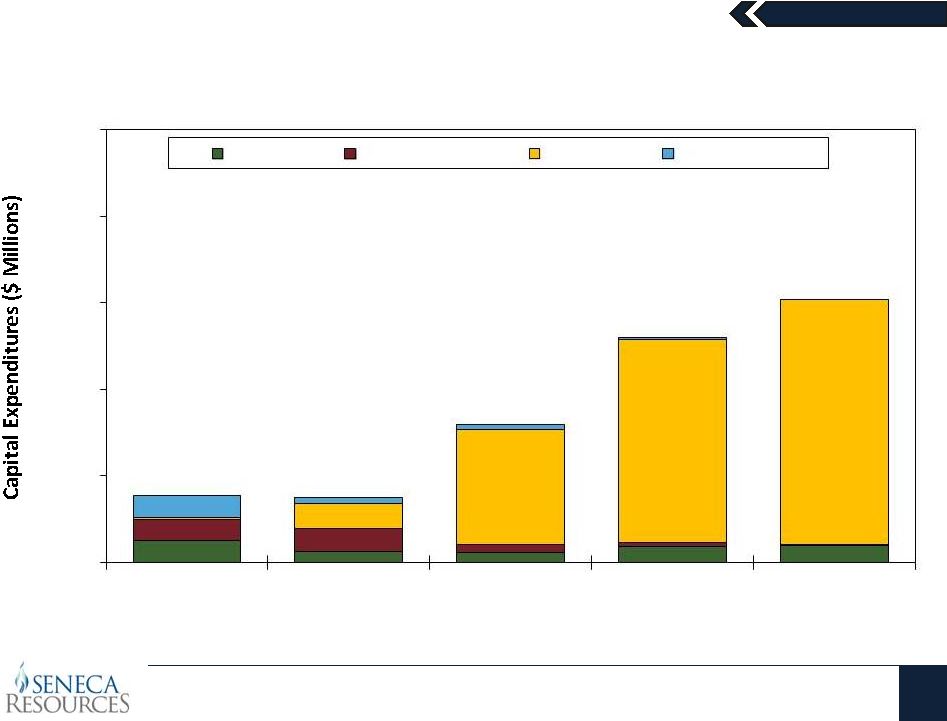
Capital Spending Shifting to the Marcellus
$0
$250
$500
$750
$1,000
$1,250
2008
2009
2010
2011
2012 Forecast
Fiscal Year
California
Upper Devonian
Marcellus
Gulf of Mexico
$63
$47
$45-
55
$61
$68
$71
$332
$585
$675-$745
$64
$192
$188
$398
$649
$720-$800
$31
(1)
Does not include the $34.9 MM acquisition of Ivanhoe’s U.S.-based assets in
California, as this was accounted for as an investment in subsidiaries on the
Statement of Cash Flows, and was not included in Capital Expenditures (1) |
 February 8,
2012 Seneca Resources
9
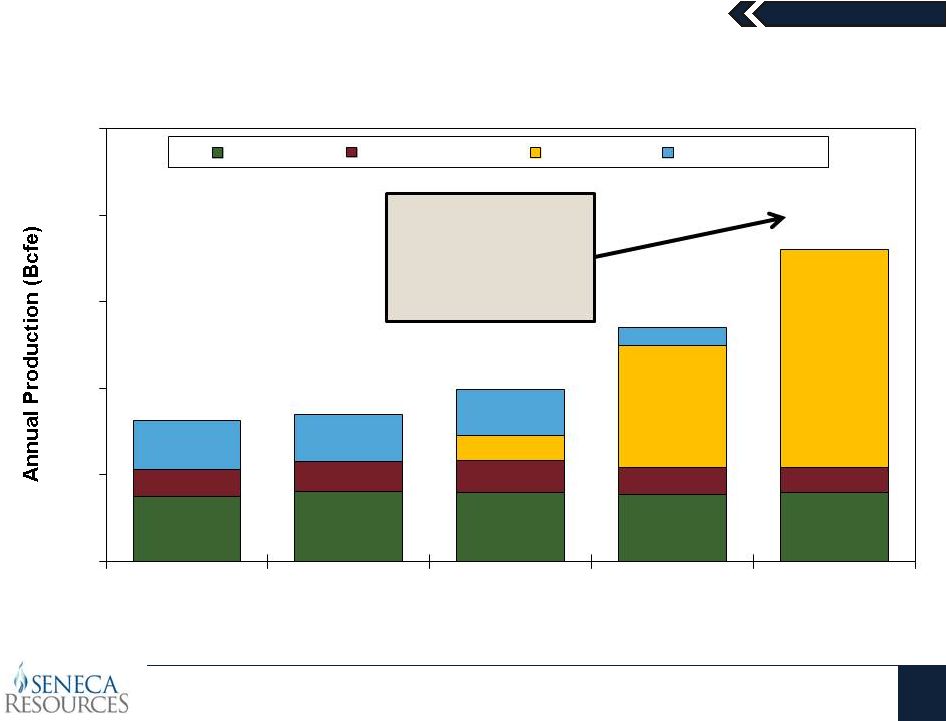
Ramping Up Production Growth
18.8
20.1
19.8
19.2
19-21
7.9
8.7
9.3
7.9
6-8
7.2
35.3
60-66
14.1
13.7
13.4
5.2
40.8
42.5
49.7
67.6
85-95
0
25
50
75
100
125
2008
2009
2010
2011
2012 Forecast
Fiscal Year
California
Upper Devonian
Marcellus
Gulf of Mexico
Annual production
growth of ~25% to
~40% is expected
from 2011 to 2012 |
 February 8,
2012 Seneca Resources
10
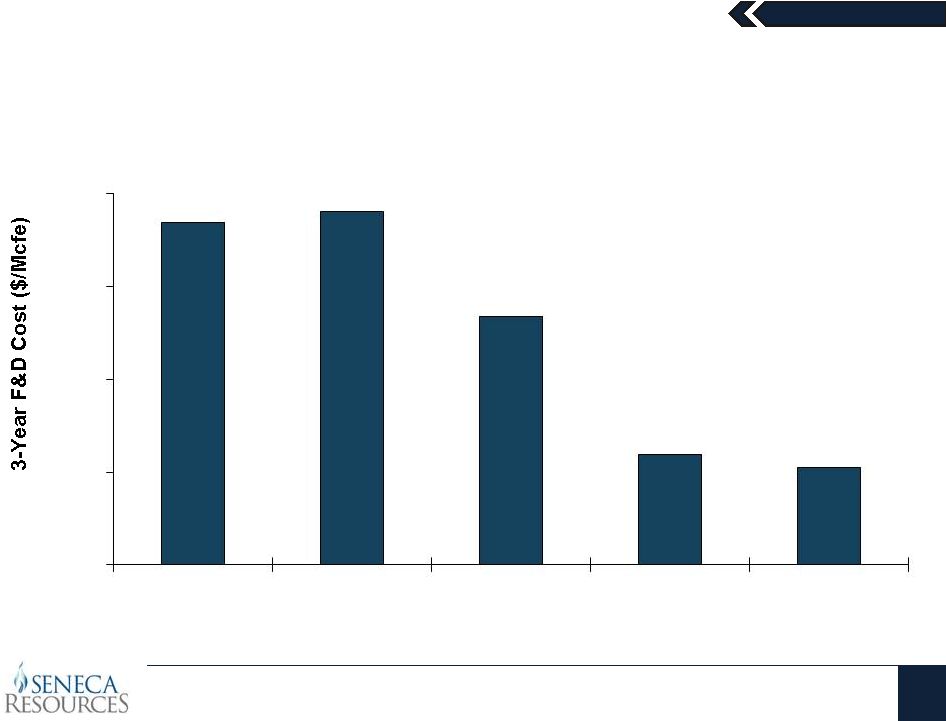
Continued Improvement in Finding & Development Costs
$7.38
$7.63
$5.35
$2.37
$2.09
$0.00
$2.00
$4.00
$6.00
$8.00
2005-2007
2006-2008
2007-2009
2008-2010
2009-2011
Fiscal Years
Three Year Average U.S Finding & Development Cost |
 February 8,
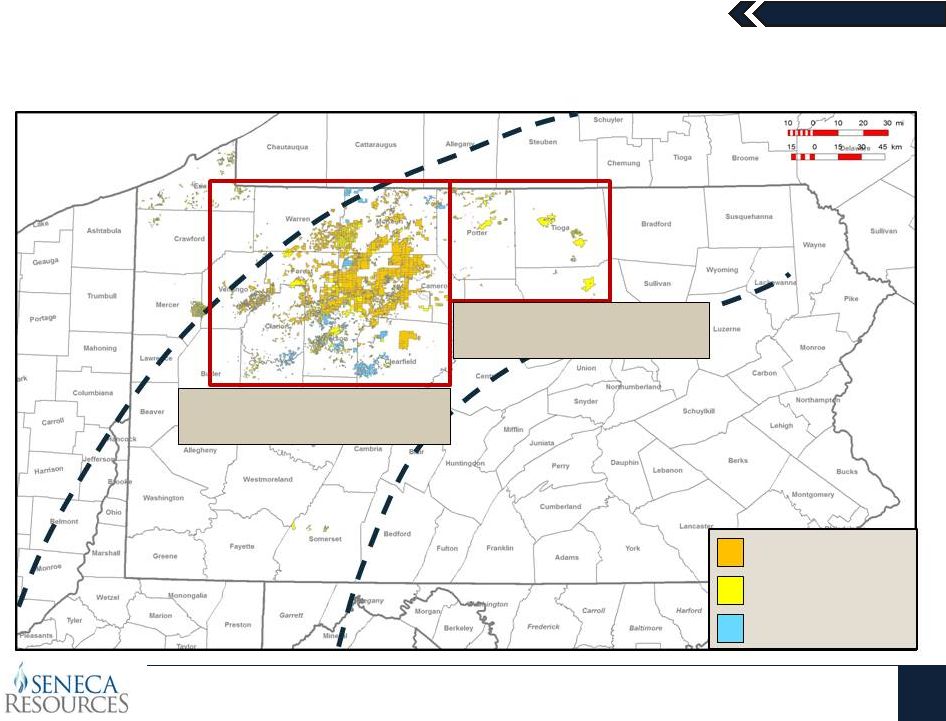
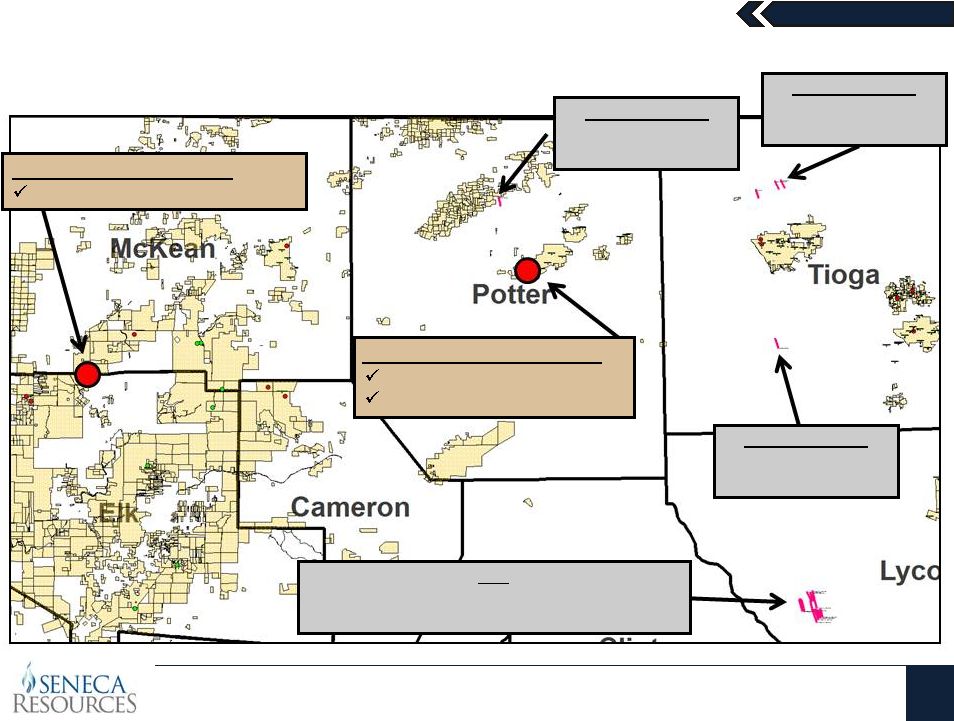
2012 Marcellus Shale
11
Seneca’s Development Areas
Eastern Development Area
(Mostly Leased)
Western Development Area
(Mostly Fee and HBP)
SRC Lease Acreage
SRC Fee Acreage
EOG Acreage |
 February 8,
2012 Seneca Resources
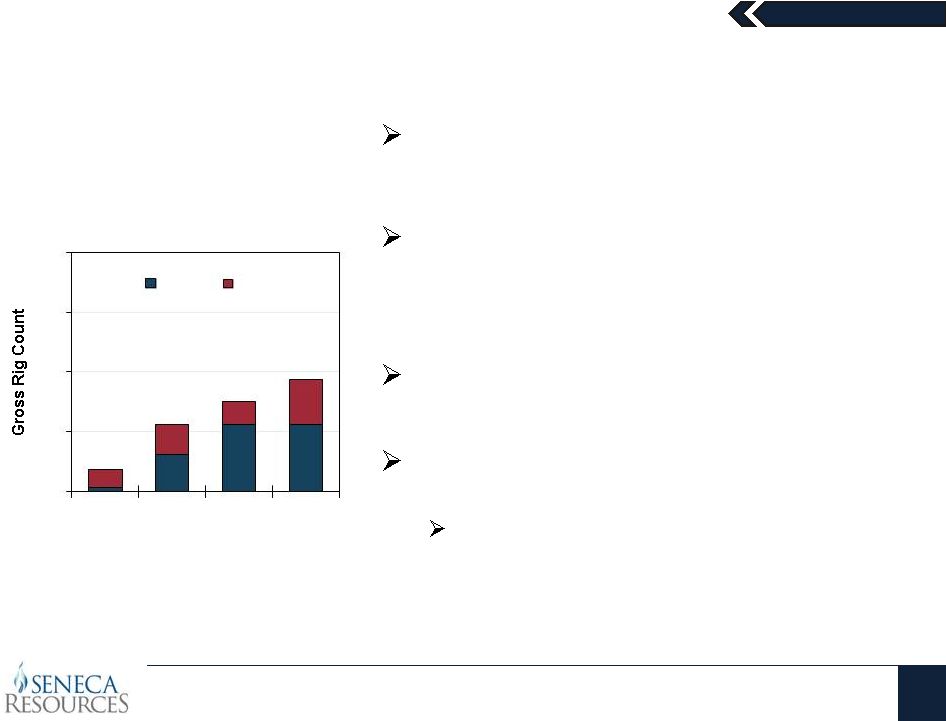
12
Strategic Development Plan
Develop our excellent Tioga and
Lycoming County leasehold
Systematically evaluate both the
Marcellus and Utica in the western
acreage
Evaluate development plans for
western acreage
Participate with EOG on joint venture
acreage
There is an option to not participate on
future wells, while still maintaining a 20%
royalty interest in wells on Seneca fee
acreage
2.5
4.5
4.5
2
1.5
3
1.5
4.5
6
7.5
0
4
8
12
16
2009
2010
2011
2012
Fiscal Year
Gross Rig Count
Seneca
EOG |
 February 8,
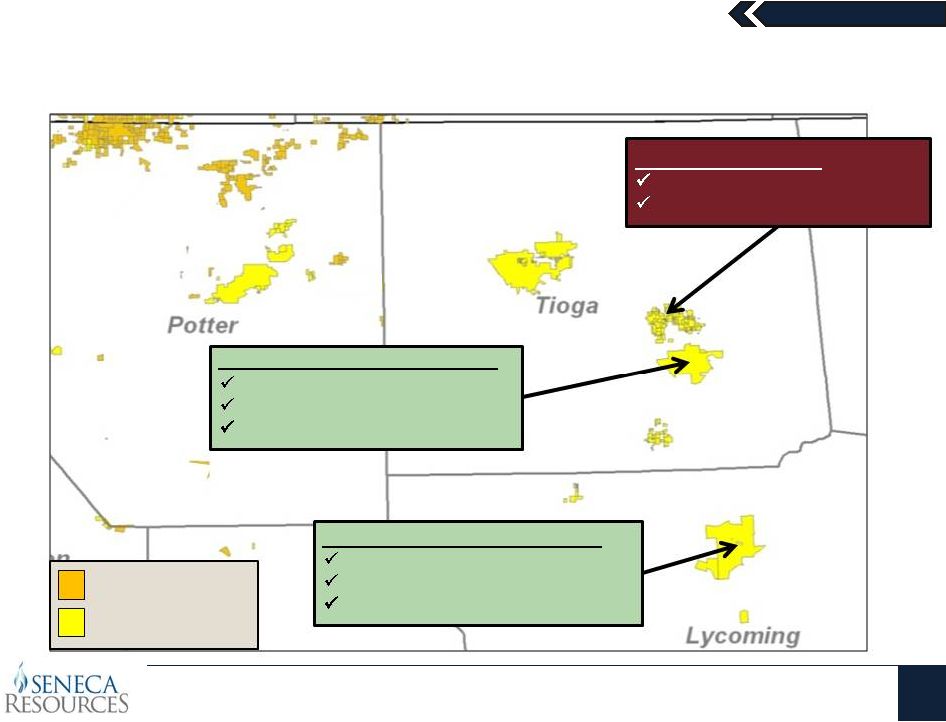
2012 Marcellus Shale
13
3 –
Step Development Strategy
1.
Area evaluation
Vertical wells and cores
3-well horizontal “test”
pads
2D and 3D seismic
2.
Optimization
Landing depth
Frac design
Lateral length
Locations
3.
Development -
Economies of Scale
Multi-well pads
Crawling rigs
Batch drill top holes, then horizontal
Large scale infrastructure
Water systems -
fresh water ponds, pipeline system |
 February 8,
2012 Marcellus Shale
14
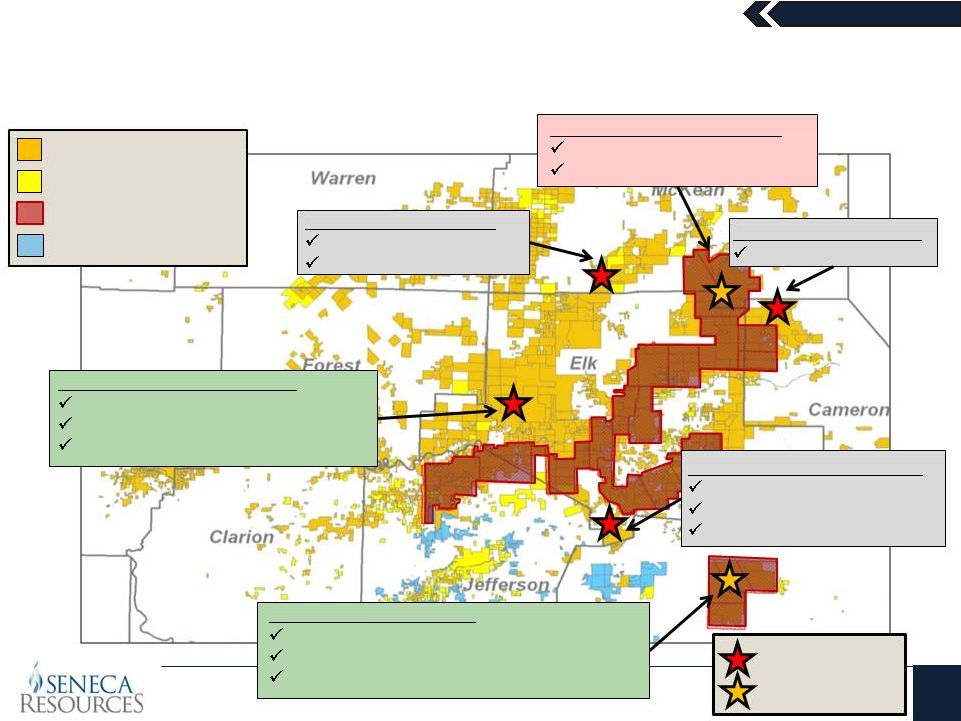
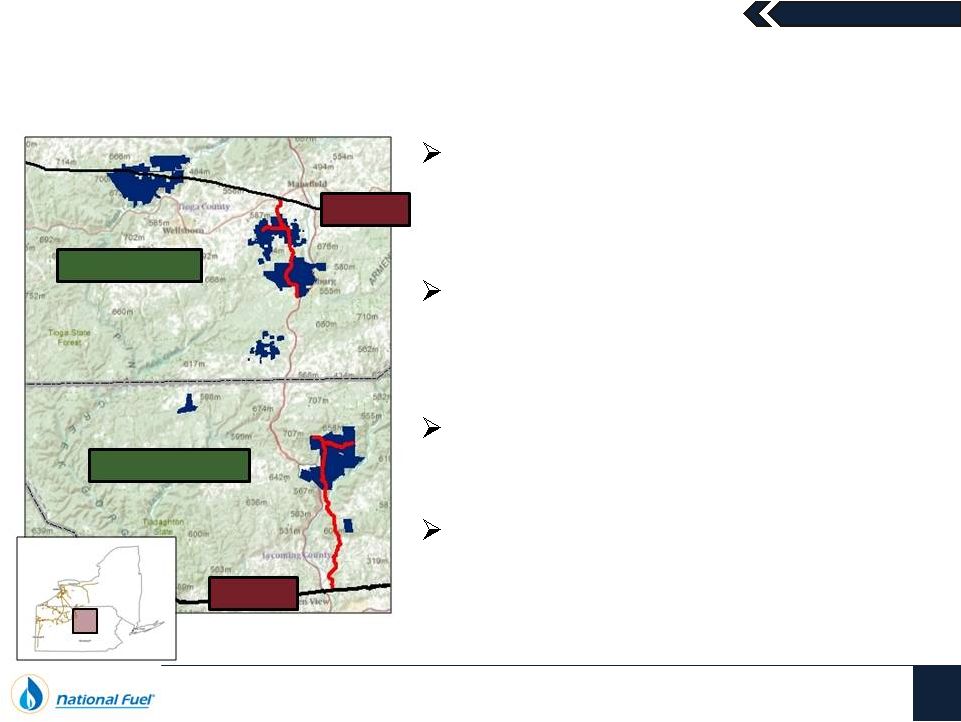
Eastern Development Area (EDA) –
Results & Plan Forward
DCNR
Tract
595
–
Full
Development
24 Wells Drilled –
4 Producing
Gross Production: ~10 MMcf/d
FY 2012: 1 Rig
Covington
–
Developed
47 Wells Drilled –
47 Producing
Gross Production: ~100 MMcf/d
DCNR
Tract
100
–
Full
Development
6 Wells Drilled
1 Well Completed IP: 15.8 MMcf/d
FY 2012: 2 Rigs
SRC Lease Acreage
SRC Fee Acreage |
 February 8,
2012 Marcellus Shale
15
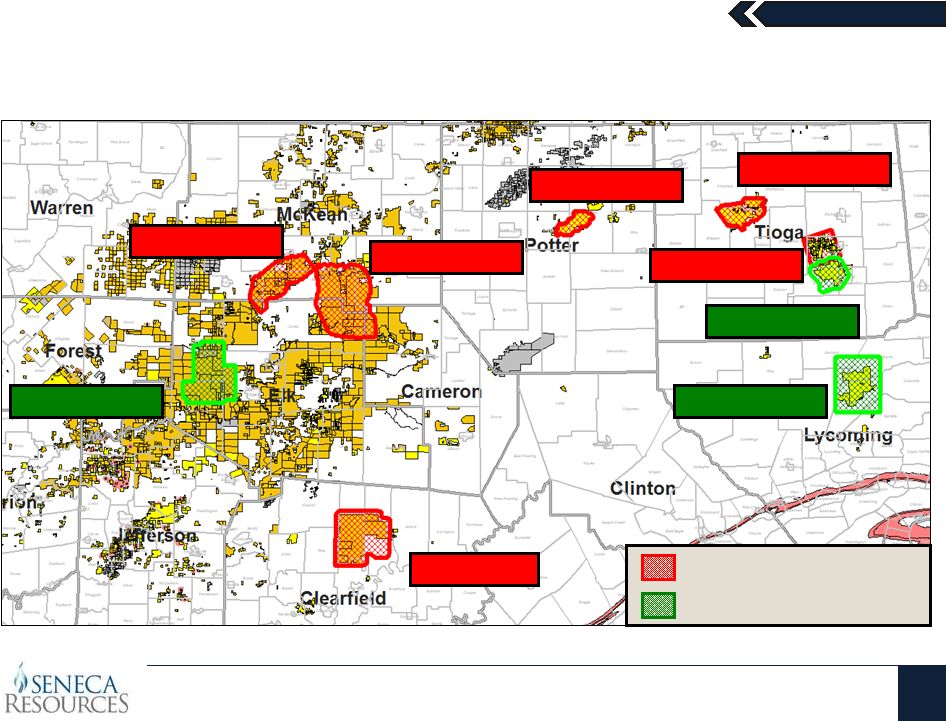
Western Development Area (WDA) –
Results & Plan Forward
Owl’s Nest –
Full Development
3
Wells
Drilled:
Optimized
Target
Zone
Acquiring
3D
Seismic
Evaluating
Wet
Gas
Development
Mt. Jewett –
Delineating
3 Horizontal Wells
IPs: ~3 MMCFD
Boone Mountain -
Delineating
Testing 3 Horizontal Wells
First well IP: 3.8 MMCFD
Second Well IP: 4.2 MMCFD
Approx. Outline of JV Acreage
200,000 Gross Acres
Seneca 50% W.I. (Avg. 58% NRI)
Rich Valley -
Delineating
1 Well Drilled
Punxy –
Full Development
EOG Operated: 63 Wells Drilled; 33 Producing
FY 2012: 2 Rigs
Gross Production (As of 2/6/12): ~40 MMCFD
Seneca Operated
EOG Operated
SRC Lease Acreage
SRC Fee Acreage
EOG Contributed JV Acreage
SRC Contributed JV Acreage |
 February 8,
2012 Marcellus Shale
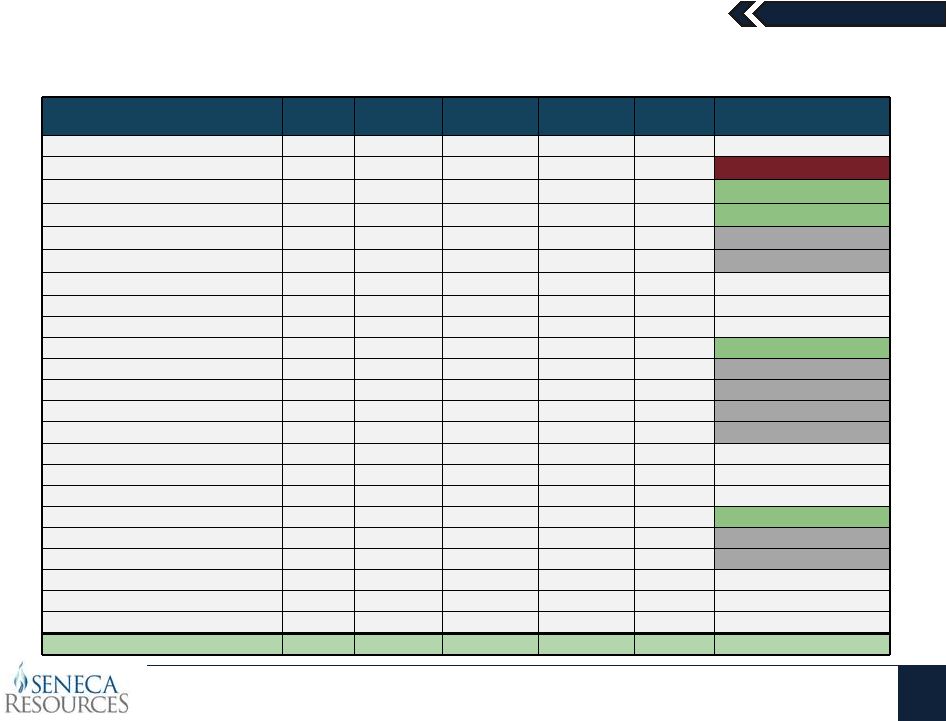
16
Breaking Down Our Acreage Position
Area
Net Acres
Possible
Locations
Wells Drilled
Wells
Completed
EUR (Bcfe)
Status
Eastern Development Area (EDA)
Covington
7,000
47
47
47
5.5
Developed
595
6,000
55
24
4
7.0
Full Development
100
10,000
70
6
1
8.0
Full Development
007
15,000
75
1
1
3.0 -
5.0
Delineating
001
13,000
58
1
1
3.0 -
5.0
Delineating
Other EDA
4,000
10
-
-
3.0 -
8.0
Untested
55,000
315
79
54
Western
Development
Area
(WDA)
Owl's Nest / Ridgeway
91,000
680
3
3
4.0
Full Development
Mt. Jewett
25,000
232
4
4
3.0
Delineating
James City
30,000
340
1
1
3.0 -
5.0
Delineating
Boone Mtn
8,500
59
4
4
4.0
Delineating
Rich Valley
30,000
188
-
-
4.0 -
5.0
Delineating
WDA Other
337,000
2,654
4
3
2.0 -
6.0
Untested
521,500
4,153
16
15
EOG Operated
Punxy
12,000
87
63
33
4.0
Full Development
West Branch
12,500
121
7
5
3.0 -
5.0
Delineating
Clermont
10,000
96
2
2
3.0 -
5.0
Delineating
Brady
13,500
113
-
-
4.0 -
5.0
Untested
EOG Other
120,500
502
2
2
2.0 -
5.0
Untested
168,500
919
74
42
Seneca Resources Total
745,000
5,387
169
111 |
 February 8,
2012 Seneca Resources
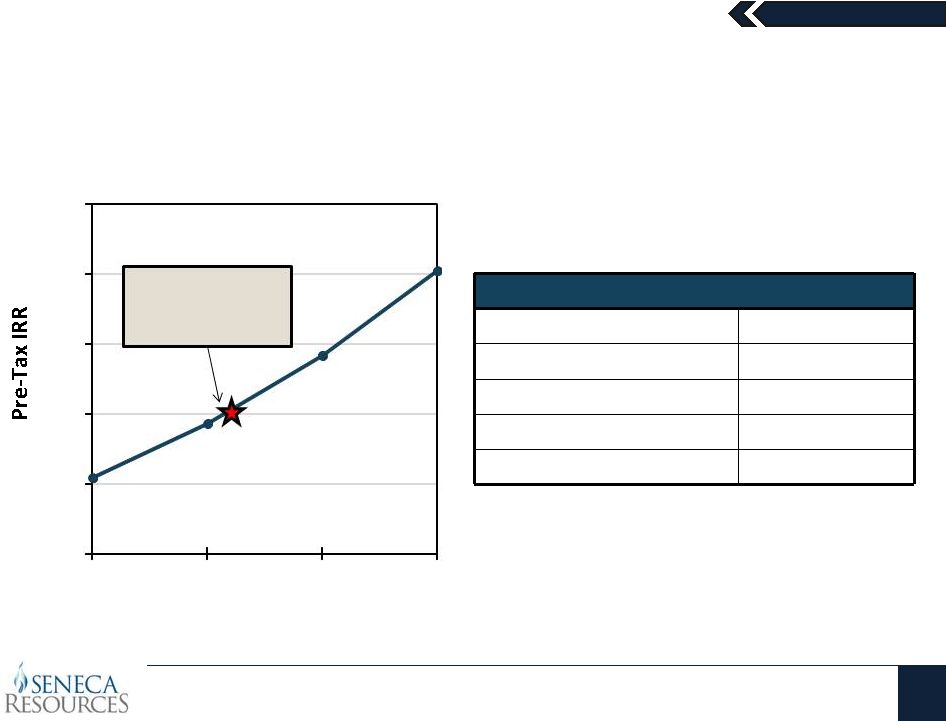
17
Economics of an Average DCNR 595 Well in Tioga County, Pa.
(1)
Current NYMEX Strip as of February 2, 2011
Economic Assumptions
Well Cost
$6.5 -
$7.5 Million
EUR
6.0 -7.0 Bcf
Net Revenue Interest (NRI)
84%
Variable LOE ($/Mcf)
~$0.38
Formation Depth
~8,000’
Estimated Pre-Tax
IRR at Current
NYMEX Strip
(1)
0%
10%
20%
30%
40%
50%
$3.00
$3.50
$4.00
$4.50
Marcellus Economics for a
Typical DCNR 595 Well
Flat NYMEX Price ($/MMBtu) |
 February 8,
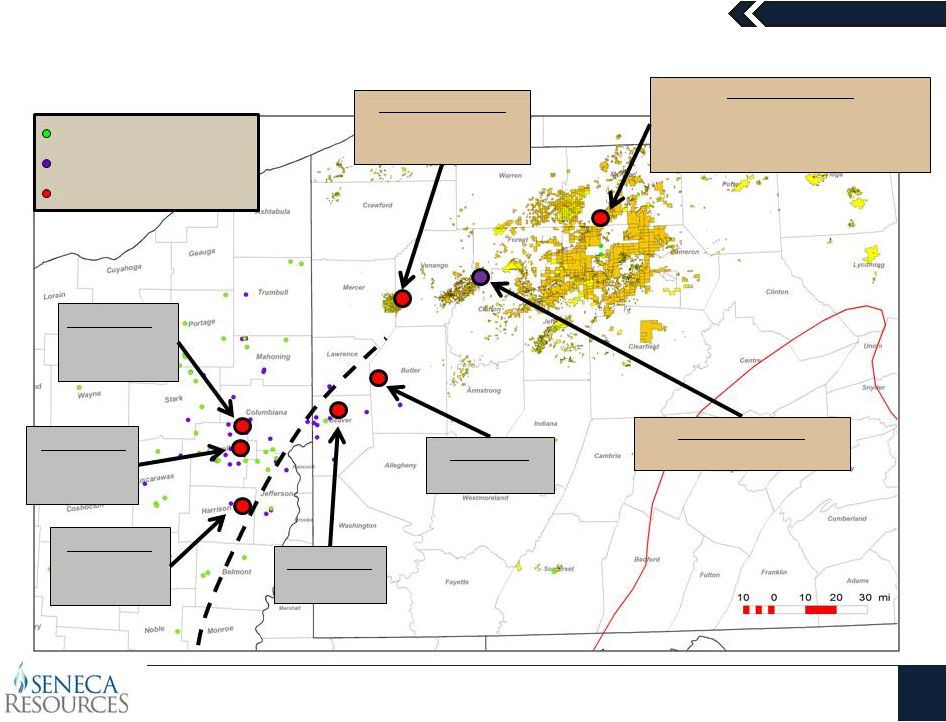
2012 Utica Shale
18
Activity Summary
Dry
Wet
Seneca Resources
Vertical Completed
Currently Testing
Seneca Resources
Dry Gas
Vertical Completed: December 2011
Currently Drilling 1st
Horizontal
Seneca Resources
Horizontal to Spud 2Q ‘12
Rex Energy
9.2 MMcf/d
Chesapeake
6.4 MMcf/d
Chesapeake
9.5 MMcf/d
1,425 Bbl/d
Chesapeake
3.8 MMcf/d
980 Bbl/d
Chesapeake
3.1 MMcf/d
1,015 Bbl/d
Drilled Well
Horizontal Well Permit
Vertical Well Permit |
 February 8,
2012 Upper Devonian Geneseo Shale
19
Activity Summary
DCNR 001 Horizontal (Seneca)
Depth: 5,830’; Thickness: 77’
Peak Rate: 4.5 MMcf/d
East Resources
Drilled & Completed
April 2010
East Resources
3 Wells Permitted
November 2010
East Resources
1 Well Permitted
December 2010
PGE
12 Wells Permitted (April 2009 to August 2010)
2 Wells Drilled (February 2010)
Mt. Jewett Vertical (Seneca)
Depth: 5,095’; Thickness: 110’ |
 February 8,
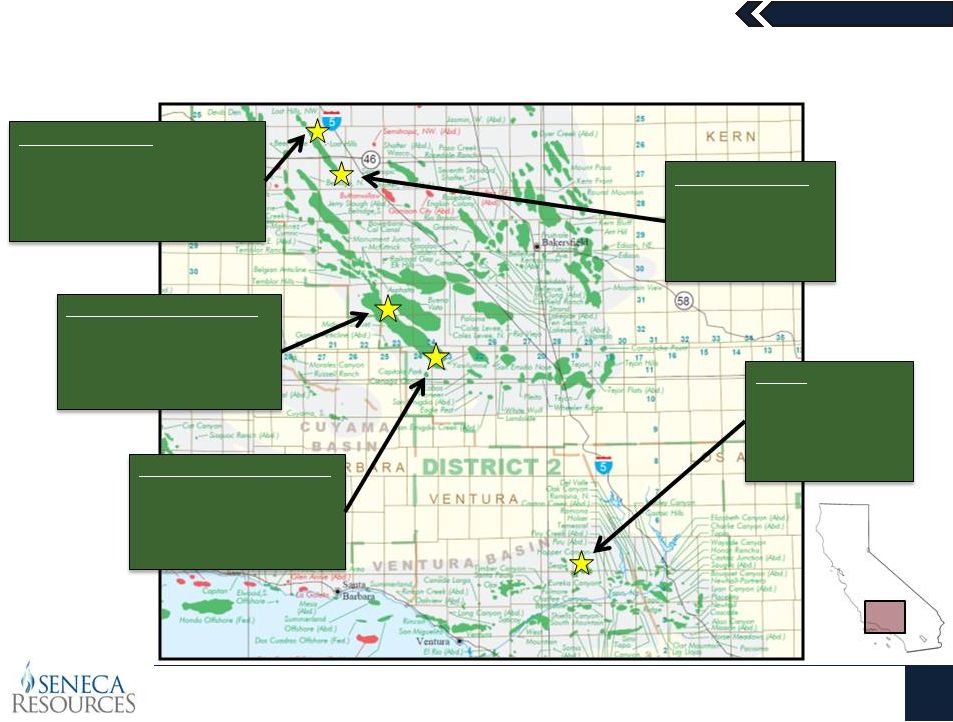
2012 California
20
Stable Production Fields
North Lost Hills
~1,150 BOEPD
Tulare & Etchegoin Formation
Primary & Steamflood
181 Active Wells
North Midway Sunset
~4,400 BOEPD
Potter & Tulare Formation
Steamflood
728 Active Wells
South Midway Sunset
~900 BOEPD
Antelope Formation
Steamflood
109 Active Wells
South Lost Hills
~1,700 BOEPD
Monterey Shale
Primary
215 Active Wells
Sespe
~1,150 BOEPD
Sespe Formation
Primary
188 Active Wells |
 February 8,
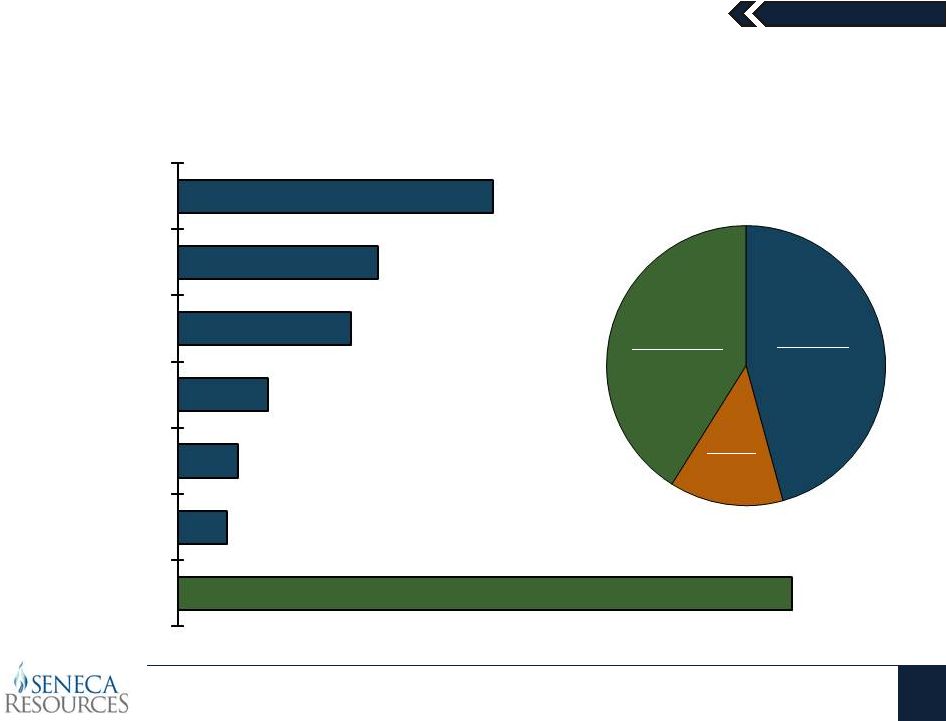
2012 California
21
Strong Margins Support Significant Free Cash Flow
Average Price ($/BOE) = $77.59
Income tax
DDA
Non-
Steam Fuel LOE
Other
Steam Fuel
G&A
Net Income
21%
13%
12%
6%
4%
3%
41%
Fiscal Year 2011 Net Income and Expenses per BOE
Net Income
$31.88
Cash
Expenses
$35.50
DD&A
$10.21 |
 February 8,
2012 National Fuel Gas Company
22
Hedge Positions
(1)
and Strategy
Natural Gas
Swaps
Volume
(Bcf)
Average
Hedge Price
Fiscal 2012
(2)
26.2
$5.89 / Mcf
Fiscal 2013
30.7
$5.25 / Mcf
Fiscal 2014
11.4
$4.63 / Mcf
Oil Swaps
Volume
(MMBbl)
Average
Hedge Price
Fiscal 2012
(2)
1.2
$77.03 / Bbl
Fiscal 2013
1.2
$89.51 / Bbl
Fiscal 2014
0.5
$94.96 / Bbl
Most hedges executed at sales point to eliminate basis risk
(1)
As of February 2, 2012
(2)
Fiscal
2012
hedge
positions
are
for
the
remaining
nine
months
of
the
fiscal
year.
As
of
February
2
nd
,
2012,
Seneca
has
hedged
approximately
47%
of
its
remaining
forecasted
production
for
Fiscal
2012 |
 February 8,
2012 Pipeline & Storage / Midstream
23 |
 February 8,
2012 Pipeline & Storage
24
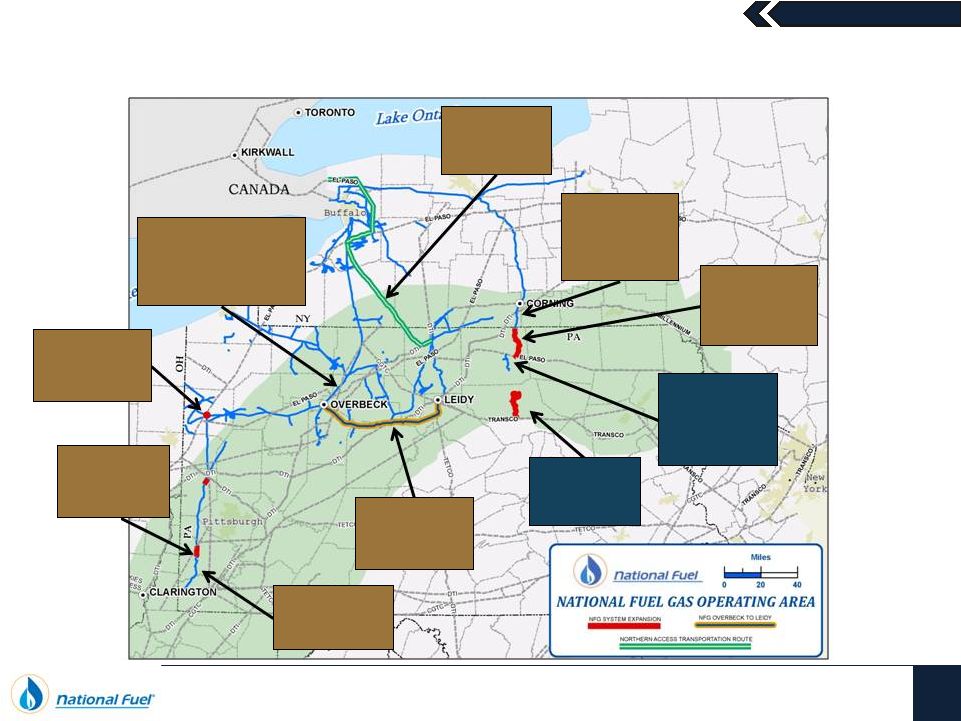
Positioned to Move Growing Marcellus Production
COVINGTON
GATHERING
SYSTEM
(In-Service)
TROUT RUN
GATHERING
SYSTEM
WEST TO EAST
OVERBECK TO
LEIDY
LAMONT
COMPRESSOR
STATION PHASE I & II
(In-Service)
TIOGA
COUNTY
EXTENSION
(In-Service)
LINE “N”
EXPANSION
(In-Service)
NORTHERN
ACCESS
EXPANSION
CENTRAL
TIOGA
COUNTY
EXTENSION
LINE “N”
2012
EXPANSION
MERCER
EXPANSION
PROJECT |
 February 8,
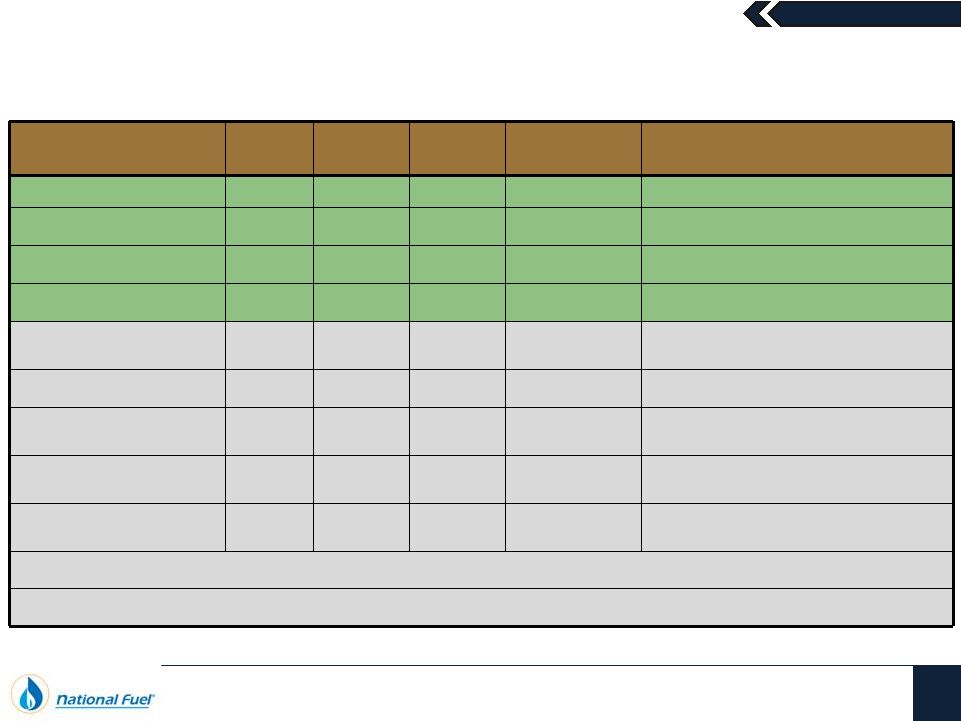
2012 Pipeline & Storage
25
Expansion Initiatives
Project Name
Capacity
(Dth/D)
Est.
CapEx
In-Service
Date
Market
Status
Lamont Compressor Station
40,000
$6 MM
6/2010
Fully Subscribed
Completed
Lamont Phase II Project
50,000
$7.6 MM
7/2011
Fully Subscribed
Completed
Line “N”
Expansion
160,000
$21 MM
10/2011
Fully Subscribed
Completed
Tioga County Extension
350,000
$54 MM
11/2011
Fully Subscribed
Completed
Northern Access Expansion
320,000
$62 MM
~11/2012
Fully Subscribed
Received Certificate from FERC in October
2011
Line “N”
2012 Expansion
158,000
$36 MM
~11/2012
Fully Subscribed
Certificate application filed in July 2011
Mercer Expansion Project
150,000
$30 MM
~6/2014
Open Season
Closed
In discussions with an anchor shipper for all
capacity
Central Tioga County
Extension
260,000
$135 MM
~2014
Open Season
Closed
In discussions with an anchor shipper
West to East
~425,000
$290 MM
~2014
29% Subscribed
Marketing continues with producers in
various stages of exploratory drilling
Total Firm Capacity: ~1,913,000 Dth/D
Capital Investment: ~$642 MM |
 February 8,
2012 Midstream
26
Critical To Boosting Returns in the Marcellus
Lycoming County
Tioga County
TGP 300
Transco
Midstream’s gathering systems are
critical to unlock remote, but highly
productive Marcellus acreage
Goal is to first work to assist Seneca
and then gather 3
rd
party producer
volumes
History of operational success and
efficiency within Pennsylvania
Continuously evaluating opportunities
to grow along with the rapid
development of the Marcellus |
 February 8,
2012 Midstream Corporation
27
Expansion Initiatives
Project Name
Capacity
(Dth/D)
Est.
CapEx
In-Service
Date
Market
Status
Covington Gathering System
100,000
$16 MM
11/17/09
Fully Subscribed
Completed
–
Flowing into TGP 300
Line
Covington Gathering System
Expansion 140
40,000
$1.7 MM
3/7/2011
Fully Subscribed
Completed
-
Increased total system
capacity to 140,000 Dth/d
Covington Gathering System
Expansion 220
80,000
$3.6 MM
4/2012
Fully Subscribed
Will increase total system capacity
to 220,000 Dth/d
Trout Run Gathering System
466,000
$70 MM
Q2 FY2012
70% Subscribed
Under construction
Mt. Jewett Gathering System
170,000
$22 MM
Q3 FY2012
Fully Subscribed
Preliminary work underway
Owl’s Nest Gathering System
50,000
$17 MM
FY2014
Fully Subscribed
Preliminary work underway
Total Firm Capacity: ~906,000 Dth/D
Capital Investment: ~$130 MM |
 February 8,
2012 Pipeline & Storage Growth
28
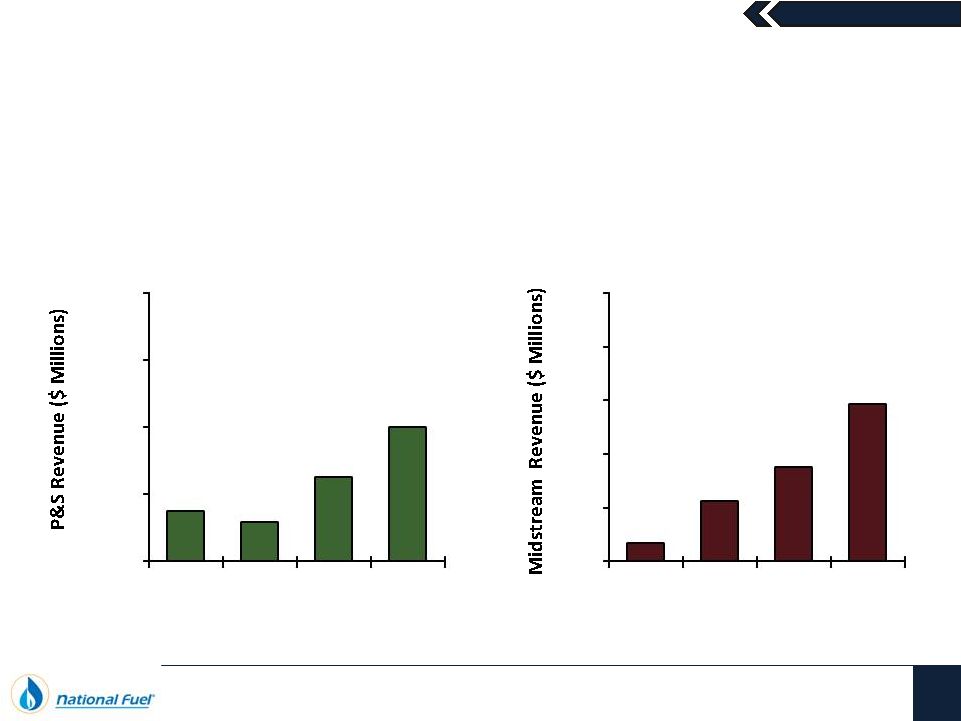
Deploying Significant Growth Capital
Capital spending is increasing to fund system expansion and assuming recently
allowed industry average ROE and capital structure targets, this
segment can
achieve significant growth with a rapid increase in contracted volumes
28
$215
20
-35
2012
Forecast
2013
Forecast
NFG Midstream Revenue
$219
~$230
~$250
$200
$225
$250
$275
$300
2010
2011
Forecast
2012
Forecast
2013
Forecast
Fiscal Year
Pipeline & Storage Revenue
$3.4
$11.3
$15-
$25
$0
$10
$20
$30
$40
$50
2010
2011
Forecast
Fiscal Year |
 February 8,
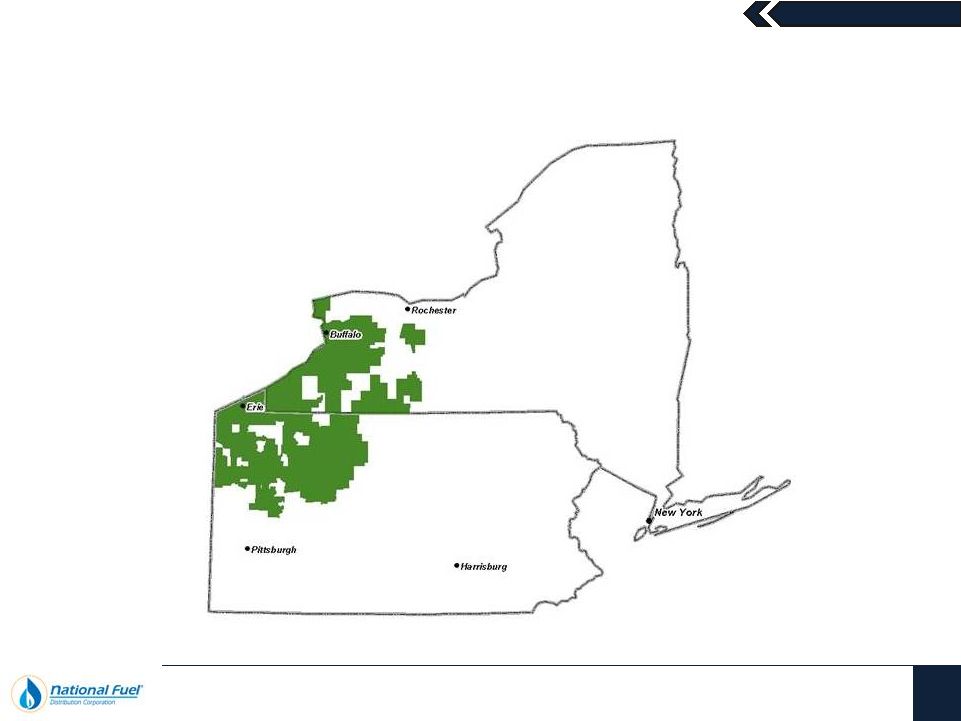
2012 Utility
29
National Fuel Gas Distribution Corporation |
 February 8,
2012 Utility
30
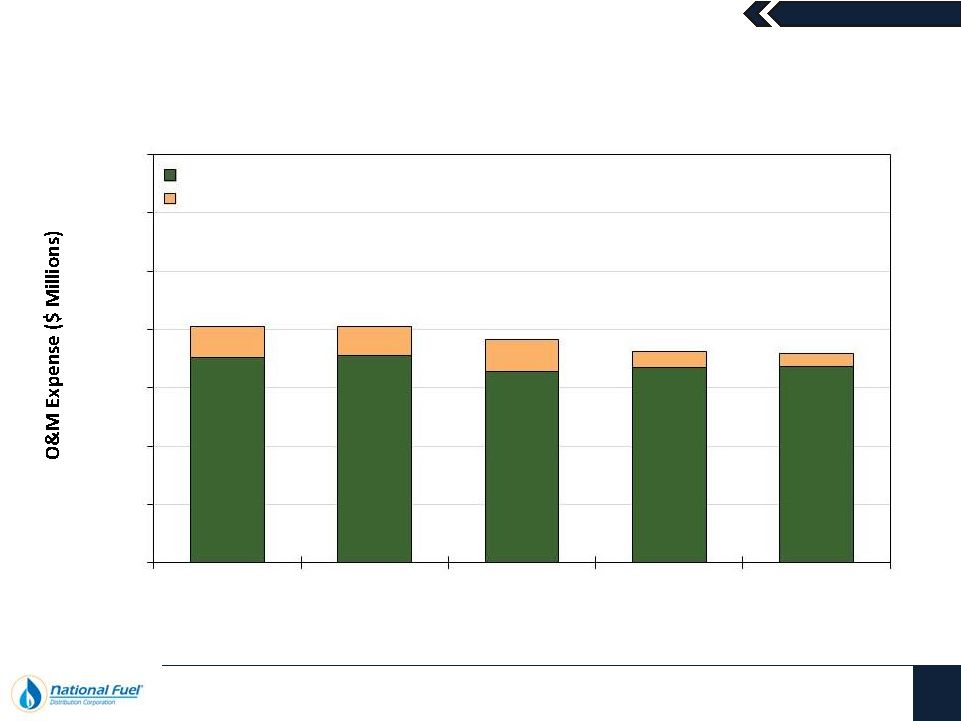
Continued Cost Control
$27
$25
$27
$14
$11
$203
$203
$191
$179
$0
$50
$100
$150
$200
$250
$300
$350
2007
2008
2009
2010
2011
Fiscal Year
All Other O&M Expenses
O&M Expense -
Uncollectibles
$176
$178
$164
$167
$168
$181 |
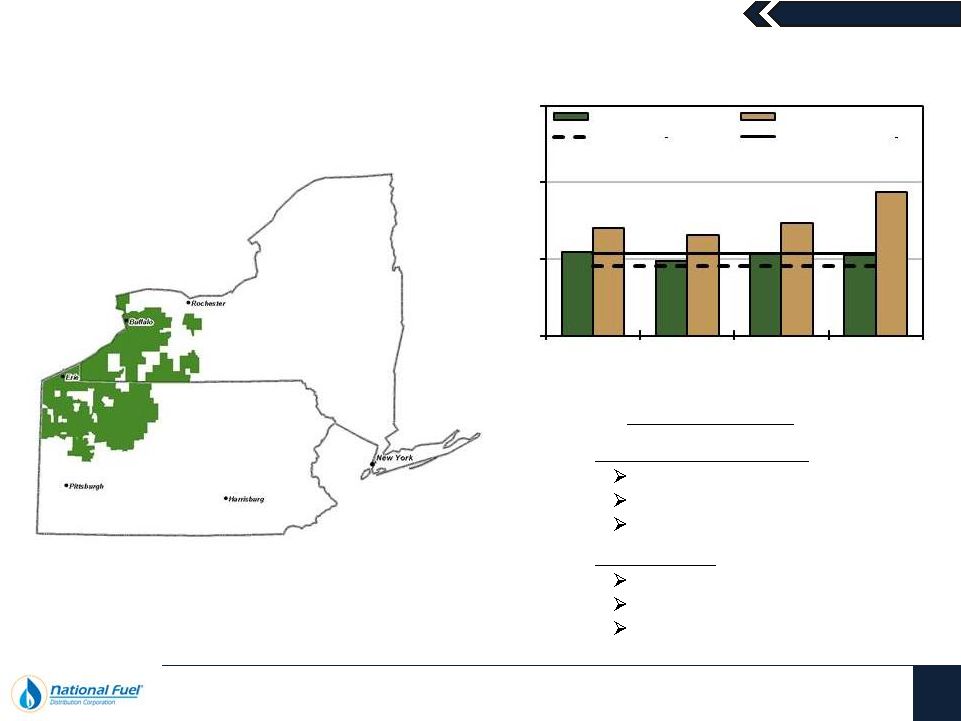 February 8,
2012 Utility
31
Financial Stability
New York & Pennsylvania
Low Income Rates
Choice Program/POR
Merchant Function Charge
New York only
Revenue Decoupling
90/10 Sharing
Weather Normalization
10.9%
9.8%
10.6%
10.5%
14.0%
13.2%
14.7%
18.8%
0.0%
10.0%
20.0%
30.0%
2008
2009
2010
2011
Fiscal Year
Return on Equity
NY
PA
Allowed ROE
NY
Approx. Settled ROE
PA
Rate Mechanisms |
 February 8,
2012 National Fuel Gas Company
32
Financial Summary |
 February 8,
2012 National Fuel Gas Company
33
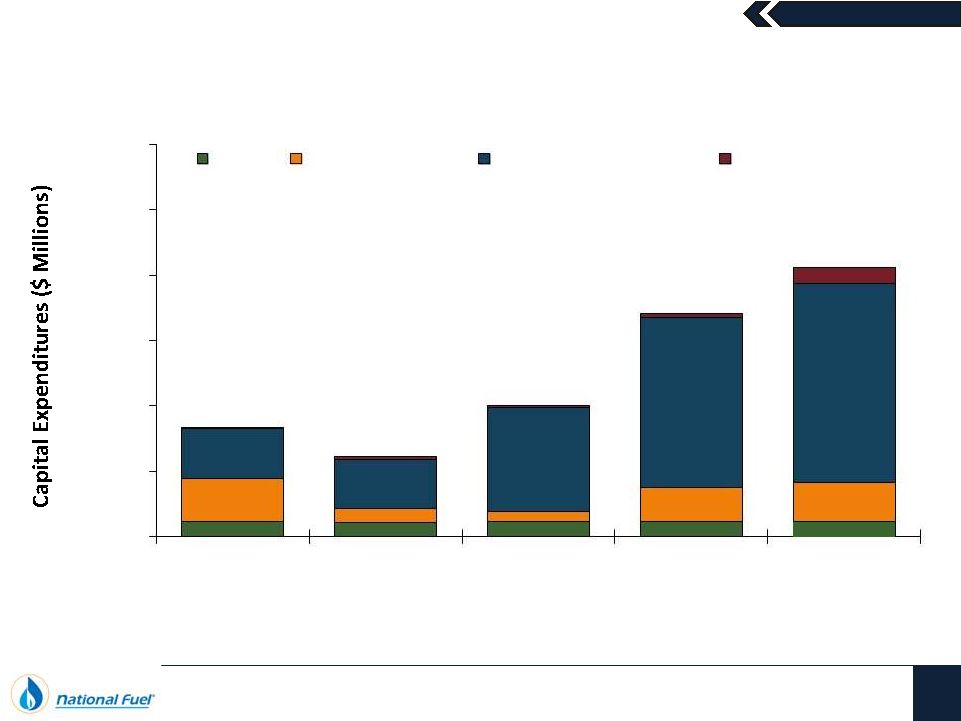
Consolidated Capital Expenditures
Note: A reconciliation to Capital Expenditures as presented on the Consolidated Statement of
Cash Flows is included at the end of this presentation. $0
$250
$500
$750
$1,000
$1,250
$1,500
2008
2009
2010
2011
2012
Forecast
Utility
Pipeline & Storage
Exploration & Production
Midstream & Other
$57
$56
$58
$58
$166
$53
$129
$135
$165
$192
$188
$398
$649
$800
$60
$417
$307
$501
$854
$950
$1,085
$720
Fiscal Year
$55
60
-
$40-
-
-
- |
 February 8,
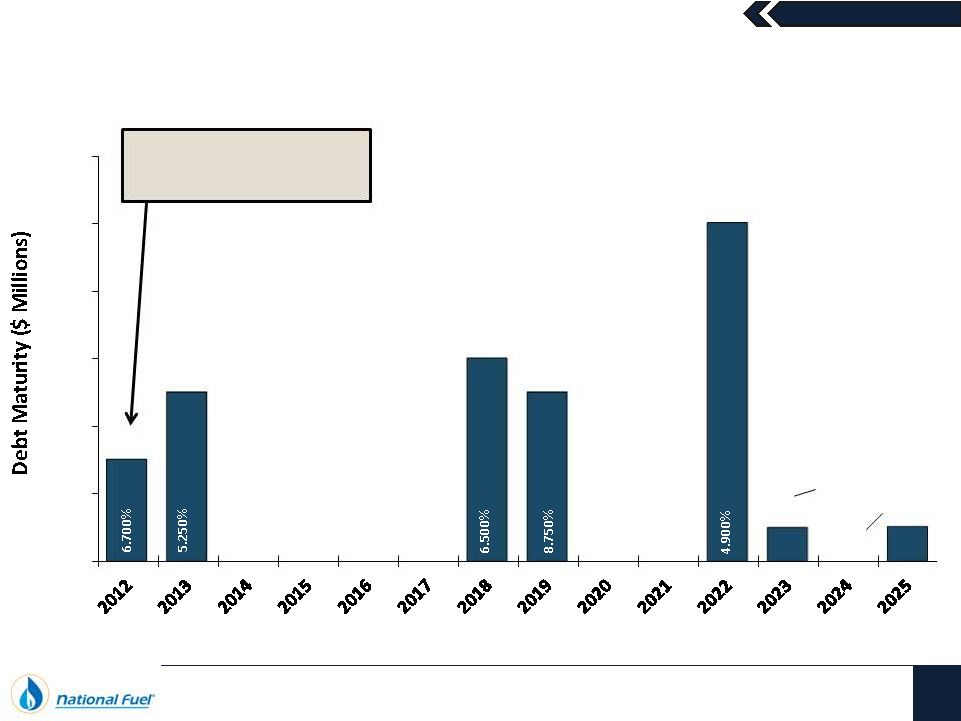
2012 National Fuel Gas Company
34
Manageable Debt Maturity Schedule
$150
$250
$300
$250
$500
$49
$50
7.395%
7.375%
$0
$100
$200
$300
$400
$500
$600
Fiscal Year
Paid
at
Maturity
on
November 21, 2011 |
 February 8,
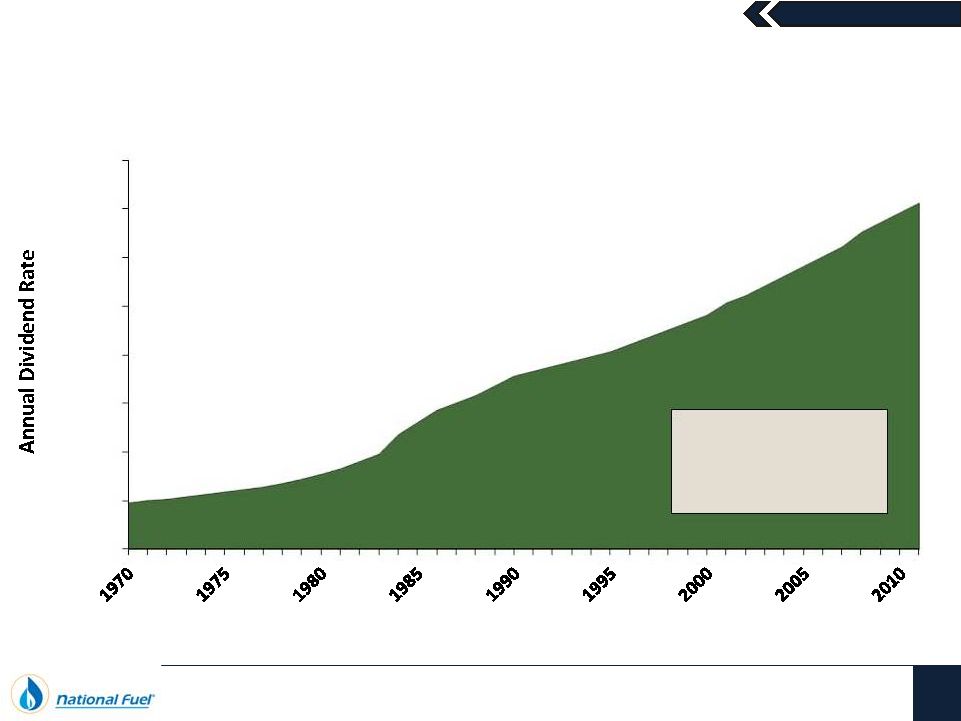
2012 National Fuel Gas Company
35
Strong Dividend Track Record
National Fuel has had 109 uninterrupted
years of dividend payments and has increased
its dividend for 41
consecutive years
Compound Annual
Growth Rate
5.0%
$0.00
$0.20
$0.40
$0.60
$1.00
$1.20
$1.40
$1.60
Annual Rate at Fiscal Year End
$0.80 |
 February 8,
2012 National Fuel Gas Company
36
Capitalization & Liquidity
$3.340 Billion
(1)
As of December 31, 2011
Short-Term
Debt
0.6%
(1) Includes Notes Payable to Banks and Commercial Paper of $20.0 million as of December 31,
2011. Shareholders’
Equity
57.5%
Capital Resources
Total Short-Term Capacity: $1,085 Million
Committed Credit Facility: $750 Million
Five-year syndicated facility entered into
January 6, 2012
Uncommitted Lines of Credit: $335 Million
Long-Term
Debt
41.9%
$300.0 Million Commercial Paper Program
backed by Committed Credit Facility $20.0 million of
outstanding commercial paper as of December 31, 2011
|
 February 8,
2012 National Fuel Gas Company
37
Targeted Capital Structure
Long-Term Consolidated
Capital Structure Target
Capital Structure
Targets by Segment
40%
30%
50%
50%
60%
70%
50%
50%
All Other
E&P
P&S
Utility
Debt
Equity
Debt
35% -
45%
Equity
55% -
65% |
 February 8,
2012 National Fuel Gas Company
38
Appendix |
 February 8,
2012 National Fuel Gas Company
39
Fiscal Year 2012 Major Earnings Guidance Drivers
2012 Forecast
GAAP Earnings per Share
$2.40 -
$2.65
Flat NYMEX Natural Gas Pricing ($/MMBtu)
$3.00
(1)
Flat NYMEX Crude Oil Pricing ($/Bbl)
$100
(1)
Exploration & Production Drivers
Total Production (Bcfe)
85 -
95
DD&A Expense
$2.20 -
$2.30
LOE Expense
$0.85 -
$1.00
G&A Expense
$54 -
$58 MM
East Division Natural Gas Price Differential
-$0.10 to -$0.25
West Division Crude Oil Price Differential
-$3.00 to +$3.00
Pipeline & Storage Drivers
O&M Expense
2%
Revenue (Expansion Projects)
~$27 MM
Revenue (De-Contracting, Efficiency Gas)
~$10 MM
Utility Drivers
O&M Expense
2%
PA Normal Weather Assumption
$0.03 / Share
(1)
Pricing is for the period of January 1, 2012 through September 30, 2012.
|
 February 8,
2012 Marcellus Shale
40
Expanding 3D Seismic Coverage
Completed –
190,000 ac
In Progress –
128,000 ac
Punxy
West Branch
Mt. Jewett
DCNR 001
DCNR 007
Covington
DCNR 595
DCNR 100
Owl’s Nest |
 February 8,
2012 Marcellus Shale
41
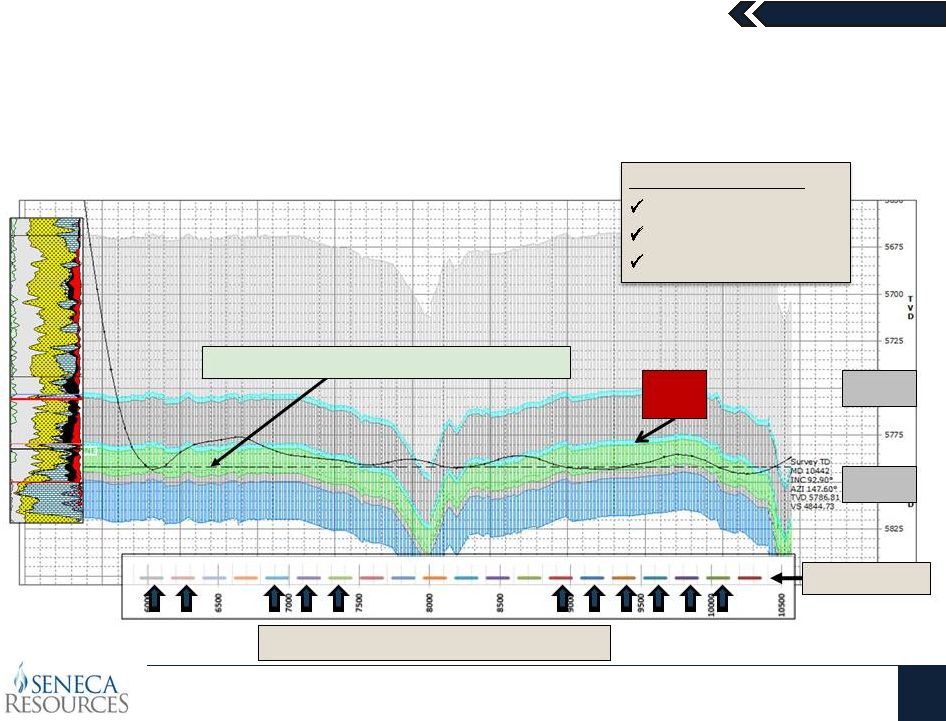
Owl’s Nest –
Improved IP’s by Optimizing The Target Zone
Moving into Full Development
Frac Stages
11 of 20 Stages in Union Springs Target
Cherry
Valley
Onondaga Carb
“Narrowed”
Union Springs Target Zone: 15’
5,750’
5,800’
3H Production Results
Treated Lateral: 4,396’
Peak Rate: 4.47 MMcf/d
3-Day Avg.: 4.25 MMcf/d |
 February 8,
2012 Marcellus Shale
42
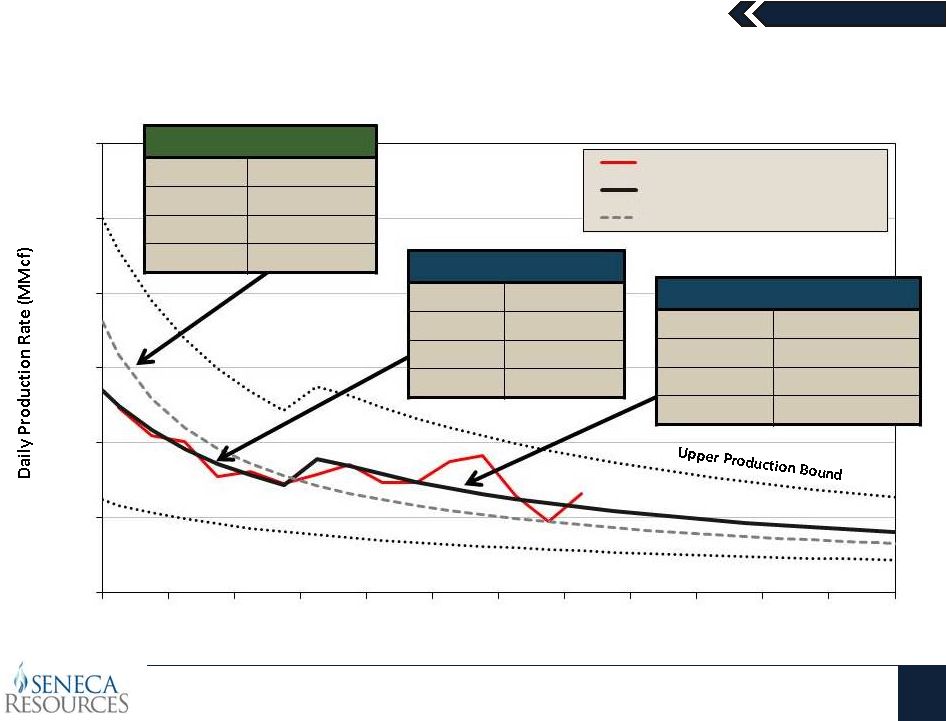
Covington
Typecurve
–
6.7
Bcfe
EUR
(Greater
Than
3,500’
Lateral)
IP Rate
7,250 MMcf/d
Hyp.
Coeff.
1.4
Decline
72%
Exp.
Tail
6%
Lower Production Bound
IP Rate
5,400 MMcf/d
Hyp.
Coeff.
1.25
Decline
65.5%
Limit
6 Mo.
Current: 1
Segment
Current: Compression Segment
IP Rate
3,800 MMcf/d
Hyp. Coeff.
1.25
Decline
48%
Exp. Tail
6%
EDA Average Daily Production Rate
6.7 Bcf Typecurve (40 Year Life)
6.0 Bcf Typecurve (40 Year Life)
Month
0.0
2.0
4.0
6.0
8.0
10.0
12.0
0
2
4
6
8
10
12
14
16
18
20
22
24
Original 6.0 Bcf Typecurve
st |
 February 8,
2012 Marcellus Shale
43
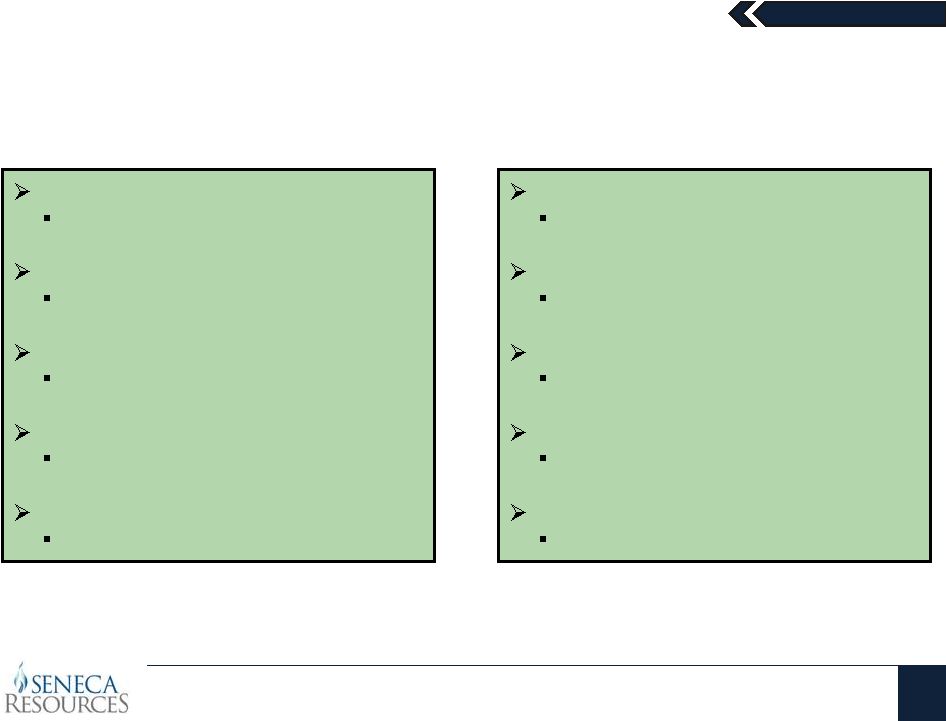
Cost Savings from Multi-Well Pad Drilling
Location & Road Costs
$600,000 per well
Rig Mobilization
$600,000 per well
Ancillary Drilling Costs (Trucking, etc.)
$150,000 per well
Frac Mobilization
$7,000 per well
Water Hauling vs. Infrastructure
$200,000 per well
1 Well per Pad
Location & Road Costs
$100,000 per well
Rig Mobilization
$100,000 per well
Ancillary Drilling Costs (Trucking, etc.)
$25,000 per well
Frac Mobilization
$1,200 per well
Water Hauling vs. Infrastructure
$50,000 per well
6 Wells per Pad
Cost Savings of Pad Drilling: ~$1.2 Million per Well |
 February 8,
2012 Marcellus Shale
44
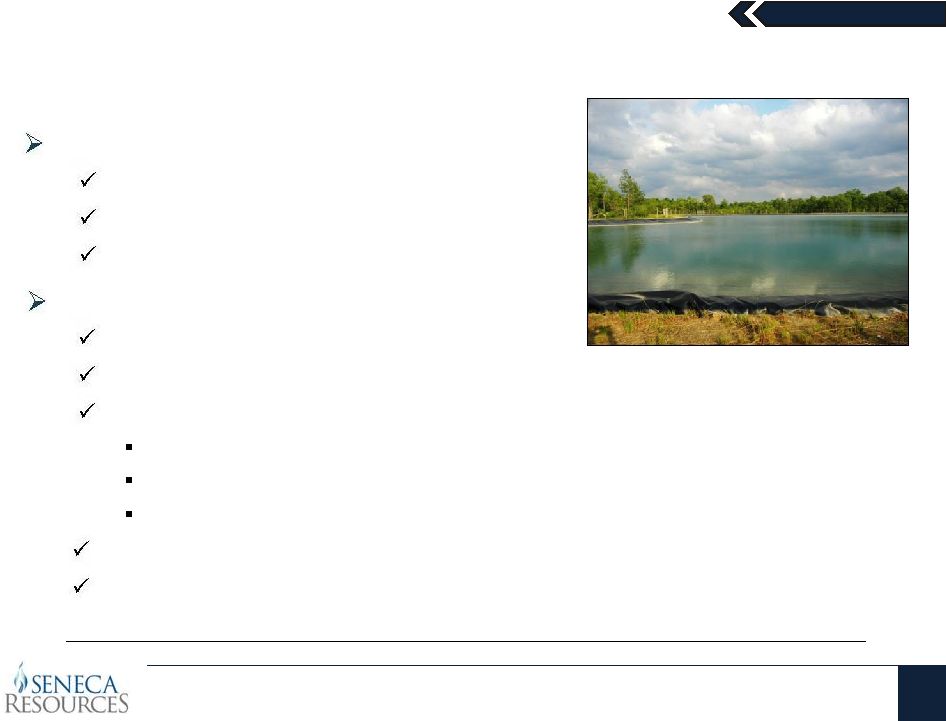
Water Management Program
Water Sourcing:
Coal mine runoff
Permitted freshwater sources
Recycled water
Water Management:
Instituted a “Zero Surface Discharge”
policy
Recycle Marcellus flowback and produced water
Centralized water handing in development areas
Tioga County –
DCNR 595 and Covington
Lycoming County –
DCNR 100
Elk County -
Owl’s Nest
Installing new evaporative technology
Investigating underground injection
Seneca
is
committed
to
protecting
the
surface
from
any
type
of
pollution |
 February 8,
2012 Marcellus Shale
45
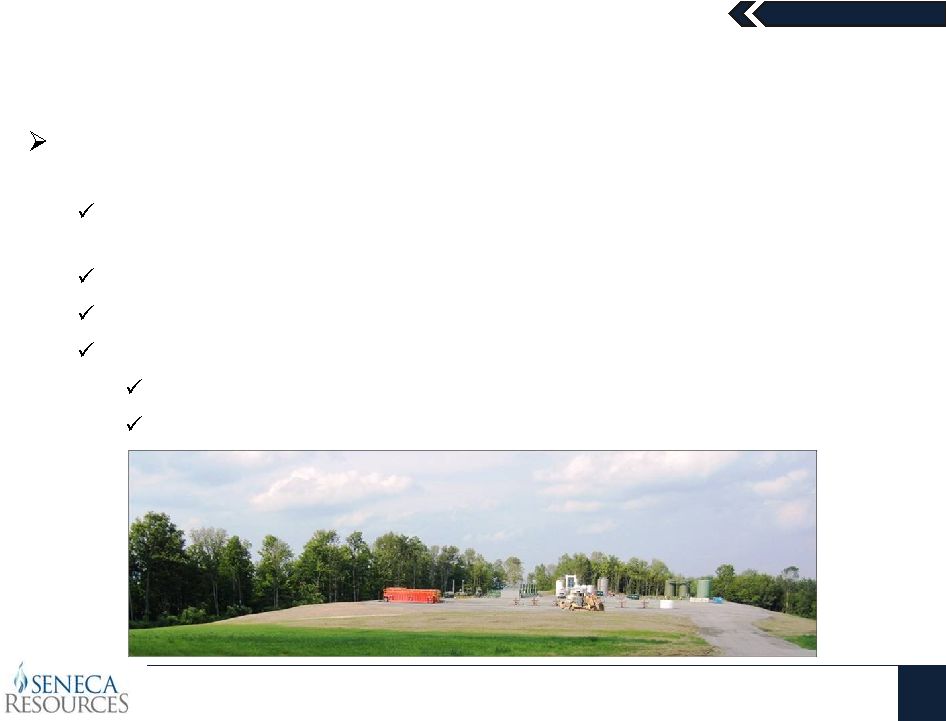
“Zero Liquid Discharge Operation”
Utilizing a state-of-the-art evaporative technology to ensure no liquid is
discharged at the surface
Building centrally located units in the Western Development Area
(WDA)
and the Eastern Development Area (EDA)
Removes all liquids from the production stream
Has the ability to be powered by the waste heat from a compressor station
End products:
Non-hazardous solidified salt material
Clean water vapor emissions |
 February 8,
2012 National Fuel Gas Company
46
Comparable GAAP Financial Measure Slides and Reconciliations
This presentation contains certain non-GAAP financial measures. For pages
that contain non-GAAP financial measures, pages containing the most directly
comparable GAAP financial measures and reconciliations are provided in the
slides that follow.
The Company believes that its non-GAAP financial measures are useful to
investors because they provide an alternative method for assessing the
Company’s operating results in a manner that is focused on the performance
of the Company’s ongoing operations. The Company’s management uses
these non-GAAP financial measures for the same purpose, and for planning
and forecasting purposes. The presentation of non-GAAP financial measures
is not meant to be a substitute for financial measures prepared in accordance
with GAAP. |
| Reconciliation of Segment Capital Expenditures to |
||||||||||||||||||||
| Consolidated Capital Expenditures |
||||||||||||||||||||
| ($Thousands) |
||||||||||||||||||||
| FY 2008 | FY 2009 | FY 2010 | FY 2011 | FY 2012 Forecast |
||||||||||||||||
| Capital Expenditures from Continuing Operations |
||||||||||||||||||||
| Exploration & Production Capital Expenditures |
$ | 192,187 | $ | 188,290 | $ | 398,174 | $ | 648,815 | $ | 720,000-800,000 | ||||||||||
| Pipeline & Storage Capital Expenditures - Expansion |
165,520 | 52,504 | 37,894 | 129,206 | $ | 135,000-165,000 | ||||||||||||||
| Utility Capital Expenditures |
57,457 | 56,178 | 57,973 | 58,398 | $ | 55,000-60,000 | ||||||||||||||
| Marketing, Corporate & All Other Capital Expenditures |
1,614 | 9,829 | 7,311 | 17,767 | $ | 40,000-60,000 | ||||||||||||||
|
|
|
|
|
|
|
|
|
|
|
|||||||||||
| Total Capital Expenditures from Continuing Operations |
$ | 416,778 | $ | 306,801 | $ | 501,352 | $ | 854,186 | $ | 950,000-1,085,000 | ||||||||||
| Capital Expenditures from Discountinued Operations |
||||||||||||||||||||
| All Other Capital Expenditures |
131 | 216 | $ | 150 | $ | - | $ | - | ||||||||||||
|
|
|
|
|
|
|
|
|
|
|
|||||||||||
| Plus (Minus) Accrued Capital Expenditures |
||||||||||||||||||||
| Exploration & Production FY 2011 Accrued Capital Expenditures |
$ | - | $ | - | $ | - | $ | (63,460 | ) | $ | - | |||||||||
| Pipeline & Storage FY 2011 Accrued Capital Expenditures |
- | - | - | (7,271 | ) | - | ||||||||||||||
| All Other FY 2011 Accrued Capital Expenditures |
- | - | - | (1,389 | ) | - | ||||||||||||||
| Exploration & Production FY 2010 Accrued Capital Expenditures |
- | - | (55,546 | ) | 55,546 | - | ||||||||||||||
| Exploration & Production FY 2009 Accrued Capital Expenditures |
- | (9,093 | ) | 9,093 | - | - | ||||||||||||||
| Pipeline & Storage FY 2008 Accrued Capital Expenditures |
(16,768 | ) | 16,768 | - | - | - | ||||||||||||||
| All Other FY 2009 Accrued Capital Expenditures |
- | (715 | ) | 715 | - | - | ||||||||||||||
|
|
|
|
|
|
|
|
|
|
|
|||||||||||
| Total Accrued Capital Expenditures |
$ | (16,768 | ) | $ | 6,960 | $ | (45,738 | ) | $ | (16,574 | ) | $ | - | |||||||
| Eliminations |
$ | (2,407 | ) | $ | (344 | ) | $ | - | $ | - | $ | - | ||||||||
|
|
|
|
|
|
|
|
|
|
|
|||||||||||
| Total Capital Expenditures per Statement of Cash Flows |
$ | 397,734 | $ | 313,633 | $ | 455,764 | $ | 837,612 | $ | 950,000-1,085,000 | ||||||||||
|
|
|
|
|
|
|
|
|
|
|
|||||||||||