Attached files
| file | filename |
|---|---|
| 8-K - FORM 8-K - NuStar Energy L.P. | d295754d8k.htm |
 Steve Blank, Senior Vice President, CFO and Treasurer
February 7, 2012
2012 Credit Suisse Energy Summit
1
Exhibit 99.1 |
 Statements contained in this presentation that state management’s
expectations or predictions of the future are forward-looking statements as
defined
by
federal
securities
law.
The
words
“believe,”
“expect,”
“should,”
“targeting,”
“estimates,”
and
other
similar
expressions
identify
forward-
looking
statements.
It
is
important
to
note
that
actual
results
could
differ
materially from those projected in such forward-looking statements. We
undertake no duty to update any forward-looking statement to conform the
statement to actual results or changes in the company’s expectations.
For more information concerning factors that could cause actual results to
differ from those expressed or forecasted, see NuStar Energy L.P.’s and
NuStar GP Holdings, LLC’s respective annual reports on Form 10-K and
quarterly reports on Form 10-Q, filed with the Securities and Exchange
Commission and
available
on
NuStar’s
websites
at
www.nustarenergy.com
and
www.nustargpholdings.com.
Forward Looking Statements
2 |
 NuStar Overview
3 |
 NuStar Energy L.P. (NYSE: NS) is
a leading publicly traded
partnership with a market
capitalization of approximately
$4.2 billion and an enterprise
value of approximately $6.6 billion
NuStar GP Holdings, LLC (NYSE:
NSH) holds the 2% general
partner interest, incentive
distribution rights and 14.3% of the
common units in NuStar Energy
L.P. NSH has a market
capitalization of around $1.4 billion
Two Publicly Traded Companies
NS
NSH
IPO Date
4/16/2001
7/19/2006
Unit Price (01/31/12)
$58.79
$33.65
Annualized Distribution/Unit
$4.38
$1.98
Yield (01/31/12)
7.45%
5.88%
Market Capitalization
$4,159 million
$1,432 million
Enterprise Value
$6,626 million
$1,441 million
Credit Ratings –
Moody’s
Baa3/Stable
n/a
S&P
BBB-/Stable
n/a
Fitch
BBB-/Negative
n/a
82.3%
Membership Interest
83.7%
L.P. Interest
Public Unitholders
35.0 Million NSH Units
Public Unitholders
60.4 Million NS Units
17.7%
Membership
Interest
2.0% G.P. Interest
14.3% L.P. Interest
Incentive Distribution Rights
William E. Greehey
7.6 Million NSH Units
NYSE: NSH
NYSE: NS
4 |
 Large
and Diverse Geographic Footprint
with Assets in Key Locations
Asset Stats:
Operations in the U.S.,
Canada, Mexico, the
Netherlands, including St.
Eustatius in the Caribbean,
the United Kingdom and
Turkey.
Own 89 terminal and
storage facilities
Approximately 98 million
barrels of storage capacity
8,417 miles of crude oil and
refined product pipelines
2 asphalt refineries and a
fuels refinery capable of
processing 118,500 bpd of
crude oil
5 |
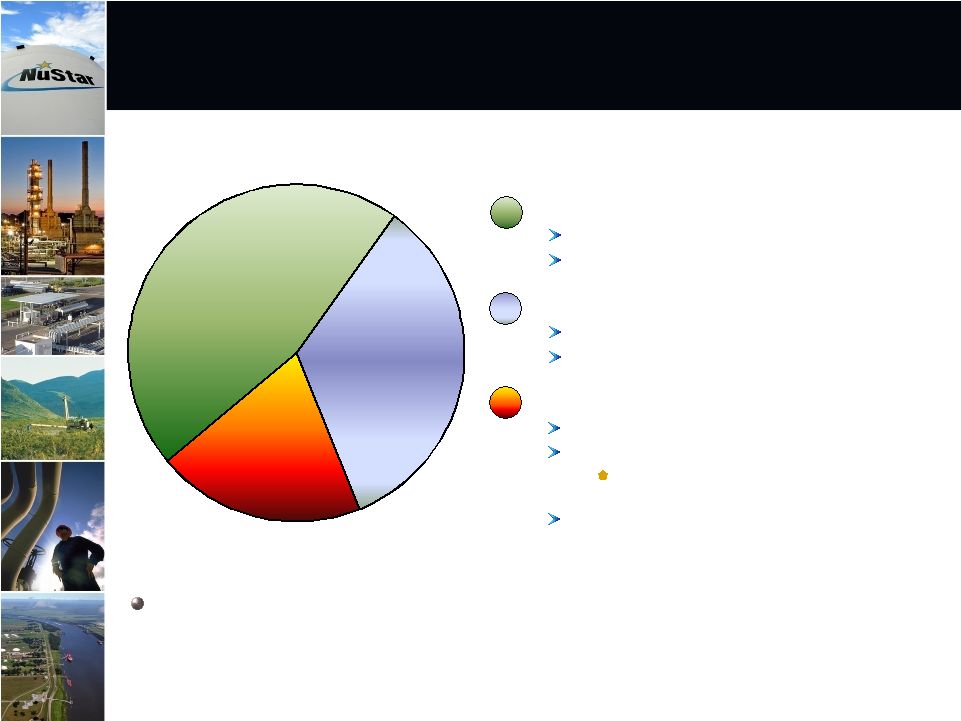 46%
34%
20%
Percentage of Full Year 2011
Segment Operating Income
Approximately 80% of NuStar Energy’s 2011 segment operating income came
from fee-based transportation and storage segments
Storage: 46%
Transportation: 34%
Refined Product Terminals
Crude Oil Storage
Refined Product Pipelines*
Crude Oil Pipelines
Asphalt & Fuels Marketing: 20%
Asphalt Operations
Fuels Marketing Operations
Product Supply, Crude Oil Trading, Bunkering
and Fuel Oil Marketing
San Antonio Refinery
Diversified Operations from Three
Business Segments
* Includes primarily distillates, gasoline, propane, jet fuel, ammonia and
other light products. Does not include natural gas. 6
|
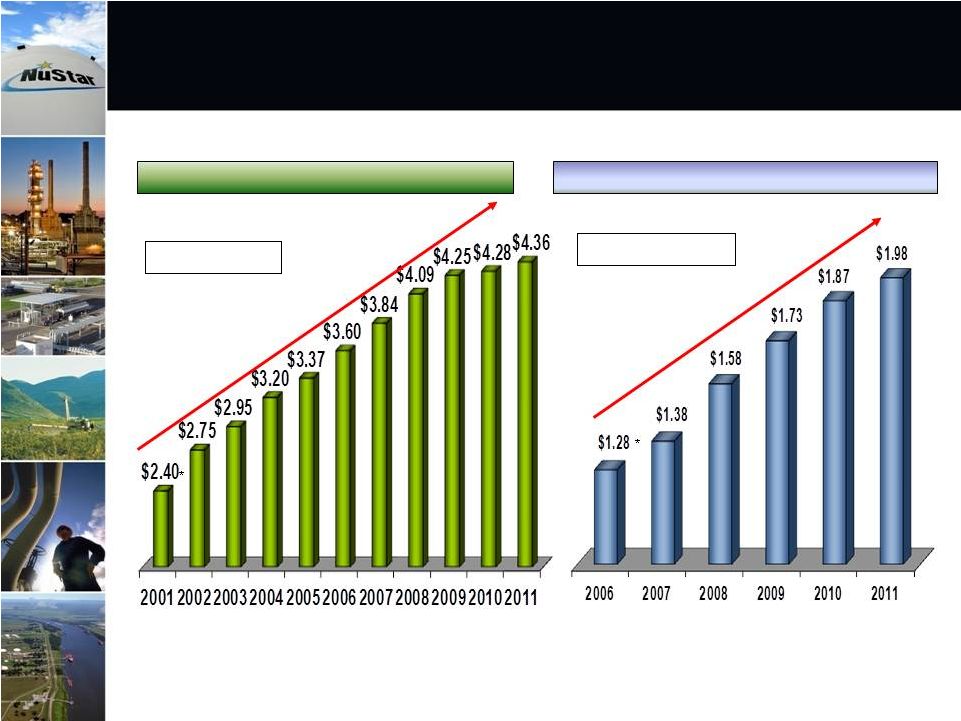 Distributions for both
NS and NSH have grown every year since IPO’s.. should
continue to grow distribution in the future NS Distribution ($ per Unit)
NSH Distribution ($ per Unit)
~6.2% CAGR
~9.1% CAGR
* Annualized Distribution
7 |
 Storage Segment Overview
8 |
 Outlook
2012 segment EBITDA expected to be higher than 2011
St.
James,
LA
storage
expansion
project
completed
in
3rd
quarter
of
2011
should
provide a full year’s benefit to results in 2012
Expect to complete additional internal growth projects in St. James, Texas City and
St. Eustatius during 2012
1 –
Please see slide 31 for a reconciliation of Storage Segment EBITDA to its most
directly comparable GAAP measure, Operating Income Storage
Segment
EBITDA
($
in
Millions)¹
Storage Contract Renewals (% of Revenues)
Storage Segment EBITDA
expected to continue to increase
9
< 1 Year
1 to 3 Years
3 to 5 Years
> 5 Years
24%
47%
12%
17%
2006
2007
2008
2009
2010
2011
$162
$177
$208
$242
$256
$281 |
 Storage expansion continues at our
St. James, Louisiana Terminal
St. James Terminal
10
St. James Third-Party Expansion – Phase 2
Should be similar in size and cost to Phase 1 project Phase 1 project 3.2 million barrels at a cost of $140 million Most tankage should be crude
storage
Expected in-service early 2013
|
 Have
begun the construction of a unit train offloading facility at our St. James
facility Entered into an agreement with two subsidiaries of EOG Resources,
Inc. EOG is a large independent oil and natural gas company
Proved reserves in the United States, Canada, the UK and China
Project description:
New rail and unit train offloading facilities jointly developed by NuStar and
two EOG Resources, Inc. subsidiaries
Facility will be equipped to handle at least one 70,000-barrel train per
day Two new storage tanks with a combined capacity of 360,000 barrels
Costs and completion dates:
Project expected to be completed and in service 2nd quarter 2012
NuStar’s share of the costs should be approximately $35 million
11 |
 In
the process of constructing new tanks for distillate service at our St.
Eustatius terminal Constructing one million barrels of new storage for
distillate service Customer is a large national oil company
Projected cost around $50 million
Expected in-service 4th quarter 2012
Currently evaluating a major expansion project at the St. Eustatius
terminal
12 |
 Transportation Segment
Overview
13 |
 Transportation Segment EBITDA ($ in
Millions)¹ Pipeline Receipts by
Commodity Growth in Eagle Ford Shale should lead to future
growth in Transportation Segment EBITDA
Gasoline
29%
Other*
13%
*Other includes ammonia, jet fuel, propane, naphtha
and light end refined products
Crude Oil
40%
Distillate
18%
Outlook
2012 segment EBITDA expected to be higher than 2011
2012 results should receive a full year benefit from two Eagle Ford shale crude
pipeline internal growth projects brought on-line during 2011
Throughputs projected to increase in 2012 primarily as a result of 2011 internal
growth projects
14
2006
2007
2008
2009
2010
2011
$170
$176
$186
$190
$199
$197
1 –
Please see slide 31 for a reconciliation of Transportation Segment EBITDA to its
most directly comparable GAAP measure, Operating Income |
 Various shale
formations could provide growth opportunities
Key shale formations located in NuStar’s Mid-Continent and Gulf
Coast regions, include the Eagle Ford, Bakken, Granite Wash,
Barnett, and Niobrara
15 |
 NuStar has modified
existing pipeline assets and plans to construct new pipeline assets
for Valero in Eagle Ford Shale
Reversed
an
existing
8-inch
refined
products
pipeline
Line moved products from Corpus Christi to Three Rivers
Placed in crude oil service after September 2011 reversal
Capital spending required to reverse the line around $2 million
NuStar
also
plans
to
build
55
miles
of
new
12-inch
pipeline
that
will
connect
to
existing
NuStar
pipeline
segments
Expect to move crude and condensate from Corpus Christi to Valero’s Three
Rivers refinery
Projected cost $60 to $70 million
Expected
to
be
in
service
in
the
3
quarter
of
2012
16
rd |
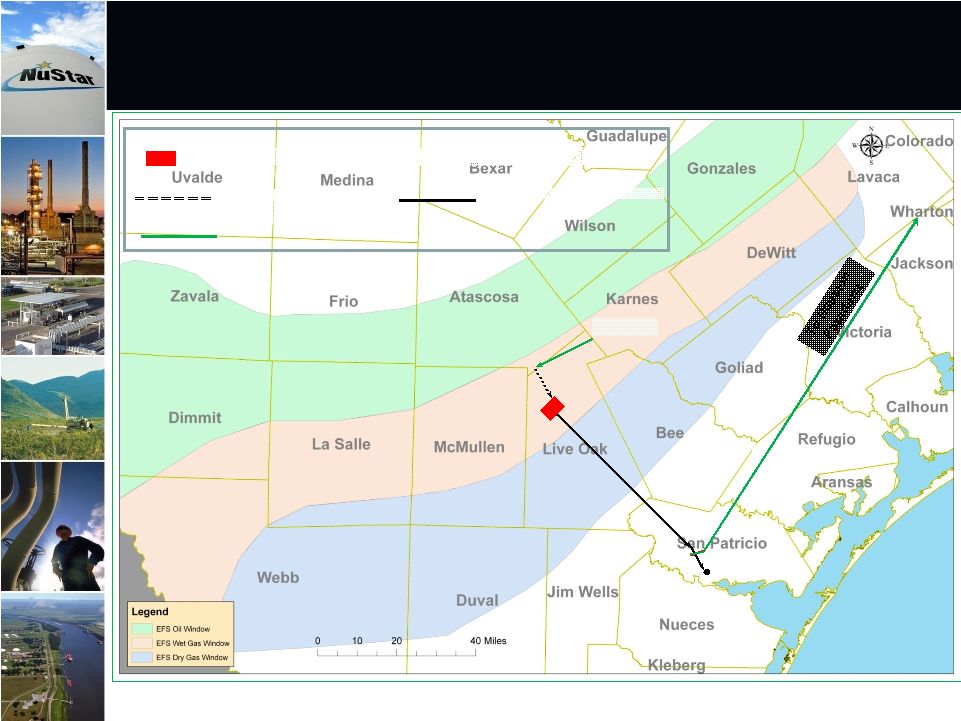
    Plan to
modify existing pipeline assets and construct new pipeline assets
for Valero in Eagle Ford Shale
New NuStar Pipeline
Existing NuStar Pipeline
Valero
West Plant
CORPUS CHRISTI
THREE RIVERS
REFINERY
8”
line
12”
line
17 |
 Plan to develop new
pipeline systems in the Eagle Ford Shale
18
TexStar plans to construct a pipeline that transports crude and condensate to Three
Rivers, TX
Pipeline should be interconnected with a new storage facility to be constructed at Three
Rivers, TX by NuStar
.
Plan to connect the storage facility to NuStar’s existing 16-inch pipeline that can
transport 200,000 BPD to NuStar’s Corpus Christi North Beach storage terminal Currently evaluating others pipeline projects in South Texas with several major oil
companies
Project
expected
to
be
in-service
4th
quarter
2012 |
    Plan
to develop a new pipeline system in the Eagle Ford Shale as a result of a
Letter of Intent entered into with TexStar in the 2nd Quarter of 2011
Potential New 3 Party
Pipeline
Existing NuStar Pipeline
Potential New Storage Facility
NORTH BEACH
OAKVILLE
16”
line
19
rd |
      Pursuing additional projects in the Eagle Ford Shale to
better utilize Houston 12”
line and idle 8”
line out of Pettus
Potential New NuStar
Pipeline
Existing NuStar Pipeline
Potential New Storage Facility
NORTH BEACH
OAKVILLE
16”
line
PETTUS
Underutilized Existing NuStar Pipeline
8”
line
12”
line
20 |
 Asphalt & Fuels Marketing
Segment Overview
21 |
 Despite weaker than expected Asphalt demand
Asphalt & Fuels Marketing Segment 2011 EBITDA
comparable to 2010
Outlook
2012 segment results expected to be higher than 2011
U.S. asphalt demand projected to continue to be weak in 2012
Asphalt operations margins for 2012 forecasted to improve over 2011
2012 projections include a full year of results from the San Antonio refinery
Asphalt & Fuels Marketing Segment EBITDA ($ in Millions)¹ 22
2006
2007
2008
2009
2010
2011
$27
$22
$127
$80
$111
$108
1 –
Please see slide 31for a reconciliation of Asphalt & Fuels Marketing Segment
EBITDA to its most directly comparable GAAP measure, Operating Income
|
 Financial Overview
23 |
 2011
Financial Results 2011 Full Year Distributable Cash Flow available to limited
partners, EBITDA and Operating Income higher than 2010
Distributable Cash Flow available to limited to partners increased from $281 million
to $308 million
EBITDA increased from $483 million to $490 million
Operating income increased from $303 million to $314 million
December 31, 2011 Debt balance $2.3 billion
Debt to capitalization ratio 44.5%
24
–
Please see slide 32 for a reconciliation of Distributable Cash Flow available to
limited partners and EBITDA to their most comparable GAAP measures. |
 2009
2010
2011 Estimate
$164
$262
$294
2009 -
2011 Internal Growth Project Spending
Internal Growth Project Spending continues to
grow…..2012 internal growth spending should be
in the $350 to $400 million range
(
Dollars in Millions)
25 |
 $0
$250
$500
$750
$1,000
2011
2012
2013
2018
2020
2038-2041
$456
$350
$33
Misc. Note
UK Term Loan
GO Zone Financing
Senior Public Notes
Revolver
$1
$840
$480
$350
$450
$365
Debt Maturity Profile
Debt Maturities as of September 30, 2011
(Millions $)
26
Debt
structure
approximately
50%
fixed
rate
–
50%
variable
rate
As of January 31st
, 2012 revolver balance $320 million
2012
total
maturities
as
of
January
31st
~
$700
million |
 2012
Financing Plan Recently closed on $250 Million bond issuance
Coupon 4.75%, bonds mature February 2022
Proceeds initially used to paydown revolver balance, eventually used to pay off
$250 million February 2012 bond maturity
$100 million bond matures in July
Plan to refinance with borrowings under the revolver
Refinance $1.2 billion revolver (matures December 2012) by end of second quarter
2012 At time of refinancing may upsize to $1.5 billion
Refinance $30 million NuStar GP Holdings revolver in second quarter 2012 (matures
July 2012)
Refinance 21 million pound UK Term Loan in the fourth quarter 2012 (matures December
2012)
27 |
 High quality, large and diverse asset footprint supporting energy infrastructure
both in the U.S. and internationally
Contracted fee-based storage and transportation assets provide stable cash
flows, delivering approximately 80% of 2011 segment operating income
Diverse and high quality customer base composed of large integrated oil companies,
national oil companies and refiners
Strong balance sheet, credit metrics and commitment to maintain investment grade
credit ratings
Experienced and proven management team with substantial equity ownership and
industry experience
Recognized nationally for safety and environmental record as well as one of the
best places to work
Successfully raised $311 million of equity in December 2011
NuStar Highlights
28 |
 29 |
 Appendix
30 |
 Reconciliation of Non-GAAP Financial
Information -
Segmental
31
(Unaudited, Dollars in Thousands)
The following is a reconciliation of operating income to EBITDA for the Storage Segment:
2006
2007
2008
2009
2010
2011
Operating income
108,486
$
114,635
$
141,079
$
171,245
$
178,947
$
193,395
$
Plus depreciation and amortization expense
53,121
62,317
66,706
70,888
77,071
87,737
EBITDA
161,607
$
176,952
$
207,785
$
242,133
$
256,018
$
281,132
$
The following is a reconciliation of operating income to EBITDA for the Transportation
Segment: 2006
2007
2008
2009
2010
2011
Operating income
122,714
$
126,508
$
135,086
$
139,869
$
148,571
$
145,613
$
Plus depreciation and amortization expense
47,145
49,946
50,749
50,528
50,617
51,175
EBITDA
169,859
$
176,454
$
185,835
$
190,397
$
199,188
$
196,788
$
The following is a reconciliation of operating income to EBITDA for the Asphalt and Fuels
Marketing Segment: 2006
2007
2008
2009
2010
2011
Operating income
26,815
$
21,111
$
112,506
$
60,629
$
90,861
$
85,229
$
Plus depreciation and amortization expense
-
423
14,734
19,463
20,257
22,636
EBITDA
26,815
$
21,534
$
127,240
$
80,092
$
111,118
$
107,865
$
NuStar
Energy
L.P.
utilizes
a
financial
measure,
EBITDA,
that
is
not
defined
in
United
States
generally
accepted
accounting
principles.
Management
uses
this
financial
measure
because
it
is
a
widely
accepted
financial
indicator
used
by
investors
to
compare
partnership
performance.
In
addition,
management
believes
that
this
measure
provides
investors
an
enhanced
perspective
of
the
operating
performance
of
the
partnership's
assets.
EBITDA
is
not
intended
nor
presented
as
an
alternative
to
operating
income.
EBITDA
should
not
be
considered
in
isolation
or
as
a
substitute
for
a
measure
of
performance
prepared
in
accordance
with
United
States generally accepted accounting principles.
EBITDA
in
the
following
reconciliations
relate
to
our
operating
segments.
For
purposes
of
segment
reporting
we
do
not
allocate
general
and
administrative
expenses
to
our
reported
operating
segments
because
those
expenses
relate
primarily
to
the
overall
management
at
the
entity
level.
Therefore,
EBITDA
reflected
in
the
following
reconciliations
exclude
any
allocation
of
general
and
administrative
expenses
consistent
with
our
policy
for
determining
segmental
operating
income,
the most directly comparable GAAP measure.
Year Ended December 31,
Year Ended December 31,
Year Ended December 31,
Our
independent
registered
public
accounting
firm
has
not
completed
its
audit
of
NuStar
Energy's
financial
statements
for
the
year
ended
December
31,
2011.
As
a
result, the financial results for the full year ended December 31, 2011, which appear below, are
subject to change. |
 Reconciliation of Non-GAAP Financial
Information -
Consolidated
32
(Unaudited, Dollars in Thousands)
The following is a reconciliation of net income to EBITDA and distributable cash flow:
2011
2010
Net income
221,601
$
238,970
$
Plus interest expense, net
83,681
78,280
Plus income tax expense
16,879
11,741
Plus depreciation and amortization expense
168,286
153,802
EBITDA
490,447
482,793
Less equity in earnings of joint venture
(11,458)
(10,500)
Less interest expense, net
(83,681)
(78,280)
Less reliability capital expenditures
(50,339)
(54,031)
Less income tax expense
(16,879)
(11,741)
Plus distributions from joint venture
14,374
9,625
Mark-to-market impact on hedge transactions (a)
456
(17,640)
Contingent loss adjustment
3,250
-
Other non-cash items
5,093
-
Distributable cash flow
351,263
$
320,226
$
EBITDA
490,447
$
482,793
$
EBITDA attributable to noncontrolling interest
415
-
EBITDA attributable to NuStar Energy L.P.
490,032
$
482,793
$
Distributable cash flow
351,263
$
320,226
$
Distributable cash flow attributable to noncontrolling interest
441
-
Distributable cash flow attributable to NuStar
Energy L.P. 350,822
$
320,226
$
General partner's interest in distributable cash flow
42,956
39,531
Limited partners' interest in distributable cash flow
307,866
$
280,695
$
a)
NuStar
Energy
L.P.
utilizes
two
financial
measures,
EBITDA
and
distributable
cash
flow,
which
are
not
defined
in
United
States
generally
accepted
accounting
principles.
Management
uses
these
financial
measures
because
they
are
widely
accepted
financial
indicators
used
by
investors
to
compare
partnership
performance.
In
addition,
management
believes
that
these
measures
provide
investors
an
enhanced
perspective
of
the
operating
performance
of
the
partnership's
assets
and
the
cash
that
the
business
is
generating.
Neither
EBITDA
nor
distributable
cash
flow
are
intended
to
represent
cash
flows
for
the
period,
nor
are
they
presented
as
an
alternative
to
net
income.
They
should
not
be
considered
in
isolation
or
as
substitutes
for
a
measure
of
performance
prepared
in
accordance
with
United
States
generally
accepted
accounting principles.
Year Ended December 31,
Our
independent
registered
public
accounting
firm
has
not
completed
its
audit
of
NuStar
Energy's
financial
statements
for
the
year
ended
December
31,
2011.
As
a
result, the financial results for the full year ended December 31, 2011, which appear below, are
subject to change. Distributable cash flow excludes the impact of unrealized
mark-to-market gains and losses that arise from valuing certain derivative contracts,
as well as the associated hedged inventory. The gain or loss associated with these contracts
is realized in distributable cash flow when the contracts are settled. |