Attached files
| file | filename |
|---|---|
| 8-K - 8-K - CBRE GROUP, INC. | a12-4206_18k.htm |
| EX-99.1 - EX-99.1 - CBRE GROUP, INC. | a12-4206_1ex99d1.htm |
Exhibit 99.2
|
|
CBRE Group, Inc. Fourth Quarter 2011 Earnings Conference Call February 7, 2012 |

|
|
Forward Looking Statements This presentation contains statements that are forward looking within the meaning of the Private Securities Litigation Reform Act of 1995, including statements regarding our future growth momentum, operations, financial performance, business outlook and ability to successfully integrate the ING REIM businesses. These statements should be considered as estimates only and actual results may ultimately differ from these estimates. Except to the extent required by applicable securities laws, we undertake no obligation to update or publicly revise any of the forward-looking statements that you may hear today. Please refer to our fourth quarter earnings report, filed on Form 8-K, our current annual report on Form 10-K and our most recent quarterly report on Form 10-Q, in particular any discussion of risk factors or forward-looking statements, which are filed with the SEC and available at the SEC’s website (www.sec.gov), for a full discussion of the risks and other factors that may impact any estimates that you may hear today. We may make certain statements during the course of this presentation, which include references to “non-GAAP financial measures,” as defined by SEC regulations. As required by these regulations, we have provided reconciliations of these measures to what we believe are the most directly comparable GAAP measures, which are attached hereto within the appendix. |
|
|
Conference Call Participants Brett White Chief Executive Officer Gil Borok Chief Financial Officer Nick Kormeluk Investor Relations |

|
|
Business Overview 2011 Full Year Highlights: Full year 2011 revenue rose 15% to $5.9 billion 2011 normalized EBITDA grew 18% to $802.6 million 2011 normalized EBITDA margin increased to 13.6% 2011 normalized diluted earnings per share was $1.03, which was almost 40% above full year 2010, and near the top of our $0.95 to $1.05 guidance range for 2011 Q4 2011 Highlights: Q4 2011 total revenue increased 7% to $1.8 billion with continued growth in all geographies Outsourcing revenue growth continued to be strong with a 14% overall increase in Q4 2011 Investment sales revenue remained solid with 10% growth, while leasing declined by 4% in Q4 2011 Investment management revenue showed a significant increase driven by higher asset management fees, including contributions from ING REIM Asia and Europe and CBRE Clarion Securities Development Services delivered net gains of approximately $33 million in Q4 2011 from the sale of two high quality assets in Houston and Dallas Normalized EBITDA increased 24% to $314.9 million in Q4 2011, compared to Q4 2010 Normalized EBITDA margin was 17.8% in Q4 2011, up 250 basis points from 15.3% in Q4 2010 |
|
|
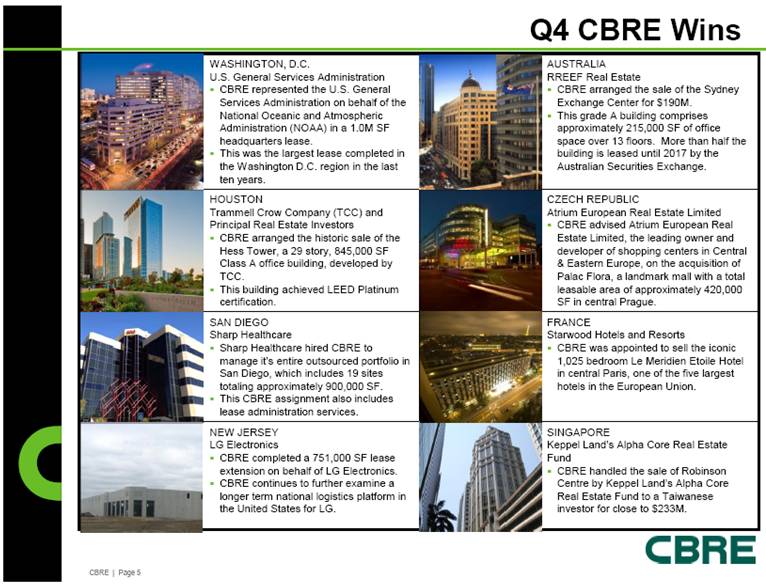
Q4 CBRE Wins WASHINGTON, D.C. U.S. General Services Administration CBRE represented the U.S. General Services Administration on behalf of the National Oceanic and Atmospheric Administration (NOAA) in a 1.0M SF headquarters lease. This was the largest lease completed in the Washington D.C. region in the last ten years. AUSTRALIA RREEF Real Estate CBRE arranged the sale of the Sydney Exchange Center for $190M. This grade A building comprises approximately 215,000 SF of office space over 13 floors. More than half the building is leased until 2017 by the Australian Securities Exchange. HOUSTON Trammell Crow Company (TCC) and Principal Real Estate Investors CBRE arranged the historic sale of the Hess Tower, a 29 story, 845,000 SF Class A office building, developed by TCC. This building achieved LEED Platinum certification. CZECH REPUBLIC Atrium European Real Estate Limited CBRE advised Atrium European Real Estate Limited, the leading owner and developer of shopping centers in Central & Eastern Europe, on the acquisition of Palac Flora, a landmark mall with a total leasable area of approximately 420,000 SF in central Prague. SAN DIEGO Sharp Healthcare Sharp Healthcare hired CBRE to manage it’s entire outsourced portfolio in San Diego, which includes 19 sites totaling approximately 900,000 SF. This CBRE assignment also includes lease administration services. FRANCE Starwood Hotels and Resorts CBRE was appointed to sell the iconic 1,025 bedroom Le Meridien Etoile Hotel in central Paris, one of the five largest hotels in the European Union. NEW JERSEY LG Electronics CBRE completed a 751,000 SF lease extension on behalf of LG Electronics. CBRE continues to further examine a longer term national logistics platform in the United States for LG. SINGAPORE Keppel Land’s Alpha Core Real Estate Fund CBRE handled the sale of Robinson Centre by Keppel Land’s Alpha Core Real Estate Fund to a Taiwanese investor for close to $233M. |
|
|
Q4 2011 Performance Overview Q4 2011 Q4 2010 Revenue1 $1,767.9 million $1,653.5 million Net Income2 GAAP $79.8 million Adjusted $149.3 million GAAP $95.1 million Adjusted $115.4 million EPS2,3 GAAP $0.25 Adjusted $0.46 GAAP $0.30 Adjusted $0.36 EBITDA4 $235.1 million $241.0 million Normalized EBITDA4,5 $314.9 million $253.1 million Normalized EBITDA Margin4,5 17.8% 15.3% Includes revenue from discontinued operations of $4.4 million and $2.2 million for the three months ended December 31, 2011 and 2010, respectively. Adjusted net income and adjusted EPS exclude amortization expense related to customer relationships resulting from the ING REIM and Trammell Crow Company (TCC) acquisitions, integration and other costs related to acquisitions, the write-down of impaired assets, cost containment expenses and the write-off of financing costs. All EPS information is based upon diluted shares. Includes EBITDA from discontinued operations of $12.2 million and $1.1 million for the three months ended December 31, 2011 and 2010, respectively. Normalized EBITDA excludes integration and other costs related to acquisitions, the write-down of impaired assets and cost containment expenses. |
|
|
Revenue Breakdown 4th Quarter 2011 Includes revenue from discontinued operations of $4.4 million and $2.2 million for the three months ended December 31, 2011 and 2010, respectively. Includes revenue from discontinued operations of $6.7 million and $3.9 million for the twelve months ended December 31, 2011 and 2010, respectively. 33% 31% 18% 6% 5% 4% 1% 2% ($ in millions) 2011 1 2010 1% Change 2011 2 2010 2% Change Leasing 590.8 614.1 -4 1,909.0 1,743.6 9 Property & Facilities Management 539.6 473.4 14 2,038.4 1,772.1 15 Sales 314.2 285.3 10 954.6 768.8 24 Appraisal & Valuation 108.9 110.2 -1 365.4 329.9 11 Investment Management 96.7 67.2 44 251.9 171.0 47 Commercial Mortgage Brokerage 72.6 58.0 25 228.6 164.2 39 Development Services 17.5 16.4 7 65.4 72.1 -9 Other 27.6 28.9 -4 98.8 97.5 1 Total 1,767.9 1,653.5 7 5,912.1 5,119.2 15 Three months ended December 31, Twelve months ended December 31, |
|
|
Outsourcing CAGR 13% 1. Represents combined data for CBRE and TCC; does not include joint ventures and affiliates 1 Q4 2011 Wins 13 new 10 renewals 10 expansions Highlights: 33 contracts signed in Q4 2011 173 total contracts signed in 2011 - a new single-year company record Total 2011 revenue crossed the $2 billion mark Total square footage under management at year end was almost 3 billion All regions posted double digit revenue growth for Q4 2011 and full year 2011 Expect positive trends to continue, particularly in EMEA and Asia Pacific 1.2 1.3 1.4 1.6 1.9 2.2 2.6 2.9 2004 2005 2006 2007 2008 2009 2010 2011 Global Square Footage Managed (SF in billions) |
|
|
US Market Statistics Source: CBRE Econometric Advisors (EA) Outlooks 4Q 2011 Starting in Q2 2011 retail has been expanded to include strip centers, neighborhood centers and community centers US Vacancy US Absorption Trends (in millions of square feet) 4Q10 3Q11 4Q11 4Q12 F 4Q13F 2010 2011 2012F 2013F 4Q10 4Q11 Office 16.5% 16.2% 16.0% 15.6% 14.6% 20.9 26.8 23.7 44.7 10.7 9.1 Industrial 14.3% 13.7% 13.6% 12.6% 11.5% 18.1 117.3 148.8 205.2 36.4 27.6 Retail 13.0% 13.2% 13.2% 12.2% 11.4% -3.9 2.1 29.4 37.4 3.2 2.8 Cap Rates Stable and Volumes Up Cap Rate Growth 1 4Q10 3Q11 4Q11 4Q12 F Office Volume ($B) 20.7 16.5 19.7 Cap Rate 7.4% 7.3% 7.3% +10 to +100 bps Industrial Volume ($B) 8.4 7.2 7.9 Cap Rate 8.4% 8.0% 7.8% +20 to +80 bps Retail Volume ($B) 8.2 8.6 10.9 Cap Rate 7.6% 7.6% 7.4% -10 to +50 bps Source: RCA January 2012 1. CBRE EA estimates |
|
|
Sales, Leasing and Outsourcing Revenue - Americas ($ in millions) Sales Leasing 36% 6% 15% (9%) Outsourcing 12% 10% $1,441.6 $1,288.6 $1,243.4 $1,174.6 $419.0 $379.7 $435.4 $592.3 Full Year 2010 2011 $349.6 $385.0 $165.9 $190.8 Fourth Quarter |
|
|
Sales, Leasing and Outsourcing Revenue – EMEA ($ in millions) Sales Leasing 3% (1%) 17% 11% Outsourcing 23% 17% $268.9 $332.0 $111.2 $123.6 $332.6 $388.0 $197.3 $202.4 Full Year 2010 2011 $73.5 $86.3 |
|
|
Sales, Leasing and Outsourcing Revenue – Asia Pacific ($ in millions) 18% 11% 17% 3% Sales Leasing Outsourcing 22% 36% $82.5 $85.0 $134.6 $158.7 Full Year 2010 2011 $48.8 $66.4 $45.2 $50.1 Fourth Quarter $233.5 $273.5 $211.7 $257.8 |
|
|
Development Services Highlights: Q4 2011 net gains of approximately $33 million from two asset sales $79.2 million of co-investments at the end of 2011 $15.0 million in recourse debt to CBRE and repayment guarantees at the end of 2011 In Process figures include Long-Term Operating Assets (LTOA) of $1.5 billion for 4Q 11, $1.6 billion for 4Q 10, $1.4 billion for 4Q 09 and $0.4 billion for both 4Q 08 and 4Q 07. LTOA are projects that have achieved a stabilized level of occupancy or have been held 18-24 months following shell completion or acquisition. 1 Includes revenue from discontinued operations of $1.3 million for both the three and twelve months ended December 31, 2011 and $2.2 million and $3.9 million for the three and twelve months ended December 31, 2010, respectively. Includes EBITDA from discontinued operations of $10.1 million for both the three and twelve months ended December 31, 2011 and $1.1 million and $16.4 million for the three and twelve months ended December 31, 2010, respectively. 2.2 3.8 5.0 4.9 3.6 2.8 2.6 3.6 5.4 6.5 5.6 4.7 4.9 4.9 2.3 1.4 2.0 2.3 1.4 1.5 2.5 2.7 3.0 2.7 2.5 0.9 1.2 1.2 4Q98 4Q99 4Q00 4Q01 4Q02 4Q03 4Q04 4Q05 4Q06 4Q07 4Q08 4Q09 4Q10 4Q11 Projects In Process/Pipeline ($ in billions) In Process Pipeline ($ in millions) 12/31/2011 12/31/2010 12/31/2011 12/31/2010 Revenue 1 22.4 19.6 77.6 79.5 EBITDA 2 49.4 5.4 76.1 48.7 Add Back: Cost Containment - - - 0.2 Net Write-down of Impaired Assets 2.7 3.2 4.1 4.4 Normalized EBITDA 2 52.1 8.6 80.2 53.3 EBITDA Margin 2 233% 44% 103% 67% Quarter Ended Year Ended |
|
|
Global Investment Management ($ in billions) ($ in millions) CAGR 20% CAGR 26% Includes revenue from discontinued operations of $5.5 million for the twelve months ended December 31, 2011. Includes revenue from discontinued operations of $3.1 million for the three months ended December 31, 2011. ING Clarion Real Estate Securities acquisition closed on July 1st ING REIM Asia and Europe acquisitions closed on October 3rd and October 31st, respectively CBRE’s co-investments totaled $169.6 million at the end of Q4 2011 ($ in millions) ($ in millions) 37.3 91.3 11.3 8.8 11.3 7.7 19.9 79.8 107.8 Q4 2010 Q4 2011 Q4 Revenue 2 57.1 68.4 94.0 99.3 126.3 259.2 160.8 141.4 195.7 294.0 28.0 101.7 88.7 0.4 19.9 1.5 57.1 68.4 94.0 127.3 228.0 347.9 161.2 141.4 215.6 295.5 2002 2003 2004 2005 2006 2007 2008 2009 2010 2011 Annual Revenue 127.0 219.8 27.1 35.9 41.6 38.3 19.9 1.5 215.6 295.5 2010 2011 Full Year Revenue 1 Investment Management Carried Interest Asset Management Acquisition, Disposition & Incentive Rental Carried Interest 11.4 14.4 15.1 17.3 28.6 37.8 38.5 34.7 37.6 94.1 2002 2003 2004 2005 2006 2007 2008 2009 2010 2011 Assets Under Management |
|
|
Global Investment Management Pro-forma Normalized EBITDA For the three months ended December 31, 2011, the Company recorded net carried interest incentive compensation expense of $10.5 million pertaining to future periods, compared to $13.8 million in the 2010 period. For the twelve months ended December 31, 2011, the Company recorded net carried interest incentive compensation expense of $24.2 million pertaining to future periods, compared to $13.0 million in the 2010 period. As of December 31, 2011, the Company maintained a cumulative remaining accrual of such compensation expense of approximately $44 million, which pertains to anticipated future carried interest revenue. Includes EBITDA from discontinued operations of $2.1 million and $4.0 million for the three and twelve months ended December 31, 2011, respectively. Calculation includes EBITDA and revenue from discontinued operations. ($ in millions) 2011 2010 2011 2010 EBITDA 1 (29.4) 26.1 (14.8) 48.6 Add Back: Integration and other costs related to acquisitions 45.0 - 66.7 - Write-down of investments 0.9 1.2 5.4 6.9 Cost containment expenses - - - 0.4 Normalized EBITDA 1 16.5 27.3 57.3 55.9 Net accrual of incentive compensation expense related to carried interest revenue not yet recognized 10.5 13.8 24.2 13.0 Pro-forma Normalized EBITDA 1 27.0 41.1 81.5 68.9 Pro-forma Normalized EBITDA Margin 2 25% 52% 28% 32% Three Months Ended December 31, Twelve Months Ended December 31, |
|
|
Mandatory Amortization and Maturity Schedule $ millions $700.0 million revolver facility matures in May 2015. As of December 31, 2011, the outstanding revolver balance was $44.8 million. As of December 31, 2011 1 0.0 250.0 500.0 2012 2013 2014 2015 2016 2017 2018 2019 2020 Term Loan A Term Loan A1 Term Loan B Term Loan C Term Loan D Sr. Subordinated Notes Sr. Unsecured Notes Revolver |
|
|
Capitalization Excludes $208.1 million and $26.1 million of cash in consolidated funds and other entities not available for company use at December 31, 2011 and December 31, 2010, respectively. Net of original issue discount of $11.0 million and $12.3 million at December 31, 2011 and 2010, respectively. Represents notes payable on real estate in Development Services that are recourse to the Company. Excludes non-recourse notes payable on real estate of $359.3 million and $623.8 million at December 31, 2011 and 2010, respectively. Excludes $713.4 million and $453.8 million of aggregate non-recourse warehouse facilities at December 31, 2011 and 2010, respectively. ($ in millions) 12/31/2011 12/31/2010 Variance Cash 1 885.1 480.5 404.6 Revolving credit facility 44.8 17.5 27.3 Senior secured term loan A 306.2 341.3 (35.1) Senior secured term loan A-1 285.1 - 285.1 Senior secured term loan B 296.3 299.2 (2.9) Senior secured term loan C 398.0 - 398.0 Senior secured term loan D 398.0 - 398.0 Senior subordinated notes 2 439.0 437.7 1.3 Senior unsecured notes 350.0 350.0 - Notes payable on real estate 3 13.6 3.7 9.9 Other debt 4 0.1 0.2 (0.1) Total debt 2,531.1 1,449.6 1,081.5 Stockholders' equity 1,151.5 908.2 243.3 Total capitalization 3,682.6 2,357.8 1,324.8 Total net debt 1,646.0 969.1 676.9 As of |
|
|
Business Outlook We believe that we are in a cyclical recovery in commercial real estate with annual growth expected to be similar to our long-term business model This model (on a normalized basis) is: Revenue growth of 7-9% EBITDA growth of 12-14% EPS growth of high-teens to 20% Outsourcing is likely to grow at one of the faster rates among our businesses, in the low double digits Investment sales will likely be paced by broader economic recovery driven by core asset demand in major markets with increasing contributions from secondary markets Leasing growth rates will likely continue to be modest until we see sustained job growth and rental rate increases Investment management will benefit from a full year of contribution from ING REIM We expect to once again deliver the industry’s highest normalized EBITDA margin in 2012, in large part due to our expense discipline All these factors support our 2012 normalized EPS guidance range of $1.20 to $1.25 per diluted share |
|
|
GAAP Reconciliation Tables |
|
|
Reconciliation of Normalized EBITDA to EBITDA to Net Income Includes EBITDA related to discontinued operations of $12.2 million and $14.1 million for the three and twelve months ended December 31, 2011, respectively, and $1.1 million and $16.4 million for the three and twelve months ended December 31, 2010, respectively. Includes depreciation and amortization expense related to discontinued operations of $0.7 million and $1.2 million for the three and twelve months ended December 31, 2011, respectively, and $0.4 million and $0.6 million for the three and twelve months ended December 31, 2010, respectively. Includes interest expense related to discontinued operations of $1.9 million and $3.2 million for the three and twelve months ended December 31, 2011, respectively, and $0.5 million and $1.6 million for the three and twelve months ended December 31, 2010, respectively. Includes provision for income taxes related to discontinued operations of $4.0 million for both the three and twelve months ended December 31, 2011, and $0.4 million and $5.4 million for the three and twelve months ended December 31, 2010, respectively. Includes revenue related to discontinued operations of $4.4 million and $6.7 million for the three and twelve months ended December 31, 2011, respectively, and $2.2 million and $3.9 million for the three and twelve months ended December 31, 2010, respectively. ($ in millions) 2011 2010 2011 2010 Normalized EBITDA 1 314.9 $ 253.1 $ 802.6 $ 681.3 $ Adjustments: Integration and other costs related to acquisitions 45.1 4.3 68.8 7.2 Cost containment expenses 31.1 3.4 31.1 15.3 Write-down of impaired assets 3.6 4.4 9.4 11.3 EBITDA 1 235.1 241.0 693.3 647.5 Add: Interest income 2.4 2.0 9.4 8.4 Less: Depreciation and amortization 2 36.5 29.3 116.9 109.0 Interest expense 3 45.1 41.8 153.5 192.7 Write-off of financing costs - 18.1 - 18.1 Provision for income taxes 4 76.1 58.7 193.1 135.8 Net income attributable to CBRE Group, Inc. 79.8 95.1 239.2 200.3 Revenue 5 1,767.9 $ 1,653.5 $ 5,912.1 $ 5,119.2 $ Normalized EBITDA Margin 1 17.8% 15.3% 13.6% 13.3% Twelve Months Ended December 31, Three Months Ended December 31, |
|
|
Reconciliation of Net Income to Net Income, As Adjusted ($ in millions, except for per share data) 2011 2010 2011 2010 Net income attributable to CBRE Group, Inc. 79.8 $ 95.1 $ 239.2 $ 200.3 $ Integration and other costs related to 42.8 2.7 59.6 4.5 acquisitions, net of tax Cost containment expenses, net of tax 20.6 2.0 20.6 9.5 Amortization expense related to ING REIM and TCC customer relationships acquired, net of tax 3.9 1.7 9.4 7.3 Write-down of impaired assets, net of tax 2.2 2.7 5.7 7.0 Write-off of financing costs, net of tax - 11.2 - 11.2 Net income attributable to CBRE Group, Inc., as adjusted 149.3 $115.4 $334.5 $239.8 $Diluted income per share attributable to CBRE Group, Inc., as adjusted 0.46 $0.36 $1.03 $0.75 $ Weighted average shares outstanding for diluted income per share 324,117,111 321,208,613 323,723,755 319,016,887 Twelve Months Ended December 31, Three Months Ended December 31, |