Attached files
Table of Contents
UNITED STATES
SECURITIES AND EXCHANGE COMMISSION
Washington, D.C. 20549
FORM 10-K
ANNUAL REPORT PURSUANT TO SECTION 13 OR 15(d)
OF THE SECURITIES EXCHANGE ACT OF 1934
For the fiscal year ended December 31, 2009
Commission File Number 001 - 32205
CB RICHARD ELLIS GROUP, INC.
(Exact name of registrant as specified in its charter)
| Delaware | 94-3391143 | |
| (State or other jurisdiction of incorporation or organization) |
(I.R.S. Employer Identification Number) | |
| 11150 Santa Monica Boulevard, Suite 1600 Los Angeles, California |
90025 | |
| (Address of principal executive offices) | (Zip Code) | |
(310) 405-8900
(Registrant’s telephone number, including area code)
Securities registered pursuant to Section 12(b) of the Act:
| Title of Each Class |
Name of Each Exchange on Which Registered | |
| Class A Common Stock, $0.01 par value | New York Stock Exchange |
Securities registered pursuant to Section 12(g) of the Act:
N.A.
Indicate by check mark if the registrant is a well-known seasoned issuer, as defined in Rule 405 of the Securities Act. Yes x No ¨
Indicate by check mark if the registrant is not required to file reports pursuant to Section 13 or Section 15(d) of the Act. Yes ¨ No x
Indicate by check mark whether the registrant (1) has filed all reports required to be filed by Section 13 or 15(d) of the Securities Exchange Act of 1934 during the preceding 12 months (or for such shorter period that the registrant was required to file such reports), and (2) has been subject to such filing requirements for the past 90 days. Yes x No ¨
Indicate by check mark whether the registrant has submitted electronically and posted on its corporate Web site, if any, every Interactive Data File required to be submitted and posted pursuant to Rule 405 of Regulation S-T during the preceding 12 months (or for such shorter period that the registrant was required to submit and post such files). Yes ¨ No ¨.
Indicate by check mark if disclosure of delinquent filers pursuant to Item 405 of Regulation S-K is not contained herein, and will not be contained, to the best of registrant’s knowledge, in definitive proxy or information statements incorporated by reference in Part III of this Form 10-K or any amendment to the Form 10-K. ¨
Indicate by check mark whether the registrant is a large accelerated filer, an accelerated filer, a non-accelerated filer, or a smaller reporting company. See definition of “large accelerated filer,” “accelerated filer” and “smaller reporting company” in Rule 12b-2 of the Exchange Act.
Large accelerated filer x Accelerated filer ¨ Non-accelerated filer ¨ Smaller reporting company ¨
Indicate by check mark whether the registrant is a shell company (as defined in Rule 12b-2 of the Exchange Act). Yes ¨ No x
As of June 30, 2009, the aggregate market value of Class A Common Stock held by non-affiliates of the registrant was $2.7 billion based upon the last sales price on June 30, 2009 on the New York Stock Exchange of $9.36 for the registrant’s Class A Common Stock.
As of February 12, 2010, the number of shares of Class A Common Stock outstanding was 321,819,925.
DOCUMENTS INCORPORATED BY REFERENCE
Portions of the proxy statement for the registrant’s 2010 Annual Meeting of Stockholders to be held June 2, 2010 are incorporated by reference in Part III of this Form 10-K Report.
Table of Contents
ANNUAL REPORT ON FORM 10-K
TABLE OF CONTENTS
Table of Contents
Company Overview
CB Richard Ellis Group, Inc. (which may be referred to in this Form 10-K as the “company”, “we”, “us” and “our”) is the world’s largest commercial real estate services firm, based on 2009 revenue, with leading full-service operations in major metropolitan areas throughout the world. We offer a full range of services to occupiers, owners, lenders and investors in office, retail, industrial, multi-family and other types of commercial real estate. As of December 31, 2009, we operated more than 300 offices worldwide, excluding affiliate offices, with approximately 29,000 employees providing commercial real estate services under the “CB Richard Ellis” brand name and development services under the “Trammell Crow” brand name. Our business is focused on several competencies, including commercial property and corporate facilities management, tenant representation, property/agency leasing, property sales, valuation, real estate investment management, commercial mortgage origination and servicing, capital markets (equity and debt) solutions, development services and proprietary research. We generate revenues from contractual management fees and on a per project or transactional basis. In 2006, we became the first commercial real estate services company included in the S&P 500. In 2007, 2008 and 2009, we were the only commercial real estate services company included on the Business Week list of 50 “Best in Class” companies across all industries. In 2008, we became the first commercial real estate services firm to be included in the Fortune 500 and remained the only commercial real estate services company on this list in 2009. Fortune also included us on its list of Most Admired Companies in the real estate sector in 2009. Additionally, in 2009, the International Association of Outsourcing Professionals ranked us the #1 outsourcing company in commercial real estate services and the #8 outsourcing company across all industries.
During the year ended December 31, 2009, we generated revenue from a well-balanced, highly diversified base of clients that includes nearly 80 of the Fortune 100 companies. Many of our clients are consolidating their commercial real estate-related needs with fewer providers and, as a result, awarding their business to providers that have a strong presence in important markets and the ability to provide a complete range of services worldwide. As a result of this trend and our ability to deliver comprehensive integrated solutions for our clients’ needs across a wide range of markets, we believe we are well positioned to capture a growing percentage of our clients’ commercial real estate services needs.
CB Richard Ellis History
CB Richard Ellis marked its 103rd year of continuous operations in 2009, tracing our origins to a company founded in San Francisco in the aftermath of the 1906 earthquake. That company grew to become one of the largest commercial real estate services firms in the western United States during the 1940s. In the 1960s and 1970s, the company expanded both its service portfolio and geographic coverage to become a full-service provider with a growing presence throughout the United States.
In 1989, employees and third-party investors acquired the company’s operations to form CB Commercial. Throughout the 1990s, CB Commercial moved aggressively to accelerate growth and develop and enhance global capabilities to meet client demands. The company acquired leading firms in investment management (Westmark Realty Advisors, now CB Richard Ellis Investors, in 1995), mortgage banking (L.J. Melody & Company, now operating under the name CBRE Capital Markets, in 1996) and property and corporate facilities management, as well as capital markets and investment management (Koll Real Estate Services, in 1997). In 1996, CB Commercial became a public company.
In 1998, the company, then known as CB Commercial Real Estate Services Group, achieved significant global expansion with the acquisition of REI Limited. REI Limited, which traces its roots to London in 1773, was the holding company for all “Richard Ellis” operations outside of the United Kingdom. Following the REI Limited acquisition, the company changed its name to CB Richard Ellis Services, Inc. and, later in 1998, acquired the London-based firm of Hillier Parker May & Rowden, one of the top property services firms
1
Table of Contents
operating in the United Kingdom. With these acquisitions, we believe we became the first real estate services firm with a platform to deliver integrated real estate services across the world’s major business capitals through one commonly-owned, commonly-managed company.
CB Richard Ellis Group, Inc., which was initially known as Blum CB Holding Corp. and later as CBRE Holding, Inc., was formed by an affiliate of Blum Capital Partners, L.P. as a Delaware corporation on February 20, 2001 for the purpose of acquiring all of the outstanding stock of CB Richard Ellis Services in a “going private” transaction. This transaction, which involved members of our senior management team and affiliates of Blum Capital Partners and Freeman Spogli & Co., was completed in 2001.
In July 2003, our global position was further solidified as our wholly-owned subsidiary CB Richard Ellis Services and Insignia Financial Group, Inc. (Insignia) were brought together to form a premier, worldwide, full-service real estate services company. As a result of the Insignia acquisition, we operate globally under the “CB Richard Ellis” brand name, which we believe is a well-recognized brand in virtually all of the world’s key business centers. In order to enhance our financing flexibility and to provide liquidity for some of our stockholders, in June 2004, we completed an initial public offering of our common stock.
In December 2006, we completed the acquisition of Trammell Crow Company, our largest acquisition to date, which deepened our outsourcing services offerings for corporate and institutional clients, especially project and facilities management, strengthened our ability to provide integrated account management solutions across geographies, and established resources and expertise to offer real estate development services throughout the United States.
Beginning in 2005 and continuing throughout 2008, we have supplemented our global capabilities through the acquisition of regional and specialty-niche firms that are leaders in their areas of concentration or in their local markets, including regional firms with which we had previous affiliate relationships. These “in-fill” acquisitions remain an integral part of our long-term strategy.
Our Corporate Structure
CB Richard Ellis Group, Inc. is a holding company that conducts all of its operations through its indirect subsidiaries. CB Richard Ellis Services, Inc., our direct wholly-owned subsidiary, is also generally a holding company and is the primary obligor or issuer with respect to most of our long-term indebtedness, including our senior secured term loan facilities obtained to finance the acquisition of Trammell Crow Company.
In our Americas segment, most of our advisory services and outsourcing services operations are conducted through our indirect wholly-owned subsidiary CB Richard Ellis, Inc. Our mortgage loan origination and servicing operations are conducted exclusively through our indirect wholly-owned subsidiary operating under the name CBRE Capital Markets and its subsidiaries. Our operations in Canada are primarily conducted through our indirect wholly-owned subsidiary CB Richard Ellis Limited.
In our Europe, Middle East and Africa, or EMEA, segment, operations are conducted through a number of indirect wholly-owned subsidiaries. The most significant of such subsidiaries include CB Richard Ellis Ltd. (the United Kingdom), CB Richard Ellis Holding SAS (France), CB Richard Ellis SA (Spain), CB Richard Ellis GmbH (Germany), CB Richard Ellis, B.V. (the Netherlands), CB Richard Ellis LLC (Russia) and CB Richard Ellis SpA (Italy).
In our Asia Pacific segment, operations are primarily conducted through a number of indirect wholly-owned subsidiaries, including CB Richard Ellis Pty Ltd. (Australia), CB Richard Ellis Ltd. (New Zealand), CB Richard Ellis Ltd. (Hong Kong and China), CB Richard Ellis Korea Co Ltd. (Korea), CB Richard Ellis Pte Ltd. (Singapore), CB Richard Ellis KK (Japan) and CB Richard Ellis South Asia Pte Ltd (India).
2
Table of Contents
Operations in our Global Investment Management segment are conducted through our indirect wholly-owned subsidiary CB Richard Ellis Investors, L.L.C. and its global affiliates, which we also refer to as CBRE Investors.
Operations in our Development Services segment are conducted through our indirect wholly-owned subsidiaries Trammell Crow Company, Trammell Crow Services, Inc. and certain of its subsidiaries.
Industry Overview
Our business covers all aspects of the commercial real estate industry, including commercial property and corporate facilities management, tenant representation, property/agency leasing, property sales, valuation, real estate investment management, commercial mortgage origination and servicing, capital markets (equity and debt) solutions, development services and proprietary research.
We review, on a quarterly basis, various internally-generated statistics and estimates regarding both office and industrial space within the U.S. commercial real estate services industry, including the total available “stock” of rentable space and the average rent per square foot of space. Our management believes that changes in the addressable commercial rental market represented by the product of available stock and rent per square foot provide a reliable estimate of changes in the overall commercial real estate services industry because nearly all segments within the industry are affected by changes in these two measurements. We estimate that the product of available stock and rent per square foot grew at a compound annual growth rate of approximately 2% from 1999 through 2009.
We believe the key drivers of revenue growth for the largest commercial real estate services companies are primarily: (1) the continued outsourcing of commercial real estate services, (2) the consolidation of client activities with fewer service providers, (3) the institutional ownership of commercial real estate and (4) the ability to attract and retain talent.
Outsourcing
Motivated to reduce costs, lower overhead, improve execution across markets, increase operational efficiency and focus more closely on their core competencies, property owners and occupiers have increasingly been contracting out for their commercial real estate services, including the following:
| • | Transaction management—oversight of purchase and sale of properties, execution of lease transactions, renewal of leases, expansion and relocation of offices and disposition of surplus space; |
| • | Facilities management—oversight of all the operations associated with the functioning of occupied real estate, whether owned or leased, including engineering services, janitorial services, security services, landscaping and capital improvements and directing and monitoring of various subcontractors; |
| • | Project management—oversight of the design and construction of interior space (as distinct from building design and construction) for space users and occupiers, including assembling and coordinating contract teams, and creating and managing budgets; |
| • | Portfolio management—analysis of all real estate leases of a client to ensure that it is in compliance with all terms and maintenance of reports on all lease data, including critical dates such as renewal options, expansion options and termination options, performance of required services and proper charging or payment of costs; |
| • | Construction management—space planning and tenant build-out coordination for investor clients; |
| • | Property management—oversight of the daily operation of a single property or portfolio of properties, including tenant service/relations and bidding, awarding and administering subcontracts for maintenance, landscaping, security, parking, capital and tenant improvements to implement the owner’s specific property value enhancement objectives through maximization of cash flow; and |
3
Table of Contents
| • | Property accounting—performance of all of the accounting and financial reporting associated with a property or portfolio, including operating budgets and expenses, rent collection and other accounts receivable, accounts payable, capital and tenant improvements and tenant lease administration. |
Consolidation
We believe that major property owners and corporate users are motivated to consolidate their service provider relationships on a regional, national and global basis to obtain more consistent execution across markets to achieve economies of scale and to benefit from streamlined management oversight and the efficiency of single point of contact service delivery. As a result, we believe large owners and occupiers are awarding an increasing share of this business to larger commercial real estate services providers, particularly those that provide a full suite of services across geographical boundaries.
Institutional Ownership of Commercial Real Estate
Since the mid 1990s, institutional owners, such as real estate investment trusts, or REITs, pension funds, foreign institutions and other financial entities, have acquired more real estate assets. These acquisitions have been motivated by a need to diversify their investment portfolios. Total U.S. real estate assets held by institutional owners was $424 billion in 2009, up from $361 billion in 1999. Much of that growth has been driven by REITs, which increased their holdings by nearly 23% over this time period. Although institutional investment in real estate has decreased significantly in the past two years due to market weakness and lower portfolio values, the long term trend of increased institutional ownership remains intact. We believe it is likely that many institutional owners will outsource management of their portfolios and consolidate their use of real estate services vendors.
Attracting and Retaining Talent
Attracting and retaining the best real estate services professionals is fundamental to a successful growth strategy. A broad global platform, strong brand and local market leadership position a company well to draw top professionals away from smaller, less diversified firms. This is especially true during periods of slower market activity. Investing heavily in the continuous training, development and skill-enhancement of existing professionals is key to success in this area.
Our Regions of Operation and Principal Services
We report our operations through five segments. The segments are as follows: (1) Americas, (2) EMEA, (3) Asia Pacific, (4) Global Investment Management and (5) Development Services.
Information regarding revenue and operating income or loss, attributable to each of our segments, is included in “Segment Operations” within the “Management’s Discussion and Analysis of Financial Condition and Results of Operations” section and within Note 23 of our Notes to Consolidated Financial Statements, which are incorporated herein by reference. Information concerning the identifiable assets of each of our business segments is also set forth in Note 23 of our Notes to Consolidated Financial Statements, which are incorporated herein by reference.
The Americas
The Americas segment is our largest segment of operations and provides a comprehensive range of services throughout the United States and in the largest metropolitan regions in Canada and selected parts of Latin America through both wholly-owned operations as well as affiliated offices. Our Americas segment accounted
4
Table of Contents
for 62.3% of our 2009 revenue, 62.6% of our 2008 revenue and 61.1% of our 2007 revenue. Within our Americas segment, we organize our services into the following business areas:
Advisory Services
Our advisory services businesses offer occupier/tenant and investor/owner services that meet the full spectrum of marketplace needs, including (1) real estate services, (2) capital markets and (3) valuation. Our advisory services business line accounted for 30.8% of our 2009 consolidated revenue, 34.6% of our 2008 consolidated revenue and 42.5% of our 2007 consolidated revenue.
Within advisory services, our major service lines are the following:
| • | Real Estate Services. We provide strategic advice and execution to owners, investors and occupiers of real estate in connection with leasing, disposition and acquisition of property. These businesses are built upon strong client relationships that frequently lead to recurring revenue opportunities over many years. Our real estate services professionals are particularly adept at aligning real estate strategies with client business objectives, serving as advisors as well as transaction executors. We believe we are a market leader for the provision of sales and leasing real estate services in most top U.S. metropolitan statistical areas (as defined by the U.S. Census Bureau), including Atlanta, Chicago, Dallas, Houston, Los Angeles, Miami, New York and Philadelphia. |
Our real estate services professionals are compensated primarily through commission-based programs, which are payable upon completion of an assignment. Therefore, as compensation is our largest expense, this cost structure gives us flexibility to mitigate the negative effect on our operating margins during difficult market conditions. Due to the low barriers to entry and significant competition for quality employees, we strive to retain top professionals through an attractive compensation program tied to productivity. We also believe we invest in greater support resources than most other firms, including professional development and training, market research and information, technology, branding and marketing. We also foster an entrepreneurial culture that emphasizes client service and rewards performance.
We further strengthen our relationships with our real estate services clients by offering proprietary research to them through our commercial real estate market information and forecasting unit, CBRE Econometric Advisors (formerly CBRE Torto Wheaton Research). This group provides data and analysis to its clients in various formats, including market outlook reports for the office, industrial, hotel, retail and multi-housing sectors, covering more than 55 U.S. metropolitan statistical areas through the CBRE-EA Peer Select office product, including a database covering over 300,000 office and industrial properties.
| • | Capital Markets. In 2005, we combined our investment sales and debt/equity financing professionals into a single fully integrated service offering called CBRE Capital Markets. The move formalized the collaboration between our investment sales professionals and debt/equity financing experts that has grown as investors have sought comprehensive capital markets solutions, rather than separate sales and financing transactions. During 2009, we concluded more than $16.3 billion of capital markets transactions in the Americas, including $10.0 billion of investment sales transactions and $6.3 billion of mortgage loan originations. |
Our Investment Properties business, which includes office, industrial, retail, multi-family and hotel properties, is one of the largest investment sales property advisors in the United States, with a market share of approximately 15% in 2009, down from approximately 18% in 2008. Our U.S. investment sales activity decreased by approximately 69% during 2009 versus a decrease of approximately 63% for the U.S. market as a whole. Our mortgage brokerage business originates and services commercial mortgage loans primarily through relationships established with investment banking firms, national banks, credit companies, insurance companies, pension funds and government agencies. Our mortgage loan origination volume in 2009 was $6.3 billion, representing a decrease of approximately 38% from 2008. Approximately $3.7 billion of loans in 2009 were originated for federal government sponsored entities,
5
Table of Contents
most of which were financed through revolving credit lines dedicated exclusively for this purpose. Loans financed through the revolving credit lines generally occur with principal risk that is substantially mitigated because before the loan is originated, we obtain either a contractual purchase commitment from the government sponsored entity or a confirmed forward trade commitment for the issuance and purchase of a mortgage backed security that will be secured by the loan. In 2009, GEMSA Loan Services, a joint venture between CBRE Capital Markets and GE Capital Real Estate, serviced approximately $116.2 billion of mortgage loans, $59.0 billion of which relate to the servicing rights of CBRE Capital Markets.
| • | Valuation. We provide valuation services that include market value appraisals, litigation support, discounted cash flow analyses and feasibility and fairness opinions. Our valuation business has developed proprietary technology for preparing and delivering valuation reports to our clients, which we believe provides us with an advantage over our competitors. We believe that our valuation business is one of the largest in the industry. During 2009, we completed over 30,000 valuation, appraisal and advisory assignments. |
Outsourcing Services
Outsourcing is a long-term trend in commercial real estate, with corporations, institutions, public sector entities and others seeking to achieve improved efficiency, better execution and lower costs by relying on the expertise of third-party real estate specialists. Our outsourcing services primarily include two major business lines that seek to capitalize on this trend: (1) corporate services and (2) asset services. Agreements with our corporate services clients are generally long-term arrangements and although they contain different provisions for termination, there are usually penalties for early termination. Although our management agreements with our asset services clients generally may be terminated with notice ranging between 30 to 90 days, we have developed long-term relationships with many of these clients and we continue to work closely with them to implement their specific goals and objectives and to preserve and expand upon these relationships. As of December 31, 2009, we managed nearly 1.2 billion square feet of commercial space for property owners and occupiers, which we believe represents one of the largest portfolios in the Americas. Our outsourcing services business line accounted for 31.5% of our 2009 consolidated revenue, 28.0% of our 2008 consolidated revenue and 18.6% of our 2007 consolidated revenue.
| • | Corporate Services. We provide a comprehensive suite of services to corporate users of real estate, including transaction management, project management, facilities management, strategic consulting, portfolio management and other services. Our clients are leading global corporations, health care institutions and public sector entities with large, geographically-diverse real estate portfolios. Project management services are typically provided on a portfolio-wide or programmatic basis. Facilities management involves the day-to-day management of client-occupied space and includes headquarters buildings, regional offices, administrative offices and manufacturing and distribution facilities. We identify best practices, implement technology solutions and leverage our resources to control clients’ facilities costs and enhance the workplace environment. We seek to enter into multi-year, multi-service outsourcing contracts with our clients, but also provide services on a one-off assignment or a short-term contract basis. We enter into long-term, contractual relationships with these organizations with the goal of ensuring that our clients’ real estate strategies support their overall business strategies. Revenues for project management include fixed management fees, variable fees, and incentive fees if certain agreed-upon performance targets are met. Revenues may also include reimbursement of payroll and related costs for personnel providing the services. Contracts for facilities management services are typically structured so we receive reimbursement of client-dedicated personnel costs and associated overhead expenses plus a monthly fee, and in some cases, annual incentives if agreed-upon performance targets are satisfied. |
| • | Asset Services. We provide property management, construction management, marketing, leasing, accounting and financial services on a contractual basis for income-producing office, industrial and retail properties owned by local, regional and institutional investors. We provide these services through |
6
Table of Contents
| an extensive network of real estate experts in major markets throughout the United States. These local office delivery teams are supported by a strategic accounts team whose function is to help ensure quality service and to maintain and expand relationships with large institutional clients, including buyers, sellers and landlords who need to lease, buy, sell and/or finance space. We believe our contractual relationships with these clients put us in an advantageous position to provide other services to them, including refinancing, disposition and appraisal. We typically receive monthly management fees for the asset services we provide based upon a specified percentage of the monthly rental income or rental receipts generated from the property under management, or in certain cases, the greater of such percentage fee or a minimum agreed-upon fee. We are also normally reimbursed for our administrative and payroll costs, as well as certain out-of-pocket expenses, directly attributable to the properties under management. |
Europe, Middle East and Africa (EMEA)
Our EMEA segment operates in 37 countries, with its largest operations located in the United Kingdom, France, Spain, Germany, the Netherlands, Russia and Italy. Within EMEA, our services are organized along the same lines as in the Americas, including brokerage, investment properties, corporate services, valuation/appraisal services, asset management services and facilities management, among others. Our EMEA segment accounted for 19.6% of our 2009 revenue, 21.1% of our 2008 revenue and 21.8% of our 2007 revenue.
We are one of the leading commercial real estate services companies in the United Kingdom. We hold the leading market position in London in terms of 2009 leased square footage and provide a broad range of commercial property real estate services to investment, commercial and corporate clients located in London. We also have 11 regional offices in Aberdeen, Birmingham, Bristol, Jersey, Leeds, Liverpool, Manchester, Edinburgh, Southampton and Glasgow. In France, we believe we are a market leader in Paris and we provide a complete range of services to the commercial property sector. In Spain, we provide full-service coverage through our offices in Madrid, Marbella, Barcelona, Zaragoza, Valencia, Malaga and Palma de Mallorca. Our German operations are located in Berlin, Cologne, Düsseldorf, Frankfurt, Hamburg, Munich and Stuttgart. Our operations in the Netherlands are located in Amsterdam, Almere, Hoofddorp and the Hague. Our operations in Russia consist of an office in Moscow. Our presence in Italy includes offices in Milan, Modena, Rome and Turin. Our operations in these countries generally provide a full range of services to the commercial property sector. Additionally, we provide some residential property services, primarily in the United Kingdom, France and Spain.
We also have affiliated offices that provide commercial real estate services under our brand name in several countries throughout Europe, the Middle East and Africa. Our agreements with these independent offices include licenses to use the “CB Richard Ellis” name in the relevant territory in return for payments to us of annual royalty fees. In addition, these agreements also include business cross-referral arrangements between us and our affiliates.
Asia Pacific
Our Asia Pacific segment operates in 13 countries. We believe that we are one of only a few companies that can provide a full range of real estate services to large corporations throughout the region, similar to the broad range of services provided by our Americas and EMEA segments. Our principal operations in Asia are located in China, Hong Kong, India, Japan, Singapore and South Korea. In addition, we have agreements with affiliate offices in the Philippines, Thailand, Indonesia, Vietnam, Cambodia and Malaysia that generate royalty fees and support cross-referral arrangements on terms similar to those with our affiliated offices in our EMEA segment. The Pacific region includes Australia and New Zealand, with principal offices located in Adelaide, Brisbane, Canberra, Melbourne, Sydney, Perth, Auckland, Wellington and Christchurch. Our Asia Pacific segment accounted for 12.6% of our 2009 revenue, 10.9% of our 2008 revenue and 9.1% of our 2007 revenue.
7
Table of Contents
Global Investment Management
Our indirect wholly-owned subsidiary, CB Richard Ellis Investors, L.L.C. and its global affiliates, which we also refer to as CBRE Investors, provide investment management services to clients/partners that include pension plans, foundations, endowments and other organizations seeking to generate returns and diversification through investment in real estate. It sponsors investment programs that span the risk/return spectrum across three continents: North America, Europe and Asia. In higher yield strategies, CBRE Investors and its investment teams “co-invest” with its limited partners. Our Global Investment Management segment accounted for 3.4% of our 2009 revenue, 3.1% of our 2008 revenue and 5.8% of our 2007 revenue.
CBRE Investors is organized into four primary investment execution groups according to strategy, which include direct real estate investments through the Managed Accounts Group (low risk), Strategic Partners (higher yielding strategies), Capital Partners (higher yielding debt strategies) and indirect real estate investments in real estate securities and unlisted property funds (multiple risk strategies). Operationally, a dedicated investment team executes each investment strategy, with the team’s compensation being driven largely by the investment performance of its particular strategy/fund. This organizational structure is designed to align the interests of team members with those of the firm and its investor clients/partners and to enhance accountability and performance. Dedicated teams are supported by shared resources such as accounting, financial controls, information technology, investor services and research. CBRE Investors has an in-house team of research professionals who focus on investment strategy, underwriting and forecasting, based in part on research from our advisory services group.
CBRE Investors closed approximately $1.7 billion and $5.3 billion of new acquisitions in 2009 and 2008, respectively. It liquidated $0.8 billion and $1.2 billion of investments in 2009 and 2008, respectively. Assets under management have increased from $8.4 billion at December 31, 1999 to $34.7 billion at December 31, 2009, representing an approximately 15% compound annual growth rate.
Development Services
Our indirect wholly-owned subsidiary Trammell Crow Company and certain of its subsidiaries provide development services primarily in the United States to users of and investors in commercial real estate, as well as for its own account. Trammell Crow Company pursues opportunistic but risk-mitigated development and investment in commercial real estate across a wide spectrum of property types, including industrial, office and retail properties; healthcare facilities of all types (medical office buildings, hospitals and ambulatory surgery centers); higher education facilities (primarily student housing); and residential/mixed-use projects. Our Development Services segment accounted for 2.1% of our 2009 revenue, 2.3% of our 2008 revenue and 2.2% of our 2007 revenue.
Trammell Crow Company acts as the manager of development projects, providing services that are vital in all stages of the process, including: (i) site identification, due diligence and acquisition; (ii) evaluating project feasibility, budgeting, scheduling and cash flow analysis; (iii) procurement of approvals and permits, including zoning and other entitlements; (iv) project finance advisory services; (v) coordination of project design and engineering; (vi) construction bidding and management as well as tenant finish coordination; and (vii) project close-out and tenant move coordination.
Trammell Crow Company may pursue development and investment activity on behalf of its user and investor clients (with no ownership), in partnership with its clients (through co-investment—either on an individual project basis or through a fund or program) or for its own account (100% ownership). Development activity in which Trammell Crow Company has an ownership interest is conducted through subsidiaries that are consolidated or unconsolidated for financial reporting purposes, depending primarily on the extent and nature of our ownership interest.
8
Table of Contents
Trammell Crow Company has established several commingled investment funds to facilitate its pursuit of opportunistic and value added development and investment projects. In addition, it seeks to channel a large part of its development and investment activity into programs with certain strategic capital partners.
At December 31, 2009, Trammell Crow Company had $4.7 billion of development projects in process. Additionally, the inventory of pipeline deals (those projects we are pursuing, which we believe have a greater than 50% chance of closing or where land has been acquired and the project construction start is more than twelve months out) was $0.9 billion at December 31, 2009.
Our Competitive Position
We believe we possess several competitive strengths that position us to capitalize on the underlying trends in the commercial real estate services industry, which include increased outsourcing, consolidation of service providers and institutional ownership of real estate. Our strengths include the following:
| • | Global Brand and Market Leading Positions. For more than 100 years, we have built CB Richard Ellis into one of the foremost brands in the industry. We are the world’s largest commercial real estate services provider, based on 2009 revenue, and one of only three commercial real estate services companies with a global footprint. As a result of our strong brand and global footprint, large corporations, institutional owners and users of real estate recognize us as a leading provider of world-class, comprehensive real estate services. Operating under the global CB Richard Ellis brand name, we are the leader in many of the local markets in which we operate, including New York, Los Angeles, Chicago and London. |
| • | Full Service Capabilities. We provide one of the broadest ranges of first-class real estate services in the industry and provide these services in major metropolitan areas throughout the world. When combined with our extensive global reach and localized market knowledge, this full range of real estate services enables us to provide world-class service to our multi-regional and multi-national clients, as well as to maximize our revenue per client. |
| • | Strong Client Relationships and Client-tailored Service. We have forged long-term relationships with many of our clients. During the year ended December 31, 2009, our clients included nearly 80 of the Fortune 100 companies. In order to better satisfy the needs of our largest clients and to capture cross-selling opportunities, we have organized several fully-integrated client coverage teams comprised of senior management, a global relationship manager and regional and product specialists. |
| • | Attractive Business Model. Our business model features a diversified service offering and client base, recurring revenue streams, a variable cost structure, low capital requirements and a strong senior management team and workforce. |
| • | Diversified Service Offering and Client Base. Our broad service offering, global footprint and extensive client relationships provide us with a diversified revenue base. For 2009, we estimate that corporations accounted for approximately 42% of our revenue, insurance companies and banks accounted for approximately 20% of our revenue, pension funds and their advisors accounted for approximately 10% of our revenue, individuals and partnerships accounted for approximately 8% of our revenue, REITs accounted for approximately 5% of our revenue and other types of clients accounted for the remainder of our revenue. |
| • | Recurring Revenue Streams. Our years of strong local market presence have allowed us to develop significant repeat business from existing clients, including from approximately 68% of our U.S. real estate sales and leasing clients in 2009. This includes referrals associated with our contractual fee-for-services businesses, which generally involve facilities management, property management and mortgage loan servicing, as well as asset management provided by CBRE Investors. Our contractual, fee-for-service business represented approximately 43% of our 2009 revenue. |
9
Table of Contents
| • | Variable Cost Structure. Compensation is our largest expense and our sales and leasing professionals are generally paid on a commission and bonus basis, which correlates with our revenue performance. This cost structure provides us with flexibility to mitigate the negative effect on our operating margins during difficult market conditions, such as those experienced in 2008 and 2009. However, our cost structure also includes significant other operating expenses that may not correlate to our revenue performance, including office lease and information technology maintenance, insurance premiums and other support services expenses. In addition, we have a proven record of reducing fixed expenses aggressively when revenue weakens, such as we did in 2008 and 2009. |
| • | Low Capital Requirements. Our business model is structured to provide value-added services with low capital intensity. During 2009, our net capital expenditures were less than 1% of our revenue. |
| • | Strong Senior Management Team and Workforce. Our most important asset is our people. We have recruited a talented and motivated work force of approximately 29,000 employees worldwide, excluding affiliate offices, who are supported by a strong and deep senior management team consisting of a number of highly-respected executives, most of whom have over 20 years of broad experience in the real estate industry. In addition, we use equity compensation to align the interests of our senior management team with the interests of our stockholders. |
Although we believe these strengths will continue to create significant opportunities for our business, there are also risks that may impact our competitive position, which include the following:
| • | Impact of “Credit Crunch” and Capital Markets Disruption. A significant portion of our business involves the sale and financing of commercial properties. For example, during 2009, we generated approximately 12% of our revenue from investment sales. The successful completion of sale and financing transactions is dependent on the availability and cost of credit. A severe disruption in the global capital markets, such as the type that we experienced in 2008 and 2009, and the resulting decline in real estate values may adversely affect our property sales and financing businesses. |
| • | Impact of Weakening Global Economic Activity. A significant portion of our business involves the leasing of space on behalf of property owners and occupiers. For example, during 2009, we generated approximately 32% of our revenue from leasing activities. The health of leasing markets is dependent on the level of economic activity on a global, regional and local basis. A significant slowdown in overall economic activity, or a contraction of activity, such as that which occurred in the United States and Europe in 2008 and for most of 2009, may continue to adversely affect our leasing business. Economic weakness in 2009 also adversely affected our outsourcing business by curbing corporate spending on real estate facilities. |
| • | Leverage. We are highly leveraged and have significant debt service obligations. As of December 31, 2009, our total debt, excluding our notes payable on real estate and warehouse lines of credit, was approximately $2.1 billion. Our level of indebtedness and the operating and financial restrictions in our debt agreements both place constraints on the operation of our business. Although we believe that the incurrence of long-term indebtedness has been important in the development of our business, including facilitating our acquisitions of Insignia and Trammell Crow Company, the cash flow necessary to service this debt is not available for other general corporate purposes, which may limit our flexibility in planning for, or reacting to, changes in our business and in the commercial real estate services industry. We seek to mitigate this exposure both through the refinancing of debt when available on attractive terms and through selective repayment and retirement of indebtedness. For example, during the third quarter of 2009, we reached agreement with our lenders to extend maturities and amortization schedules on $985.0 million of loans outstanding under our current credit agreement. During the year ended December 31, 2009, we also repaid $432.0 million of our senior secured term loans outstanding under our credit agreement and issued $450.0 million of 11.625% senior subordinated notes due June 15, 2017. These actions, combined with the successful amendment to our credit agreement in the first quarter of 2009, have given us increased flexibility and significantly extended the weighted average maturity of our outstanding debt. |
10
Table of Contents
| • | Smaller Presence in Some Markets than our Local Competitors. Although we are the largest commercial real estate services firm in the world in terms of 2009 revenue, our relative competitive position varies significantly across service categories and geographic areas. Depending on the service, we face competition from other real estate service providers, institutional lenders, insurance companies, investment banking firms, investment managers and accounting firms, some of which may have greater financial resources than we do. Many of our competitors are local or regional firms. Although substantially smaller than we are, some of these competitors are larger on a local or regional basis or within certain service categories within these markets. |
| • | Exposure to Risks of International Operations. We conduct a significant portion of our business and employ a substantial number of people outside of the United States. During 2009, we generated approximately 39% of our revenue from operations outside the United States. Because a significant portion of our revenues are derived from operations outside the United States, we are exposed to adverse changes in exchange rates and social, political and economic risks of doing business in foreign countries, including the current global economic slowdown. |
| • | Geographic Concentration. During 2009, approximately 10% of our global revenue was generated from transactions originating in California. In addition, a significant portion of our European operations are concentrated in London and Paris. As a result, continued or future adverse economic conditions in these regions may affect us more than our competitors. |
Our Long-Term Growth Strategy
We believe we have built the premier integrated global services platform in our industry, which gives us a distinct competitive advantage. In developing this integrated global services platform during the 1990s, we acquired such entities as The Koll Company, Westmark Realty Advisors (now known as CBRE Investors), L.J. Melody & Company (now known as CBRE Capital Markets), REI Limited and Hillier Parker May & Rowden. During the 2000s, we made our largest acquisitions—Insignia and Trammell Crow Company—which added strength, expertise and resources in comprehensive outsourcing services, integrated account management and real estate development. Today, we believe that we offer the commercial real estate services industry’s most complete suite of services and that we have a leadership position in many of the top business centers around the world. Our primary business objective is to leverage this platform on a global basis in order to garner an increasing share of industry revenues relative to our competitors. We believe this will enable us to maximize our long-term cash flow, sustain our competitive advantage and increase long-term stockholder value. Our strategy to achieve these business objectives consists of several elements:
| • | Increase Revenue from Large Clients. We plan to capitalize on our client management strategy for our large clients, which is designed to provide them with a full range of services globally while maximizing our revenue per client. We deliver these services through relationship management teams that are charged with thoroughly understanding our customers’ business and real estate strategies and matching our services to the customers’ requirements. The global relationship manager is a highly seasoned professional who is focused on maximizing revenue per client and who is compensated with a salary and a performance-based bonus. The team leader is supported by salaried professionals with specialized expertise, such as marketing, financial analysis and construction, and, as needed, taps into our field-level transaction professionals for execution of client strategies. We believe this approach to client management will lead to stronger client relationships and enable us to maximize cross-selling opportunities and capture a larger share of our clients’ commercial real estate services expenditures. For example: |
| • | we generated repeat business in 2009 from approximately 68% of our U.S. real estate sales and leasing clients; |
| • | approximately 61% of our corporate services clients today purchase more than one service and, in many cases, more than two; and |
11
Table of Contents
| • | the square footage we manage for our 15 largest U.S. asset services clients has grown by approximately 455% since 2001. |
| • | Capitalize on Cross-selling Opportunities. Because we believe cross-selling represents a large growth opportunity within the commercial real estate services industry, we are committed to emphasizing this opportunity across all of our clients, services and regions. We organize dedicated teams to assist and supplement our local market professionals in the pursuit of major assignments and to foster increased cross-selling of the full range of our services. In addition, we have dedicated substantial resources and implemented several initiatives to further develop cross-selling opportunities across our platform, including our intensive training programs for sales and management professionals, a customer relationship management database and sales management principles and incentives designed to improve individual productivity. We believe our various initiatives will enable us to further penetrate local markets and better capitalize on our global platform. |
| • | Expansion through In-Fill Acquisitions. Strategic acquisitions have been and will continue to be an integral component of our growth plans. From 2005 to 2008, we completed 58 in-fill acquisitions for an aggregate purchase price of approximately $592 million. The companies we acquired were generally quality regional firms, niche specialty firms that complemented our existing platform within a region, or affiliates in which, in some cases, we held an equity interest. We believe that there are a number of other smaller firms throughout the world that may be suitable acquisition candidates for us. We expect that each of these acquisitions would generally be less than $100 million in total consideration and would add to our existing geographic and/or line of business platforms. Current market conditions have made acquisition opportunities less attractive in the short term. However, we believe acquisitions will once again serve as a growth engine, supplementing our organic growth when market conditions improve in the future. |
| • | Focus on Improving Operating Efficiency. We have been focused for several years on realizing efficiencies and service enhancements from our internal support services and functions, lowering variable expenses such as marketing, travel and entertainment, and reducing total headcount to coincide with decreased revenues. Our efforts have helped to lower operating costs, support profit margins and improve overall performance. For example, beginning in 2008 and continuing through 2009, we took aggressive actions to further improve efficiencies and contain costs in response to weakened macro market conditions. As a result of these actions, operating expenses fell by nearly 21% in 2009 compared to 2008, exceeding the 19% decline in revenue over the same period. These cost reduction efforts resulted in a significantly lower cost base. We will continue to look for ways to realize further operational efficiencies and cost savings in order to maximize our operating margins and cash flow in the future. |
Competition
We compete across a variety of business disciplines within the commercial real estate industry, including commercial property and corporate facilities management, tenant representation, property/agency leasing, property sales, valuation, real estate investment management, commercial mortgage origination and servicing, capital markets (equity and debt) solutions, development services and proprietary research. Each of the business disciplines in which we compete is highly competitive on an international, national, regional and local level. Although we are the largest commercial real estate services firm in the world in terms of 2009 revenue, our relative competitive position varies significantly across geographies, property types and services. Depending on the geography, property type or service, we face competition from other commercial real estate service providers, in-house corporate real estate departments, developers, institutional lenders, insurance companies, investment banking firms, investment managers and accounting and consulting firms, some of which may have greater financial resources than we do. Despite recent consolidation, the commercial real estate services industry remains highly fragmented. Many of our competitors are local or regional firms. Although substantially smaller than we are, some of these competitors are larger on a local or regional basis. We are also subject to competition from other large multi-national firms that have similar service competencies to ours, including Cushman & Wakefield and Jones Lang LaSalle as well as national firms such as Grubb & Ellis.
12
Table of Contents
Different factors weigh heavily in the competition for clients. In advisory services, key differentiating factors include quality service, resource depth, demonstrated track record, brand reputation, analytical skills, market knowledge, strategic thinking and creative problem-solving. These factors are also vital in outsourcing services, and are supplemented by consistency of execution across markets, economies of scale, enhanced efficiency and cost reduction strategies. In investment management and development services, the ability to enhance asset value and produce solid, consistent returns on invested capital are keys to success.
Seasonality
A significant portion of our revenue is seasonal, which can affect an investor’s ability to compare our financial condition and results of operations on a quarter-by-quarter basis. Historically, this seasonality has caused our revenue, operating income, net income and cash flows from operating activities to be lower in the first two quarters and higher in the third and fourth quarters of each year. Earnings and cash flow have historically been particularly concentrated in the fourth quarter due to investors and companies focusing on completing transactions prior to calendar year-end. This has historically resulted in lower profits or a loss in the first and second quarters, with revenue and profitability improving in each subsequent quarter.
Employees
At December 31, 2009, we had approximately 29,000 employees worldwide, excluding affiliate offices, many of which are in our outsourcing operations and are fully reimbursed by our clients. At December 31, 2009, 511 of our employees were subject to collective bargaining agreements, most of whom are on-site employees in our asset services business in the New York/New Jersey, Illinois and California areas. We believe that relations with our employees are satisfactory.
Intellectual Property
We hold various trademarks and trade names worldwide, which include the “CB Richard Ellis” name. Although we believe our intellectual property plays a role in maintaining our competitive position in a number of the markets that we serve, we do not believe we would be materially, adversely affected by expiration or termination of our trademarks or trade names or the loss of any of our other intellectual property rights other than the “CB Richard Ellis”, the “CBRE” and the “Trammell Crow” names. With respect to the CB Richard Ellis and CBRE names, we have processed and continuously maintain trademark registrations for these service marks in the United States and the CB Richard Ellis and CBRE related marks are in registration or in process in most foreign jurisdictions where we conduct significant business. We obtained our most recent U.S. trademark registrations for the CB Richard Ellis and CBRE related marks in 2005, and these registrations would expire in 2015 if we failed to renew them.
We hold a license to use the “Trammell Crow” trade name pursuant to a license agreement with CF98, L.P., an affiliate of Crow Realty Investors, L.P., d/b/a Crow Holdings, which is wholly-owned by certain descendents and affiliates of Mr. Trammell Crow. See “Risk Factors—We license the use of the Trammell Crow trade name and this license is not exclusive and may be revoked” for additional information.
In addition to trade names, we have developed proprietary technology for preparing and developing valuation reports to our clients through our valuation business and we offer proprietary research to clients through our CBRE Econometric Advisors research unit. We also offer proprietary investment structures through CBRE Investors. While we seek to secure our rights under applicable intellectual property protection laws in these and any other proprietary assets that we use in our business, we do not believe any of these other items of intellectual property are material to our business in the aggregate.
13
Table of Contents
Environmental Matters
Federal, state and local laws and regulations impose environmental liabilities, controls, disclosure rules and zoning restrictions that impact the ownership, management, development, use, or sale of commercial real estate. Certain of these laws and regulations may impose liability on current or previous real property owners or operators for the cost of investigating, cleaning up or removing contamination caused by hazardous or toxic substances at a property, including contamination resulting from above-ground or underground storage tanks at a property. If contamination occurs or is present during our role as a property or facility manager or developer, we could be held liable for such costs as a current “operator” of a property.
Such liability may be imposed without regard for the legality of the acts or omissions that caused the contamination and without regard to whether we knew of, or were responsible for, the presence of such hazardous or toxic substances, and such liability may be joint and several with any other parties that are deemed legally liable for the contamination. The operator of a site also may be liable under common law to third parties for damages and injuries resulting from exposure to hazardous substances or environmental contamination at a site, including liabilities arising from exposure to asbestos-containing materials. If the liability is joint and several, we could be responsible for payment of the full amount of the liability, whether or not any other responsible party is also liable. Under certain laws and common law principles, any failure by us to disclose environmental contamination at a property could subject us to liability to a buyer or lessee of the property. In addition, some environmental laws create a lien on a contaminated site for costs that a governmental entity incurs in connection with the contamination.
Some of the properties owned, operated or managed by us are in the vicinity of properties which are currently, or have been, the site of releases of regulated substances and remediation activity, and we are currently aware of several properties owned, operated or managed by us which may be impacted by regulated substances which may have migrated from adjacent or nearby properties or which may be within the borders of areas suspected to be impacted by regional groundwater contamination.
While we are aware of the presence or the potential presence of regulated substances in the soil or groundwater at several properties owned, operated or managed by us, which may have resulted from historical or ongoing activities on those properties, we are not aware of any material noncompliance with the environmental laws or regulations currently applicable to us, and we are not the subject of any material claim for liability with respect to contamination at any location. However, these laws and regulations may discourage sales and leasing activities and mortgage lending with respect to some properties, which may adversely affect both us and the commercial real estate services industry in general. Environmental contamination or other environmental liabilities may also negatively affect the value of commercial real estate assets held by entities that are managed by our investment management and development services businesses, which could adversely impact the results of operations of these business lines.
Availability of this Report
Our internet address is www.cbre.com. On the Investor Relations page on our Web site, we post the following filings as soon as reasonably practicable after they are electronically filed with or furnished to the Securities and Exchange Commission: our Annual Report on Form 10-K, our Quarterly Reports on Form 10-Q, our Current Reports on Form 8-K, and any amendments to those reports filed or furnished pursuant to Section 13(a) or 15(d) of the Securities Exchange Act of 1934. All such filings on our Investor Relations web page are available to be viewed on this page free of charge. Information contained on our website is not part of this Annual Report on Form 10-K or our other filings with the Securities and Exchange Commission. We assume no obligation to update or revise any forward-looking statements in the Annual Report on Form 10-K, whether as a result of new information, future events or otherwise, unless we are required to do so by law. A copy of this Annual Report on Form 10-K is available without charge upon written request to: Investor Relations, CB Richard Ellis Group, Inc., 200 Park Avenue, 17th Floor, New York, New York 10166.
14
Table of Contents
Set forth below and elsewhere in this report and in other documents we file with the Securities and Exchange Commission are risks and uncertainties that could cause our actual results to differ materially from the results contemplated by the forward-looking statements contained in this report and other public statements we make. Based on the information currently known to us, we believe that the matters discussed below identify the most significant risk factors affecting our business. However, the risks and uncertainties we face are not limited to those described below. Additional risks and uncertainties not presently known to us or that we currently believe to be immaterial may also adversely affect our business.
The success of our business is significantly related to general economic conditions and, accordingly, our business has been and could continue to be harmed by the economic slowdown and downturn in real estate asset values, property sales and leasing activities.
Periods of economic weakness or recession, significantly rising interest rates, declining employment levels, declining demand for real estate, declining real estate values, or the public perception that any of these events may occur, have negatively affected and may continue to negatively affect the performance of many of our business lines. These economic conditions have resulted in and could continue to result in a general decline in acquisition, disposition and leasing activity, as well as a general decline in the value of real estate and in rents, which in turn would reduce revenue from property management fees and brokerage commissions derived from property sales, leases and mortgage brokerage as well as revenues associated with investment management and/or development activities. In addition, these conditions have led and could continue to lead to a decline in property sales prices as well as a decline in funds invested in existing commercial real estate assets and properties planned for development. Because our development and investment strategy often entails making relatively modest investments alongside our investor clients, our ability to conduct these activities depends in part on the supply of investment capital for commercial real estate and related assets. In addition, economic downturns have reduced, and may continue to reduce, the amount of loan originations and related servicing by our commercial mortgage brokerage business.
During an economic downturn, it may also take longer for us to dispose of real estate investments or the selling prices may be lower than originally anticipated. As a result, the carrying value of our real estate investments may become impaired and we could record losses as a result of such impairment or we could experience reduced profitability related to declines in real estate values. Further, as a result of our debt level and the terms of our existing debt instruments, our exposure to adverse general economic conditions is heightened.
Recently, the availability and cost of credit, a declining real estate market (in particular, in those markets in which we have generated significant transaction revenues in the past, such as the United States) and geopolitical issues have contributed to increased volatility and diminished expectations for the economy and the markets going forward. These factors, combined with volatile oil prices, declining business and consumer confidence and increased unemployment, have precipitated an economic slowdown and a global recession. The fragility of the credit markets and the current economic environment have impacted real estate services companies like ours through liquidity restrictions, falling transaction volumes, lower real estate valuations, market volatility and fluctuations, and loss of confidence. Similar to other commercial real estate services firms, our transaction volumes fell throughout 2008 and 2009 and our stock price has declined significantly since 2007.
These negative general economic conditions could continue to reduce the overall amount of sale and leasing activity in the commercial real estate industry, and hence the demand for our services. We are unable to predict the likely duration and severity of the current disruption in financial markets and adverse economic conditions in the United States and other countries. Our revenues and profitability depend on the overall demand for our services from our clients. While it is possible that the increase in the number of distressed sales and resulting decrease in asset prices will eventually translate to greater market activity, the current overall reduction in sales transaction volume continues to materially and adversely impact our business.
15
Table of Contents
If the conditions that prevailed in the economy and the commercial real estate market in 2008 and 2009 continue for an extended period or worsen in the future, our business performance and profitability could continue to fall. If this were to occur, we could fail to comply with certain financial covenants in our credit agreement which would force us to seek an amendment with the lenders under our credit agreement, and no assurance can be given that we will be able to obtain any necessary waivers or amendments on satisfactory terms, if at all. In addition, in an extreme deterioration of our business, we could have insufficient liquidity to meet our debt service obligations when they come due in future years. If we fail to meet our payment or other obligations under our credit agreement, the lenders under the agreement will be entitled to proceed against the collateral granted to them to secure the debt owed.
Recent adverse developments in the credit markets and the risk of continued market deterioration have adversely affected and may continue to adversely affect our business, results of operations and financial condition.
Our Global Investment Management, Development Services and capital markets (including investment property sales and debt and equity financing services) businesses are sensitive to credit cost and availability as well as marketplace liquidity. Additionally, the revenues in all of our businesses are dependent to some extent on the overall volume of activity (and pricing) in the commercial real estate market. In 2008 and continuing throughout 2009, the credit markets experienced a disruption of unprecedented magnitude. This disruption has reduced the availability and significantly increased the cost of most sources of funding. In some cases, these sources have been eliminated.
Disruptions in the credit markets have adversely affected, and may continue to adversely affect, our business of providing advisory services to owners, investors and occupiers of real estate in connection with the leasing, disposition and acquisition of property. If our clients are unable to procure credit on favorable terms, there may be fewer completed leasing transactions, dispositions and acquisitions of property. In addition, if purchasers of real estate are not able to procure favorable financing resulting in the lack of disposition opportunities for our funds and projects, our Global Investment Management and Development Services businesses will be unable to generate incentive fees and we may also experience losses of co-invested equity capital if the disruption causes a permanent decline in the value of investments made.
The scope of the credit market disruption in late 2008 and early 2009 was well beyond what any market participant anticipated. While the credit market showed signs of improving in the second half of 2009, liquidity remains constrained and it is impossible to predict when the market will return to normalcy. This uncertainty may lead market participants to continue to act more conservatively than in recent history, which may amplify decreases in demand and pricing in the markets we serve.
Our debt instruments impose operating and financial restrictions on us and, in the event of a default, all of our borrowings would become immediately due and payable.
Our debt instruments, including our credit agreement, impose, and the terms of any future debt may impose, operating and other restrictions on us and many of our subsidiaries. These restrictions will affect, and in many respects will limit or prohibit, our ability and our guarantor subsidiaries’ abilities to:
| • | incur or guarantee additional indebtedness; |
| • | pay dividends or make distributions on capital stock or redeem or repurchase capital stock; |
| • | repurchase equity interests; |
| • | make investments; |
| • | create restrictions on the payment of dividends or other amounts to us; |
| • | transfer or sell assets, including the stock of subsidiaries; |
16
Table of Contents
| • | create liens; |
| • | enter into transactions with affiliates; |
| • | enter into sale/leaseback transactions; and |
| • | enter into mergers or consolidations. |
As detailed below, our credit agreement contains financial covenants that currently require us to maintain a maximum leverage ratio of Consolidated EBITDA (as defined in our credit agreement) to total debt less available cash and a minimum coverage ratio of interest. Our ability to meet these financial ratios can be affected by events beyond our control, and we cannot assure you that we will be able to meet those ratios when required. Due to the decline in Consolidated EBITDA in recent periods, and if our Consolidated EBITDA continues to decline in future periods, and we are unable to negotiate any additional amendments to our credit agreement, we may be unable to comply with the financial covenants under our credit agreement in future periods. We significantly reduced our cost structure during 2008 and further reduced costs in 2009. As a result, we were well within compliance with the minimum coverage ratio and the maximum leverage ratio in 2009. We continue to monitor our projected compliance with these financial ratios and other terms of our credit agreement.
A breach of any of these restrictive covenants or the inability to comply with the required financial ratios could result in a default under our debt instruments. If any such default occurs, the lenders under our credit agreement may elect to declare all outstanding borrowings, together with accrued interest and other fees, to be immediately due and payable. The lenders under our credit agreement also have the right in these circumstances to terminate any commitments they have to provide further borrowings. If we are unable to repay outstanding borrowings when due, the lenders under our credit agreement will have the right to proceed against the collateral granted to them to secure the debt, which collateral is described in the immediately following risk factor. If the debt under our credit agreement were to be accelerated, we cannot give assurance that this collateral would be sufficient to repay our debt.
The restrictions contained in our debt instruments could also:
| • | limit our ability to plan for or react to market conditions or meet capital needs or otherwise restrict our activities or business plans; and |
| • | adversely affect our ability to finance ongoing operations, strategic acquisitions, investments or other capital needs or to engage in other business activities that would be in our interest. |
If we fail to meet our payment or other obligations under our credit agreement, the lenders under such credit agreement could foreclose on, and acquire control of, substantially all of our assets.
Our credit agreement is jointly and severally guaranteed by us and substantially all of our domestic subsidiaries. Borrowings under our credit agreement are secured by a pledge of substantially all of the capital stock of our U.S. subsidiaries and 65% of the capital stock of certain non-U.S. subsidiaries. In addition, in connection with any amendment to our credit agreement, we may need to grant additional collateral to the lenders.
Our substantial leverage and debt service obligations could harm our ability to operate our business, remain in compliance with debt covenants and make payments on our debt.
We are highly leveraged and have significant debt service obligations. As of December 31, 2009, our total debt, excluding notes payable on real estate and warehouse lines of credit, was approximately $2.1 billion. For the year ended December 31, 2009, our interest expense was approximately $189.1 million. Our level of indebtedness increases the possibility that we may be unable to generate cash sufficient to pay when due the principal of, interest on or other amounts due in respect of our indebtedness. In addition, we may incur additional
17
Table of Contents
debt from time to time to finance strategic acquisitions, investments, joint ventures or for other purposes, subject to the restrictions contained in the documents governing our indebtedness. If we incur additional debt, the risks associated with our leverage, including our ability to service our debt, would increase. If we are required to seek an amendment to our credit agreement, our debt service obligations may be substantially increased.
Our debt could have other important consequences, which include, but are not limited to, the following:
| • | we could be required to use a substantial portion of our cash flow from operations to pay principal and interest on our debt; |
| • | our interest expense could increase if interest rates increase because the loans under our credit agreement bear interest at floating rates; |
| • | our leverage could increase our vulnerability to general economic downturns and adverse competitive and industry conditions, placing us at a disadvantage compared to those of our competitors that are less leveraged; |
| • | our debt service obligations could limit our flexibility in planning for, or reacting to, changes in our business and in the commercial real estate services industry; |
| • | our failure to comply with the financial and other restrictive covenants in the documents governing our indebtedness, which, among other things, require us to maintain specified financial ratios and limit our ability to incur additional debt and sell assets, could result in an event of default that, if not cured or waived, results in foreclosure on substantially all of our assets; and |
| • | our level of debt may restrict us from raising additional financing on satisfactory terms to fund working capital, strategic acquisitions, investments, joint ventures and other general corporate requirements. |
From time to time, Moody’s Investors Service, Inc. and Standard & Poor’s Ratings Services, a division of The McGraw-Hill Companies, Inc. rate our significant outstanding debt. These ratings and any downgrades thereof may impact our ability to borrow under any new agreements in the future, as well as the interest rates and other terms of any future borrowings, and could also cause a decline in the market price of our Class A common stock.
We cannot be certain that our earnings will be sufficient to allow us to pay principal and interest on our debt and meet our other obligations. If we do not have sufficient earnings, we may be required to seek to refinance all or part of our existing debt, sell assets, borrow more money or sell more securities, none of which we can guarantee that we will be able to do and which, if accomplished, may adversely impact our stock price.
We have limited restrictions on the amount of additional recourse debt we are able to incur, which may intensify the risks associated with our leverage, including our ability to service our indebtedness.
Subject to the maximum amounts of indebtedness permitted by our credit agreement covenants, we are not restricted in the amount of additional recourse debt we are able to incur in connection with the financing of our development activities, and we may in the future incur such indebtedness in order to decrease the amount of equity we invest in these activities. Subject to certain covenants in our various bank credit agreements, we are also not restricted in the amount of additional recourse debt CBRE Capital Markets may incur in connection with funding loan originations for multi-family properties having prior purchase commitments by a government sponsored entity.
The deteriorating financial condition and/or results of operations of certain of our clients could adversely affect our business.
We could be adversely affected by the actions and deteriorating financial condition and results of operations of certain of our clients. Our clients include companies in the financial services industry, including commercial
18
Table of Contents
banks, investment banks and insurance companies, as well as the automobile industry. Defaults or non-performance by, or even rumors or questions about, one or more financial services institutions, or the financial services industry generally, have led to market-wide liquidity problems and could lead to losses or defaults by one or more of our clients, which in turn, could have a material adverse effect on our results of operations and financial condition.
Any of our clients may experience a downturn in its business that may weaken its results of operations and financial condition. As a result, a client may fail to make payments when due, become insolvent or declare bankruptcy. For example, in 2008, a significant customer of our outsourcing business, Washington Mutual, was seized by federal regulators and sold to JPMorgan Chase Bank, N.A. Any client bankruptcy or insolvency, or the failure of any client to make payments when due could result in material losses to our company. In particular, if any of our significant clients becomes insolvent or suffers a downturn in its business, it may seriously harm our business. Bankruptcy filings by or relating to one of our clients could bar us from collecting pre-bankruptcy debts from that client. A client bankruptcy would delay our efforts to collect past due balances and could ultimately preclude full collection of these amounts. Any unsecured claim we hold against a bankrupt entity may be paid only to the extent that funds are available and only in the same percentage as is paid to all other holders of unsecured claims. We may recover substantially less than the full value of any unsecured claims in the event of the bankruptcy of a large client, which would adversely impact our financial condition. We expect that the continuing weakness in the global economy will put additional financial stress on clients, which may in turn negatively impact our ability to collect our receivables fully or in a timely manner.
Additionally, while no individual client accounted for more than approximately 3% of our revenues on a global basis in 2009, certain corporate services and property management client agreements require that we advance payroll and other vendor costs on behalf of clients. If such a client were to file bankruptcy or otherwise fail, we may not be able to obtain reimbursement for those costs or for the severance obligations we would incur as a result of the loss of the client.
Our goodwill and other intangible assets could become further impaired, which may require us to take significant non-cash charges against earnings.
Under current accounting guidelines, we must assess, at least annually and potentially more frequently, whether the value of our goodwill and other intangible assets has been impaired. Any impairment of goodwill or other intangible assets as a result of such analysis would result in a non-cash charge against earnings, which charge could materially adversely affect our reported results of operations and our stock price. Due to the continuing economic uncertainty and credit crisis, we determined in December 2008 that the negative impact of the current global economic slowdown and resulting decline in our stock price represented an adverse change in our business climate, requiring us to undertake an interim evaluation of our goodwill and other intangible assets for impairment. During the year ended December 31, 2008, we incurred charges of $1.2 billion in connection with the impairment of goodwill and other non-amortizable intangible assets. We did not record any impairment charges related to goodwill and other non-amortizable intangible assets during the year ended December 31, 2009. As of December 31, 2009, our recorded goodwill was approximately $1.3 billion; our other intangible assets, net of accumulated amortization, was approximately $323 million; and our total CB Richard Ellis Group, Inc. stockholders’ equity was approximately $629 million. As of December 31, 2009, our book value per share was $1.96. A significant and sustained decline in our future cash flows, a significant further adverse change in the economic environment, slower growth rates or if our stock price falls below our net book value per share for a sustained period, all could result in the need to perform additional impairment analysis in future periods. If we were to conclude that a future write-down of goodwill or other intangible assets is necessary, then we would record such additional charges, which could materially adversely affect our results of operations.
Our success depends upon the retention of our senior management, as well as our ability to attract and retain qualified and experienced employees (including those acquired through acquisitions).
Our continued success is highly dependent upon the efforts of our executive officers and other key employees, including Brett White, our Chief Executive Officer and President. Mr. White and certain other key
19
Table of Contents
employees are not parties to employment agreements with us. We also are highly dependent upon the retention of our property sales and leasing professionals, who generate a significant majority of our revenues, as well as other revenue producing professionals. The departure of any of our key employees (including those acquired through acquisitions), or the loss of a significant number of key revenue producers, if we are unable to quickly hire and integrate qualified replacements, could cause our business, financial condition and results of operations to suffer. In addition, the growth of our business is largely dependent upon our ability to attract and retain qualified support personnel in all areas of our business, including brokerage and property management personnel. Competition for these personnel is intense and we may not be able to successfully recruit, integrate or retain sufficiently qualified personnel. We use equity incentives to retain and incentivize our key personnel. In 2008 and continuing throughout 2009, our stock price declined significantly, resulting in the decline in value of our previously provided equity incentives, which may result in an increased risk of loss of these key personnel. If we are unable to attract and retain these qualified personnel, our growth may be limited and our business and operating results could suffer.
Our international operations subject us to social, political and economic risks of doing business in foreign countries.
We conduct a significant portion of our business and employ a substantial number of people outside of the United States and as a result, we are subject to risks associated with doing business globally. During 2009, we generated approximately 39% of our revenue from operations outside the United States. Circumstances and developments related to international operations that could negatively affect our business, financial condition or results of operations include, but are not limited to, the following factors:
| • | difficulties and costs of staffing and managing international operations in certain regions; |
| • | currency restrictions, which may prevent the transfer of capital and profits to the United States; |
| • | unexpected changes in regulatory requirements; |
| • | potentially adverse tax consequences; |
| • | the responsibility of complying with multiple and potentially conflicting laws, e.g., with respect to corrupt practices, employment and licensing; |
| • | the impact of regional or country-specific business cycles and economic instability; |
| • | the geographic, language and cultural differences among personnel in different areas of the world; |
| • | greater difficulty in collecting accounts receivable in some geographic regions such as Asia, where many countries have underdeveloped insolvency laws and clients are often slow to pay, and in some European countries, where clients also tend to delay payments; |
| • | political instability; and |
| • | foreign ownership restrictions with respect to operations in countries such as China. |
Although we maintain an anti-corruption compliance program throughout the company, violations of our compliance program may result in criminal or civil sanctions, including material monetary fines, penalties and other costs against us or our employees, and may have a material adverse effect on our business.
We have committed additional resources to expand our worldwide sales and marketing activities, to globalize our service offerings and products in selected markets and to develop local sales and support channels. If we are unable to successfully implement these plans, maintain adequate long-term strategies that successfully manage the risks associated with our global business or adequately manage operational fluctuations, our business, financial condition or results of operations could be harmed.
In addition, our international operations and, specifically, the ability of our non-U.S. subsidiaries to dividend or otherwise transfer cash, including transfers of cash to pay interest and principal on our debt, may be affected by currency exchange control regulations, transfer pricing regulations and potentially adverse tax consequences, among other things.
20
Table of Contents
Our revenue and earnings may be adversely affected by foreign currency fluctuations.
Our revenue from non-U.S. operations is denominated primarily in the local currency where the associated revenue was earned. During 2009, approximately 39% of our revenue was transacted in currencies of foreign countries, the majority of which included the Euro, the British pound sterling, the Canadian dollar, the Hong Kong dollar, the Japanese yen, the Singapore dollar, the Australian dollar and the Indian rupee. Thus, we may experience fluctuations in revenues and earnings because of corresponding fluctuations in foreign currency exchange rates.
We have made significant acquisitions of non-U.S. companies and we may acquire additional foreign companies in the future. As we increase our foreign operations, fluctuations in the value of the U.S. dollar relative to the other currencies in which we may generate earnings could adversely affect our business, financial condition and operating results. Due to the constantly changing currency exposures to which we are subject and the volatility of currency exchange rates, we cannot predict the effect of exchange rate fluctuations upon future operating results. In addition, fluctuations in currencies relative to the U.S. dollar may make it more difficult to perform period-to-period comparisons of our reported results of operations.
From time to time, our management uses currency hedging instruments, including foreign currency forward and option contracts and borrows in foreign currencies. Economic risks associated with these hedging instruments include unexpected fluctuations in inflation rates, which impact cash flow and unexpected changes in the underlying net asset position.
Our growth has benefited significantly from acquisitions, which may not be available in the future.
A significant component of our growth has occurred through acquisitions, including our acquisition of Insignia in July 2003 and our acquisition of Trammell Crow Company in December 2006. Any future growth through acquisitions will be partially dependent upon the continued availability of suitable acquisition candidates at favorable prices and upon advantageous terms and conditions, which may not be available to us, as well as sufficient liquidity and credit to fund these acquisitions. In addition, acquisitions involve risks that business judgments concerning the value, strengths and weaknesses of businesses acquired will prove incorrect. Future acquisitions and any necessary related financings also may involve significant transaction-related expenses. For example, through December 31, 2009, we incurred $200.9 million of transaction-related expenditures in connection with our acquisition of Insignia in 2003 and $196.6 million of transaction-related expenditures in connection with our acquisition of Trammell Crow Company in 2006. Transaction-related expenditures include severance costs, lease termination costs, transaction costs, deferred financing costs and merger-related costs, among others. We incurred our final transaction expenditures with respect to the Insignia acquisition in the third quarter of 2004 and the Trammell Crow Company acquisition in the fourth quarter of 2007.
If we acquire companies in the future, we may experience integration costs and the acquired businesses may not perform as we expect.
We have had, and may continue to experience, difficulties in integrating operations and accounting systems acquired from other companies. These challenges include the diversion of management’s attention from other business concerns and the potential loss of our key employees or those of the acquired operations. We believe that most acquisitions will initially have an adverse impact on operating and net income. Acquisitions also frequently involve significant costs related to integrating information technology, accounting and management services and rationalizing personnel levels. In connection with the Insignia acquisition, we have incurred $41.9 million of expenses through December 31, 2009, which are related to the integration of Insignia’s business lines, as well as accounting and other systems, into our own. Additionally, through December 31, 2009, we have incurred $58.6 million of integration expenses associated with the acquisition of Trammell Crow Company.
21
Table of Contents
If we are unable to fully integrate the accounting and other systems of the businesses we acquire, we may not be able to effectively manage them. Moreover, the integration process itself may be disruptive to our business as it requires coordination of geographically diverse organizations and implementation of new accounting and information technology systems.
If the properties that we manage fail to perform, then our financial condition and results of operations could be harmed.
The revenue we generate from our asset services line of business is generally a percentage of aggregate rent collections from properties, although many management agreements provide for a specified minimum management fee. Accordingly, our success partially depends upon the performance of the properties we manage. The performance of these properties will depend upon the following factors, among others, many of which are partially or completely outside of our control:
| • | our ability to attract and retain creditworthy tenants; |
| • | the magnitude of defaults by tenants under their respective leases; |
| • | our ability to control operating expenses; |
| • | governmental regulations, local rent control or stabilization ordinances which are in, or may be put into, effect; |
| • | various uninsurable risks; |
| • | financial conditions prevailing generally and in the areas in which these properties are located; |
| • | the nature and extent of competitive properties; and |
| • | the real estate market generally. |
Our real estate investment and co-investment activities subject us to real estate investment risks which could cause fluctuations in earnings and cash flow.
An important part of the strategy for our Global Investment Management business involves investing our capital in certain real estate investments with our clients. As of December 31, 2009, we had committed $34.9 million to fund future co-investments, all of which is expected to be funded during 2010. In addition to required future capital contributions, some of the co-investment entities may request additional capital from us and our subsidiaries holding investments in those assets, and the failure to provide these contributions could have adverse consequences to our interests in these investments. These adverse consequences could include damage to our reputation with our co-investment partners and clients, as well as the necessity of obtaining alternative funding from other sources that may be on disadvantageous terms for us and the other co-investors. Providing co-investment financing is a very important part of our Global Investment Management business, which would suffer if we were unable to make these investments. Although our debt instruments contain restrictions that limit our ability to provide capital to the entities holding direct or indirect interests in co-investments, we may provide this capital in many instances.
Selective investment in real estate projects is an important part of our Development Services business strategy and there is an inherent risk of loss of our investment. As of December 31, 2009, we had approximately 60 consolidated real estate projects with invested equity of $40.7 million and $3.5 million of notes payable on real estate that are recourse to us (in addition to being recourse to the single-purpose entity that holds the real estate asset and is the primary obligor on the note payable). In addition, at December 31, 2009, we were involved as a principal (in most cases, co-investing with our clients) in approximately 40 unconsolidated real estate subsidiaries with invested equity of $24.0 million and had committed additional capital to these unconsolidated subsidiaries of $25.6 million. We also guaranteed notes payable of these unconsolidated subsidiaries of $2.0 million, excluding guarantees for which we have outstanding liabilities accrued on our consolidated balance sheet.
22
Table of Contents
During the ordinary course of our Development Services business, we provide numerous completion and budget guarantees relating to development projects. Each of these guarantees requires us to complete the relevant project within a specified timeframe and/or within a specified budget, with us potentially being liable for costs to complete in excess of such timeframe or budget. While we generally have “guaranteed maximum price” contracts with reputable general contractors with respect to projects for which we provide these guarantees (which are intended to pass most of the risk to such contractors), there can be no assurance that we will not have to perform under any such guarantees. If we are required to perform under a significant number of such guarantees, it could harm our business, results of operations and financial condition.
Because the disposition of a single significant investment can impact our financial performance in any period, our real estate investment activities could increase fluctuations in our net earnings and cash flow. In many cases, we have limited control over the timing of the disposition of these investments and the recognition of any related gain or loss. The current economic environment has further reduced opportunities for disposition of these investments. Risks associated with these activities include, but are not limited to, the following:
| • | losses from investments; |
| • | difficulties associated with international co-investments described in “—Our international operations subject us to social, political and economic risks of doing business in foreign countries” and “—Our revenue and earnings may be adversely affected by foreign currency fluctuations;” and |
| • | potential lack of control over the disposition of any co-investments and the timing of the recognition of gains, losses or potential incentive participation fees. |
Poor performance of the investment programs that our Global Investment Management business manages would cause a decline in our revenue, net income and cash flow and could adversely affect our ability to raise capital for future programs.
In the event that any of the investment programs that our Global Investment Management business manages were to perform poorly, our revenue, net income and cash flow could decline because the value of the assets we manage would decrease, which would result in a reduction in some of our management fees, and our investment returns would decrease, resulting in a reduction in the incentive compensation we earn. Moreover, we could experience losses on co-investments of our own capital in such programs as a result of poor performance. Investors and potential investors in our programs continually assess our performance, and our ability to raise capital for existing and future programs will depend on our continued satisfactory performance. Poor performance could make it more difficult for us to raise new capital and maintain our current fee structure.
We are subject to substantial litigation risks and may face significant liabilities and damage to our professional reputation as a result of litigation allegations and negative publicity.
The investment decisions we make in our Global Investment Management business and the activities of our investment professionals on behalf of our clients may subject them and us to the risk of third-party litigation arising from investor dissatisfaction with the performance of our programs and a variety of other litigation claims, including allegations that we improperly exercised judgment, discretion, control or influence over client investments or that we breached fiduciary duties to clients.
To the extent investors in our programs suffer losses resulting from fraud, gross negligence, willful misconduct or other similar misconduct, investors may have remedies against us, our investment programs or funds or our employees under the federal securities law and state law. Moreover, we are exposed to risks of litigation or investigation by investors and regulators relating to our having engaged in transactions that presented conflicts of interest that were not properly addressed.
If any lawsuits were brought against us and resulted in a finding of substantial legal liability, whether or not the lawsuit had merit, it could materially, adversely affect our business, financial condition or results of operations or cause significant reputational harm to us, which could materially impact our business. We depend
23
Table of Contents
on our business relationships and our reputation for integrity and high-caliber professional services to attract and retain clients across our overall business, as well as investors for our Global Investment Management business. As a result, allegations by private litigants or regulators of improper conduct by us, whether the ultimate outcome is favorable or unfavorable to us, as well as negative publicity and press speculation about us or our investment activities, whether or not valid, may harm our reputation and damage our business prospects both in our Global Investment Management business and our other global businesses.
Our joint venture activities involve unique risks that are often outside of our control which, if realized, could harm our business.
We have utilized joint ventures for commercial investments and local brokerage and other affiliations both in the United States and internationally, and although we currently have no specific plans to do so, we may acquire minority interests in other joint ventures in the future. In many of these joint ventures, we may not have the right or power to direct the management and policies of the joint ventures and other participants may take action contrary to our instructions or requests and against our policies and objectives. In addition, the other participants may become bankrupt or have economic or other business interests or goals that are inconsistent with ours. If a joint venture participant acts contrary to our interest, it could harm our business, results of operations and financial condition.
We have numerous significant competitors and potential future competitors, some of which may have greater financial and operational resources than we do.
We compete across a variety of business disciplines within the commercial real estate services industry, including investment management, tenant representation, corporate services, construction and development management, property management, agency leasing, valuation and commercial mortgage brokerage. With respect to each of our business disciplines, we cannot give assurance that we will be able to continue to compete effectively or maintain our current fee arrangements or margin levels or that we will not encounter increased competition. Each of the business disciplines in which we compete is highly competitive on an international, national, regional and local level. Although we are the largest commercial real estate services firm in the world in terms of 2009 revenue, our relative competitive position varies significantly across product and service categories and geographic areas. Depending on the product or service, we face competition from other real estate service providers, in-house corporate real estate departments, developers, institutional lenders, insurance companies, investment banking firms, investment managers, and accounting and consulting firms, some of which may have greater financial resources than we do. In addition, future changes in laws could lead to the entry of other competitors, such as financial institutions. Many of our competitors are local or regional firms. Although substantially smaller than us, some of these competitors are larger on a local or regional basis. We are also subject to competition from other large national and multi-national firms that have similar service competencies to ours. There has been a significant increase in recent years in real estate ownership by REITs, many of which self-manage most of their real estate assets. Continuation of this trend could shrink the asset base available to be managed by third-party service providers and thereby decrease the demand for our services. In general, there can be no assurance that we will be able to compete effectively, to maintain current fee levels or margins, or maintain or increase our market share.
A significant portion of our operations are concentrated in California and our business could be harmed due to the ongoing economic downturn in the California real estate markets.
During 2009 and 2008, approximately 10% of our revenue was generated from transactions originating in California. As a result of the geographic concentration in California, the current economic downturn in the California commercial real estate market and in the local economies in San Diego, Los Angeles and Orange County could harm our results of operations. Negative conditions in these or other significant commercial real estate submarkets could disproportionately affect our business as compared to competitors who have less or different geographic concentrations.
24
Table of Contents
Our results of operations vary significantly among quarters during each calendar year, which makes comparisons of our quarterly results difficult.
A significant portion of our revenue is seasonal. Historically, this seasonality has caused our revenue, operating income, net income and cash flow from operating activities to be lower in the first two quarters and higher in the third and fourth quarters of each year. The concentration of earnings and cash flow in the fourth quarter is due to an industry-wide focus on completing transactions toward the fiscal year-end. This has historically resulted in lower profits or a loss in the first and second quarters, with profits growing (or losses decreasing) in each subsequent quarter. This variance among quarters during each calendar year makes comparison between such quarters difficult, but does not generally affect the comparison of the same quarters during different calendar years.
We license the use of the Trammell Crow trade name and this license is not exclusive and may be revoked.
We have a license agreement with an affiliate of Crow Holdings that allows us to use the name “Trammell Crow” perpetually throughout the world in any business except the residential real estate business, although we can use this name in serving certain mixed-use properties or in providing investment sales brokerage services to buyers and sellers of multi-family residential facilities. This license can be revoked if we fail to maintain certain quality standards or infringe upon certain of the licensor’s intellectual property rights. If we lose the right to use the Trammell Crow name, our Development Services business could suffer significantly.
The license agreement permits certain existing uses of the name “Trammell Crow” by affiliates of Crow Holdings. The use of the Trammell Crow name or other similar names by other parties may create confusion or reduce the value associated with the Trammell Crow name.
If we fail to comply with laws and regulations applicable to us in our role as a real estate broker, mortgage broker, property/facility manager or developer, we may incur significant financial penalties.
We are subject to numerous federal, state, local and non-U.S. laws and regulations specific to the services we perform in our business, as well as laws of broader applicability, such as tax, securities and employment laws. Brokerage of real estate sales and leasing transactions and the provision of property management and valuation services require us to maintain applicable licenses in each U.S. state in which we perform these services. If we fail to maintain our licenses or conduct these activities without a license, or violate any of the regulations covering our licenses, we may be required to pay fines (including treble damages in certain states) or return commissions received or have our licenses suspended or revoked. In addition, our indirect wholly-owned subsidiary, CBRE Investors, is subject to laws and regulations as a registered investment advisor and compliance failures or regulatory action could adversely affect our business. As the size and scope of commercial real estate transactions have increased significantly during the past several years, both the difficulty of ensuring compliance with numerous state licensing regimes and the possible loss resulting from non-compliance have increased. Furthermore, the laws and regulations applicable to our business, both within and outside of the United States, also may change in ways that increase the costs of compliance.
We may have liabilities in connection with real estate brokerage and property management activities.
As a licensed real estate broker, we and our licensed employees are subject to regulatory due diligence, disclosure and standard-of-care obligations. Failure to fulfill these obligations could subject us or our employees to litigation from parties who purchased, sold or leased properties that we or they brokered or managed. We could become subject to claims by participants in real estate sales, as well as building owners and companies for whom we provide management services, claiming that we did not fulfill our regulatory and fiduciary obligations.
In addition, in our property management business, we hire and supervise third-party contractors to provide construction and engineering services for our managed properties. While our role is limited to that of an agent for
25
Table of Contents
the owner, we may be subject to claims for construction defects or other similar actions. Adverse outcomes of real estate brokerage or property management litigation could negatively impact our business, financial condition or results of operations.
We may be subject to environmental liability as a result of our role as a property or facility manager or developer of real estate.
Various laws and regulations impose liability on real property owners or operators for the cost of investigating, cleaning up or removing contamination caused by hazardous or toxic substances at a property. In our role as a property or facility manager or developer, we could be held liable as an operator for such costs. This liability may be imposed without regard to the legality of the original actions and without regard to whether we knew of, or were responsible for, the presence of the hazardous or toxic substances. Liability under some of these laws may be joint and several, meaning that one liable party could be held responsible for all costs related to a contaminated site despite the existence of other liable parties. If we fail to disclose environmental issues, we could also be liable to a buyer or lessee of a property. In addition, some environmental laws create a lien on the contaminated site in favor of the government for damages and costs incurred in connection with the contamination. If we incur any such liability, our business could suffer significantly as it could be difficult for us to develop or sell such properties, or borrow funds using such properties as collateral. Additionally, liabilities incurred to comply with more stringent future environmental requirements could adversely affect any or all of our lines of business.
Forward-Looking Statements
This Annual Report on Form 10-K includes forward-looking statements within the meaning of Section 27A of the Securities Act of 1933 and Section 21E of the Securities Exchange Act of 1934. The words “anticipate,” “believe,” “could,” “should,” “propose,” “continue,” “estimate,” “expect,” “intend,” “may,” “plan,” “predict,” “project,” “will” and similar terms and phrases are used in this Annual Report on Form 10-K to identify forward-looking statements. These statements relate to analyses and other information based on forecasts of future results and estimates of amounts not yet determinable. These statements also relate to our future prospects, developments and business strategies.
These forward-looking statements are made based on our management’s expectations and beliefs concerning future events affecting us and are subject to uncertainties and factors relating to our operations and business environment, all of which are difficult to predict and many of which are beyond our control. These uncertainties and factors could cause our actual results to differ materially from those matters expressed in or implied by these forward-looking statements.
The following factors are among those, but are not only those, that may cause actual results to differ materially from the forward-looking statements:
| • | disruptions in general economic and business conditions, particularly in geographies where our business may be concentrated, such as the recessions currently being experienced in the United States and many European and Asian economies; |
| • | the continued volatility and disruption of the capital and credit markets, interest rate increases, the cost and availability of capital for investment in real estate, clients’ willingness to make real estate or long-term contractual commitments and other factors impacting the value of real estate assets; |
| • | increases in unemployment and general slowdowns in commercial activity; |
| • | our leverage and ability to refinance existing indebtedness or incur additional indebtedness; |
| • | an increase in our debt service obligations; |
| • | our ability to generate a sufficient amount of cash from operations to satisfy working capital requirements and to service our existing and future indebtedness; |
26
Table of Contents
| • | our ability to reduce debt and achieve cash interest savings; |
| • | our ability to comply with the financial ratio covenants under our credit agreement; |
| • | the impairment or weakened financial condition of certain of our clients; |
| • | client actions to restrain project spending and reduce outsourced staffing levels as well as the potential loss of clients in our outsourcing business due to consolidation or bankruptcies; |
| • | the impairment of our goodwill and other intangible assets as a result of business deterioration or our stock price falling; |
| • | our ability to achieve estimated cost savings in connection with our existing or future cost reduction plans and achieve improvements in operating efficiency; |
| • | our ability to diversify our revenue model to offset cyclical economic trends in the commercial real estate industry; |
| • | foreign currency fluctuations; |
| • | adverse changes in the securities markets; |
| • | our ability to retain our senior management and attract and retain qualified and experienced employees; |
| • | our ability to attract new user and investor clients; |
| • | our ability to retain major clients and renew related contracts; |
| • | a reduction by companies in their reliance on outsourcing for their commercial real estate needs, which would impact our revenues and operating performance; |
| • | changes in the key components of revenue growth for large commercial real estate services companies, including consolidation of client accounts and increasing levels of institutional ownership of commercial real estate; |
| • | trends in use of large, full-service commercial real estate providers; |
| • | trends in pricing for commercial real estate services; |
| • | changes in tax laws in the United States or in other jurisdictions in which our business may be concentrated that reduce or eliminate deductions or other tax benefits we receive; |
| • | our ability to maximize cross-selling opportunities; |
| • | diversification of our client base; |
| • | our ability to compete globally, or in specific geographic markets or business segments that are material to us; |
| • | changes in social, political and economic conditions in the foreign countries in which we operate; |
| • | our ability to comply with multiple and potentially conflicting laws, e.g., with respect to corrupt practices, employment and licensing; |
| • | our ability to manage fluctuations in net earnings and cash flow, which could result from poor performance in our investment programs, including our participation as a principal in real estate investments; |
| • | variability in our results of operations among quarters; |
| • | future acquisitions may not be available at favorable prices or upon advantageous terms and conditions; |
| • | costs relating to the acquisition of businesses we may acquire could be higher than anticipated; |
| • | integration issues arising out of our acquisition of companies, including our ability to improve operating efficiencies as much as anticipated; |
27
Table of Contents
| • | our ability to leverage our global services platform to maximize and sustain long-term cash flow; |
| • | our ability to comply with the laws and regulations applicable to real estate brokerage and mortgage transactions; |
| • | our exposure to liabilities in connection with real estate brokerage and property management activities; |
| • | the failure of properties managed by us, or owned by our investment programs, to perform as anticipated; |
| • | reputational harm resulting from losses in our investment management business and related litigation; |
| • | the success of our co-investment and joint venture activities; |
| • | the failure of our Global Investment Management segment to comply with applicable laws and regulations governing its role as a registered investment advisor; |
| • | the ability of our Global Investment Management segment to realize values in investment funds sufficient to offset incentive compensation expense related thereto; |
| • | our ability to sufficiently protect our intellectual property, including protection of our global brand; |
| • | liabilities under guarantees, or for construction defects, that we incur in our Development Services business; |
| • | the ability of CBRE Capital Markets to periodically amend, or replace, on satisfactory terms the agreements for its warehouse lines of credit; |
| • | the effect of implementation of new tax and accounting rules and standards; and |
| • | the other factors described elsewhere in our current Annual Report on Form 10-K, included under the headings “Management’s Discussion and Analysis of Financial Condition and Results of Operations—Critical Accounting Policies” and “Quantitative and Qualitative Disclosures About Market Risk.” |
Forward-looking statements speak only as of the date the statements are made. You should not put undue reliance on any forward-looking statements. We assume no obligation to update forward-looking statements to reflect actual results, changes in assumptions or changes in other factors affecting forward-looking information, except to the extent required by applicable securities laws. If we do update one or more forward-looking statements, no inference should be drawn that we will make additional updates with respect to those or other forward-looking statements. Additional information concerning these and other risks and uncertainties is contained in our other periodic filings with the Securities and Exchange Commission.
Item 1B. Unresolved Staff Comments
Not applicable.
We occupied the following offices, excluding affiliates, as of December 31, 2009:
| Location |
Sales Offices | Corporate Offices | Total | |||
| Americas |
147 | 2 | 149 | |||
| Europe, Middle East and Africa (EMEA) |
87 | 1 | 88 | |||
| Asia Pacific |
81 | 1 | 82 | |||
| Total |
315 | 4 | 319 | |||
28
Table of Contents
Many of our offices that contain employees of our Global Investment Management or our Development Services segments also contain employees of our other segments. As a result, if we listed all offices of our Global Investment Management and Development Services segments, it would be duplicative. Accordingly, we have grouped our offices by geographic region above to avoid duplication.
In general, these leased offices are fully utilized. The most significant terms of the leasing arrangements for our offices are the length of the lease and the rent. Our leases have terms varying in duration. The rent payable under our office leases varies significantly from location to location as a result of differences in prevailing commercial real estate rates in different geographic locations. Our management believes that no single office lease is material to our business, results of operations or financial condition. In addition, we believe there is adequate alternative office space available at acceptable rental rates to meet our needs, although adverse movements in rental rates in some markets may negatively affect our profits in those markets when we enter into new leases. We do not own any offices, which is consistent with our strategy to lease instead of own.
We are a party to a number of pending or threatened lawsuits arising out of, or incident to, our ordinary course of business. Our management believes that any liability imposed on us that may result from disposition of these lawsuits will not have a material effect on our business, consolidated financial position, cash flows or results of operations.
As a result of an internal review that began in the first quarter of 2010 and is ongoing, we have determined that some of our employees in certain of our offices in China have made payments in violation of company policy to local governmental officials, including payments for non-business entertainment and in the form of gifts. The payments we have discovered to date are limited in number, minor in amount and we believe relate to only a few discrete transactions involving immaterial revenues. Nonetheless, we believe that the payments may have been in violation of the U.S. Foreign Corrupt Practices Act or other applicable laws. Consequently, we voluntarily disclosed these events to the U.S. Department of Justice (DOJ) and the Securities and Exchange Commission (SEC) on February 27, 2010 and have agreed to update the DOJ and the SEC periodically regarding further developments. We have engaged outside counsel to further investigate these events and we are implementing thorough remedial measures. As a result of these findings, we may be subject to consequences that could include fines, penalties and other costs, and our reputation and business may be impacted. However, we currently do not believe these consequences are reasonably likely to have a material adverse effect on our business, results of operations or financial condition.
29
Table of Contents
Item 5. Market for Registrant’s Common Equity, Related Stockholder Matters and Issuer Purchases of Equity Securities
Stock Price Information
Our Class A common stock has traded on the New York Stock Exchange under the symbol “CBG” since June 10, 2004. The applicable high and low prices of our Class A common stock for the last two fiscal years, as reported by the New York Stock Exchange, are set forth below for the periods indicated and adjusted for our stock split.
| Price Range | ||||||
| Fiscal Year 2009 |
High | Low | ||||
| Quarter ending March 31, 2009 |
$ | 5.40 | $ | 2.34 | ||
| Quarter ending June 30, 2009 |
$ | 9.87 | $ | 3.75 | ||
| Quarter ending September 30, 2009 |
$ | 13.14 | $ | 7.61 | ||
| Quarter ending December 31, 2009 |
$ | 14.14 | $ | 9.98 | ||
| Fiscal Year 2008 |
||||||
| Quarter ending March 31, 2008 |
$ | 23.17 | $ | 15.23 | ||
| Quarter ending June 30, 2008 |
$ | 24.50 | $ | 19.00 | ||
| Quarter ending September 30, 2008 |
$ | 21.00 | $ | 11.49 | ||
| Quarter ending December 31, 2008 |
$ | 13.24 | $ | 3.00 | ||
The closing share price for our Class A common stock on December 31, 2009, as reported by the New York Stock Exchange, was $13.57. As of February 12, 2010, there were 352 stockholders of record of our Class A common stock.
Dividend Policy
We have not declared or paid any cash dividends on any class of our common stock since our inception on February 20, 2001, and we do not anticipate declaring or paying any cash dividends on our common stock for the foreseeable future. We currently intend to retain any future earnings to reduce debt and finance future growth. Any future determination to pay cash dividends will be at the discretion of our board of directors and will depend on our financial condition, results of operations, capital requirements and other factors that the board of directors deems relevant. In addition, our ability to declare and pay cash dividends is restricted by the credit agreement governing our revolving credit facility and senior secured term loan facilities.
Recent Sales of Unregistered Securities
None.
Equity Compensation Plan Information
The following table summarizes information about our equity compensation plans as of December 31, 2009. All outstanding awards relate to our Class A common stock.
| Plan category |
Number of Securities to be Issued upon Exercise of Outstanding Options, Warrants and Rights (1) (a) |
Weighted-average Exercise Price of Outstanding Options, Warrants and Rights (1) (b) |
Number of Securities Remaining Available for Future Issuance under Equity Compensation Plans (Excluding Securities Reflected in Column (a)) (2) (c) |
|||||
| Equity compensation plans approved by security holders (1) |
8,861,444 | $ | 6.03 | 6,650,176 | (2) | |||
| Equity compensation plans not approved by security holders |
— | — | — | |||||
| Total |
8,861,444 | $ | 6.03 | 6,650,176 | ||||
30
Table of Contents
| (1) | Consists of stock options and restricted stock units in our Second Amended and Restated 2004 Stock Incentive Plan (the “2004 Stock Incentive Plan”) and our 2001 Stock Incentive Plan (no further awards may be issued under our 2001 Stock Incentive Plan, which was terminated in June 2004 in connection with the adoption of the 2004 Stock Incentive Plan). Includes 1,273,526 restricted stock units, which all vest in 2016 and are exercisable for no consideration. Excluding these restricted stock units, the weighted average exercise price of outstanding options, warrants and rights increases to $7.04. |
| (2) | Under the 2004 Stock Incentive Plan, we may issue stock awards, including but not limited to restricted stock bonuses and restricted stock units, as those terms are defined in the 2004 Stock Incentive Plan. For awards granted prior to June 2, 2008 under this plan, each stock award other than a stock option or stock appreciation right reduced the number of shares reserved for issuance under the 2004 Stock Incentive Plan by 2.25. For awards granted on or after June 2, 2008 under this plan, this share reserve is reduced by one share upon grant of each award. |
Issuer Purchases of Equity Securities
None.
Stock Performance Graph
The following graph shows our cumulative total stockholder return for the period beginning December 31, 2004 and ending on December 31, 2009. The graph also shows the cumulative total returns of the Standard & Poor’s 500 Stock Index, or S&P 500 Index, in which we are included, and an industry peer group.
The comparison below assumes $100 was invested on December 31, 2004 in our Class A common stock and in each of the indices shown and assumes that all dividends were reinvested. Our stock price performance shown in the following graph is not indicative of future stock price performance. The peer group is comprised of the following publicly traded commercial real estate services companies: Grubb & Ellis Company and Jones Lang LaSalle Incorporated. These two companies represent our primary competitors that are publicly traded with business lines reasonably comparable to ours.
31
Table of Contents
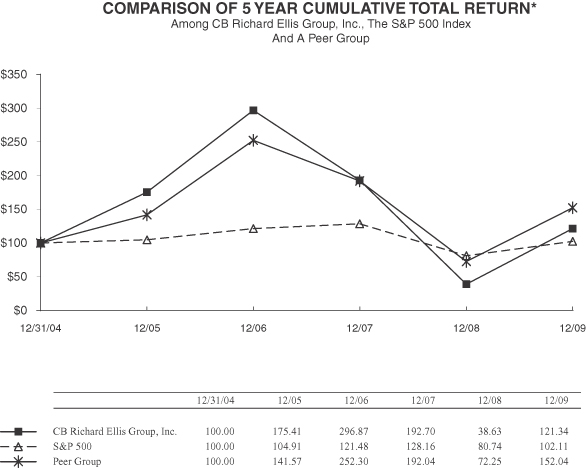
*$100 invested on 12/31/04 in stock or index-including reinvestment of dividends.
Fiscal year ending December 31.
Copyright © 2010 S&P, a division of The McGraw-Hill Companies Inc. All rights reserved.
32
Table of Contents
Item 6. Selected Financial Data
The following table sets forth our selected historical consolidated financial information for each of the five years in the period ended December 31, 2009. The statement of operations data, the statement of cash flows data and the other data for the years ended December 31, 2009, 2008 and 2007 and the balance sheet data as of December 31, 2009 and 2008 were derived from our audited consolidated financial statements included elsewhere in this Form 10-K. The statement of operations data, the statement of cash flows data and the other data for the years ended December 31, 2006 and 2005, and the balance sheet data as of December 31, 2007, 2006 and 2005 were derived from our audited consolidated financial statements that are not included in this Form 10-K.
The selected financial data presented below is not necessarily indicative of results of future operations and should be read in conjunction with our consolidated financial statements and the information included under the headings “Management’s Discussion and Analysis of Financial Condition and Results of Operations” included elsewhere in this Form 10-K.
| Year Ended December 31, | ||||||||||||||||||||
| 2009 | 2008 | 2007 | 2006 (1) | 2005 | ||||||||||||||||
| (dollars in thousands, except share data) | ||||||||||||||||||||
| STATEMENTS OF OPERATIONS DATA: |
||||||||||||||||||||
| Revenue |
$ | 4,165,820 | $ | 5,128,817 | $ | 6,034,249 | $ | 4,032,027 | $ | 3,194,026 | ||||||||||
| Operating income (loss) |
241,842 | (788,469 | ) | 698,971 | 550,139 | 372,406 | ||||||||||||||
| Interest income |
6,129 | 17,762 | 29,004 | 9,822 | 11,221 | |||||||||||||||
| Interest expense |
189,146 | 167,156 | 162,991 | 45,007 | 56,281 | |||||||||||||||
| Write-off of financing costs |
29,255 | — | — | 33,847 | 7,386 | |||||||||||||||
| (Loss) income from continuing operations |
(27,638 | ) | (1,076,489 | ) | 399,746 | 324,691 | 219,504 | |||||||||||||
| Income from discontinued operations, net of income taxes |
— | 26,748 | 5,308 | — | — | |||||||||||||||
| Net (loss) income |
(27,638 | ) | (1,049,741 | ) | 405,054 | 324,691 | 219,504 | |||||||||||||
| Net (loss) income attributable to non-controlling interests |
(60,979 | ) | (37,675 | ) | 14,549 | 6,120 | 2,163 | |||||||||||||
| Net income (loss) attributable to CB Richard Ellis Group, Inc. |
33,341 | (1,012,066 | ) | 390,505 | 318,571 | 217,341 | ||||||||||||||
| EPS (2) (3): |
||||||||||||||||||||
| Basic income (loss) per share attributable to CB Richard Ellis Group, Inc. shareholders |
||||||||||||||||||||
| Income (loss) from continuing operations attributable to CB Richard Ellis Group, Inc. shareholders |
$ | 0.12 | $ | (4.86 | ) | $ | 1.70 | $ | 1.41 | $ | 0.98 | |||||||||
| Income from discontinued operations, net of income taxes, attributable to CB Richard Ellis Group, Inc. shareholders |
— | 0.05 | 0.01 | — | — | |||||||||||||||
| Net income (loss) attributable to CB Richard Ellis Group, Inc. shareholders |
$ | 0.12 | $ | (4.81 | ) | $ | 1.71 | $ | 1.41 | $ | 0.98 | |||||||||
| Diluted income (loss) per share attributable to CB Richard Ellis Group, Inc. shareholders |
||||||||||||||||||||
| Income (loss) from continuing operations attributable to CB Richard Ellis Group, Inc. shareholders |
$ | 0.12 | $ | (4.86 | ) | $ | 1.65 | $ | 1.35 | $ | 0.95 | |||||||||
| Income from discontinued operations, net of income taxes, attributable to CB Richard Ellis Group, Inc. shareholders |
— | 0.05 | 0.01 | — | — | |||||||||||||||
| Net income (loss) attributable to CB Richard Ellis Group, Inc. shareholders |
$ | 0.12 | $ | (4.81 | ) | $ | 1.66 | $ | 1.35 | $ | 0.95 | |||||||||
| Weighted average shares: |
||||||||||||||||||||
| Basic |
277,361,783 | 210,539,032 | 228,476,724 | 226,685,122 | 222,129,066 | |||||||||||||||
| Diluted |
279,995,081 | 210,539,032 | 234,978,464 | 235,118,341 | 229,855,056 | |||||||||||||||
| STATEMENTS OF CASH FLOWS DATA: |
||||||||||||||||||||
| Net cash provided by (used in) operating activities |
$ | 213,645 | $ | (130,373 | ) | $ | 648,210 | $ | 430,044 | $ | 359,656 | |||||||||
| Net cash used in investing activities |
(119,362 | ) | (419,009 | ) | (284,421 | ) | (2,061,933 | ) | (115,509 | ) | ||||||||||
| Net cash provided by (used in) financing activities |
476,768 | 373,959 | (277,253 | ) | 1,419,560 | (47,272 | ) | |||||||||||||
| OTHER DATA: |
||||||||||||||||||||
| EBITDA (4) |
$ | 372,079 | $ | 457,021 | $ | 834,264 | $ | 653,524 | $ | 454,184 | ||||||||||
33
Table of Contents
| As of December 31, | |||||||||||||||
| 2009 | 2008 | 2007 | 2006 | 2005 | |||||||||||
| (dollars in thousands) | |||||||||||||||
| BALANCE SHEET DATA: |
|||||||||||||||
| Cash and cash equivalents |
$ | 741,557 | $ | 158,823 | $ | 342,874 | $ | 244,476 | $ | 449,289 | |||||
| Total assets |
5,039,406 | 4,726,414 | 6,242,573 | 5,944,631 | 2,815,672 | ||||||||||
| Long-term debt, including current portion |
2,120,803 | 2,077,421 | 1,788,726 | 2,078,509 | 561,069 | ||||||||||
| Notes payable on real estate (5) |
551,277 | 617,663 | 466,032 | 347,033 | — | ||||||||||
| Total liabilities |
4,255,111 | 4,380,691 | 4,990,417 | 4,684,854 | 2,015,163 | ||||||||||
| Total CB Richard Ellis Group, Inc. stockholders’ equity |
629,122 | 114,686 | 988,543 | 1,181,641 | 793,685 | ||||||||||
Note: We have not declared any cash dividends on common stock for the periods shown.
| (1) | The results for the year ended December 31, 2006 include the operations of Trammell Crow Company from December 20, 2006, the date we acquired Trammell Crow Company. |
| (2) | EPS represents earnings (loss) per share. See Earnings (Loss) Per Share information in Note 18 of our Notes to Consolidated Financial Statements. |
| (3) | On April 28, 2006, our board of directors approved a three-for-one stock split of our Class A common stock effected as a 100% stock dividend, which was distributed on June 1, 2006. The applicable share and per share data for all periods presented has been restated to give effect to this stock split. |
| (4) | EBITDA represents earnings before net interest expense, write-off of financing costs, income taxes, depreciation and amortization, and goodwill and other non-amortizable intangible asset impairment. Our management believes EBITDA is useful in evaluating our operating performance compared to that of other companies in our industry because the calculation of EBITDA generally eliminates the effects of financing and income taxes and the accounting effects of capital spending and acquisitions, which would include impairment charges of goodwill and intangibles created from acquisitions. Such items may vary for different companies for reasons unrelated to overall operating performance. As a result, our management uses EBITDA as a measure to evaluate the operating performance of our various business segments and for other discretionary purposes, including as a significant component when measuring our operating performance under our employee incentive programs. Additionally, we believe EBITDA is useful to investors to assist them in getting a more accurate picture of our results from operations. |
However, EBITDA is not a recognized measurement under U.S. generally accepted accounting principles, or GAAP, and when analyzing our operating performance, readers should use EBITDA in addition to, and not as an alternative for, net income as determined in accordance with GAAP. Because not all companies use identical calculations, our presentation of EBITDA may not be comparable to similarly titled measures of other companies. Furthermore, EBITDA is not intended to be a measure of free cash flow for our management’s discretionary use, as it does not consider certain cash requirements such as tax and debt service payments. The amounts shown for EBITDA also differ from the amounts calculated under similarly titled definitions in our debt instruments, which are further adjusted to reflect certain other cash and non-cash charges and are used to determine compliance with financial covenants and our ability to engage in certain activities, such as incurring additional debt and making certain restricted payments.
EBITDA is calculated as follows (dollars in thousands):
| Year ended December 31, | ||||||||||||||||
| 2009 | 2008 | 2007 | 2006 | 2005 | ||||||||||||
| Net income (loss) attributable to CB Richard Ellis Group, Inc. |
$ | 33,341 | $ | (1,012,066 | ) | $ | 390,505 | $ | 318,571 | $ | 217,341 | |||||
| Add: |
||||||||||||||||
| Depreciation and amortization (i) |
99,473 | 102,909 | 113,694 | 67,595 | 45,516 | |||||||||||
| Goodwill and other non-amortizable intangible asset impairment |
— | 1,159,406 | — | — | — | |||||||||||
| Interest expense (ii) |
189,146 | 167,805 | 164,829 | 45,007 | 56,281 | |||||||||||
| Write-off of financing costs |
29,255 | — | — | 33,847 | 7,386 | |||||||||||
| Provision for income taxes (iii) |
26,993 | 56,853 | 194,255 | 198,326 | 138,881 | |||||||||||
| Less: |
||||||||||||||||
| Interest income (iv) |
6,129 | 17,886 | 29,019 | 9,822 | 11,221 | |||||||||||
| EBITDA (v) |
$ | 372,079 | $ | 457,021 | $ | 834,264 | $ | 653,524 | $ | 454,184 | ||||||
| (i) | Includes depreciation and amortization related to discontinued operations of $0.1 million and $0.4 million for the years ended December 31, 2008 and 2007, respectively. |
| (ii) | Includes interest expense related to discontinued operations of $0.6 million and $1.8 million for the years ended December 31, 2008 and 2007, respectively. |
| (iii) | Includes provision for income taxes related to discontinued operations of $6.0 million and $1.6 million for the years ended December 31, 2008 and 2007, respectively. |
| (iv) | Includes interest income related to discontinued operations of $0.1 million and $0.01 million for the years ended December 31, 2008 and 2007, respectively. |
| (v) | Includes EBITDA related to discontinued operations of $16.9 million and $6.5 million for the years ended December 31, 2008 and 2007, respectively. |
| (5) | Notes payable on real estate disclosed here includes the current and long-term portions of notes payable on real estate as well as notes payable included in liabilities related to real estate and other assets held for sale. |
34
Table of Contents
Item 7. Management’s Discussion and Analysis of Financial Condition and Results of Operations
Overview
We are the world’s largest commercial real estate services firm, based on 2009 revenue, with leading full-service operations in major metropolitan areas throughout the world. We offer a full range of services to occupiers, owners, lenders and investors in office, retail, industrial, multi-family and other types of commercial real estate. As of December 31, 2009, we operated more than 300 offices worldwide, excluding affiliate offices, with approximately 29,000 employees providing commercial real estate services under the “CB Richard Ellis” brand name and development services under the “Trammell Crow” brand name. Our business is focused on several competencies, including commercial property and corporate facilities management, tenant representation, property/agency leasing, property sales, valuation, real estate investment management, commercial mortgage origination and servicing, capital markets (equity and debt) solutions, development services and proprietary research. We generate revenues from contractual management fees and on a per project or transactional basis. In 2006, we became the first commercial real estate services company included in the S&P 500. In 2007, 2008 and 2009, we were the only commercial real estate services company included on the Business Week list of 50 “Best in Class” companies across all industries. In 2008, we became the first commercial real estate services firm to be included in the Fortune 500 and remained the only commercial real estate services company on this list in 2009. Fortune also included us on its list of Most Admired Companies in the real estate sector in 2009. Additionally, in 2009 the International Association of Outsourcing Professionals ranked us the #1 outsourcing company in commercial real estate services and the #8 outsourcing company across all industries.
When you read our financial statements and the information included in this section, you should consider that we have experienced, and continue to experience, several material trends and uncertainties that have affected our financial condition and results of operations that make it challenging to predict our future performance based on our historical results. We believe that the following material trends and uncertainties are crucial to an understanding of the variability in our historical earnings and cash flows and the potential for continued variability in the future:
Macroeconomic Conditions
Economic trends and government policies affect global and regional commercial real estate markets as well as our operations directly. These include: overall economic activity and employment growth, interest rate levels, the cost and availability of credit and the impact of tax and regulatory policies. Periods of economic weakness or recession, significantly rising interest rates, declining employment levels, declining demand for real estate, declining real estate values, or the public perception that any of these events may occur, have negatively affected and may continue to negatively affect the performance of many of our business lines. Beginning in late 2007, the severe global economic downturn and credit market crisis have had significant adverse effects on our operations. Weak economic conditions have resulted in, and may continue to result in, a general decrease in transaction activity, lower occupancy and rental rate levels, reduced property values and restrained corporate spending. These trends, in turn, have reduced, and may continue to reduce, revenue from property management fees and commissions derived from property sales, leasing, valuation and financing, and funds available to invest in commercial real estate and related assets.
Adverse changes in economic conditions have also affected, and will continue to affect, our compensation expense, which is generally structured to decrease in line with a fall in revenue. Compensation is our largest expense and the sales and leasing professionals in our largest line of business, advisory services, generally are paid on a commission and bonus basis that correlates with our revenue performance. As a result, the negative effect of difficult market conditions on our operating margins is partially mitigated by the inherent variability of our compensation cost structure. In addition, at times when negative economic conditions are particularly severe, as they have been recently, our management has taken decisive actions to improve operational performance by, among other actions, reducing discretionary bonuses, curtailing capital expenditures and adjusting overall
35
Table of Contents
staffing levels. Notwithstanding these actions, adverse global and regional economic changes remain one of the most significant risks to the financial condition and performance of our operations.
Economic conditions have adversely affected our performance in the Americas, our largest segment in terms of revenue, since the third quarter of 2007. U.S. economic activity has progressively weakened since that time, highlighted by declining employment and highly constrained consumer and business spending. The weakened economic activity was further worsened by the severe global capital market disruption in late 2008, which caused credit availability to freeze up, investors to become more risk averse and assets of all types to lose significant value. These conditions also caused the economy to contract further and job losses to accelerate, resulting in a decline in leasing activity, space absorption, occupancy levels and rental rates. In addition, investment sales in the United States fell sharply in the face of significantly constrained liquidity, weakened property fundamentals, and the re-pricing of risk in the face of economic and market uncertainty. A return to positive economic growth in the United States in the second half of 2009 did not have a meaningful impact on commercial real estate fundamentals as job losses continued to mount. Properties continued to lose value, financing remained constrained, and occupancy and rental rates continued to decline. Transaction velocity remained muted.
In Europe, the weakening market conditions began to manifest in the United Kingdom in late 2007 and throughout the continent in early 2008. The major European economies also entered into a recession in 2008, which persisted in most countries through 2009, tempering leasing activity. Investment sales in Europe also worsened progressively throughout 2008 and remained at low levels through 2009, though larger markets like London and Paris showed modest improvement in the fourth quarter of 2009. The markets in Asia Pacific were also affected, though generally to a lesser degree than the United States and Europe, by the global credit market dislocation and economic downturn. This resulted in lower investment sales and leasing activity in 2008 and most of 2009. In late 2009, transaction activity began to revive in Asia Pacific, reflecting the economic rebound in leading countries in this region, including China and Australia. From late 2007 through 2009, deteriorating conditions also adversely affected investment management and development activity as property values declined sharply, financing options dried up and disposition opportunities became more limited.
Recovery of our global sales, leasing and investment management and development services operations is contingent on, among other things, the world’s major economies, including the United States, generating stronger, sustained growth, with positive employment gains, credit markets returning to normal with stable, predictable and reasonably-priced financing and business confidence returning for an extended period.
Effects of Acquisitions
Our management historically has made significant use of strategic acquisitions to add new service competencies, to increase our scale within existing competencies and to expand our presence in various geographic regions around the world. For example, we enhanced our mortgage brokerage services through our 1996 acquisition of L.J. Melody & Company (now known as CBRE Capital Markets) and we significantly increased the scale of our investment management business through our 1995 acquisition of Westmark Realty Advisors (now known as CB Richard Ellis Investors), our 1997 acquisition of Koll Real Estate Services and our 1998 acquisition of the London-based firm Hillier Parker May & Rowden. Our 2003 acquisition of Insignia Financial Group, Inc. (Insignia) significantly increased the scale of our real estate advisory and outsourcing services business lines in our Americas segment and also significantly increased our presence in the New York, London and Paris metropolitan areas.
In December 2006, we acquired Trammell Crow Company, our largest acquisition to date. The acquisition of Trammell Crow Company deepened our offering of outsourcing services for corporate and institutional clients, especially project and facilities management, strengthened our ability to provide integrated management solutions across geographies, added our Development Services business and provided additional people, resources and expertise to offer real estate services throughout the United States.
Strategic in-fill acquisitions have also played a key role in expanding our geographic coverage and broadening and strengthening our service offerings. From 2005 to 2008, we completed 58 in-fill acquisitions for
36
Table of Contents
an aggregate purchase price of approximately $592 million. The companies we acquired have generally been quality regional firms or niche specialty firms that complement our existing platform within a region, or affiliates in which, in some cases, we held an equity interest. Current market conditions have made acquisition opportunities less attractive in the short term. In light of the current economic environment, no acquisitions were completed during the year ended December 31, 2009. However, we believe acquisitions will once again serve as a growth engine, supplementing our organic growth when market conditions improve in the future.
Although our management believes that strategic acquisitions can significantly decrease the cost, time and commitment of management resources necessary to attain a meaningful competitive position within targeted markets or to expand our presence within our current markets, our management also believes that most acquisitions will initially have an adverse impact on our operating and net income, both as a result of transaction-related expenditures and the charges and costs of integrating the acquired business and its financial and accounting systems into our own. For example, we incurred $200.9 million of transaction-related expenditures in connection with our acquisition of Insignia in 2003 (the Insignia Acquisition) and $196.6 million of transaction-related expenditures in connection with our acquisition of Trammell Crow Company in 2006. Transaction-related expenditures included severance costs, lease termination costs, transaction costs, deferred financing costs and merger-related costs, among others. We incurred our final transaction expenditures with respect to the Insignia Acquisition in the third quarter of 2004 and the Trammell Crow Company Acquisition in the fourth quarter of 2007. In addition, through December 31, 2009, we have incurred expenses of $41.9 million related to Insignia and $58.6 million related to Trammell Crow Company in connection with the integration of these companies’ business lines, as well as accounting and other systems, into our own. During the year ended December 31, 2009, we incurred $5.6 million of integration expenses, the majority of which were related to the acquisition of Trammell Crow Company. We expect to incur total integration expenses relating to past acquisitions of approximately $5 million during 2010, which primarily include residual integration costs associated with our acquisition of Trammell Crow Company.
International Operations
We have made significant acquisitions of non-U.S. companies and we may acquire additional foreign companies in the future. As we increase our foreign operations through either acquisitions or organic growth, fluctuations in the value of the U.S. dollar relative to the other currencies in which we may generate earnings could adversely affect our business, financial condition and operating results. Our management team generally seeks to mitigate our exposure by balancing assets and liabilities that are denominated in the same currency and by maintaining cash positions outside the United States only at levels necessary for operating purposes. In addition, from time to time we enter into foreign currency exchange contracts to mitigate our exposure to exchange rate changes related to particular transactions and to hedge risks associated with the translation of foreign currencies into U.S. dollars. Due to the constantly changing currency exposures to which we are subject and the volatility of currency exchange rates, our management cannot predict the effect of exchange rate fluctuations upon future operating results. In addition, fluctuations in currencies relative to the U.S. dollar may make it more difficult to perform period-to-period comparisons of our reported results of operations.
Our international operations also are subject to, among other things, political instability and changing regulatory environments, which may adversely affect our future financial condition and results of operations. Our management routinely monitors these risks and related costs and evaluates the appropriate amount of resources to allocate towards business activities in foreign countries where such risks and costs are particularly significant.
Leverage
We are highly leveraged and have significant debt service obligations. As of December 31, 2009, our total debt, excluding our notes payable on real estate and warehouse lines of credit, was approximately $2.1 billion. Our level of indebtedness and the operating and financial restrictions in our debt agreements both place constraints on the operation of our business. Although our management believes that the incurrence of long-term
37
Table of Contents
indebtedness has been important in the development of our business, including facilitating our acquisitions of Insignia and Trammell Crow Company, the cash flow necessary to service this debt is not available for other general corporate purposes, which may limit our flexibility in planning for, or reacting to, changes in our business and in the commercial real estate services industry. Our management seeks to mitigate this exposure both through the refinancing of debt when available on attractive terms and through selective repayment and retirement of indebtedness.
During the third quarter of 2009, we reached agreement with our lenders to extend maturities and amortization schedules on $985.0 million of loans outstanding under our credit agreement. In addition, on February 10, 2010, we announced that we had reached agreements with our lenders to extend maturities on an additional $156.6 million of loans outstanding under our credit agreement. During the year ended December 31, 2009, we also repaid $432.0 million of our senior secured term loans outstanding under our credit agreement and issued $450.0 million of 11.625% senior subordinated notes due June 15, 2017. These actions, combined with the amendment to our credit agreement in the first quarter of 2009, have given us increased flexibility and significantly extended the weighted average maturity of our outstanding debt.
Critical Accounting Policies
Our consolidated financial statements have been prepared in accordance with accounting principles generally accepted in the United States, which require management to make estimates and assumptions that affect reported amounts. The estimates and assumptions are based on historical experience and on other factors that management believes to be reasonable. Actual results may differ from those estimates. We believe that the following critical accounting policies represent the areas where more significant judgments and estimates are used in the preparation of our consolidated financial statements:
Revenue Recognition
In order for us to recognize revenue, there are four basic criteria that must be met:
| • | existence of persuasive evidence that an arrangement exists; |
| • | delivery has occurred or services have been rendered; |
| • | the seller’s price to the buyer is fixed and determinable; and |
| • | collectibility is reasonably assured. |
Our revenue recognition policies are consistent with these criteria. The judgments involved in revenue recognition include understanding the complex terms of agreements and determining the appropriate time to recognize revenue for each transaction based on such terms. Each transaction is evaluated to determine: (i) at what point in time revenue is earned, (ii) whether contingencies exist that impact the timing of recognition of revenue and (iii) how and when such contingencies will be resolved. The timing of revenue recognition could vary if different judgments were made. Our revenues subject to the most judgment are brokerage commission revenue and incentive-based management and development fees.
We record commission revenue on real estate sales generally upon close of escrow or transfer of title, except when future contingencies exist. Real estate commissions on leases are generally recorded in revenue when all obligations under the commission agreement are satisfied. Terms and conditions of a commission agreement may include, but are not limited to, execution of a signed lease agreement and future contingencies including tenant occupancy, payment of a deposit or payment of a first month’s rent (or a combination thereof). As some of these conditions are outside of our control and are often not clearly defined, judgment must be exercised in determining when such required events have occurred in order to recognize revenue.
A typical commission agreement provides that we earn a portion of a lease commission upon the execution of the lease agreement by the tenant, with the remaining portion(s) of the lease commission earned at a later date, usually upon tenant occupancy or payment of rent. The existence of any significant future contingencies results
38
Table of Contents
in the delay of recognition of corresponding revenue until such contingencies are satisfied. For example, if we do not earn all or a portion of the lease commission until the tenant pays its first month’s rent, and the lease agreement provides the tenant with a free rent period, we delay revenue recognition until rent is paid by the tenant.
Property management revenues are generally based upon percentages of the revenue or profit generated by the entities managed or the square footage managed. These fees are recognized when earned under the provisions of the related management agreements.
Investment management fees are based predominantly upon a percentage of the equity deployed on behalf of our limited partners. Fees related to our indirect investment management programs are based upon a percentage of the fair value of those investments. These fees are recognized when earned under the provisions of the related investment management agreements. Our Global Investment Management segment also earns performance-based incentive fees with regard to many of its investments. Such revenue is recognized at the end of the measurement periods when the conditions of the applicable incentive fee arrangements have been satisfied and following the expiration of any potential claw back provision. With many of these investments, our Global Investment Management team has participation interests in such incentive fees, which are commonly referred to as carried interest. This carried interest expense is generally accrued for based upon the probability of such performance-based incentive fees being earned over the related vesting period.
We earn incentive development fees from our Development Services segment. These fees are recognized when quantitative criteria have been met (such as specified leasing or budget targets) or, for those incentive fees based on qualitative criteria, upon approval of the fee by our clients. Certain incentive development fees allow us to share in the fair value of the developed real estate asset above cost. This sharing creates additional revenue potential to us with no exposure to loss other than opportunity cost. Our incentive development fee revenue is not recognized to the extent that such revenue is subject to future performance contingencies, but rather once the contingency has been resolved. The unique nature and complexity of each incentive fee requires us to use varying levels of judgment in determining the timing of revenue recognition.
In establishing the appropriate provisions for trade receivables, we make assumptions with respect to future collectibility. Our assumptions are based on an assessment of a customer’s credit quality as well as subjective factors and trends, including the aging of receivables balances. In addition to these assessments, in general, outstanding trade accounts receivable amounts that are more than 180 days overdue are evaluated for collectibility and fully provided for if deemed uncollectible. Historically, our credit losses have generally been insignificant. However, estimating losses requires significant judgment, and conditions may change or new information may become known after any periodic evaluation. As a result, actual credit losses may differ from our estimates.
Principles of Consolidation
The accompanying consolidated financial statements include our accounts and those of our majority-owned subsidiaries, as well as variable interest entities, or VIEs, in which we are the primary beneficiary. The equity attributable to non-controlling interests in subsidiaries is shown separately in our consolidated balance sheets included elsewhere in this filing. All significant intercompany accounts and transactions have been eliminated in consolidation.
Variable Interest Entities
Our determination of the appropriate accounting method with respect to our VIEs, including co-investments with our clients, is based on the “Consolidation” Topic of the Financial Accounting Standards Board, or FASB, Accounting Standards Codification, or ASC, Topic 810. We consolidate any VIE of which we are the primary beneficiary and disclose significant VIEs of which we are not the primary beneficiary, if any.
39
Table of Contents
We determine if an entity is a VIE under Topic 810 based on several factors, including whether the entity’s total equity investment at risk upon inception is sufficient to finance the entity’s activities without additional subordinated financial support. We make judgments regarding the sufficiency of the equity at risk based first on a qualitative analysis, then a quantitative analysis, if necessary. In a quantitative analysis, we incorporate various estimates, including estimated future cash flows, asset hold periods and discount rates, as well as estimates of the probabilities of various scenarios occurring. If the entity is a VIE, we then determine whether we consolidate the entity as the primary beneficiary. This determination of whether we are the primary beneficiary includes any impact of an “upside economic interest” in the form of a “promote” that we may have. A promote is an interest built into the distribution structure of the entity based on the entity’s achievement of certain return hurdles.
We determine whether an entity is a VIE and, if so, whether it should be consolidated by utilizing judgments and estimates that are inherently subjective. If we made different judgments or utilized different estimates in these evaluations, it could result in differing conclusions as to whether or not an entity is a VIE and whether or not to consolidate such entity.
Limited Partnerships, Limited Liability Companies and Other Subsidiaries
If an entity is not a VIE, our determination of the appropriate accounting method with respect to our investments in limited partnerships, limited liability companies and other subsidiaries is based on voting control. For our general partner interests, we are presumed to control (and therefore consolidate) the entity, unless the other limited partners have substantive rights that overcome this presumption of control. These substantive rights allow the limited partners to participate in significant decisions made in the ordinary course of the entity’s business. We account for our non-controlling general partner investments in these entities under the equity method. This treatment also applies to our managing member interests in limited liability companies.
Our investments in unconsolidated subsidiaries in which we have the ability to exercise significant influence over operating and financial policies, but do not control, or entities which are variable interest entities in which we are not the primary beneficiary are accounted for under the equity method. Accordingly, our share of the earnings from these equity-method basis companies is included in consolidated net income. All other investments held on a long-term basis are valued at cost less any impairment in value.
Our determination of the appropriate accounting treatment for an investment in a subsidiary requires judgment of several factors, including the size and nature of our ownership interest and the other owners’ substantive rights to make decisions for the entity. If we were to make different judgments or conclusions as to the level of our control or influence, it could result in a different accounting treatment. Accounting for an investment as either consolidated or using the equity method generally would have no impact on our net income or stockholders’ equity in any accounting period, but a different treatment would impact individual income statement and balance sheet items, as consolidation would effectively “gross up” our income statement and balance sheet. If our evaluation of an investment accounted for using the cost method was different, it could result in our being required to account for an investment by consolidation or by the equity method. Under the cost method, the investor only records its share of the underlying entity’s earnings to the extent that it receives dividends from the investee; when the dividends received by the investor exceed the investor’s share of the investee’s earnings subsequent to the date of the investor’s investment, the investor records a reduction in the basis of its investment. Under the cost method, the investor does not record its share of losses of the investee. Conversely, under either consolidation or equity method accounting, the investor effectively records its share of the underlying entity’s net income or loss, to the extent of its investment or its guarantees of the underlying entity’s debt.
Under either the equity or cost method, impairment losses are recognized upon evidence of other-than-temporary losses of value. When testing for impairment on investments that are not actively traded on a public market, we generally use a discounted cash flow approach to estimate the fair value of our investments and/or look to comparable activities in the marketplace. Management judgment is required in developing the assumptions for the discounted cash flow approach. These assumptions include net asset values, internal rates of
40
Table of Contents
return, discount and capitalization rates, interest rates and financing terms, rental rates, timing of leasing activity, estimates of lease terms and related concessions, etc. When determining if impairment is other-than-temporary, we also look to the length of time and the extent to which fair value has been less than cost as well as the financial condition and near-term prospects of each investment.
Goodwill and Other Intangible Assets
Our acquisitions require the application of purchase accounting, which results in tangible and identifiable intangible assets and liabilities of the acquired entity being recorded at fair value. The difference between the purchase price and the fair value of net assets acquired is recorded as goodwill. In determining the fair values of assets and liabilities acquired in a business combination, we use a variety of valuation methods including present value, depreciated replacement cost, market values (where available) and selling prices less costs to dispose. We are responsible for determining the valuation of assets and liabilities, and for the allocation of purchase price to assets acquired and liabilities assumed.
Assumptions must often be made in determining fair values, particularly where observable market values do not exist. Assumptions may include discount rates, growth rates, cost of capital, royalty rates, tax rates and remaining useful lives. These assumptions can have a significant impact on the value of identifiable assets and accordingly can impact the value of goodwill recorded. Different assumptions could result in different values being attributed to assets and liabilities. Since these values impact the amount of annual depreciation and amortization expense, different assumptions could also impact our statement of operations and could impact the results of future impairment reviews.
The majority of our goodwill balance has resulted from our acquisition of CB Richard Ellis Services in 2001, our acquisition of Insignia in 2003 and our acquisition of Trammell Crow Company in 2006. Other intangible assets include a trademark, which was separately identified as a result of the 2001 acquisition, as well as a trade name separately identified as a result of the Insignia Acquisition representing the Richard Ellis trade name in the United Kingdom that was owned by Insignia prior to the Insignia Acquisition. Both the trademark and the trade name are not being amortized and have indefinite estimated useful lives. The remaining other intangible assets primarily include customer relationships, management contracts, loan servicing rights and franchise agreements, which are all being amortized over estimated useful lives ranging up to 20 years.
We are required to test goodwill and other intangible assets deemed to have indefinite useful lives for impairment annually or more often if circumstances or events indicate a change in the impairment status. The goodwill impairment analysis is a two-step process. The first step used to identify potential impairment involves comparing each reporting unit’s estimated fair value to its carrying value, including goodwill. We use a discounted cash flow approach to estimate the fair value of our reporting units. Management judgment is required in developing the assumptions for the discounted cash flow model. These assumptions include revenue growth rates, profit margin percentages, discount rates, etc. If the estimated fair value of a reporting unit exceeds its carrying value, goodwill is considered to not be impaired. If the carrying value exceeds estimated fair value, there is an indication of potential impairment and the second step is performed to measure the amount of impairment. The second step of the process involves the calculation of an implied fair value of goodwill for each reporting unit for which step one indicated impairment. The implied fair value of goodwill is determined similar to how goodwill is calculated in a business combination, by measuring the excess of the estimated fair value of the reporting unit as calculated in step one, over the estimated fair values of the individual assets, liabilities and identifiable intangibles as if the reporting unit was being acquired in a business combination. Due to the many variables inherent in the estimation of a business’s fair value and the relative size of our goodwill, if different assumptions and estimates were used, it could have an adverse effect on our impairment analysis.
Our annual assessment of goodwill and other intangible assets deemed to have indefinite lives has historically been completed as of the beginning of the fourth quarter of each year. We performed the 2009, 2008 and 2007 annual assessments as of October 1. We determined that no impairment of goodwill or other non-amortizable intangible assets deemed to have indefinite lives existed as of October 1, 2009 and 2007.
41
Table of Contents
However, we were required to re-perform the 2008 assessment as of December 31, 2008 because economic conditions worsened, the capital markets became distressed and our stock price dropped significantly in the fourth quarter of 2008. This was evidenced in our 2008 results by weak sales and leasing activity in our Americas and EMEA segments caused by the credit crunch and significant capital market turmoil adversely affecting incentive-based revenue within our Global Investment Management segment as well as reducing real estate sales volume and values in our Development Services segment. Based on our assessments of goodwill in 2008, we determined that we had impairment in several reporting units, which was driven by these adverse economic conditions causing a decline in the estimated future discounted cash flows expected for such units. The amount of the pre-tax goodwill impairment charges included in our statement of operations for the year ended December 31, 2008 was $1.1 billion. We also determined that two of our intangible assets with indefinite useful lives, $84.0 million representing the Trammell Crow trade name identified in the Trammell Crow Company acquisition and $6.9 million representing the CBRE Melody trademark identified as a result of the 2001 Merger, were also fully impaired. The impairment of the Trammell Crow trade name was driven by the adverse economic conditions causing a significant decline in the estimated future discounted cash flows such that we could not substantiate this trade name having any book value. The impairment of the CBRE Melody trademark was driven by our mortgage brokerage business’s plans to discontinue use of the Melody trademark and exclusively use the CBRE trademark. The amount of the pre-tax other non-amortizable intangible asset impairment charges included in our statement of operations for the year ended December 31, 2008 was $90.9 million.
Real Estate
As of December 31, 2009, the carrying value of our total real estate assets was $693.4 million (13.8% of total assets). The significant accounting policies and estimates with regard to our real estate assets relate to classification and impairment evaluation, cost capitalization and allocation, disposition of real estate and discontinued operations.
Classification and Impairment Evaluation
With respect to our real estate assets, the “Property, Plant and Equipment,” Topic of FASB ASC (Topic 360) establishes criteria to classify an asset as “held for sale.” Assets included in real estate held for sale include only completed assets or land for sale in its present condition that meet all of Topic 360’s “held for sale” criteria. All other real estate assets are classified in one of the following line items in our consolidated balance sheet: (i) real estate under development (current), which includes real estate that we are in the process of developing that is expected to be completed and disposed of within one year of the balance sheet date; (ii) real estate under development (non-current), which includes real estate that we are in the process of developing that is expected to be completed and disposed of more than one year from the balance sheet date; or (iii) real estate held for investment, which consists of land on which development activities have not yet commenced and completed assets or land held for disposition that do not meet the “held for sale” criteria.
Real estate held for sale is recorded at the lower of cost or estimated fair value less cost to sell. If an asset’s fair value less cost to sell, based on discounted future cash flows, management estimates or market comparisons, is less than its carrying amount, an allowance is recorded against the asset. Determining an asset’s fair value and the related allowance to record requires us to utilize judgment and estimates.
Real estate under development and real estate held for investment are carried at cost less depreciation, as applicable. Buildings and improvements included in real estate held for investment are depreciated using the straight-line method over estimated useful lives, generally 39 years. Tenant improvements included in real estate held for investment are amortized using the straight-line method over the shorter of their estimated useful life or the terms of the respective leases. Land improvements included in real estate held for investment are depreciated over their estimated useful lives, up to 15 years.
When indicators of impairment are present, real estate under development and real estate held for investment are evaluated for impairment and losses are recorded when undiscounted cash flows estimated to be
42
Table of Contents
generated by an asset or market comparisons are less than the asset’s carrying amount. The amount of the impairment loss is calculated as the excess of the asset’s carrying value over its fair value, which is determined using a discounted cash flow analysis, management estimates or market comparisons. Impairment charges of $28.8 million and $48.7 million were recorded for the years ended December 31, 2009 and 2008, respectively. In addition, during the year ended December 31, 2009, we also recorded provisions for loss on real estate held for sale of $3.9 million. No impairment charges or provisions for losses on real estate held for sale were recorded during the year ended December 31, 2007.
We evaluate each of our real estate assets on a quarterly basis in order to determine the classification of each asset in our consolidated balance sheet. This evaluation requires judgment by us in considering certain criteria that must be evaluated under Topic 360, such as the estimated time to complete assets that are under development and the timeframe in which we expect to sell our real estate assets. The classification of real estate assets determines which real estate assets are to be depreciated as well as what method is used to evaluate and measure impairment. Had we evaluated our assets differently, the balance sheet classification of such assets, depreciation expense and impairment losses could have been different.
Cost Capitalization and Allocation
When acquiring, developing and constructing real estate assets, we capitalize costs. Capitalization begins when we determine that activities related to development have begun and ceases when activities are substantially complete and the asset is available for occupancy, which are timing decisions that require judgment. Costs capitalized include pursuit costs, or pre-acquisition/pre-construction costs, taxes and insurance, development and construction costs and costs of incidental operations. We expense transaction costs for acquisitions that qualify as a business in accordance with the “Business Combinations” Topic of the FASB ASC (Topic 805). Pursuit costs capitalized in connection with a potential development project that we have determined based on our judgment not to pursue are written off in the period that such determination is made. A difference in the timing of when this determination is made could cause the pursuit costs to be expensed in a different period.
At times, we purchase bulk land that we intend to sell or develop in phases. The land basis allocated to each phase is based on the relative estimated fair value of the phases before construction. We allocate construction costs incurred relating to more than one phase between the various phases; if the costs cannot be specifically attributed to a certain phase or the improvements benefit more than one phase, we allocate the costs between the phases based on their relative estimated sales values, where practicable, or other value methods as appropriate under the circumstances. Relative allocations of the costs are revised as the sales value estimates are revised.
When acquiring real estate with existing buildings, we allocate the purchase price between land, land improvements, building and intangibles related to in-place leases, if any, based on their relative fair values. The fair values of acquired land and buildings are determined based on an estimated discounted future cash flow model with lease-up assumptions as if the building was vacant upon acquisition. The fair value of in-place leases includes the value of lease intangibles for above or below-market rents and tenant origination costs, determined on a lease by lease basis using assumptions for market rates, absorption periods, lease commissions and tenant improvements. The capitalized values for both lease intangibles and tenant origination costs are amortized over the term of the underlying leases. Amortization related to lease intangibles is recorded as either an increase to or a reduction of rental income and amortization for tenant origination costs is recorded to amortization expense. If we use different estimates in these valuations, the allocation of purchase price to each component could differ, which could cause the amount of amortization related to lease intangibles and tenant origination costs to be different, as well as depreciation of the related building and land improvements.
Disposition of Real Estate
Gains on disposition of real estate are recognized upon sale of the underlying project. We evaluate each real estate sale transaction to determine if it qualifies for gain recognition under the full accrual method. This evaluation requires us to make judgments and estimates in assessing whether a sale has been consummated, the
43
Table of Contents
adequacy of the buyer’s investment, the subordination or collectibility of any receivable related to the purchase, and whether we have transferred the usual risks and rewards of ownership to the buyer, with no substantial continuing involvement by us. If the transaction does not meet the criteria for the full accrual method of profit recognition based on our assessment, we account for the sale based on an appropriate deferral method determined by the nature and extent of the buyer’s investment and our continuing involvement. In some cases, a deferral method could require the real estate asset and its related liabilities to remain on our balance sheet until the sale qualifies for a different deferral method or full accrual profit recognition.
Discontinued Operations
Topic 360 extends the reporting of a discontinued operation to a “component of an entity,” and further requires that a component be classified as a discontinued operation if the operations and cash flows of the component have been or will be eliminated from the ongoing operations of the entity in the disposal transaction and the entity will not have any significant continuing involvement in the operations of the component after the disposal transaction. As defined in Topic 360, a “component of an entity” comprises operations and cash flows that can be clearly distinguished, operationally and for financial reporting purposes, from the rest of the entity. Because each of our real estate assets is generally accounted for in a discrete subsidiary, many constitute a component of an entity under Topic 360, increasing the likelihood that the disposition of assets are required to be recognized and reported as operating profits and losses on discontinued operations in the periods in which they occur. The evaluation of whether the component’s cash flows have been eliminated and the level of our continuing involvement requires judgment by us and a different assessment could result in items not being reported as discontinued operations.
Income Taxes
Income taxes are accounted for under the asset and liability method in accordance with FASB ASC Topic 740 “Accounting for Income Taxes,” (Topic 740). Deferred tax assets and liabilities are determined based on temporary differences between the financial reporting and the tax basis of assets and liabilities and operating loss and tax credit carry forwards. Deferred tax assets and liabilities are measured by applying enacted tax rates and laws and are released in the years in which the temporary differences are expected to be recovered or settled. The effect on deferred tax assets and liabilities of a change in tax rates is recognized in income in the period that includes the enactment date. Valuation allowances are provided against deferred tax assets when it is more likely than not that some portion or all of the deferred tax asset will not be realized.
Accounting for tax positions requires judgments, including estimating reserves for potential uncertainties. We also assess our ability to utilize tax attributes, including those in the form of carryforwards, for which the benefits have already been reflected in the financial statements. We do not record valuation allowances for deferred tax assets that we believe will be realized in future periods. While we believe the resulting tax balances as of December 31, 2009 and 2008 are appropriately accounted for in accordance with Topic 740, as applicable, the ultimate outcome of such matters could result in favorable or unfavorable adjustments to our consolidated financial statements and such adjustments could be material. See Note 16 of the Notes to Consolidated Financial Statements for further information regarding income taxes.
Basis of Presentation
Segment Reporting
We report our operations through five segments. The segments are as follows: (1) Americas, (2) EMEA, (3) Asia Pacific, (4) Global Investment Management and (5) Development Services. The Americas consists of operations located in the United States, Canada and selected parts of Latin America. EMEA mainly consists of operations in Europe, while Asia Pacific includes operations in Asia, Australia and New Zealand. The Global Investment Management business consists of investment management operations in the United States, Europe and Asia. The Development Services business consists of real estate development and investment activities primarily in the United States, which were acquired in the Trammell Crow Company Acquisition.
44
Table of Contents
Results of Operations
The following table sets forth items derived from our consolidated statements of operations for the years ended December 31, 2009, 2008 and 2007:
| Year Ended December 31, | |||||||||||||||||||||
| 2009 | 2008 | 2007 | |||||||||||||||||||
| (Dollars in thousands) | |||||||||||||||||||||
| Revenue |
$ | 4,165,820 | 100.0 | % | $ | 5,128,817 | 100.0 | % | $ | 6,034,249 | 100.0 | % | |||||||||
| Costs and expenses: |
|||||||||||||||||||||
| Cost of services |
2,447,885 | 58.8 | 2,926,721 | 57.1 | 3,200,718 | 53.0 | |||||||||||||||
| Operating, administrative and other |
1,383,579 | 33.2 | 1,747,082 | 34.1 | 1,988,658 | 33.0 | |||||||||||||||
| Depreciation and amortization |
99,473 | 2.4 | 102,817 | 1.9 | 113,269 | 1.9 | |||||||||||||||
| Goodwill and other non-amortizable intangible asset impairment |
— | — | 1,159,406 | 22.6 | — | — | |||||||||||||||
| Merger-related charges |
— | — | — | — | 56,932 | 0.9 | |||||||||||||||
| Total costs and expenses |
3,930,937 | 94.4 | 5,936,026 | 115.7 | 5,359,577 | 88.8 | |||||||||||||||
| Gain on disposition of real estate |
6,959 | 0.2 | 18,740 | 0.3 | 24,299 | 0.4 | |||||||||||||||
| Operating income (loss) |
241,842 | 5.8 | (788,469 | ) | (15.4 | ) | 698,971 | 11.6 | |||||||||||||
| Equity (loss) income from unconsolidated subsidiaries |
(34,095 | ) | (0.8 | ) | (80,130 | ) | (1.5 | ) | 64,939 | 1.0 | |||||||||||
| Other income (loss) |
3,880 | 0.1 | (7,686 | ) | (0.1 | ) | (37,534 | ) | (0.6 | ) | |||||||||||
| Interest income |
6,129 | 0.1 | 17,762 | 0.3 | 29,004 | 0.5 | |||||||||||||||
| Interest expense |
189,146 | 4.6 | 167,156 | 3.3 | 162,991 | 2.7 | |||||||||||||||
| Write-off of financing costs |
29,255 | 0.7 | — | — | — | — | |||||||||||||||
| (Loss) income from continuing operations before provision for income taxes |
(645 | ) | (0.1 | ) | (1,025,679 | ) | (20.0 | ) | 592,389 | 9.8 | |||||||||||
| Provision for income taxes |
26,993 | 0.6 | 50,810 | 1.0 | 192,643 | 3.2 | |||||||||||||||
| (Loss) income from continuing operations |
(27,638 | ) | (0.7 | ) | (1,076,489 | ) | (21.0 | ) | 399,746 | 6.6 | |||||||||||
| Income from discontinued operations, net of income taxes |
— | — | 26,748 | 0.5 | 5,308 | 0.1 | |||||||||||||||
| Net (loss) income |
(27,638 | ) | (0.7 | ) | (1,049,741 | ) | (20.5 | ) | 405,054 | 6.7 | |||||||||||
| Less: Net (loss) income attributable to non-controlling interests |
(60,979 | ) | (1.5 | ) | (37,675 | ) | (0.8 | ) | 14,549 | 0.2 | |||||||||||
| Net income (loss) attributable to CB Richard Ellis Group, Inc. |
$ | 33,341 | 0.8 | % | $ | (1,012,066 | ) | (19.7 | )% | $ | 390,505 | 6.5 | % | ||||||||
| EBITDA (1) |
$ | 372,079 | 8.9 | % | $ | 457,021 | 8.9 | % | $ | 834,264 | 13.8 | % | |||||||||
| (1) | Includes EBITDA related to discontinued operations of $16.9 million and $6.5 million for the years ended December 31, 2008 and 2007, respectively. |
EBITDA represents earnings before net interest expense, write-off of financing costs, income taxes, depreciation and amortization, and goodwill and other non-amortizable intangible asset impairment. Our management believes EBITDA is useful in evaluating our operating performance compared to that of other companies in our industry because the calculation of EBITDA generally eliminates the effects of financing and income taxes and the accounting effects of capital spending and acquisitions, which would include impairment charges of goodwill and intangible assets created from acquisitions. Such items may vary for different companies for reasons unrelated to overall operating performance. As a result, our management uses EBITDA as a measure to evaluate the operating performance of our various business segments and for other discretionary purposes,
45
Table of Contents
including as a significant component when measuring our operating performance under our employee incentive programs. Additionally, we believe EBITDA is useful to investors to assist them in getting a more accurate picture of our results from operations.
However, EBITDA is not a recognized measurement under U.S. generally accepted accounting principles, or GAAP, and when analyzing our operating performance, readers should use EBITDA in addition to, and not as an alternative for, net income as determined in accordance with GAAP. Because not all companies use identical calculations, our presentation of EBITDA may not be comparable to similarly titled measures of other companies. Furthermore, EBITDA is not intended to be a measure of free cash flow for our management’s discretionary use, as it does not consider certain cash requirements such as tax and debt service payments. The amounts shown for EBITDA also differ from the amounts calculated under similarly titled definitions in our debt instruments, which are further adjusted to reflect certain other cash and non-cash charges and are used to determine compliance with financial covenants and our ability to engage in certain activities, such as incurring additional debt and making certain restricted payments.
EBITDA is calculated as follows:
| Year Ended December 31, | ||||||||||
| 2009 | 2008 | 2007 | ||||||||
| (Dollars in thousands) | ||||||||||
| Net income (loss) attributable to CB Richard Ellis Group, Inc. |
$ | 33,341 | $ | (1,012,066 | ) | $ | 390,505 | |||
| Add: |
||||||||||
| Depreciation and amortization (1) |
99,473 | 102,909 | 113,694 | |||||||
| Goodwill and other non-amortizable intangible asset impairment |
— | 1,159,406 | — | |||||||
| Interest expense (2) |
189,146 | 167,805 | 164,829 | |||||||
| Write-off of financing costs |
29,255 | — | — | |||||||
| Provision for income taxes (3) |
26,993 | 56,853 | 194,255 | |||||||
| Less: |
||||||||||
| Interest income (4) |
6,129 | 17,886 | 29,019 | |||||||
| EBITDA (5) |
$ | 372,079 | $ | 457,021 | $ | 834,264 | ||||
| (1) | Includes depreciation and amortization related to discontinued operations of $0.1 million and $0.4 million for the years ended December 31, 2008 and 2007, respectively. |
| (2) | Includes interest expense related to discontinued operations of $0.6 million and $1.8 million for the years ended December 31, 2008 and 2007, respectively. |
| (3) | Includes provision for income taxes related to discontinued operations of $6.0 million and $1.6 million for the years ended December 31, 2008 and 2007, respectively. |
| (4) | Includes interest income related to discontinued operations of $0.1 million and $0.01 million for the years ended December 31, 2008 and 2007, respectively. |
| (5) | Includes EBITDA related to discontinued operations of $16.9 million and $6.5 million for the years ended December 31, 2008 and 2007, respectively. |
Year Ended December 31, 2009 Compared to Year Ended December 31, 2008
We reported consolidated net income of $33.3 million for the year ended December 31, 2009 on revenue of $4.2 billion as compared to consolidated net loss of $1.0 billion on revenue of $5.1 billion for the year ended December 31, 2008.
Our revenue on a consolidated basis for the year ended December 31, 2009 decreased by $963.0 million, or 18.8%, as compared to the year ended December 31, 2008. This decrease was primarily driven by weak worldwide sales and leasing activity as well as lower appraisal revenue, all resulting from the continuation of challenging global economic conditions. While our outsourcing business continued to add new clients and
46
Table of Contents
expand existing relationships, its revenue also declined slightly in the current year as a result of reduced client spending, a rise in vacancy rates of properties we manage as well as the effect of client consolidations and distress over the past two years. Foreign currency translation had a $129.2 million negative impact on total revenue during the year ended December 31, 2009.
Our cost of services on a consolidated basis decreased by $478.8 million, or 16.4%, during the year ended December 31, 2009 as compared to the year ended December 31, 2008. Our sales and leasing professionals generally are paid on a commission and bonus basis, which substantially correlates with our revenue performance. Accordingly, the decrease in revenue led to a corresponding decrease in commissions and bonuses. Foreign currency translation had an $83.9 million positive impact on cost of services during the year ended December 31, 2009. Cost of services as a percentage of revenue increased from 57.1% for the year ended December 31, 2008 to 58.8% for the year ended December 31, 2009. This increase was primarily driven by the large decrease in overall revenue and a shift in the mix of revenues with outsourcing, including reimbursables, comprising a materially greater portion of the total than in the prior year period.
Our operating, administrative and other expenses on a consolidated basis decreased by $363.5 million, or 20.8%, during the year ended December 31, 2009 as compared to the year ended December 31, 2008. This decrease was driven by cost reduction measures that started in 2008 and continued through 2009, which led to lower operating costs, particularly payroll-related, travel and marketing costs. The decrease was also driven by reduced bonus expense resulting from lower business performance. Foreign currency translation had a $40.9 million positive impact on total operating expenses during the year ended December 31, 2009. As a result of our aggressive cost cutting measures, operating expenses as a percentage of revenue decreased to 33.2% for the year ended December 31, 2009 from 34.1% for the year ended December 31, 2008.
Our depreciation and amortization expense on a consolidated basis decreased by $3.3 million, or 3.3%, for the year ended December 31, 2009 as compared to the year ended December 31, 2008. This decline was mainly driven by lower depreciation expense resulting from decreased capital expenditures.
Our gain on disposition of real estate on a consolidated basis was $7.0 million and $18.7 million for the years ended December 31, 2009 and 2008, respectively. These gains resulted from activity within our Development Services segment.
Our equity loss from unconsolidated subsidiaries on a consolidated basis decreased by $46.0 million, or 57.5%, for the year ended December 31, 2009 as compared to the year ended December 31, 2008. This decrease was primarily driven by lower non-cash write-downs resulting from declines in value of investments in our Development Services and Global Investment Management segments in the current year. Also contributing to this variance was a $14.7 million non-cash write-down of our investment in Realty Finance Corporation, a mortgage REIT, within our Americas segment attributable to a decline in its market valuation in 2008, which did not recur in 2009.
Our consolidated interest income was $6.1 million for the year ended December 31, 2009, a decrease of $11.6 million, or 65.5%, as compared to the year ended December 31, 2008. This decrease was mainly driven by lower interest income earned in our Development Services segment due to a decrease in notes receivable in the current year and in our Americas and EMEA segments as a result of lower interest rates in the current year.
Our consolidated interest expense increased by $22.0 million during the year ended December 31, 2009, or 13.2%, as compared to the year ended December 31, 2008. The increase was primarily due to higher interest expense associated with the $450.0 million of 11.625% senior subordinated notes issued in June 2009, partially offset by lower interest expense associated with our credit agreement, mainly due to lower average outstanding debt balances in the current year.
We wrote off $29.3 million of financing costs during the year ended December 31, 2009 in connection with the amendment of our credit agreement on March 24, 2009.
47
Table of Contents
Our provision for income taxes on a consolidated basis was $27.0 million for the year ended December 31, 2009 as compared to $50.8 million for the year ended December 31, 2008. Our effective tax rate from continuing operations, after adjusting pre-tax (loss) income to remove the portion attributable to non-controlling interests, increased to 44.7% for the year ended December 31, 2009 as compared to negative 5.2% for the year ended December 31, 2008. The changes in our provision for income taxes and our effective tax rate were primarily the result of a sizeable loss reported in the prior year versus income in the current year, a change in our mix of domestic and foreign (losses) earnings as well as a large portion of the goodwill impairment charges incurred in the prior year being non-deductible for U.S. income tax purposes.
Our net loss attributable to non-controlling interests on a consolidated basis was $61.0 million for the year ended December 31, 2009 as compared to $37.7 million for the year ended December 31, 2008. This activity primarily reflects our non-controlling interests’ share of losses within our Development Services segment.
Year Ended December 31, 2008 Compared to Year Ended December 31, 2007
We reported consolidated net loss of $1.0 billion for the year ended December 31, 2008 on revenue of $5.1 billion as compared to consolidated net income of $390.5 million on revenue of $6.0 billion for the year ended December 31, 2007.
Our revenue on a consolidated basis for the year ended December 31, 2008 decreased by $905.4 million, or 15.0%, as compared to the year ended December 31, 2007. This was primarily due to significantly lower sales activity caused by the global credit market turmoil and soft leasing performance reflecting weaker economic conditions, particularly in the United States and the United Kingdom. Constraints in the capital markets also adversely affected the achievement of incentive based and carried interest revenue in our Global Investment Management segment. These declines were partially offset by the continued strong growth in outsourcing revenue. Foreign currency translation had a $29.5 million positive impact on total revenue during the year ended December 31, 2008.
Our cost of services on a consolidated basis decreased by $274.0 million, or 8.6%, during the year ended December 31, 2008 as compared to the year ended December 31, 2007. As previously mentioned, our sales and leasing professionals generally are paid on a commission and bonus basis, which substantially correlates with our revenue performance. Accordingly, the decrease in revenue led to a corresponding decrease in commissions and bonuses. These decreases were partially offset by an increase in reimbursable expenses within our outsourcing operations as well as increased compensation expense in our EMEA and Asia Pacific segments due to acquisitions and investment in growth of our platform. Foreign currency translation had a $13.6 million negative impact on cost of services during the year ended December 31, 2008. Cost of services as a percentage of revenue increased from 53.0% for the year ended December 31, 2007 to 57.1% for the year ended December 31, 2008. This increase was primarily driven by a shift in the mix of revenues with outsourcing, including reimbursables growth, comprising a greater portion of the total and a lower portion of revenue being non-commissionable as well as the aforementioned increase in compensation expense.
Our operating, administrative and other expenses on a consolidated basis decreased by $241.6 million, or 12.1%, during the year ended December 31, 2008 as compared to the year ended December 31, 2007. This decrease was primarily driven by reduced incentive compensation expense, including bonuses and carried interest expense (within our Global Investment Management segment), resulting from lower business performance and the benefit of cost reduction steps taken throughout 2008. These reductions were partially offset by real estate asset impairment charges incurred in our Development Services segment as well as higher worldwide occupancy costs. Foreign currency translation had a $16.2 million negative impact on total operating expenses during the year ended December 31, 2008. In 2008, we took aggressive actions to further improve efficiencies and contain costs in response to weakened macro market conditions. As a result of these actions, operating expenses as a percentage of revenue increased only slightly from 33.0% for the year ended December 31, 2007 to 34.1% for the year ended December 31, 2008, despite the significant decline in revenue.
48
Table of Contents
Our depreciation and amortization expense on a consolidated basis decreased by $10.5 million, or 9.2%, for the year ended December 31, 2008 as compared to the year ended December 31, 2007. This decrease was primarily driven by lower amortization expense related to intangible assets acquired in the Trammell Crow Company Acquisition, including net revenue backlog. As of December 31, 2007, the intangible asset representing the net revenue backlog acquired in the Trammell Crow Company Acquisition was fully amortized. Partially offsetting the decrease versus 2007 was higher depreciation expense mainly resulting from increased capital expenditures in connection with recent acquisitions.
Our goodwill and other non-amortizable intangible asset impairment on a consolidated basis was $1.2 billion for the year ended December 31, 2008. These impairment charges were primarily driven by adverse economic conditions causing a decline in the estimated future discounted cash flows for several of our reporting units.
Our merger-related charges on a consolidated basis were $56.9 million for the year ended December 31, 2007. These charges primarily consisted of severance and lease termination costs, which were attributable to the Trammell Crow Company Acquisition.
Our gain on disposition of real estate on a consolidated basis decreased by $5.6 million, or 22.9%, for the year ended December 31, 2008 as compared to the year ended December 31, 2007. This decrease resulted from activity within our Development Services segment. However, when combined with gains included within “discontinued operations,” our year-over-year total gain from disposition of real estate has increased from 2007 by $19.4 million, or 60.2%. However, the year ended December 31, 2007 was significantly impacted by purchase accounting for the Trammell Crow Company Acquisition, which required the write-up of assets to fair value upon acquisition, thereby eliminating a large amount of gains in 2007.
Our equity loss from unconsolidated subsidiaries on a consolidated basis was $80.1 million for the year ended December 31, 2008 as compared to equity income from unconsolidated subsidiaries of $64.9 million for the year ended December 31, 2007. The loss in 2008 was primarily attributable to non-cash write-downs of $76.3 million of investments, particularly in our Global Investment Management and Development Services segments, resulting from other than temporary impairments due to declines in market valuations. The income in 2007 was mainly due to equity income generated by our Development Services segment as well as dispositions within selected funds in our Global Investment Management segment, both of which did not recur in 2008.
Our other loss on a consolidated basis was $7.7 million for the year ended December 31, 2008 as compared to $37.5 million for the year ended December 31, 2007. The loss for the year ended December 31, 2008 related to the write-down of an investment maintained within our Global Investment Management segment due to a decline in market valuation. Our other loss of $37.5 million for the year ended December 31, 2007 primarily related to the sale of Trammell Crow Company’s approximately 19% ownership interest in Savills plc, a real estate services company based in the United Kingdom. This sale resulted in a pre-tax loss of $34.9 million, which was largely driven by stock price depreciation at the date of sale as compared to December 31, 2006 when the investment was marked to market.
Our consolidated interest income was $17.8 million during the year ended December 31, 2008, a decrease of $11.2 million, or 38.8%, as compared to the year ended December 31, 2007. This decrease was mainly driven by lower interest income earned in our Americas segment primarily resulting from higher average cash balances in 2007 as a result of cash received on the sale of Trammell Crow Company’s interest in Savills plc and interest income earned on restricted cash held related to former shareholders of Trammell Crow Company common stock.
Our consolidated interest expense increased by $4.2 million during the year ended December 31, 2008, or 2.6%, as compared to the year ended December 31, 2007. The increase was primarily due to higher interest
49
Table of Contents
expense incurred within our Development Services segment, partially mitigated by lower interest expense associated with our credit agreement, as lower interest rates more than offset the impact of higher average debt balances outstanding.
Our provision for income taxes on a consolidated basis was $50.8 million for the year ended December 31, 2008 as compared to $192.6 million for the year ended December 31, 2007. The decrease in the provision for income taxes was mainly attributable to a significant pre-tax loss reported for 2008 as compared to sizeable pre-tax income in 2007. Our effective tax rate, after adjusting pre-tax (loss) income to remove the portion attributable to non-controlling interests, decreased to negative 5.2% for the year ended December 31, 2008 from 33.2% for the year ended December 31, 2007. The decrease in our effective tax rate was primarily driven by a large portion of our 2008 goodwill impairment charges being non-deductible for U.S. income tax purposes.
Our net loss attributable to non-controlling interests on a consolidated basis was $37.7 million for the year ended December 31, 2008 as compared to net income attributable to non-controlling interests of $14.5 million for the year ended December 31, 2007. This variance primarily reflects our non-controlling interests’ share of the impairment of real estate assets within our Development Services segment.
50
Table of Contents
Segment Operations
The following table summarizes our revenue, costs and expenses and operating income (loss) by our Americas, EMEA, Asia Pacific, Global Investment Management and Development Services operating segments for the years ended December 31, 2009, 2008 and 2007.
| Year Ended December 31, | |||||||||||||||||||||
| 2009 | 2008 | 2007 | |||||||||||||||||||
| (Dollars in thousands) | |||||||||||||||||||||
| Americas |
|||||||||||||||||||||
| Revenue |
$ | 2,594,127 | 100.0 | % | $ | 3,209,820 | 100.0 | % | $ | 3,689,737 | 100.0 | % | |||||||||
| Costs and expenses: |
|||||||||||||||||||||
| Cost of services |
1,649,535 | 63.6 | 1,988,319 | 61.9 | 2,272,146 | 61.6 | |||||||||||||||
| Operating, administrative and other |
707,135 | 27.3 | 868,987 | 27.1 | 975,673 | 26.4 | |||||||||||||||
| Depreciation and amortization |
56,883 | 2.1 | 59,871 | 1.9 | 77,076 | 2.1 | |||||||||||||||
| Goodwill and other non-amortizable intangible asset impairment |
— | — | 805,190 | 25.1 | — | — | |||||||||||||||
| Merger-related charges |
— | — | — | — | 55,620 | 1.5 | |||||||||||||||
| Operating income (loss) |
$ | 180,574 | 7.0 | % | $ | (512,547 | ) | (16.0 | )% | $ | 309,222 | 8.4 | % | ||||||||
| EBITDA (1) |
$ | 248,238 | 9.6 | % | $ | 345,243 | 10.8 | % | $ | 365,004 | 9.9 | % | |||||||||
| EMEA |
|||||||||||||||||||||
| Revenue |
$ | 818,136 | 100.0 | % | $ | 1,080,725 | 100.0 | % | $ | 1,314,019 | 100.0 | % | |||||||||
| Costs and expenses: |
|||||||||||||||||||||
| Cost of services |
483,885 | 59.1 | 612,444 | 56.7 | 650,824 | 49.5 | |||||||||||||||
| Operating, administrative and other |
265,667 | 32.5 | 366,369 | 33.9 | 398,339 | 30.4 | |||||||||||||||
| Depreciation and amortization |
11,158 | 1.4 | 13,272 | 1.2 | 12,324 | 0.9 | |||||||||||||||
| Goodwill impairment |
— | — | 138,631 | 12.8 | — | — | |||||||||||||||
| Merger-related charges |
— | — | — | — | 1,240 | 0.1 | |||||||||||||||
| Operating income (loss) |
$ | 57,426 | 7.0 | % | $ | (49,991 | ) | (4.6 | )% | $ | 251,292 | 19.1 | % | ||||||||
| EBITDA (1) |
$ | 66,545 | 8.1 | % | $ | 105,474 | 9.8 | % | $ | 261,199 | 19.9 | % | |||||||||
| Asia Pacific |
|||||||||||||||||||||
| Revenue |
$ | 524,308 | 100.0 | % | $ | 558,183 | 100.0 | % | $ | 548,650 | 100.0 | % | |||||||||
| Costs and expenses: |
|||||||||||||||||||||
| Cost of services |
314,465 | 60.0 | 325,958 | 58.4 | 277,748 | 50.6 | |||||||||||||||
| Operating, administrative and other |
155,136 | 29.6 | 181,903 | 32.6 | 179,329 | 32.7 | |||||||||||||||
| Depreciation and amortization |
8,726 | 1.6 | 9,079 | 1.6 | 6,489 | 1.2 | |||||||||||||||
| Operating income |
$ | 45,981 | 8.8 | % | $ | 41,243 | 7.4 | % | $ | 85,084 | 15.5 | % | |||||||||
| EBITDA (1) |
$ | 53,900 | 10.3 | % | $ | 48,357 | 8.7 | % | $ | 82,775 | 15.1 | % | |||||||||
| Global Investment Management |
|||||||||||||||||||||
| Revenue |
$ | 141,445 | 100.0 | % | $ | 161,200 | 100.0 | % | $ | 347,883 | 100.0 | % | |||||||||
| Costs and expenses: |
|||||||||||||||||||||
| Operating, administrative and other |
119,878 | 84.8 | 120,401 | 74.7 | 252,437 | 72.6 | |||||||||||||||
| Depreciation and amortization |
4,901 | 3.4 | 4,182 | 2.6 | 2,798 | 0.8 | |||||||||||||||
| Goodwill impairment |
— | — | 44,922 | 27.9 | — | — | |||||||||||||||
| Operating income (loss) |
$ | 16,666 | 11.8 | % | $ | (8,305 | ) | (5.2 | )% | $ | 92,648 | 26.6 | % | ||||||||
| EBITDA(1) |
$ | 4,112 | 2.9 | % | $ | (7,615 | ) | (4.7 | )% | $ | 113,068 | 32.5 | % | ||||||||
| Development Services |
|||||||||||||||||||||
| Revenue |
$ | 87,804 | 100.0 | % | $ | 118,889 | 100.0 | % | $ | 133,960 | 100.0 | % | |||||||||
| Costs and expenses: |
|||||||||||||||||||||
| Operating, administrative and other |
135,763 | 154.6 | 209,422 | 176.1 | 182,880 | 136.5 | |||||||||||||||
| Depreciation and amortization |
17,805 | 20.3 | 16,413 | 13.8 | 14,582 | 10.8 | |||||||||||||||
| Goodwill and other non-amortizable intangible asset impairment |
— | — | 170,663 | 143.5 | — | — | |||||||||||||||
| Merger-related charges |
— | — | — | — | 72 | 0.1 | |||||||||||||||
| Gain on disposition of real estate |
6,959 | 7.9 | 18,740 | 15.7 | 24,299 | 18.1 | |||||||||||||||
| Operating loss |
$ | (58,805 | ) | (67.0 | )% | $ | (258,869 | ) | (217.7 | )% | $ | (39,275 | ) | (29.3 | )% | ||||||
| EBITDA (1) (2) |
$ | (716 | ) | (0.8 | )% | $ | (34,438 | ) | (29.0 | )% | $ | 12,218 | 9.1 | % | |||||||
| (1) | See Note 23 of the Notes to Consolidated Financial Statements for a reconciliation of segment EBITDA to the most comparable financial measure calculated and presented in accordance with GAAP, which is segment net income (loss) attributable to CB Richard Ellis Group, Inc. |
| (2) | Includes EBITDA related to discontinued operations of $16.9 million and $6.5 million for the years ended December 31, 2008 and 2007, respectively. |
51
Table of Contents
Year Ended December 31, 2009 Compared to Year Ended December 31, 2008
Americas
Revenue decreased by $615.7 million, or 19.2%, for the year ended December 31, 2009 as compared to the year ended December 31, 2008. This decrease was primarily driven by lower sales and leasing activity due to weak global economic conditions. Foreign currency translation had a $26.7 million negative impact on total revenue during the year ended December 31, 2009.
Cost of services decreased by $338.8 million, or 17.0%, for the year ended December 31, 2009 as compared to the year ended December 31, 2008, primarily due to lower commission expense resulting from lower sales and lease transaction revenue. Foreign currency translation had a $19.2 million positive impact on cost of services during the year ended December 31, 2009. Cost of services as a percentage of revenue increased to 63.6% for the year ended December 31, 2009 from 61.9% for the year ended December 31, 2008 primarily due to the large decrease in overall revenue and a shift in our business mix more towards outsourcing services.
Operating, administrative and other expenses decreased by $161.9 million, or 18.6%, mainly driven by cost containment measures put in place in 2008 and 2009, which led to a reduction in operating costs, particularly lower payroll-related, travel and marketing costs. Foreign currency translation had a $7.2 million positive impact on total operating expenses during the year ended December 31, 2009.
EMEA
Revenue decreased by $262.6 million, or 24.3%, for the year ended December 31, 2009 as compared to the year ended December 31, 2008. This decline was primarily attributable to lower sales, leasing and appraisal activities throughout the region. Foreign currency translation had an $80.0 million negative impact on total revenue during the year ended December 31, 2009.
Cost of services decreased by $128.6 million, or 21.0%, for the year ended December 31, 2009 as compared to the year ended December 31, 2008. This decrease was driven by foreign currency translation, which had a $53.8 million positive impact on cost of services during the year ended December 31, 2009. Lower bonuses and commission expense resulting from lower revenue also contributed to the variance. Cost of services as a percentage of revenue increased from 56.7% for the year ended December 31, 2008 to 59.1% for the year ended December 31, 2009, primarily driven by the sharp decline in revenue.
Operating, administrative and other expenses decreased by $100.7 million, or 27.5%, mainly due to aggressive actions taken to cut costs, which led to a reduction in operating costs, particularly lower payroll-related, travel and marketing costs. A reduction in bonuses resulting from the lower business performance also contributed to the variance. Foreign currency translation had a $26.7 million positive impact on total operating expenses during the year ended December 31, 2009.
Asia Pacific
Revenue decreased by $33.9 million, or 6.1%, for the year ended December 31, 2009 as compared to the year ended December 31, 2008. This revenue decrease was primarily driven by lower sales and leasing activity throughout the region. Foreign currency translation had a $14.0 million negative impact on total revenue during the year ended December 31, 2009.
Cost of services decreased by $11.5 million, or 3.5%, mainly due to foreign currency translation, which had a $10.9 million positive impact on cost of services for the year ended December 31, 2009. Cost of services as a percentage of revenue increased from 58.4% for the year ended December 31, 2008 to 60.0% for the year ended December 31, 2009, primarily driven by the significant decline in overall revenue as well as a shift in our business mix more towards outsourcing services.
52
Table of Contents
Operating, administrative and other expenses decreased by $26.8 million, or 14.7%, for the year ended December 31, 2009 as compared to the year ended December 31, 2008. This decrease was primarily due to lower operating costs, including payroll-related, travel and marketing costs, which were driven by cost containment measures put in place during 2008 and 2009. Foreign currency translation had a $1.9 million positive impact on total operating expenses during the year ended December 31, 2009.
Global Investment Management
Revenue decreased by $19.8 million, or 12.3%, for the year ended December 31, 2009 as compared to the year ended December 31, 2008 due to lower asset management, acquisition, disposition and incentive fees in the current year resulting from the continuation of constraints in the capital markets. Foreign currency translation had an $8.5 million negative impact on total revenue during the year ended December 31, 2009.
Operating, administrative and other expenses was relatively consistent at $119.9 million for the year ended December 31, 2009 as compared to $120.4 million for the year ended December 31, 2008. This slight decline was primarily due to a reduction in bonuses, which resulted from the lower business performance, and lower operating costs, particularly travel, driven by cost containment measures put in place in 2008 and 2009. These decreases were mostly offset by a lower net reversal of carried interest incentive compensation expense in the current year for dedicated Global Investment Management executives and team leaders with participation interests in certain real estate investments under management. Excluding the impact of reversing net carried interest incentive compensation expense accruals, which totaled $9.6 million and $33.1 million for the years ended December 31, 2009 and 2008, respectively, operating expenses decreased by 15.7% compared with the prior year. Foreign currency translation had a $5.1 million positive impact on total operating expenses during the year ended December 31, 2009.
Total assets under management (AUM) as of December 31, 2009 totaled $34.7 billion, down 10% from year-end 2008.
AUM generally refers to the properties and other assets with respect to which we provide (or participate in) oversight, investment management services and other advice, and which generally consist of real estate properties or loans, securities portfolios and investments in operating companies and joint ventures. Our AUM is intended principally to reflect the extent of our presence in the real estate market, not the basis for determining our management fees. Our material assets under management consist of:
| a) | the total fair market value of the real estate properties and other assets either wholly-owned or held by joint ventures and other entities in which our sponsored funds or investment vehicles and client accounts have invested or to which they have provided financing. Committed (but unfunded) capital from investors in our sponsored funds is not included in this component of our AUM. The value of development properties is included at estimated completion cost. In the case of real estate operating companies, the total value of real properties controlled by the companies, generally through joint ventures, is included in AUM; and |
| b) | the net asset value of our managed securities portfolios, including investments (which may be comprised of committed but uncalled capital) in private real estate funds under our fund of funds program. |
Our calculation of AUM may differ from the calculations of other asset managers, and as a result this measure may not be comparable to similar measures presented by other asset managers. Our definition of AUM is not based on any definition of assets under management that is set forth in the agreements governing the investment funds that we manage.
53
Table of Contents
Development Services
Revenue decreased by $31.1 million, or 26.1%, for the year ended December 31, 2009 as compared to the year ended December 31, 2008 primarily due to lower construction revenue and development fees driven by the continuation of weak market conditions.
Operating, administrative and other expenses decreased by $73.7 million, or 35.2%, for the year ended December 31, 2009 as compared to the year ended December 31, 2008. The decrease was primarily driven by lower impairment charges related to real estate assets, which totaled $38.6 million and $59.3 million for the years ended December 31, 2009 and 2008, respectively. Also contributing to the decrease in the current year were lower construction costs and a decrease in payroll-related costs, including bonuses, as a result of cost containment efforts in 2008 through 2009 as well as lower business performance in the current year.
Development projects in process as of December 31, 2009 totaled $4.7 billion, down 16% from year-end 2008. The inventory of pipeline deals as of December 31, 2009 stood at $0.9 billion, down 64% from year-end 2008 as a result of the weak market conditions.
Year Ended December 31, 2008 Compared to Year Ended December 31, 2007
Americas
Revenue decreased by $479.9 million, or 13.0%, for the year ended December 31, 2008 as compared to the year ended December 31, 2007. The continued growth of our outsourcing business was more than offset by the impact of lower sales, commercial mortgage brokerage and appraisal activity brought about by the credit market turmoil as well as reduced leasing activity due to the economic downturn. Foreign currency translation had a $5.6 million positive impact on total revenue during the year ended December 31, 2008.
Cost of services decreased by $283.8 million, or 12.5%, for the year ended December 31, 2008 as compared to the year ended December 31, 2007, primarily due to lower commission expense resulting from lower sales and lease transaction revenue, partially offset by an increase in reimbursable expenses within our outsourcing operations. Foreign currency translation had a $1.7 million negative impact on cost of services during the year ended December 31, 2008. Cost of services as a percentage of revenue was consistent between periods at 61.9% for the year ended December 31, 2008 versus 61.6% for the year ended December 31, 2007.
Operating, administrative and other expenses decreased by $106.7 million, or 10.9%, mainly driven by lower payroll-related costs, including bonuses, resulting from lower business performance and the benefit of cost containment measures put in place in 2008, which also led to lower travel and marketing costs. Foreign currency translation had a $3.3 million negative impact on total operating expenses during the year ended December 31, 2008.
EMEA
Revenue decreased by $233.3 million, or 17.8%, for the year ended December 31, 2008 as compared to the year ended December 31, 2007. Lower sales and lease transaction revenue was partially offset by contributions from recent acquisitions, including operations in Russia, acquired in late 2006, as well as operations in Romania and Denmark, acquired in early 2008. Foreign currency translation had a $1.8 million positive impact on total revenue during the year ended December 31, 2008.
Cost of services decreased by $38.4 million, or 5.9%, for the year ended December 31, 2008 as compared to the year ended December 31, 2007. This decrease was mainly driven by lower bonuses and commission expense due to the lower transaction revenue. These decreases were partially offset by higher producer compensation expense resulting from investments in headcount and acquisitions related to our efforts to grow and diversify operations in this region as well as a curtailment gain of $10.0 million recognized in 2007 as a result of the
54
Table of Contents
freezing of our U.K. defined benefit pension plans (see Note 15 of the Notes to Consolidated Financial Statements). Foreign currency translation had a $2.3 million negative impact on cost of services during the year ended December 31, 2008. Cost of services as a percentage of revenue increased from 49.5% for the year ended December 31, 2007 to 56.7% for the year ended December 31, 2008, primarily driven by the aforementioned net increase in producer compensation expense as well as the sharp decline in revenue.
Operating, administrative and other expenses decreased by $32.0 million, or 8.0%, mainly due to reduced bonuses driven by lower results, partially offset by higher occupancy costs, partially attributable to our efforts to grow the business in this region. Foreign currency translation had a $6.1 million negative impact on total operating expenses during the year ended December 31, 2008.
Asia Pacific
Revenue increased by $9.5 million, or 1.7%, for the year ended December 31, 2008 as compared to the year ended December 31, 2007. This revenue increase was primarily driven by contributions from our acquisition of a majority interest in CBRE India during the third quarter of 2007 as well as improved performance in our outsourcing operations throughout the region. These increases were partially offset by lower sales transaction revenue across the region. Foreign currency translation had a $22.1 million positive impact on total revenue during the year ended December 31, 2008.
Cost of services increased by $48.2 million, or 17.4%, mainly due to higher costs associated with outsourcing operations as well as increased producer compensation expense driven by increased headcount, largely due to acquisitions. These increases were partially offset by lower commission expense resulting from the lower sales transaction revenue. Foreign currency translation had a $9.6 million negative impact on cost of services for the year ended December 31, 2008. Cost of services as a percentage of revenue increased from 50.6% for the year ended December 31, 2007 to 58.4% for the year ended December 31, 2008, primarily driven by the shift in our business mix more towards outsourcing services, as well as the aforementioned headcount increases, largely due to acquisitions.
Operating, administrative and other expenses increased by $2.6 million, or 1.4%, primarily due to an increase in costs, including payroll-related and occupancy, attributable to investment in growth of the business, including the impact of in-fill acquisitions. These increases were mostly offset by reduced bonuses driven by lower results. Foreign currency translation had a $7.9 million negative impact on total operating expenses during the year ended December 31, 2008.
Global Investment Management
Revenue decreased by $186.7 million, or 53.7%, for the year ended December 31, 2008 as compared to the year ended December 31, 2007 due to lower incentive fees and carried interest revenue recognized in 2008 as a result of constraints in the capital markets. Foreign currency translation had a negligible impact on total revenue during the year ended December 31, 2008.
Operating, administrative and other expenses decreased by $132.0 million, or 52.3%, primarily due to lower carried interest incentive compensation expense of $95.8 million recognized for dedicated Global Investment Management executives and team leaders with participation interests in certain real estate investments under management, including the net reversal of previously accrued carried interest incentive compensation of $33.1 million during the year ended December 31, 2008. Also contributing to the decrease were lower bonuses driven by the reduced revenues. Foreign currency translation had a $1.1 million positive impact on total operating expenses during the year ended December 31, 2008.
Total AUM as of December 31, 2008 were at $38.5 billion, up slightly from year-end 2007, reflecting active fundraising efforts and acquisition programs.
55
Table of Contents
Development Services
Revenue decreased by $15.1 million, or 11.3%, for the year ended December 31, 2008 as compared to the year ended December 31, 2007 primarily due to lower construction revenue and development fees driven by a decline in market conditions. These decreases were partially offset by higher rental revenues as a result of our holding real estate investments longer due to adverse current market conditions.
Operating, administrative and other expenses increased by $26.5 million, or 14.5%, primarily due to real estate asset impairment charges incurred in 2008 as well as higher real estate operating expenses. These increases were partially offset by lower bonuses attributable to lower results and a decrease in job construction costs, which correlated with the above mentioned construction revenue decrease.
Development projects in process as of December 31, 2008 totaled $5.6 billion compared to $6.5 billion as of December 31, 2007. The inventory of pipeline deals as of December 31, 2008 stood at $2.5 billion versus $2.7 billion as of December 31, 2007.
Liquidity and Capital Resources
We believe that we can satisfy our working capital requirements and funding of investments with internally generated cash flow and, as necessary, borrowings under our revolving credit facility. Our 2010 expected capital requirements include approximately $60 million of anticipated net capital expenditures. As of December 31, 2009, we had aggregate commitments of $34.9 million to fund future co-investments in our Global Investment Management business, all of which is expected to be funded in 2010. Additionally, as of December 31, 2009, we had committed to fund $25.6 million of additional capital to unconsolidated subsidiaries within our Development Services business, which we may be required to fund at any time. For more than a year, the global credit markets have experienced unprecedented tightening, which may affect both the availability and cost of our funding sources in the future.
During 2003 and 2006, we required substantial amounts of equity and debt financing to fund our acquisitions of Insignia and Trammell Crow Company. Absent extraordinary transactions such as these and the equity offerings we completed during the unprecedented recent global capital markets disruption, we historically have not sought external sources of financing and relied on our internally generated cash flow and our revolving credit facility to fund our working capital, capital expenditure and investment requirements. In the absence of such extraordinary events, our management anticipates that our cash flow from operations and our revolving credit facility would be sufficient to meet our anticipated cash requirements for the foreseeable future, but at a minimum for the next 12 months.
From time to time, we consider potential strategic acquisitions. Our management believes that any future significant acquisitions that we make most likely would require us to obtain additional debt or equity financing. In the past, we have been able to obtain such financing for material transactions on terms that our management believed to be reasonable. However, it is possible that we may not be able to find acquisition financing on favorable terms in the future if we decide to make any further material acquisitions.
Our long-term liquidity needs, other than those related to ordinary course obligations and commitments such as operating leases, generally are comprised of three elements. The first is the repayment of the outstanding and anticipated principal amounts of our long-term indebtedness. Our management is unable to project with certainty whether our long-term cash flow from operations will be sufficient to repay our long-term debt when it comes due. If this cash flow is insufficient, then our management expects that we would need to refinance such indebtedness or otherwise amend its terms to extend the maturity dates. Our management cannot make any assurances that such refinancings or amendments would be available on attractive terms, if at all.
The second long-term liquidity need is the repayment of obligations under our pension plans in the United Kingdom. Our subsidiaries based in the United Kingdom maintain two contributory defined benefit pension plans to provide retirement benefits to existing and former employees participating in the plans. With respect to these
56
Table of Contents
plans, our historical policy has been to contribute annually an amount to fund pension cost as actuarially determined and as required by applicable laws and regulations. Our contributions to these plans are invested and, if these investments do not perform in the future as well as we expect, we will be required to provide additional funding to cover the shortfall. During 2007, we reached agreements with the active members of these plans to freeze future pension plan benefits. In return, the active members became eligible to enroll in the CBRE Group Personal Pension Plan, a defined contribution plan in the United Kingdom. The underfunded status of our pension plans included in pension liability in the accompanying consolidated balance sheets was $64.9 million and $19.8 million at December 31, 2009 and 2008, respectively. We expect to contribute a total of $3.7 million to fund our pension plans for the year ending December 31, 2010.
The third long-term liquidity need is the repayment of obligations related to acquisitions. For example, in connection with our acquisitions of CB Richard Ellis KK (Japan) in 2006 and CB Richard Ellis South Asia Pte Ltd (India) in 2007, we incurred obligations with respect to the future purchase of non-controlling interests in such entities. As of December 31, 2009, we had $58.5 million of these obligations outstanding, which will be paid in 2010. In addition, as of December 31, 2009, we had a liability of $2.9 million attributable to our acquisition of Trammell Crow Company relating to outstanding shares of Trammell Crow Company that have not yet been tendered. All of our deferred purchase obligations are included in accounts payable and accrued expenses in the accompanying consolidated balance sheets.
In prior years, obligations related to our deferred compensation plans, or DCPs, were also a component of our long-term liquidity needs. On November 5, 2008, based on prevailing market conditions, our board of directors authorized our Chief Executive Officer to modify or to terminate our U.S. DCPs, subject to applicable regulatory requirements. We notified participants that we would modify the DCPs pursuant to the transition rules under Section 409A of the Internal Revenue Code of 1986 to allow participants to make new elections prior to December 31, 2008 to receive distributions of plan assets at dates they specified in 2009. These actions accelerated distributions from the DCPs of cash and shares of our Class A common stock to the participants of such DCPs but did not have any material effect on our statement of operations. In connection with such distributions in 2009, we will receive a cash tax benefit of approximately $95 million.
As of December 31, 2008, the accompanying consolidated balance sheets included an accumulated non-stock liability for our DCPs totaling $244.9 million and assets (in the form of insurance) set aside to cover the liability of $229.8 million. As of December 31, 2008, there were also 2,849,391 outstanding stock fund units under the DCPs, all of which were vested. Our stock fund unit deferrals included in additional paid-in capital totaled $5.5 million at December 31, 2008. All DCP liabilities and stock fund units that existed at December 31, 2008 were distributed to participants in 2009.
In January 2007, we sold Trammell Crow Company’s approximately 19% ownership interest in Savills plc, a real estate services company based in the United Kingdom, at a net loss, which was largely driven by stock price depreciation at the date of sale as compared to December 31, 2006 when the investment was marked to market. The pre-tax proceeds from the sale, net of selling costs, totaled approximately $311.0 million and were used to reduce net indebtedness.
In the fourth quarter of 2007, we completed the repurchase of 28,830,442 shares of our Class A common stock for a total cost of $635.0 million. This share repurchase program was funded out of our cash flow from operations as well as our revolving credit facility.
On November 18, 2008, we completed a public offering of 57,500,000 shares of our Class A common stock, which raised $206.7 million of net proceeds used for general corporate purposes, including the repayment of debt.
On June 10, 2009, we completed the sale of 13,440,860 shares of our Class A common stock through a direct placement to Paulson & Co. Inc., which raised approximately $97.6 million of net proceeds. On June 11, 2009, we completed the sale of 5,682,684 shares of our Class A common stock through an at-the-market offering
57
Table of Contents
program, which raised approximately $48.8 million of net proceeds. The net proceeds from these offerings were used for general corporate purposes, including the repayment of some of our outstanding indebtedness under our credit agreement.
In November 2009, we completed the sale of 28,289,960 shares of our Class A common stock pursuant to an at-the-market offering program, which raised approximately $293.8 million of net proceeds. We intend to use the proceeds from the offering for general corporate purposes, including the repayment of debt.
Historical Cash Flows
Operating Activities
Net cash provided by operating activities totaled $213.6 million for the year ended December 31, 2009 as compared to net cash used in operating activities of $130.4 million for the year ended December 31, 2008. The sharp increase in cash provided by operating activities during the year ended December 31, 2009 versus the prior year was primarily due to significantly lower bonus payments, income taxes and payments to vendors made in the current year. These decreases were partially offset by lower results in 2009 (excluding the impact of non-cash impairment charges) as well as the impact of a significant decrease in receivables in the prior year versus a slight increase in the current year.
Net cash used in operating activities totaled $130.4 million for the year ended December 31, 2008 as compared to net cash provided by operating activities of $648.2 million for the year ended December 31, 2007. The sharp increase in cash used in operating activities during 2008 versus 2007 was primarily due to lower results and bonus accruals in 2008 as well as higher bonus payments associated with 2007 made in 2008. In addition, 2007 activity included approximately $311.0 million in proceeds received upon the sale of the approximately 19% ownership in Savills plc. These items were partially offset by a decrease in receivables driven by the lower results in 2008.
Investing Activities
Net cash used in investing activities totaled $119.4 million for the year ended December 31, 2009, a decrease of $299.6 million as compared to the year ended December 31, 2008. The decrease was primarily driven by the use of more cash in the prior year for in-fill acquisitions and purchases of real estate held for investment.
Net cash used in investing activities totaled $419.0 million for the year ended December 31, 2008, an increase of $134.6 million as compared to the year ended December 31, 2007. The increase was primarily driven by the use of cash for in-fill acquisitions and a larger decrease in restricted cash in 2007.
Financing Activities
Net cash provided by financing activities totaled $476.8 million for the year ended December 31, 2009, an increase of $102.8 million as compared to the year ended December 31, 2008. The increase was largely due to higher net proceeds received in connection with equity offerings in the current year and the issuance of our 11.625% senior subordinated notes in June 2009. These increases were partially offset by activity under our credit agreement, including $300.0 million of proceeds received from an additional term loan in connection with the exercise of the accordion provision of our credit agreement in 2008, partially offset by lower net borrowings under our revolving credit facility in the prior year as well as higher repayments of the senior secured term loans in the current year. Also offsetting the overall increase was lower net proceeds from notes payable on real estate within our Development Services segment in the current year.
Net cash provided by financing activities totaled $374.0 million for the year ended December 31, 2008 as compared to net cash used in financing activities of $277.3 million for the year ended December 31, 2007. The
58
Table of Contents
sharp increase in cash provided by financing activities during 2008 versus 2007 was largely due to $206.7 million of proceeds from the secondary public offering of our common stock in 2008 as well as activity under our credit agreement, including $300.0 million of proceeds received from an additional term loan in connection with the exercise of the accordion provision of our credit agreement in 2008 and higher repayments of the senior secured term loans in 2007, partially offset by higher net repayments under our revolving credit facility in 2008. In addition, the repurchase of $635.0 million of common stock in 2007 also contributed to the increase. Partially offsetting these increases were lower activities within our Development Services segment including lower non-controlling interest contributions, lower net short-term borrowings related to a revolving line of credit and lower net proceeds from notes payable on real estate.
Summary of Contractual Obligations and Other Commitments
The following is a summary of our various contractual obligations and other commitments as of December 31, 2009:
| Payments Due by Period | |||||||||||||||
| Contractual Obligations |
Total | Less than 1 year |
1 – 3 years | 4 – 5 years | More than 5 years | ||||||||||
| (Dollars in thousands) | |||||||||||||||
| Total debt (1) |
$ | 2,460,575 | $ | 478,454 | $ | 228,285 | $ | 1,022,138 | $ | 731,698 | |||||
| Operating leases (2) |
818,834 | 169,509 | 240,959 | 163,785 | 244,581 | ||||||||||
| Pension liability (3) (4) |
64,945 | 64,945 | — | — | — | ||||||||||
| Notes payable on real estate (recourse) (5) |
3,515 | 290 | 3,225 | — | — | ||||||||||
| Notes payable on real estate (non recourse) (5) |
547,762 | 160,806 | 257,704 | 57,178 | 72,074 | ||||||||||
| Deferred purchase consideration (6) |
61,385 | 61,385 | — | — | — | ||||||||||
| Total Contractual Obligations |
$ | 3,957,016 | $ | 935,389 | $ | 730,173 | $ | 1,243,101 | $ | 1,048,353 | |||||
| Amount of Other Commitments Expiration | |||||||||||||||
| Other Commitments |
Total | Less than 1 year |
1 – 3 years | 4 – 5 years | More than 5 years | ||||||||||
| (Dollars in thousands) | |||||||||||||||
| Letters of credit (2) |
$ | 34,866 | $ | 34,866 | $ | — | $ | — | $ | — | |||||
| Guarantees (2) (7) |
14,214 | 14,214 | — | — | — | ||||||||||
| Co-investments (2) (8) |
60,513 | 60,513 | — | — | — | ||||||||||
| Non-current tax liabilities (9) |
— | — | — | — | — | ||||||||||
| Other (10) |
20,833 | 20,833 | — | — | — | ||||||||||
| Total Other Commitments |
$ | 130,426 | $ | 130,426 | $ | — | $ | — | $ | — | |||||
| (1) | See Note 13 of our Notes to the Consolidated Financial Statements. Figures do not include scheduled interest payments. Assuming each debt obligation is held until maturity, we estimate that we will make the following interest payments (dollars in thousands): 2010—$147,582; 2011 to 2012—$268,309; 2013 to 2014—$189,056 and thereafter—$138,880. The interest payments on the variable rate debt have been calculated at the interest rate in effect at December 31, 2009. |
| (2) | See Note 14 of our Notes to the Consolidated Financial Statements. |
| (3) | See Note 15 of our Notes to the Consolidated Financial Statements. |
| (4) | Because these obligations are related, either wholly or partially, to the future retirement of our employees and such retirement dates are not predictable, an undeterminable portion of this amount will be paid in years one through five. |
| (5) | See Note 12 of our Notes to the Consolidated Financial Statements. Figures do not include scheduled interest payments. The notes (primarily construction loans) have either fixed or variable interest rates, ranging from 1.75% to 8.25% at December 31, 2009. In general, interest is drawn on the underlying loan and subsequently paid with proceeds received upon the sale of the real estate project. |
59
Table of Contents
| (6) | Represents the portion of the total purchase price for previous acquisitions that has not yet been paid and is included in accounts payable and accrued expenses in the accompanying consolidated balance sheets. As of December 31, 2009, this includes $51.5 million related to our acquisition of non-controlling interests in Japan and $7.0 million related to our acquisition of non-controlling interests in India, both of which will be paid in 2010. In addition, $2.9 million is attributable to our acquisition of Trammell Crow Company and relates to outstanding shares of Trammell Crow Company common stock that have not yet been tendered. Payment in full will be made as share certificates are tendered. |
| (7) | Due to the nature of guarantees, payments could be due at any time upon the occurrence of certain triggering events including default. Accordingly, all guarantees are reflected as expiring in less than one year. |
| (8) | Includes $34.9 million related to our Global Investment Management segment, all of which is expected to be funded in 2010 and $25.6 million related to our Development Services segment (callable at any time). |
| (9) | As of December 31, 2009, our non-current tax liabilities, including interest and penalties, was $73.5 million. We are unable to reasonably estimate the timing of the effective settlement of tax positions. |
| (10) | Represents outstanding reserves for claims under certain insurance programs, which are included in other current and other long-term liabilities in the accompanying consolidated balance sheets at December 31, 2009. Due to the nature of this item, payments could be due at any time upon the occurrence of certain events. Accordingly, the entire balance has been reflected as expiring in less than one year. |
Significant Indebtedness
Our level of indebtedness increases the possibility that we may be unable to generate cash sufficient to pay when due the principal of, interest on or other amounts due in respect of our indebtedness and other obligations. In addition, we may incur additional debt from time to time to finance strategic acquisitions, investments, joint ventures or for other purposes, subject to the restrictions contained in the documents governing our indebtedness. If we incur additional debt, the risks associated with our leverage, including our ability to service our debt, would increase.
Most of our long-term indebtedness was incurred in connection with the Trammell Crow Company Acquisition in December 2006. The Trammell Crow Company Acquisition has expanded our global leadership and strengthened our ability to provide integrated account management and comprehensive real estate services for our clients.
Since 2001, we have maintained a credit agreement with Credit Suisse, or CS, and other lenders to fund strategic acquisitions and to provide for our working capital needs. On December 20, 2006, we entered into an amendment and restatement to our credit agreement to, among other things, allow the consummation of the Trammell Crow Company Acquisition and the incurrence of senior secured term loan facilities for an aggregate principal amount of up to $2.2 billion. On March 27, 2008, we exercised the accordion provision of the credit agreement, which added an additional $300.0 million term loan. On March 24, 2009, we entered into a second amendment and restatement to our credit agreement (the Credit Agreement) with a syndicate of banks led by CS, as administrative and collateral agent, amending and restating our amended and restated credit agreement dated December 20, 2006. In connection with this amendment and restatement, we wrote off financing costs of $29.3 million during the year ended December 31, 2009, which included the write-off of $18.1 million of unamortized deferred financing costs and $11.2 million of Credit Agreement amendment fees paid in March 2009. On August 24, 2009, we entered into a loan modification agreement to our Credit Agreement, which included the conversion of $41.9 million of amounts outstanding under our revolving credit facility to term loans.
Subsequent to the August 24, 2009 loan modification, our Credit Agreement includes the following: (1) a $558.1 million revolving credit facility, including revolving credit loans, letters of credit and a swingline loan facility, with tranche 1 in the amount of $357.6 million maturing on June 24, 2011 and tranche 2 in the amount of $200.5 million maturing on June 24, 2013; (2) an $871.5 million A term loan facility, which is further broken down as follows: i) a $335.5 million tranche A term loan facility requiring quarterly principal payments through September 30, 2011, with the balance payable on December 20, 2011; ii) a $48.6 million tranche A-1 term loan facility payable on December 20, 2013; iii) a $290.3 million tranche A-2 term loan facility, requiring quarterly principal payments of $8.7 million beginning March 30, 2010 and continuing through March 31, 2013, with the balance payable on June 24, 2013; and iv) a $197.1 million tranche A-3 term loan facility payable on
60
Table of Contents
December 20, 2013; and (3) a $943.5 million B term loan facility, which is further broken down as follows: i) a $646.6 million tranche B term loan facility requiring quarterly principal payments of $1.9 million through September 30, 2013, with the balance payable on December 20, 2013; and ii) a $296.9 million tranche B-1 term loan facility payable on December 20, 2015. During the year ended December 31, 2009, we repaid the following amounts: $252.3 million of our tranche A term loan facility, which was applied to the required 2009 principal repayments and a portion of the first quarter 2010 principal payment; $52.0 million of our tranche A-1 term loan facility, which covered all the required quarterly principal payments and a portion of the balance due at maturity; $87.1 million of our tranche A-2 term loan facility, which was applied to quarterly principal payments from the first quarter of 2010 through the second quarter of 2012; $29.6 million of our tranche A-3 term loan facility, which covered a portion of the balance due at maturity; $9.3 million of our tranche B term loan facility, which covered all required quarterly principal payments in 2009; and $1.7 million of our tranche B-1 term loan facility, which covered a portion of the balance due at maturity. Some of these prepayments led to a reduction in the interest rate spreads governing our tranche A and A-1 term loan facilities as well as our revolving credit facility.
The revolving credit facility allows for borrowings outside of the United States, with sub-facilities of $5.0 million available to one of our Canadian subsidiaries, $35.0 million in aggregate available to one of our Australian and one of our New Zealand subsidiaries and $50.0 million available to one of our U.K. subsidiaries. Additionally, outstanding borrowings under these sub-facilities may be up to 5.0% higher as allowed under the currency fluctuation provision in the Credit Agreement. Borrowings under the revolving credit facility as of December 31, 2009 bear interest at varying rates, based at our option, on either the applicable fixed rate plus 2.25% to 4.00% or the daily rate plus 1.25% to 3.00% for the tranche 1 facility, and on either the applicable fixed rate plus 2.50% to 4.75% or the daily rate plus 1.50% to 3.75% for the tranche 2 facility, in all cases as determined by reference to our ratio of total debt less available cash to EBITDA (as defined in the Credit Agreement). As of December 31, 2009 and 2008, we had $21.1 million ($13.1 million under tranche 1 and $8.0 million under tranche 2) and $25.8 million, respectively, of revolving credit facility principal outstanding with related weighted average interest rates of 5.3% and 5.7%, respectively, which are included in short-term borrowings in the accompanying consolidated balance sheets. As of December 31, 2009, letters of credit totaling $29.0 million were outstanding under the revolving credit facility. These letters of credit primarily relate to letters of credit issued in the normal course of business as well as in connection with certain insurance programs and reduce the amount we may borrow under the revolving credit facility.
Borrowings under the term loan facilities as of December 31, 2009 bear interest, based on our option, on the following: for the tranche A term loan facility, on either the applicable fixed rate plus 2.75% to 4.50% or the daily rate plus 1.75% to 3.50%; for the tranche A-1 term loan facility, on either the applicable fixed rate plus 3.50% to 4.50% or the daily rate plus 2.50% to 3.50%; for the tranche A-2 term loan facility, on either the applicable fixed rate plus 3.25% to 5.50% or the daily rate plus 2.25% to 4.50%; for the tranche A-3 term loan facility, on either the applicable fixed rate plus 4.00% to 5.00% or the daily rate plus 3.00% to 4.00%; for the tranche B term loan facility, on either the applicable fixed rate plus 4.00% to 5.00% or the daily rate plus 3.00% to 4.00%; and for the tranche B-1 term loan facility, on either the applicable fixed rate plus 4.50% to 5.50% or the daily rate plus 3.50% to 4.50%. For all term loan facilities, both the fixed rate and daily rate options are determined by reference to our ratio of total debt less available cash to EBITDA (as defined in the Credit Agreement). The tranche A-1, A-2 and A-3 term loan facilities include a targeted outstanding amount (as defined in the Credit Agreement) provision that will increase the interest rate by 2% if the outstanding balance exceeds the targeted outstanding amount at the end of each quarter. As of December 31, 2009 and 2008, the outstanding balance did not exceed the targeted outstanding amount. As of December 31, 2009 and 2008, we had $326.3 million and $827.0 million of tranche A term loan facility principal outstanding, respectively, $48.6 million and $297.8 million of tranche A-1 term loan facility principal outstanding, respectively, and $642.8 million and $949.0 million of tranche B term loan facility principal outstanding, respectively, which are included in the accompanying consolidated balance sheets. As of December 31, 2009, we also had $203.2 million, $167.5 million and $295.2 million of tranche A-2 term loan facility principal outstanding, tranche A-3 term loan facility principal outstanding and tranche B-1 term loan facility principal outstanding, respectively, which are also included in the accompanying consolidated balance sheets.
61
Table of Contents
On February 26, 2007, we entered into two interest rate swap agreements with a total notional amount of $1.4 billion. On March 20, 2008, the total notional amount of the interest rate swap agreements was reduced to $950.0 million and on March 20, 2009, was further reduced to $410.0 million. The purpose of these interest rate swap agreements was to hedge potential changes to our cash flows due to the variable interest nature of our senior secured term loan facilities. On March 20, 2007, these interest rate swaps were designated as cash flow hedges. We incurred a loss on these interest rate swaps from the date we entered into the swaps up to the designation date of approximately $3.9 million. There was no hedge ineffectiveness for the years ended December 31, 2009 and 2008 or for the period March 20, 2007 through December 31, 2007. As of December 31, 2008, the fair value of these interest rate swap agreements was reflected as an $18.3 million liability and was included in other current liabilities in the accompanying consolidated balance sheets. The interest rate swaps expired on December 31, 2009.
The Credit Agreement is jointly and severally guaranteed by us and substantially all of our domestic subsidiaries. Borrowings under our Credit Agreement are secured by a pledge of substantially all of the capital stock of our U.S. subsidiaries and 65% of the capital stock of certain non-U.S. subsidiaries, and by a security interest in substantially all of the personal property of the U.S. subsidiaries. Also, the Credit Agreement requires us to pay a fee based on the total amount of the revolving credit facility commitment.
On June 18, 2009, CB Richard Ellis Serivces, Inc., our wholly-owned subsidiary, issued $450.0 million in aggregate principal amount of 11.625% senior subordinated notes due June 15, 2017 for approximately $435.9 million, net of discount. The 11.625% senior subordinated notes are unsecured senior subordinated obligations of CBRE and are jointly and severally guaranteed on a senior subordinated basis by us and our domestic subsidiaries that guarantee our Credit Agreement. Interest accrues at a rate of 11.625% per year and is payable semi-annually in arrears on June 15 and December 15. The 11.625% senior subordinated notes are redeemable at our option, in whole or in part, on or after June 15, 2013 at 105.813% of par on that date and at declining prices thereafter. At any time prior to June 15, 2013, the 11.625% senior subordinated notes may be redeemed by us, in whole or in part, at a price equal to 100% of the principal amount, plus accrued and unpaid interest and an applicable premium (as defined in the indenture governing these notes), which is based on the present value of the June 15, 2013 redemption price plus all remaining interest payments through June 15, 2013. In addition, prior to June 15, 2012, up to 35.0% of the original issued amount of the 11.625% senior subordinated notes may be redeemed at 111.625% of par, plus accrued and unpaid interest, solely with the net cash proceeds from public equity offerings. In the event of a change of control (as defined in the indenture governing our 11.625% senior subordinated notes), we are obligated to make an offer to purchase the remaining 11.625% senior subordinated notes at a redemption price of 101.0% of the principal amount, plus accrued and unpaid interest. The amount of the 11.625% senior subordinated notes included in the accompanying consolidated balance sheets, net of unamortized discount, was $436.5 million at December 31, 2009.
Our Credit Agreement and the indenture governing our 11.625% senior subordinated notes contain numerous restrictive covenants that, among other things, limit our ability to incur additional indebtedness, pay dividends or make distributions to stockholders, repurchase capital stock or debt, make investments, sell assets or subsidiary stock, create or permit liens on assets, engage in transactions with affiliates, enter into sale/leaseback transactions, issue subsidiary equity and enter into consolidations or mergers. Our Credit Agreement also currently requires us to maintain a minimum coverage ratio of EBITDA (as defined in the Credit Agreement) to total interest expense of 2.00x through March 31, 2011 and 2.25x thereafter and a maximum leverage ratio of total debt less available cash to EBITDA (as defined in the Credit Agreement) of 4.25x through March 31, 2011 and 3.75x thereafter.
From time to time, Moody’s Investor Service, Inc. and Standard & Poor’s Ratings Services rate our senior debt. On February 12, 2009, Moody’s downgraded our senior debt ratings from Ba1 to Ba2 with a negative outlook. Further, on March 10, 2009, Standard & Poor’s downgraded our ratings from BB+ to BB, and a recovery rating of 3 with a negative outlook. On June 10, 2009, Moody’s assigned a rating of Ba3 and Standard & Poor’s assigned a rating of B+ with a recovery rating of 6 to our 11.625% senior subordinated notes
62
Table of Contents
due June 15, 2017. Neither the Moody’s nor the Standard & Poor’s ratings impact our ability to borrow under our Credit Agreement. However, these ratings may impact our ability to borrow under new agreements in the future and the interest rates of any such future borrowings.
We had short-term borrowings of $339.8 million and $246.1 million with related average interest rates of 2.4% and 2.2% as of December 31, 2009 and 2008, respectively.
On March 2, 2007, we entered into a $50.0 million credit note with Wells Fargo Bank for the purpose of purchasing eligible investments, which include cash equivalents, agency securities, A1/P1 commercial paper and eligible money market funds. The proceeds of this note are not made generally available to us, but instead deposited in an investment account maintained by Wells Fargo Bank and used and applied solely to purchase eligible investment securities. This agreement has been amended several times and as of December 31, 2009, provides for a $40.0 million revolving credit note, bears interest at 0.25% and has a maturity date of November 1, 2010. As of December 31, 2009 and 2008, there were no amounts outstanding under this revolving credit note.
On March 4, 2008, we entered into a $35.0 million credit and security agreement with Bank of America, or BofA, for the purpose of purchasing eligible financial instruments, which include A1/P1 commercial paper, U.S. Treasury securities, GSE discount notes (as defined in the credit and security agreement) and money market funds. The proceeds of this note are not made generally available to us, but instead deposited in an investment account maintained by BofA and used and applied solely to purchase eligible financial instruments. Borrowings under the revolving note bear interest at 1.0%. In February 2009, the amount available to us under this arrangement was reduced to $5.0 million and the maturity date was extended to February 28, 2010. In February 2010, the maturity date was further extended to February 28, 2011. As of December 31, 2009 and 2008, there were no amounts outstanding under this revolving note.
On August 19, 2008, we entered into a $15.0 million uncommitted facility with First Tennessee Bank for the purpose of purchasing investments, which include cash equivalents, agency securities, A1/P1 commercial paper and eligible money market funds. The proceeds of this facility are not made generally available to us, but instead are held in a collateral account maintained by First Tennessee Bank. Borrowings under this facility bear interest at 0.25% and had an original maturity date of August 3, 2009. Effective August 3, 2009, the amount available under the agreement was reduced to $4.0 million and the maturity date was extended to August 3, 2010. As of December 31, 2009 and 2008, there were no amounts outstanding under this facility.
Our wholly-owned subsidiary CBRE Capital Markets has the following warehouse lines of credit: credit agreements with JP Morgan Chase Bank, N.A., or JP Morgan, and BofA for the purpose of funding mortgage loans that will be resold and a funding arrangement with Fannie Mae for the purpose of selling a percentage of certain closed multi-family loans. CBRE Capital Markets also had a funding arrangement with Red Mortgage Capital Inc., or Red Capital, for the purpose of funding originations of multi-family property mortgage loans, which was terminated on November 30, 2009.
On November 15, 2005, CBRE Capital Markets entered into a secured credit agreement with JP Morgan to establish a warehouse line of credit. This agreement has been amended several times and as of December 31, 2009, provides for a $210.0 million senior secured revolving line of credit, bears interest at the daily Chase-London LIBOR plus 2.00% and has a maturity date of January 29, 2010. Effective January 29, 2010, the maturity date was extended to January 28, 2011.
On April 16, 2008, CBRE Capital Markets entered into a secured credit agreement with BofA to establish a warehouse line of credit. This agreement has been amended several times and as of December 31, 2009, provides for a $125.0 million senior secured revolving line of credit, bears interest at the daily one-month LIBOR plus 2.75% and has a maturity date of April 14, 2010.
In August 2009, CBRE Capital Markets entered into a funding arrangement with Fannie Mae under its Multifamily As Soon As Pooled Plus Agreement and its Multifamily As Soon As Pooled Sale Agreement, or ASAP Program. Under the ASAP Program, CBRE Capital Markets may elect, on a transaction by transaction
63
Table of Contents
basis, to sell a percentage of certain closed multifamily loans to Fannie Mae on an expedited basis. After all contingencies are satisfied, the ASAP Program requires that CBRE Capital Markets repurchase the interest in the multifamily loan previously sold to Fannie Mae followed by either a full delivery back to Fannie Mae via whole loan execution or a securitization into a mortgage backed security. Under this agreement, the maximum outstanding under the ASAP Program cannot exceed $150.0 million and, between the sale date to Fannie Mae and the repurchase date by CBRE Capital Markets, the outstanding balance bears interest and is payable to Fannie Mae at the daily LIBOR rate plus 1.35% with a LIBOR floor of 0.35%. Effective December 1, 2009 through January 15, 2010, the maximum outstanding under the ASAP Program was temporarily increased from $150.0 million to $225.0 million.
In February 2008, CBRE Capital Markets established a funding arrangement with Red Capital for the purpose of funding originations of Freddie Mac and Fannie Mae multi-family property mortgage loans. The maximum availability to any one entity was $150.0 million and was reduced by any outstanding participation interests with any other entity. Additionally, no individual mortgage loan financed under the arrangement could exceed $50.0 million. Effective September 19, 2008, the rate on borrowings was the National City Bank one-month internal funds transfer rate plus 1.75%. Effective March 1, 2009, Red Capital established a new rate on borrowings of daily one-month LIBOR plus 2.50%. This funding arrangement was terminated by Red Capital effective November 30, 2009, with any outstanding line balances completely settled and paid off by December 15, 2009.
During the year ended December 31, 2009, we had a maximum of $508.0 million of warehouse lines of credit principal outstanding. As of December 31, 2009 and 2008, we had $312.9 million and $210.5 million of warehouse lines of credit principal outstanding, respectively, which are included in short-term borrowings in the accompanying consolidated balance sheets. Additionally, we had $315.0 million and $210.5 million of mortgage loans held for sale (warehouse receivables), which represented mortgage loans funded through the lines of credit that, while committed to be purchased, had not yet been purchased as of December 31, 2009 and 2008, respectively, and which are also included in the accompanying consolidated balance sheets.
On July 31, 2006, CBRE Capital Markets entered into a revolving credit note with JP Morgan for the purpose of purchasing qualified investment securities, which include but are not limited to U.S. Treasury and Agency securities. This agreement has been amended several times and as of December 31, 2009, provides for a $100.0 million revolving credit note, bears interest at 0.50% and has a maturity date of January 29, 2010. Effective January 29, 2010, the revolving credit note was reduced to $25.0 million and the maturity date was extended to January 28, 2011. As of December 31, 2009 and 2008, there were no amounts outstanding under this revolving credit note.
On April 30, 2007, Trammell Crow Company Acquisitions II, L.P. (Acquisitions II), a consolidated limited partnership within our Development Services segment, entered into a $100.0 million revolving credit agreement, or the WestLB Credit Agreement, with WestLB AG, as administrative agent for a lender group. During the second quarter of 2009, Acquisitions II opted to reduce the amount available under the WestLB Credit Agreement to $50.0 million. Borrowings under this credit agreement are used to fund acquisitions of real estate prior to receipt of capital contributions from Acquisitions II investors and permanent project financing, and are limited to a portion of unfunded capital commitments of certain Acquisitions II investors. As of December 31, 2009, borrowing capacity under this agreement, net of outstanding amounts drawn, was $22.4 million. Borrowings under this agreement bear interest at the daily British Bankers Association LIBOR rate plus 0.65% and this agreement expires on April 30, 2010. Subject to certain conditions, Acquisitions II can extend the maturity date of the credit facility for an additional term of not longer than six months. Borrowings under the line are non-recourse to us and are secured by the capital commitments of the investors in Acquisitions II. As of December 31, 2009 and 2008, there was $5.5 million and $8.0 million, respectively, outstanding under the WestLB Credit Agreement included in short-term borrowings in the accompanying consolidated balance sheets.
64
Table of Contents
Pension Liability
As previously mentioned, our subsidiaries based in the United Kingdom maintain two contributory defined benefit pension plans to provide retirement benefits to existing and former employees participating in the plans. The underfunded status of our pension plans included in pension liability in the accompanying consolidated balance sheets was $64.9 million and $19.8 million at December 31, 2009 and 2008, respectively. We expect to contribute a total of $3.7 million to fund our pension plans for the year ending December 31, 2010.
Other Obligations and Commitments
We had outstanding letters of credit totaling $34.9 million as of December 31, 2009, excluding letters of credit for which we have outstanding liabilities already accrued on our consolidated balance sheet related to our subsidiaries’ outstanding reserves for claims under certain insurance programs. These letters of credit are primarily executed by us in the normal course of business as well as in connection with certain insurance programs. The letters of credit expire at varying dates through December 2010.
We had guarantees totaling $14.2 million as of December 31, 2009, excluding guarantees related to pension liabilities, consolidated indebtedness and other obligations for which we have outstanding liabilities already accrued on our consolidated balance sheet as well as operating leases. The $14.2 million primarily consists of guarantees of obligations of unconsolidated subsidiaries, which expire at varying dates through March 2014.
In addition, as of December 31, 2009, we had numerous completion and budget guarantees relating to development projects. These guarantees are made by us in the normal course of our Development Services business. Each of these guarantees requires us to complete construction of the relevant project within a specified timeframe and/or within a specified budget, with us potentially being liable for costs to complete in excess of such timeframe or budget. However, we generally have “guaranteed maximum price” contracts with reputable general contractors with respect to projects for which we provide these guarantees. These contracts are intended to pass the risk to such contractors. While there can be no assurance, we do not expect to incur any material losses under these guarantees.
From time to time, we act as a general contractor with respect to construction projects. We do not consider these activities to be a material part of our business. In connection with these activities, we seek to subcontract construction work for certain projects to reputable subcontractors. Should construction defects arise relating to the underlying projects, we could potentially be liable to the client for the costs to repair such defects, although we would generally look to the subcontractor that performed the work to remedy the defect and also look to insurance policies that cover this work. While there can be no assurance, we do not expect to incur material losses with respect to construction defects.
In January 2008, CBRE Capital Markets entered into an agreement with Fannie Mae, under Fannie Mae’s Delegated Underwriting and Servicing, or DUS, Lender Program, to provide financing for apartments with five or more units. Under the DUS Program, CBRE Capital Markets originates, underwrites, closes and services loans without prior approval by Fannie Mae, and in selected cases, is subject to sharing up to one-third of any losses on loans issued under the DUS program. CBRE Capital Markets has funded loans subject to such loss sharing arrangements with unpaid principal balances of $1.1 billion. Additionally, CBRE Capital Markets has funded loans under the DUS program that are not subject to loss sharing arrangements with unpaid principal balances of approximately $378.3 million. CBRE Capital Markets, under its agreement with Fannie Mae, must post cash reserves under formulas established by Fannie Mae to provide for sufficient capital in the event losses occur. As of December 31, 2009 and 2008, CBRE Capital Markets had $1.2 million and $0.6 million, respectively, of cash deposited under this reserve arrangement, and had provided approximately $2.0 million and $0.2 million, respectively, of loan loss reserves.
65
Table of Contents
An important part of the strategy for our Global Investment Management business involves investing our capital in certain real estate investments with our clients. These co-investments typically range from 2% to 5% of the equity in a particular fund. As of December 31, 2009, we had aggregate commitments of $34.9 million to fund future co-investments, all of which is expected to be funded during 2010. In addition to required future capital contributions, some of the co-investment entities may request additional capital from us and our subsidiaries holding investments in those assets and the failure to provide these contributions could have adverse consequences to our interests in these investments.
Additionally, an important part of our Development Services business strategy is to invest in unconsolidated real estate subsidiaries as a principal (in most cases co-investing with our clients). As of December 31, 2009, we had committed to fund $25.6 million of additional capital to these unconsolidated subsidiaries, which may be called at any time.
Seasonality
A significant portion of our revenue is seasonal, which can affect an investor’s ability to compare our financial condition and results of operations on a quarter-by-quarter basis. Historically, this seasonality has caused our revenue, operating income, net income and cash flow from operating activities to be lower in the first two quarters and higher in the third and fourth quarters of each year. Earnings and cash flow have historically been particularly concentrated in the fourth quarter due to investors and companies focusing on completing transactions prior to calendar year-end. This has historically resulted in lower profits or a loss in the first and second quarters, with revenue and profitability improving in each subsequent quarter.
Inflation
Our commissions and other variable costs related to revenue are primarily affected by real estate market supply and demand, which may be affected by general economic conditions including inflation. However, to date, we do not believe that general inflation has had a material impact upon our operations.
New Accounting Pronouncements
In December 2008, the FASB issued FASB Staff Position, Statement of Financial Accounting Standards, or SFAS, No. 132R-1, “Employers’ Disclosures about Postretirement Benefit Plan Assets,” which is now included in the “Compensation-Retirement Benefits” Topic of the FASB ASC (Topic 715), requiring employers to provide additional disclosures about plan assets of a defined benefit pension or other post-retirement plan. These disclosures principally include information detailing investment policies and strategies, the major categories of plan assets, the inputs and valuation techniques used to measure the fair value of plan assets and an understanding of significant concentrations of risk within plan assets. As required, we have adopted this provision of Topic 715 and have expanded our disclosure requirements (see Note 15 of the Notes to Consolidated Financial Statements).
In December 2009, the FASB issued Accounting Standards Update, or ASU, 2009-16, “Transfers and Servicing (ASC Topic 860)—Accounting for Transfers of Financial Assets.” ASU 2009-16 revises previous authoritative guidance related to accounting for transfers of financial assets, and will require more disclosures about transfers of financial assets, including securitization transactions, and where entities have continuing exposure to the risks related to transferred financial assets. Among other things, ASU 2009-16 eliminates the concept of a “qualifying special-purpose entity,” changes the requirements for derecognizing financial assets and enhances information reported to users of financial statements by providing greater transparency about transfers of financial assets and an entity’s continuing involvement in transferred financial assets. ASU 2009-16 is effective at the start of a reporting entity’s first fiscal year beginning after November 15, 2009, with early application prohibited. We are currently evaluating the impact of adoption, but do not expect it to have a material effect on our consolidated financial position or results of operations.
66
Table of Contents
In December 2009, the FASB issued ASU 2009-17, “Consolidations (Topic 810): Improvements to Financial Reporting by Enterprises Involved with Variable Interest Entities.” This ASU incorporates SFAS No. 167, “Amendments to FASB Interpretation No. 46(R),” issued by the FASB in June 2009. The amendments in this ASU replace the quantitative-based risks and rewards calculation for determining which reporting entity, if any, has a controlling financial interest in a variable interest entity with an approach focused on identifying which reporting entity has the power to direct the activities of a variable interest entity that most significantly impact such entity’s economic performance and (i) the obligation to absorb losses of such entity or (ii) the right to receive benefits from such entity. ASU 2009-17 also requires additional disclosures about a reporting entity’s involvement in variable interest entities, which will enhance the information provided to users of financial statements. ASU 2009-17 is effective as of the start of the first annual and interim reporting periods beginning after November 15, 2009, with early adoption prohibited. We are currently evaluating the impact of adoption, but do not expect it to have a material effect on our consolidated financial position or results of operations.
In January 2010, the FASB issued ASU 2010-06, “Improving Disclosures about Fair Value Measurements,” which provides amendments to the FASB ASC Subtopic 820-10 that require new disclosures regarding (i) transfers in and out of Level 1 and Level 2 fair value measurements and (ii) activity in Level 3 fair value measurements. ASU 2010-06 also clarifies existing disclosures regarding (i) the level of asset and liability disaggregation and (ii) fair value measurement inputs and valuation techniques. The new disclosures and clarifications of existing disclosures are effective for interim and annual reporting periods beginning after December 15, 2009, except for the disclosures about purchases, sales, issuances, and settlements in the roll forward of activity in Level 3 fair value measurements. Those disclosures are effective for fiscal years beginning after December 15, 2010, and for interim periods within those fiscal years. We are currently evaluating the disclosure impact of adoption on our consolidated financial statements, but do not expect it to have a material impact.
Item 7A. Quantitative and Qualitative Disclosures About Market Risk
Our exposure to market risk consists of foreign currency exchange rate fluctuations related to our international operations and changes in interest rates on debt obligations.
Exchange Rates
During the year ended December 31, 2009, approximately 39.2% of our business was transacted in local currencies of foreign countries, the majority of which includes the euro, the British pound sterling, the Canadian dollar, the Hong Kong dollar, the Japanese yen, the Singapore dollar, the Australian dollar and the Indian rupee. We attempt to manage our exposure primarily by balancing assets and liabilities and maintaining cash positions in foreign currencies only at levels necessary for operating purposes. Fluctuations in foreign currency exchange rates affect reported amounts of our total assets and liabilities, which are reflected in our financial statements as translated into U.S. dollars for each financial reporting period at the exchange rate in effect on the respective balance sheet dates, and our total revenue and expenses, which are reflected in our financial statements as translated into U.S. dollars for each financial reporting period at the monthly average exchange rate. During the year ended December 31, 2009, foreign currency translation had a $129.2 million negative impact on our total revenue and a $124.8 million positive impact on our total costs of services and operating, administrative and other expenses.
We routinely monitor our exposure to currency exchange rate changes in connection with transactions and sometimes enter into foreign currency exchange swap, option and forward contracts to limit our exposure to such transactions, as appropriate. In the normal course of business, we also sometimes utilize derivative financial instruments in the form of foreign currency exchange contracts to mitigate foreign currency exchange exposure resulting from intercompany loans, expected cash flow and earnings. We apply the “Derivatives and Hedging” Topic of the Financial Accounting Standards Board (FASB) Accounting Standards Codification (ASC) (Topic 815) when accounting for any such contracts. In all cases, we view derivative financial instruments as a risk
67
Table of Contents
management tool and, accordingly, do not engage in any speculative activities with respect to foreign currency. On December 20, 2007, we entered into a foreign currency exchange forward contract with a notional amount of 46.0 million British pounds sterling, which expired on October 31, 2008, in order to hedge an intercompany loan. On February 28, 2008, we entered into three option agreements to sell a notional amount of 14.0 million of euros, 11.5 million of euros and 37.7 million of euros, which expired on June 26, 2008, September 26, 2008 and December 26, 2008, respectively. On December 22, 2008, we entered into a foreign currency exchange swap contract with an aggregate notional amount of 39.5 million British pounds sterling, which expired on February 18, 2009, at which time we entered into another contract with similar terms that was settled on April 6, 2009. On May 12, 2009, we entered into an option agreement to sell a notional amount of 25.0 million of euros, which expired on December 29, 2009. On June 26, 2009, we entered into two option agreements, including one to sell a notional amount of 5.5 million of British pounds sterling, which was exercised on September 28, 2009, and one to sell 10.0 million of British pounds sterling, which was sold on December 18, 2009. Included in the consolidated statements of operations were net losses of $3.7 million and net gains of $1.6 million for the years ended December 31, 2009 and 2008, respectively, resulting from net losses and gains on foreign currency exchange swap, option and forward contracts.
We also enter into loan commitments that relate to the origination or acquisition of commercial mortgage loans that will be held for resale. FASB ASC Topic 815 requires that these commitments be recorded at their fair values as derivatives. The net impact on our financial position and earnings resulting from these derivatives contracts has not been significant.
Interest Rates
We manage our interest expense by using a combination of fixed and variable rate debt. Excluding notes payable on real estate, our fixed and variable rate long-term debt at December 31, 2009 consisted of the following (dollars in thousands):
| Year of |
Fixed Rate |
Daily LIBOR + 1.35% with a floor of 0.35% |
Daily One-Month LIBOR +2.75% |
Daily Chase- London LIBOR +2.00% |
LIBOR + 3.00% (1) |
LIBOR + 3.50% (1) |
LIBOR + 4.00% (1) |
LIBOR + 4.50% (1) |
Six- Month LIBOR -2.00% (2) |
Daily British Bankers Association LIBOR + 0.65% |
(3) | Total | |||||||||||||||||||||||||||||||||||
| 2010 |
$ | 578 | $ | 133,615 | $ | 105,135 | $ | 74,122 | $ | 130,582 | $ | — | $ | 7,538 | $ | — | $ | 334 | $ | 5,500 | $ | 21,050 | $ | 478,454 | |||||||||||||||||||||||
| 2011 |
91 | — | — | — | 195,672 | — | 7,538 | — | — | — | — | 203,301 | |||||||||||||||||||||||||||||||||||
| 2012 |
28 | — | — | — | — | 17,418 | 7,538 | — | — | — | — | 24,984 | |||||||||||||||||||||||||||||||||||
| 2013 |
10 | — | — | — | — | 234,400 | 787,728 | — | — | — | — | 1,022,138 | |||||||||||||||||||||||||||||||||||
| 2014 |
— | — | — | — | — | — | — | — | — | — | — | — | |||||||||||||||||||||||||||||||||||
| Thereafter |
436,502 | — | — | — | — | — | — | 295,196 | — | — | — | 731,698 | |||||||||||||||||||||||||||||||||||
| Total |
$ | 437,209 | $ | 133,615 | $ | 105,135 | $ | 74,122 | $ | 326,254 | $ | 251,818 | $ | 810,342 | $ | 295,196 | $ | 334 | $ | 5,500 | $ | 21,050 | $ | 2,460,575 | |||||||||||||||||||||||
| Weighted Average Interest Rate |
11.6 | % | 1.7 | % | 3.0 | % | 2.2 | % | 5.0 | % | 5.5 | % | 6.0 | % | 6.5 | % | N/A | 0.9 | % | 5.3 | % | 6.4 | % | ||||||||||||||||||||||||
| (1) | Consists of amounts due under our senior secured term loan facilities. |
| (2) | As LIBOR fell below 2.00%, there is no interest due on these notes. |
| (3) | Consists of amounts due under our revolving credit facility as follows (dollars in thousands): $6,914 at Bank Bill Rate + 2.50%; $6,112 at LIBOR + 2.50%; $4,389 at LIBOR + 2.75% and $3,635 at Bank Bill Rate + 2.75%. |
We utilize sensitivity analyses to assess the potential effect of interest rate changes on our variable rate debt. If interest rates were to increase by 52 basis points, which would comprise approximately 10% of the weighted average interest rates of our outstanding variable rate debt, excluding notes payable on real estate, at December 31, 2009, the net impact would be an increase of $10.6 million on pre-tax loss and cash used in operating activities for the year ended December 31, 2009.
Based upon information from third-party banks, the estimated fair value of our senior secured term loans was approximately $1.6 billion at December 31, 2009. Based on dealers’ quotes, the estimated fair value of our 11.625% senior subordinated notes was $487.2 million at December 31, 2009.
68
Table of Contents
On February 26, 2007, we entered into two interest rate swap agreements with a total notional amount of $1.4 billion. On March 20, 2008, the total notional amount of the interest rate swap agreements was reduced to $950.0 million and on March 20, 2009, was further reduced to $410.0 million. The purpose of these interest rate swap agreements was to hedge potential changes to our cash flows due to the variable interest nature of our senior secured term loan facilities. On March 20, 2007, these interest rate swaps were designated as cash flow hedges. We incurred a loss on these interest rate swaps from the date we entered into the swaps up to the designation date of approximately $3.9 million. There was no hedge ineffectiveness for the years ended December 31, 2009 and 2008 or for the period March 20, 2007 through December 31, 2007. As of December 31, 2008, the fair value of these interest rate swap agreements was reflected as an $18.3 million liability and was included in other current liabilities in the accompanying consolidated balance sheets. The interest rate swaps expired on December 31, 2009.
We also have $551.3 million of notes payable on real estate as of December 31, 2009. These notes have interest rates ranging from 1.8% to 8.3% with maturity dates extending through 2023. Interest costs relating to notes payable on real estate include both interest that is expensed and interest that is capitalized as part of the cost of real estate. If interest rates were to increase by 10%, our total estimated interest cost related to these notes payable would increase by approximately $2.3 million for the year ended December 31, 2009.
From time to time, we enter into interest rate swap and cap agreements in order to limit our interest expense related to our notes payable on real estate. If any of these agreements are not designated as effective hedges, then they are marked to market each period with the change in fair market value recognized in current period earnings. The net impact on our financial position and earnings resulting from gains and/or losses on interest rate swap and cap agreements associated with notes payable on real estate has not been significant.
69
Table of Contents
Item 8. Financial Statements and Supplementary Data
INDEX TO CONSOLIDATED FINANCIAL STATEMENTS
AND FINANCIAL STATEMENT SCHEDULES
All other schedules are omitted because they are either not applicable, not required or the information required is included in the Consolidated Financial Statements, including the notes thereto.
70
Table of Contents
REPORT OF INDEPENDENT REGISTERED PUBLIC ACCOUNTING FIRM
The Board of Directors and Stockholders
CB Richard Ellis Group, Inc.:
We have audited the accompanying consolidated balance sheets of CB Richard Ellis Group, Inc. (the Company) and subsidiaries as of December 31, 2009 and 2008, and the related consolidated statements of operations, cash flows, equity and comprehensive income (loss) for each of the years in the two-year period ended December 31, 2009. In connection with our audits of the consolidated financial statements, we also have audited the related 2009 and 2008 information in the financial statement schedules. We also have audited the Company’s internal control over financial reporting as of December 31, 2009, based on criteria established in Internal Control—Integrated Framework issued by the Committee of Sponsoring Organizations of the Treadway Commission (COSO). The Company’s management is responsible for these consolidated financial statements and financial statement schedules, for maintaining effective internal control over financial reporting, and for its assessment of the effectiveness of internal control over financial reporting, included in the accompanying Management’s Report on Internal Control Over Financial Reporting. Our responsibility is to express an opinion on these consolidated financial statements and financial statement schedules and an opinion on the Company’s internal control over financial reporting based on our audits.
We conducted our audits in accordance with the standards of the Public Company Accounting Oversight Board (United States). Those standards require that we plan and perform the audit to obtain reasonable assurance about whether the financial statements are free of material misstatement and whether effective internal control over financial reporting was maintained in all material respects. Our audits of the consolidated financial statements included examining, on a test basis, evidence supporting the amounts and disclosures in the financial statements, assessing the accounting principles used and significant estimates made by management, and evaluating the overall financial statement presentation. Our audit of internal control over financial reporting included obtaining an understanding of internal control over financial reporting, assessing the risk that a material weakness exists, and testing and evaluating the design and operating effectiveness of internal control based on the assessed risk. Our audits also included performing such other procedures as we considered necessary in the circumstances. We believe that our audits provide a reasonable basis for our opinions.
A company’s internal control over financial reporting is a process designed to provide reasonable assurance regarding the reliability of financial reporting and the preparation of financial statements for external purposes in accordance with generally accepted accounting principles. A company’s internal control over financial reporting includes those policies and procedures that (1) pertain to the maintenance of records that, in reasonable detail, accurately and fairly reflect the transactions and dispositions of the assets of the company; (2) provide reasonable assurance that transactions are recorded as necessary to permit preparation of financial statements in accordance with generally accepted accounting principles, and that receipts and expenditures of the company are being made only in accordance with authorizations of management and directors of the company; and (3) provide reasonable assurance regarding prevention or timely detection of unauthorized acquisition, use, or disposition of the company’s assets that could have a material effect on the financial statements.
Because of its inherent limitations, internal control over financial reporting may not prevent or detect misstatements. Also, projections of any evaluation of effectiveness to future periods are subject to the risk that controls may become inadequate because of changes in conditions, or that the degree of compliance with the policies or procedures may deteriorate.
In our opinion, the consolidated financial statements referred to above present fairly, in all material respects, the financial position of CB Richard Ellis Group, Inc. and subsidiaries as of December 31, 2009 and 2008, and the results of their operations and their cash flows for each of the years in the two-year period ended December 31, 2009, in conformity with U.S. generally accepted accounting principles. Also in our opinion, the related 2009 and 2008 information in the financial statement schedules, when considered in relation to the basic consolidated
71
Table of Contents
financial statements taken as a whole, present fairly, in all material respects, the information set forth therein. Also in our opinion, CB Richard Ellis Group, Inc. maintained, in all material respects, effective internal control over financial reporting as of December 31, 2009, based on criteria established in Internal Control—Integrated Framework issued by the Committee of Sponsoring Organizations of the Treadway Commission.
/s/ KPMG LLP
Los Angeles, California
March 1, 2010
72
Table of Contents
REPORT OF INDEPENDENT REGISTERED PUBLIC ACCOUNTING FIRM
To the Board of Directors and Stockholders of
CB Richard Ellis Group, Inc.
Los Angeles, California
We have audited the accompanying consolidated statements of operations, cash flows, equity, and comprehensive income (loss) of CB Richard Ellis Group, Inc. and subsidiaries (the “Company”), for the year ended December 31, 2007. Our audit also included the financial statement schedule, Schedule II—Valuation and Qualifying Accounts, for the year end December 31, 2007 listed in the Index at Item 15. These financial statements and financial statement schedule are the responsibility of the Company’s management. Our responsibility is to express an opinion on these financial statements and financial statement schedule based on our audit.
We conducted our audit in accordance with the standards of the Public Company Accounting Oversight Board (United States). Those standards require that we plan and perform the audit to obtain reasonable assurance about whether the financial statements are free of material misstatement. An audit includes examining, on a test basis, evidence supporting the amounts and disclosures in the financial statements. An audit also includes assessing the accounting principles used and significant estimates made by management, as well as evaluating the overall financial statement presentation. We believe that our audit provides a reasonable basis for our opinion.
In our opinion, such 2007 consolidated financial statements present fairly, in all material respects, the results of their operations and their cash flows for the year ended December 31, 2007, in conformity with accounting principles generally accepted in the United States of America. Also, in our opinion, such financial statement schedule for the year ended December 31, 2007, when considered in relation to the basic consolidated financial statements taken as a whole, presents fairly, in all material respects, the information set forth therein.
/s/ DELOITTE & TOUCHE LLP
Los Angeles, CA
March 1, 2010
(March 2, 2009 as to the effects of discontinued operations as discussed in Note 22)
(September 11, 2009 as to the effects of the change in accounting principle for non-controlling interests, and the inclusion of the 2007 condensed consolidating guarantor and nonguarantor financial information in Note 25)
73
Table of Contents
CONSOLIDATED BALANCE SHEETS
(Dollars in thousands, except share data)
| December 31, | ||||||||
| 2009 | 2008 | |||||||
| ASSETS | ||||||||
| Current Assets: |
||||||||
| Cash and cash equivalents |
$ | 741,557 | $ | 158,823 | ||||
| Restricted cash |
46,797 | 36,322 | ||||||
| Receivables, less allowance for doubtful accounts of $41,397 and $56,303 at December 31, 2009 and 2008, respectively |
775,929 | 751,940 | ||||||
| Warehouse receivables |
315,033 | 210,473 | ||||||
| Deferred compensation assets |
— | 225,704 | ||||||
| Income taxes receivable |
163,032 | 117,720 | ||||||
| Prepaid expenses |
99,309 | 94,282 | ||||||
| Deferred tax assets, net |
75,330 | 147,770 | ||||||
| Real estate under development |
— | 56,322 | ||||||
| Real estate and other assets held for sale |
7,109 | 40,434 | ||||||
| Available for sale securities |
865 | 237 | ||||||
| Other current assets |
41,764 | 75,506 | ||||||
| Total Current Assets |
2,266,725 | 1,915,533 | ||||||
| Property and equipment, net |
178,975 | 207,976 | ||||||
| Goodwill |
1,306,372 | 1,251,823 | ||||||
| Other intangible assets, net of accumulated amortization of $138,244 and $114,685 at December 31, 2009 and 2008, respectively |
322,904 | 311,447 | ||||||
| Investments in unconsolidated subsidiaries |
135,596 | 145,726 | ||||||
| Deferred tax assets, net |
3,395 | 44,483 | ||||||
| Real estate under development |
160,164 | 158,090 | ||||||
| Real estate held for investment |
526,169 | 535,979 | ||||||
| Available for sale securities |
32,016 | 28,794 | ||||||
| Other assets, net |
107,090 | 126,563 | ||||||
| Total Assets |
$ | 5,039,406 | $ | 4,726,414 | ||||
| LIABILITIES AND EQUITY | ||||||||
| Current Liabilities: |
||||||||
| Accounts payable and accrued expenses |
$ | 458,510 | $ | 399,877 | ||||
| Compensation and employee benefits payable |
240,536 | 255,408 | ||||||
| Accrued bonus and profit sharing |
278,444 | 295,219 | ||||||
| Deferred compensation liabilities |
— | 239,464 | ||||||
| Short-term borrowings: |
||||||||
| Warehouse lines of credit |
312,872 | 210,473 | ||||||
| Revolving credit facility |
21,050 | 25,765 | ||||||
| Other |
5,850 | 9,827 | ||||||
| Total short-term borrowings |
339,772 | 246,065 | ||||||
| Current maturities of long-term debt |
138,682 | 210,662 | ||||||
| Notes payable on real estate |
159,921 | 176,372 | ||||||
| Liabilities related to real estate and other assets held for sale |
1,267 | 22,740 | ||||||
| Other current liabilities |
11,909 | 27,038 | ||||||
| Total Current Liabilities |
1,629,041 | 1,872,845 | ||||||
| Long-Term Debt: |
||||||||
| Senior secured term loans |
1,545,490 | 1,865,200 | ||||||
| 11.625% senior subordinated notes, net of unamortized discount of $13,498 at December 31, 2009 |
436,502 | — | ||||||
| Other long-term debt |
129 | 1,559 | ||||||
| Total Long-Term Debt |
1,982,121 | 1,866,759 | ||||||
| Pension liability |
64,945 | 19,802 | ||||||
| Non-current tax liabilities |
73,462 | 78,705 | ||||||
| Notes payable on real estate |
390,181 | 420,242 | ||||||
| Other liabilities |
115,361 | 122,338 | ||||||
| Total Liabilities |
4,255,111 | 4,380,691 | ||||||
| Commitments and contingencies |
— | — | ||||||
| Equity: |
||||||||
| CB Richard Ellis Group, Inc. Stockholders’ Equity: |
||||||||
| Class A common stock; $0.01 par value; 525,000,000 shares authorized; 321,767,407 and 262,336,032 shares issued and outstanding at December 31, 2009 and 2008, respectively |
3,218 | 2,623 | ||||||
| Additional paid-in capital |
755,989 | 285,825 | ||||||
| Accumulated deficit |
(15,008 | ) | (48,349 | ) | ||||
| Accumulated other comprehensive loss |
(115,077 | ) | (125,413 | ) | ||||
| Total CB Richard Ellis Group, Inc. Stockholders’ Equity |
629,122 | 114,686 | ||||||
| Non-controlling interests |
155,173 | 231,037 | ||||||
| Total Equity |
784,295 | 345,723 | ||||||
| Total Liabilities and Equity |
$ | 5,039,406 | $ | 4,726,414 | ||||
The accompanying notes are an integral part of these consolidated financial statements.
74
Table of Contents
CONSOLIDATED STATEMENTS OF OPERATIONS
(Dollars in thousands, except share data)
| Year Ended December 31, | ||||||||||||
| 2009 | 2008 | 2007 | ||||||||||
| Revenue |
$ | 4,165,820 | $ | 5,128,817 | $ | 6,034,249 | ||||||
| Costs and expenses: |
||||||||||||
| Cost of services |
2,447,885 | 2,926,721 | 3,200,718 | |||||||||
| Operating, administrative and other |
1,383,579 | 1,747,082 | 1,988,658 | |||||||||
| Depreciation and amortization |
99,473 | 102,817 | 113,269 | |||||||||
| Goodwill and other non-amortizable intangible asset impairment |
— | 1,159,406 | — | |||||||||
| Merger-related charges |
— | — | 56,932 | |||||||||
| Total costs and expenses |
3,930,937 | 5,936,026 | 5,359,577 | |||||||||
| Gain on disposition of real estate |
6,959 | 18,740 | 24,299 | |||||||||
| Operating income (loss) |
241,842 | (788,469 | ) | 698,971 | ||||||||
| Equity (loss) income from unconsolidated subsidiaries |
(34,095 | ) | (80,130 | ) | 64,939 | |||||||
| Other income (loss) |
3,880 | (7,686 | ) | (37,534 | ) | |||||||
| Interest income |
6,129 | 17,762 | 29,004 | |||||||||
| Interest expense |
189,146 | 167,156 | 162,991 | |||||||||
| Write-off of financing costs |
29,255 | — | — | |||||||||
| (Loss) income from continuing operations before provision for income taxes |
(645 | ) | (1,025,679 | ) | 592,389 | |||||||
| Provision for income taxes |
26,993 | 50,810 | 192,643 | |||||||||
| (Loss) income from continuing operations |
(27,638 | ) | (1,076,489 | ) | 399,746 | |||||||
| Income from discontinued operations, net of income taxes |
— | 26,748 | 5,308 | |||||||||
| Net (loss) income |
(27,638 | ) | (1,049,741 | ) | 405,054 | |||||||
| Less: Net (loss) income attributable to non-controlling interests |
(60,979 | ) | (37,675 | ) | 14,549 | |||||||
| Net income (loss) attributable to CB Richard Ellis Group, Inc. |
$ | 33,341 | $ | (1,012,066 | ) | $ | 390,505 | |||||
| Basic income (loss) per share attributable to CB Richard Ellis Group, Inc. shareholders |
||||||||||||
| Income (loss) from continuing operations attributable to CB Richard Ellis Group, Inc. |
$ | 0.12 | $ | (4.86 | ) | $ | 1.70 | |||||
| Income from discontinued operations, net of income taxes, attributable to CB Richard Ellis Group, Inc. |
— | 0.05 | 0.01 | |||||||||
| Net income (loss) attributable to CB Richard Ellis Group, Inc. |
$ | 0.12 | $ | (4.81 | ) | $ | 1.71 | |||||
| Weighted average shares outstanding for basic income (loss) per share |
277,361,783 | 210,539,032 | 228,476,724 | |||||||||
| Diluted income (loss) per share attributable to CB Richard Ellis Group, Inc. shareholders |
||||||||||||
| Income (loss) from continuing operations attributable to CB Richard Ellis Group, Inc. |
$ | 0.12 | $ | (4.86 | ) | $ | 1.65 | |||||
| Income from discontinued operations, net of income taxes, attributable to CB Richard Ellis Group, Inc. |
— | 0.05 | 0.01 | |||||||||
| Net income (loss) attributable to CB Richard Ellis Group, Inc. |
$ | 0.12 | $ | (4.81 | ) | $ | 1.66 | |||||
| Weighted average shares outstanding for diluted income (loss) per share |
279,995,081 | 210,539,032 | 234,978,464 | |||||||||
| Amounts attributable to CB Richard Ellis Group, Inc. shareholders |
||||||||||||
| Income (loss) from continuing operations, net of tax |
$ | 33,341 | $ | (1,022,291 | ) | $ | 387,871 | |||||
| Discontinued operations, net of tax |
— | 10,225 | 2,634 | |||||||||
| Net income (loss) |
$ | 33,341 | $ | (1,012,066 | ) | $390,505 | ||||||
The accompanying notes are an integral part of these consolidated financial statements.
75
Table of Contents
CONSOLIDATED STATEMENTS OF CASH FLOWS
(Dollars in thousands)
| Year Ended December 31, | ||||||||||||
| 2009 | 2008 | 2007 | ||||||||||
| CASH FLOWS FROM OPERATING ACTIVITIES: |
||||||||||||
| Net (loss) income |
$ | (27,638 | ) | $ | (1,049,741 | ) | $ | 405,054 | ||||
| Adjustments to reconcile net (loss) income to net cash provided by (used in) operating activities: |
||||||||||||
| Depreciation and amortization |
99,473 | 102,909 | 113,694 | |||||||||
| Amortization and write-off of deferred financing costs |
38,384 | 11,662 | 7,958 | |||||||||
| Amortization of long-term debt discount |
574 | — | — | |||||||||
| Write-down of impaired real estate and other assets |
38,550 | 60,504 | — | |||||||||
| Goodwill and other non-amortizable intangible asset impairment |
— | 1,159,406 | — | |||||||||
| Write-down of impaired available for sale securities |
— | 7,686 | — | |||||||||
| Gain on sale of servicing rights and other assets |
(30,010 | ) | (37,519 | ) | (11,355 | ) | ||||||
| (Gain) loss on interest rate swaps |
(3,880 | ) | — | 3,880 | ||||||||
| Loss on trading securities |
— | — | 33,654 | |||||||||
| Gain on disposition of real estate held for investment |
(2,721 | ) | — | (3,346 | ) | |||||||
| Equity loss (income) from unconsolidated subsidiaries |
34,095 | 80,130 | (64,939 | ) | ||||||||
| In-kind distributions from unconsolidated subsidiaries |
— | — | (2,710 | ) | ||||||||
| Provision for doubtful accounts |
9,226 | 32,735 | 17,688 | |||||||||
| Deferred income taxes |
5,702 | (62,163 | ) | 5,322 | ||||||||
| Compensation expense and merger-related expense related to stock options and non-vested stock awards |
37,925 | 29,812 | 35,546 | |||||||||
| Incremental tax benefit from stock options exercised |
(1,586 | ) | (4,294 | ) | (16,568 | ) | ||||||
| Deferred compensation deferrals |
— | 31,792 | 45,408 | |||||||||
| Distribution of earnings from unconsolidated subsidiaries |
13,509 | 23,867 | 117,196 | |||||||||
| Tenant concessions received |
3,611 | 11,209 | 15,220 | |||||||||
| Proceeds from sale of trading securities |
— | — | 320,047 | |||||||||
| (Increase) decrease in receivables |
(13,379 | ) | 230,479 | (138,965 | ) | |||||||
| Decrease (increase) in deferred compensation assets |
221,317 | 37,729 | (60,919 | ) | ||||||||
| Decrease (increase) in prepaid expenses and other assets |
20,045 | (23,356 | ) | (19,870 | ) | |||||||
| Decrease (increase) in real estate held for sale and under development |
2,946 | 7,865 | (114,714 | ) | ||||||||
| Decrease in accounts payable and accrued expenses |
(11,306 | ) | (102,984 | ) | (53,201 | ) | ||||||
| (Decrease) increase in compensation and employee benefits payable and accrued bonus and profit sharing |
(37,551 | ) | (505,575 | ) | 148,756 | |||||||
| Increase (decrease) in income taxes payable |
72,276 | (79,948 | ) | (138,094 | ) | |||||||
| (Decrease) increase in other liabilities, including deferred compensation liabilities |
(250,270 | ) | (90,597 | ) | 2,907 | |||||||
| Other operating activities, net |
(5,647 | ) | (1,981 | ) | 561 | |||||||
| Net cash provided by (used in) operating activities |
213,645 | (130,373 | ) | 648,210 | ||||||||
| CASH FLOWS FROM INVESTING ACTIVITIES: |
||||||||||||
| Capital expenditures |
(28,200 | ) | (51,471 | ) | (92,955 | ) | ||||||
| Acquisition of businesses (other than Trammell Crow Company) including net assets acquired, intangibles and goodwill, net of cash acquired |
(30,670 | ) | (239,926 | ) | (90,473 | ) | ||||||
| Cash paid for acquisition of Trammell Crow Company, net of cash acquired |
— | — | (94,483 | ) | ||||||||
| Contributions to unconsolidated subsidiaries |
(47,402 | ) | (56,350 | ) | (97,830 | ) | ||||||
| Distributions from unconsolidated subsidiaries |
9,232 | 25,444 | 57,812 | |||||||||
| Proceeds from sale of servicing rights and other assets |
12,283 | 29,156 | 32,504 | |||||||||
| Additions to real estate held for investment |
(26,656 | ) | (128,487 | ) | (189,602 | ) | ||||||
| Net proceeds from disposition of real estate held for investment |
3,408 | — | 10,898 | |||||||||
| (Increase) decrease in restricted cash |
(10,543 | ) | 5,973 | 168,811 | ||||||||
| Other investing activities, net |
(814 | ) | (3,348 | ) | 10,897 | |||||||
| Net cash used in investing activities |
(119,362 | ) | (419,009 | ) | (284,421 | ) | ||||||
| CASH FLOWS FROM FINANCING ACTIVITIES: |
||||||||||||
| Proceeds from senior secured term loans |
— | 300,000 | — | |||||||||
| Repayment of senior secured term loans |
(432,000 | ) | (13,250 | ) | (286,000 | ) | ||||||
| Proceeds from revolving credit facility |
800,928 | 2,024,762 | 604,186 | |||||||||
| Repayment of revolving credit facility |
(772,721 | ) | (2,208,645 | ) | (381,704 | ) | ||||||
| Proceeds from 11.625% senior subordinated notes, net |
435,928 | — | — | |||||||||
| Repayment of 9 3/4% senior notes |
— | — | (3,310 | ) | ||||||||
| Proceeds from notes payable on real estate held for investment |
16,690 | 115,676 | 142,862 | |||||||||
| Repayment of notes payable on real estate held for investment |
(7,185 | ) | (16,427 | ) | (21,621 | ) | ||||||
| Proceeds from notes payable on real estate held for sale and under development |
63,040 | 144,296 | 210,532 | |||||||||
| Repayment of notes payable on real estate held for sale and under development |
(46,642 | ) | (142,222 | ) | (126,066 | ) | ||||||
| (Repayment of) proceeds from short-term borrowings and other loans, net |
(4,310 | ) | (44,563 | ) | 33,525 | |||||||
| Proceeds from issuance of common stock, net |
440,173 | 206,700 | — | |||||||||
| Repurchase of common stock |
— | — | (635,000 | ) | ||||||||
| Proceeds from exercise of stock options |
15,443 | 4,026 | 11,867 | |||||||||
| Incremental tax benefit from stock options exercised |
1,586 | 4,294 | 16,568 | |||||||||
| Non-controlling interests contributions |
21,348 | 48,533 | 198,446 | |||||||||
| Non-controlling interests distributions |
(13,496 | ) | (37,646 | ) | (34,842 | ) | ||||||
| Payment of financing costs |
(39,402 | ) | (10,893 | ) | (5,609 | ) | ||||||
| Other financing activities, net |
(2,612 | ) | (682 | ) | (1,087 | ) | ||||||
| Net cash provided by (used in) financing activities |
476,768 | 373,959 | (277,253 | ) | ||||||||
| Effect of currency exchange rate changes on cash and cash equivalents |
11,683 | (8,628 | ) | 11,862 | ||||||||
| NET INCREASE (DECREASE) IN CASH AND CASH EQUIVALENTS |
582,734 | (184,051 | ) | 98,398 | ||||||||
| CASH AND CASH EQUIVALENTS, AT BEGINNING OF PERIOD |
158,823 | 342,874 | 244,476 | |||||||||
| CASH AND CASH EQUIVALENTS, AT END OF PERIOD |
$ | 741,557 | $ | 158,823 | $ | 342,874 | ||||||
| SUPPLEMENTAL DISCLOSURES OF CASH FLOW INFORMATION: |
||||||||||||
| Cash paid (received) during the period for: |
||||||||||||
| Interest |
$ | 168,577 | $ | 148,826 | $ | 148,944 | ||||||
| Income tax (refunds) payments, net |
$ | (48,355 | ) | $ | 197,353 | $ | 317,394 | |||||
The accompanying notes are an integral part of these consolidated financial statements.
76
Table of Contents
CONSOLIDATED STATEMENTS OF EQUITY
(Dollars in thousands, except share data)
| CB Richard Ellis Group, Inc. Shareholders | |||||||||||||||||||||||||||||||||||
| Accumulated other comprehensive (loss) income |
|||||||||||||||||||||||||||||||||||
| Shares | Class A common stock |
Additional paid-in capital |
Notes receivable from sale of stock |
Accumulated earnings (deficit) |
Minimum pension liability and other |
Foreign currency translation and other |
Non- Controlling Interests |
Total | |||||||||||||||||||||||||||
| Balance at December 31, 2006 |
227,474,835 | $ | 2,275 | $ | 610,406 | $ | (60 | ) | $ | 602,086 | $ | (27,607 | ) | $ | (5,459 | ) | $ | 78,136 | $ | 1,259,777 | |||||||||||||||
| Net income |
— | — | — | — | 390,505 | — | — | 14,549 | 405,054 | ||||||||||||||||||||||||||
| Adoption of FIN 48 |
— | — | — | — | (29,061 | ) | — | — | — | (29,061 | ) | ||||||||||||||||||||||||
| Net cancellation and distribution of deferred compensation stock fund units |
187,949 | 1 | (22 | ) | — | — | — | — | — | (21 | ) | ||||||||||||||||||||||||
| Pension liability adjustments, net of tax |
— | — | — | — | — | (8,818 | ) | — | — | (8,818 | ) | ||||||||||||||||||||||||
| Stock options exercised (including tax benefit) |
1,973,947 | 20 | 29,348 | — | — | — | — | — | 29,368 | ||||||||||||||||||||||||||
| Non-cash issuance of common stock |
2,808 | — | 104 | — | — | — | — | — | 104 | ||||||||||||||||||||||||||
| Non-vested stock grants |
819,679 | 8 | — | — | — | — | — | — | 8 | ||||||||||||||||||||||||||
| Repurchase of common stock |
(28,830,442 | ) | (288 | ) | (634,712 | ) | — | — | — | — | — | (635,000 | ) | ||||||||||||||||||||||
| Compensation expense for stock options and non-vested stock awards |
— | — | 24,608 | — | — | — | — | — | 24,608 | ||||||||||||||||||||||||||
| Accelerated vesting of non-vested stock awards |
— | — | 993 | — | — | — | — | — | 993 | ||||||||||||||||||||||||||
| Accelerated vesting of stock options |
— | — | 9,834 | — | — | — | — | — | 9,834 | ||||||||||||||||||||||||||
| Unrealized losses on interest rate swaps, net of tax |
— | — | — | — | — | — | (7,667 | ) | — | (7,667 | ) | ||||||||||||||||||||||||
| Unrealized holding losses on available for sale securities, net of tax |
— | — | — | — | — | — | (409 | ) | — | (409 | ) | ||||||||||||||||||||||||
| Foreign currency translation gain |
— | — | — | — | — | — | 32,458 | 2,308 | 34,766 | ||||||||||||||||||||||||||
| Cancellation of non-vested stock awards |
(34,184 | ) | — | — | — | — | — | — | — | — | |||||||||||||||||||||||||
| Contributions from non-controlling interests |
— | — | — | — | — | — | — | 198,446 | 198,446 | ||||||||||||||||||||||||||
| Distributions to non-controlling interests |
— | — | — | — | — | — | — | (34,842 | ) | (34,842 | ) | ||||||||||||||||||||||||
| Other |
— | — | — | — | — | — | — | 5,016 | 5,016 | ||||||||||||||||||||||||||
| Balance at December 31, 2007 |
201,594,592 | $ | 2,016 | $ | 40,559 | $ | (60 | ) | $ | 963,530 | $ | (36,425 | ) | $ | 18,923 | $ | 263,613 | $ | 1,252,156 | ||||||||||||||||
| Net loss |
— | — | — | — | (1,012,066 | ) | — | — | (37,675 | ) | (1,049,741 | ) | |||||||||||||||||||||||
| Adoption of measurement date provisions of SFAS No. 158 |
— | — | — | — | 187 | 92 | — | — | 279 | ||||||||||||||||||||||||||
| Net cancellation and distribution of deferred compensation stock fund units |
164,456 | 1 | (6 | ) | — | — | — | — | — | (5 | ) | ||||||||||||||||||||||||
| Net collection on notes receivable from sale of stock |
— | — | — | 60 | — | — | — | — | 60 | ||||||||||||||||||||||||||
| Pension liability adjustments, net of tax |
— | — | — | — | — | 741 | — | — | 741 | ||||||||||||||||||||||||||
| Stock options exercised (including tax benefit) |
941,896 | 9 | 8,288 | — | — | — | — | — | 8,297 | ||||||||||||||||||||||||||
| Non-cash issuance of common stock |
4,540 | — | 100 | — | — | — | — | — | 100 | ||||||||||||||||||||||||||
| Non-vested stock grants |
2,371,987 | 24 | — | — | — | — | — | — | 24 | ||||||||||||||||||||||||||
| Issuance of common stock, net |
57,500,000 | 575 | 206,125 | — | — | — | — | — | 206,700 | ||||||||||||||||||||||||||
| Compensation expense for stock options and non-vested stock awards |
— | — | 29,812 | — | — | — | — | — | 29,812 | ||||||||||||||||||||||||||
| Unrealized losses on interest rate swaps and interest rate caps, net of tax |
— | — | — | — | — | — | (4,432 | ) | — | (4,432 | ) | ||||||||||||||||||||||||
| Unrealized holding losses on available for sale securities, net of tax |
— | — | — | — | — | — | (103 | ) | — | (103 | ) | ||||||||||||||||||||||||
| Foreign currency translation (loss) gain |
— | — | — | — | — | — | (104,209 | ) | 2,002 | (102,207 | ) | ||||||||||||||||||||||||
| Cancellation of non-vested stock awards |
(241,439 | ) | (2 | ) | — | — | — | — | — | — | (2 | ) | |||||||||||||||||||||||
| Contributions from non-controlling interests |
— | — | — | — | — | — | — | 48,533 | 48,533 | ||||||||||||||||||||||||||
| Distributions to non-controlling interests |
— | — | — | — | — | — | — | (37,646 | ) | (37,646 | ) | ||||||||||||||||||||||||
| Other |
— | — | 947 | — | — | — | — | (7,790 | ) | (6,843 | ) | ||||||||||||||||||||||||
| Balance at December 31, 2008 |
262,336,032 | $ | 2,623 | $ | 285,825 | $ | — | $ | (48,349 | ) | $ | (35,592 | ) | $ | (89,821 | ) | $ | 231,037 | $ | 345,723 | |||||||||||||||
| Net income (loss) |
— | — | — | — | 33,341 | — | — | (60,979 | ) | (27,638 | ) | ||||||||||||||||||||||||
| Net cancellation and distribution of deferred compensation stock fund units |
2,717,348 | 28 | (5,484 | ) | — | — | — | — | — | (5,456 | ) | ||||||||||||||||||||||||
| Pension liability adjustments, net of tax |
— | — | — | — | — | (31,995 | ) | — | — | (31,995 | ) | ||||||||||||||||||||||||
| Stock options exercised (including tax benefit) |
2,665,568 | 27 | 17,003 | — | — | — | — | — | 17,030 | ||||||||||||||||||||||||||
| Non-cash issuance of common stock |
12,072 | — | 106 | — | — | — | — | — | 106 | ||||||||||||||||||||||||||
| Non-vested stock grants |
6,711,288 | 67 | — | — | — | — | — | — | 67 | ||||||||||||||||||||||||||
| Issuance of common stock, net |
47,413,504 | 474 | 439,699 | — | — | — | — | — | 440,173 | ||||||||||||||||||||||||||
| Compensation expense for stock options and non-vested stock awards |
— | — | 37,925 | — | — | — | — | — | 37,925 | ||||||||||||||||||||||||||
| Unrealized gains on interest rate swaps and interest rate caps, net of tax |
— | — | — | — | — | — | 8,925 | — | 8,925 | ||||||||||||||||||||||||||
| Unrealized holding gains on available for sale securities, net of tax |
— | — | — | — | — | — | 1,685 | — | 1,685 | ||||||||||||||||||||||||||
| Foreign currency translation gain |
— | — | — | — | — | — | 33,611 | 996 | 34,607 | ||||||||||||||||||||||||||
| Cancellation of non-vested stock awards |
(88,405 | ) | (1 | ) | — | — | — | — | — | — | (1 | ) | |||||||||||||||||||||||
| Contributions from non-controlling interests |
— | — | — | — | — | — | — | 21,348 | 21,348 | ||||||||||||||||||||||||||
| Distributions to non-controlling interests |
— | — | — | — | — | — | — | (13,496 | ) | (13,496 | ) | ||||||||||||||||||||||||
| Acquisitions of non-controlling interests |
— | — | (19,479 | ) | — | — | — | — | (23,746 | ) | (43,225 | ) | |||||||||||||||||||||||
| Other |
— | — | 394 | — | — | — | (1,890 | ) | 13 | (1,483 | ) | ||||||||||||||||||||||||
| Balance at December 31, 2009 |
321,767,407 | $ | 3,218 | $ | 755,989 | $ | — | $ | (15,008 | ) | $ | (67,587 | ) | $ | (47,490 | ) | $ | 155,173 | $ | 784,295 | |||||||||||||||
The accompanying notes are an integral part of these consolidated financial statements.
77
Table of Contents
CONSOLIDATED STATEMENTS OF COMPREHENSIVE INCOME (LOSS)
(Dollars in thousands)
| Year Ended December 31, | ||||||||||||
| 2009 | 2008 | 2007 | ||||||||||
| Net (loss) income |
$ | (27,638 | ) | $ | (1,049,741 | ) | $ | 405,054 | ||||
| Other comprehensive income (loss): |
||||||||||||
| Foreign currency translation gain (loss) and other, net |
32,717 | (102,207 | ) | 34,766 | ||||||||
| Unrealized gains (losses) on interest rate swaps and interest rate caps, net of $5,911 income tax and $1,537 and $5,532 income tax benefit as of December 31, 2009, 2008 and 2007, respectively |
8,925 | (4,432 | ) | (7,667 | ) | |||||||
| Unrealized holding gains (losses) on available for sale securities, net of $1,680 income tax and $1,900 and $306 income tax benefit as of December 31, 2009, 2008 and 2007, respectively |
1,685 | (103 | ) | (409 | ) | |||||||
| Pension liability adjustments, net of tax |
(31,995 | ) | 741 | (8,818 | ) | |||||||
| Total other comprehensive income (loss) |
11,332 | (106,001 | ) | 17,872 | ||||||||
| Comprehensive (loss) income |
(16,306 | ) | (1,155,742 | ) | 422,926 | |||||||
| Comprehensive (loss) income attributable to non-controlling interests |
(59,983 | ) | (35,673 | ) | 16,857 | |||||||
| Comprehensive income (loss) attributable to CB Richard Ellis Group, Inc. |
$ | 43,677 | $ | (1,120,069 | ) | $ | 406,069 | |||||
The accompanying notes are an integral part of these consolidated financial statements.
78
Table of Contents
NOTES TO CONSOLIDATED FINANCIAL STATEMENTS
1. Nature of Operations
CB Richard Ellis Group, Inc. (formerly known as CBRE Holding, Inc.), a Delaware corporation (which may be referred to in these financial statements as “we,” “us,” and “our”), was incorporated on February 20, 2001 and was created to acquire all of the outstanding shares of CB Richard Ellis Services, Inc. (CBRE), an international commercial real estate services firm. Prior to July 20, 2001, we were a wholly-owned subsidiary of Blum Strategic Partners, L.P. (Blum Strategic), formerly known as RCBA Strategic Partners, L.P., which is an affiliate of Richard C. Blum, a director of CBRE and our company.
On July 20, 2001, we acquired all of the outstanding stock of CBRE pursuant to an Amended and Restated Agreement and Plan of Merger, dated May 31, 2001, among CBRE, Blum CB Corp. (Blum CB) and us. Blum CB was merged with and into CBRE with CBRE being the surviving corporation (the 2001 Merger). In July 2003, our global position in the commercial real estate services industry was further solidified as CBRE acquired Insignia Financial Group, Inc. (Insignia). On July 23, 2003, pursuant to an Amended and Restated Agreement and Plan of Merger, dated May 28, 2003 (the Insignia Acquisition Agreement), by and among us, CBRE, Apple Acquisition Corp. (Apple Acquisition), a Delaware corporation and wholly-owned subsidiary of CBRE, and Insignia, Apple Acquisition was merged with and into Insignia (the Insignia Acquisition). Insignia was the surviving corporation in the Insignia Acquisition and at the effective time of the Insignia Acquisition became a wholly-owned subsidiary of CBRE. On June 15, 2004, we completed an initial public offering of shares of our Class A common stock. In December 2006, we expanded our global leadership with the acquisition of Trammell Crow Company, our largest acquisition to date. On December 20, 2006, pursuant to an Agreement and Plan of Merger dated October 30, 2006 by and among us, A-2 Acquisition Corp., a Delaware corporation and our wholly-owned subsidiary (Merger Sub), and Trammell Crow Company, Merger Sub was merged with and into the Trammell Crow Company (the Trammell Crow Company Acquisition). Trammell Crow Company was the surviving corporation in the Trammell Crow Company Acquisition, and upon the closing of the Trammell Crow Company Acquisition, it became our indirect wholly-owned subsidiary. We have no substantive operations other than our investment in CBRE and Trammell Crow Company.
We offer a full range of services to occupiers, owners, lenders and investors in office, retail, industrial, multi-family and other commercial real estate assets globally under the “CB Richard Ellis” brand name and provide development services under the “Trammell Crow” brand name. Our business is focused on several competencies, including commercial property and corporate facilities management, tenant representation, property/agency leasing, property sales, valuation, real estate investment management, commercial mortgage origination and servicing, capital markets (equity and debt) solutions, development services and proprietary research. We generate revenues from contractual management fees and on a per project or transactional basis.
2. Significant Accounting Policies
Principles of Consolidation
The accompanying consolidated financial statements include our accounts and those of our majority-owned subsidiaries, as well as variable interest entities (VIEs) in which we are the primary beneficiary and other subsidiaries of which we have control. The equity attributable to non-controlling interests in subsidiaries is shown separately in the accompanying consolidated balance sheets. All significant intercompany accounts and transactions have been eliminated in consolidation.
Variable Interest Entities
Our determination of the appropriate accounting method with respect to our variable interests, including co-investments with our clients, is based on the “Consolidation” Topic of the Financial Accounting Standards
79
Table of Contents
CB RICHARD ELLIS GROUP, INC.
NOTES TO CONSOLIDATED FINANCIAL STATEMENTS—(Continued)
Board (FASB) Accounting Standards Codification (ASC) Topic 810. We consolidate any VIEs of which we are the primary beneficiary and disclose significant variable interests in VIEs of which we are not the primary beneficiary, if any.
Limited Partnerships, Limited Liability Companies and Other Subsidiaries
If an entity is not a VIE, our determination of the appropriate accounting method with respect to our investments in limited partnerships, limited liability companies and other subsidiaries is based on voting control. For our general partner interests, we are presumed to control (and therefore consolidate) the entity, unless the other limited partners have substantive rights that overcome this presumption of control. These substantive rights allow the limited partners to participate in significant decisions made in the ordinary course of the entity’s business. We account for our non-controlling general partner investments in these entities under the equity method. This treatment also applies to our managing member interests in limited liability companies.
Our determination of the appropriate accounting method for all other investments in subsidiaries is based on the amount of influence we have (including our ownership interest) in the underlying entity. Those other investments where we have the ability to exercise significant influence (but not control) over operating and financial policies of such subsidiaries (including certain subsidiaries where we have less than 20% ownership) are accounted for using the equity method. We eliminate transactions with such equity method subsidiaries to the extent of our ownership in such subsidiaries. Accordingly, our share of the earnings or losses of these equity method subsidiaries is included in consolidated net income. All of our remaining investments are carried at cost.
Under either the equity or cost method, impairment losses are recognized upon evidence of other-than-temporary losses of value. When testing for impairment on investments that are not actively traded on a public market, we generally use a discounted cash flow approach to estimate the fair value of our investments and/or look to comparable activities in the marketplace. Management judgment is required in developing the assumptions for the discounted cash flow approach. These assumptions include net asset values, internal rates of return, discount and capitalization rates, interest rates and financing terms, rental rates, timing of leasing activity, estimates of lease terms and related concessions, etc. When determining if impairment is other-than-temporary, we also look to the length of time and the extent to which fair value has been less than cost as well as the financial condition and near-term prospects of each investment.
Estimates, Risks and Uncertainties
Our consolidated financial statements have been prepared in accordance with accounting principles generally accepted in the United States (U.S.), which require management to make estimates and assumptions about future events. These estimates and the underlying assumptions affect the amounts of assets and liabilities reported, and reported amounts of revenue and expenses. Such estimates include the value of goodwill, intangibles and other long-lived assets, accounts receivable, investments in unconsolidated subsidiaries and assumptions used in the calculation of income taxes, retirement and other post-employment benefits, among others. These estimates and assumptions are based on management’s best estimates and judgment. Management evaluates its estimates and assumptions on an ongoing basis using historical experience and other factors, including consideration of the current economic environment, and adjusts such estimates and assumptions when facts and circumstances dictate. Illiquid credit markets, volatile equity, foreign currency, among other things, have combined to increase the uncertainty inherent in such estimates and assumptions. As future events and their effects cannot be determined with precision, actual results could differ significantly from these estimates. Changes in those estimates resulting from continuing changes in the economic environment will be reflected in the financial statements in future periods.
80
Table of Contents
CB RICHARD ELLIS GROUP, INC.
NOTES TO CONSOLIDATED FINANCIAL STATEMENTS—(Continued)
The fair value of our goodwill and non-amortizable intangible assets is impacted by economic conditions, the capital markets and our stock price. Sales and leasing activity is affected by the credit crunch and significant capital market turmoil adversely affects incentive-based revenue as well as reduces real estate sales volume and values. These adverse economic conditions could cause declines in the estimated future discounted cash flows expected for our reporting units. A significant or sustained decline in our future cash flows and/or if the current economic conditions significantly worsen could result in additional impairment charges.
The recoverability of our investments in unconsolidated subsidiaries is impacted by the significant capital market turmoil. During the fourth quarter of 2008, commercial real estate fundamentals weakened significantly, impacted by the overall downturn in the economy. Transactions declined significantly due to illiquidity in the capital markets as many lenders tightened lending standards for commercial real estate. The assumptions utilized in our recoverability analysis reflected our outlook for the commercial real estate industry and the impact on our business. This outlook incorporated our belief that market conditions deteriorated and that these challenging conditions could persist for some time. A continued decline in the capital markets could result in additional write-downs in the future.
The recoverability of the carrying value of our investments in real estate is impacted by weakened commercial real estate fundamentals in the U.S., the overall downturn in the economy as evidenced by the decline in the U.S. Gross Domestic Product through the second quarter of 2009 and the high rate of unemployment. Market fundamentals in the primary product types which we develop/own weakened significantly. The high unemployment rate negatively impacted office markets as companies deferred occupancy decisions and placed space on the market for sublease. Weak industrial production has adversely affected warehouse and distribution markets. The retail sector has been negatively affected by declining sales and retailers experiencing financial difficulty. Transactions have declined significantly due to illiquidity in the capital markets as many lenders have tightened lending standards for commercial real estate. Capitalization rates have increased as potential buyers of commercial real estate re-evaluated commercial real estate versus other asset classes available for investment. If conditions in the broader economy, commercial real estate industry, specific markets or product types in which we operate worsen, we could have additional impairment charges.
Cash and Cash Equivalents
Cash and cash equivalents generally consist of cash and highly liquid investments with an original maturity of less than three months. We manage certain cash and cash equivalents as an agent for our investment and property management clients. These amounts are not included in the accompanying consolidated balance sheets (See Note 19).
Concentration of Credit Risk
Financial instruments that potentially subject us to credit risk consist principally of trade receivables and interest-bearing investments. Users of real estate services account for a substantial portion of trade receivables and collateral is generally not required. The risk associated with this concentration is limited due to the large number of users and their geographic dispersion.
We place substantially all of our interest-bearing investments with major financial institutions and limit the amount of credit exposure with any one financial institution.
81
Table of Contents
CB RICHARD ELLIS GROUP, INC.
NOTES TO CONSOLIDATED FINANCIAL STATEMENTS—(Continued)
Property and Equipment
Property and equipment is stated at cost, net of accumulated depreciation. Depreciation and amortization of property and equipment is computed primarily using the straight-line method over estimated useful lives ranging up to ten years. Leasehold improvements are amortized over the term of their associated leases, excluding options to renew, since such leases generally do not carry prohibitive penalties for non-renewal. We capitalize expenditures that materially increase the life of our assets and expense the costs of maintenance and repairs.
We review property and equipment for impairment whenever events or changes in circumstances indicate that the carrying amount of an asset may not be recoverable. If this review indicates that such assets are considered to be impaired, the impairment is recognized in the period the changes occur and represents the amount by which the carrying value exceeds the fair value of the asset. We did not recognize an impairment loss related to property and equipment in 2009, 2008 or 2007.
Computer Software Costs
Certain costs related to the development or purchase of internal-use software are capitalized. Internal computer software costs that are incurred in the preliminary project stage are expensed as incurred. Direct consulting costs as well as payroll and related costs, which are incurred during the development stage of a project are capitalized and amortized over a three-year period when placed into production.
Goodwill and Other Intangible Assets
Our acquisitions require the application of purchase accounting, which results in tangible and identifiable intangible assets and liabilities of the acquired entity being recorded at fair value. The difference between the purchase price and the fair value of net assets acquired is recorded as goodwill. The majority of our goodwill balance has resulted from the 2001 Merger, the Insignia Acquisition and the Trammell Crow Company Acquisition. Other intangible assets include a trademark, which was separately identified as a result of the 2001 Merger, as well as a trade name separately identified as a result of the Insignia Acquisition representing the Richard Ellis trade name in the United Kingdom (U.K.) that was owned by Insignia prior to the Insignia Acquisition. Both the trademark and the trade name are not being amortized and have indefinite estimated useful lives. The remaining other intangible assets primarily include customer relationships, management contracts, loan servicing rights and franchise agreements, which are all being amortized over estimated useful lives ranging up to 20 years.
We are required to test goodwill and other intangible assets deemed to have indefinite useful lives for impairment annually or more often if circumstances or events indicate a change in the impairment status. The goodwill impairment analysis is a two-step process. The first step used to identify potential impairment involves comparing each reporting unit’s estimated fair value to its carrying value, including goodwill. We use a discounted cash flow approach to estimate the fair value of our reporting units. Management judgment is required in developing the assumptions for the discounted cash flow model. These assumptions include revenue growth rates, profit margin percentages, discount rates, etc. If the estimated fair value of a reporting unit exceeds its carrying value, goodwill is considered to not be impaired. If the carrying value exceeds estimated fair value, there is an indication of potential impairment and the second step is performed to measure the amount of impairment. The second step of the process involves the calculation of an implied fair value of goodwill for each reporting unit for which step one indicated impairment. The implied fair value of goodwill is determined similar to how goodwill is calculated in a business combination, by measuring the excess of the estimated fair value of the reporting unit as calculated in step one, over the estimated fair values of the individual assets, liabilities and identifiable intangibles as if the reporting unit was being acquired in a business combination. Due to the many
82
Table of Contents
CB RICHARD ELLIS GROUP, INC.
NOTES TO CONSOLIDATED FINANCIAL STATEMENTS—(Continued)
variables inherent in the estimation of a business’s fair value and the relative size of our goodwill, if different assumptions and estimates were used, it could have an adverse effect on our impairment analysis.
Deferred Financing Costs
Costs incurred in connection with financing activities are deferred and amortized over the terms of the related debt agreements ranging up to seven years. Amortization of these costs is charged to interest expense in the accompanying consolidated statements of operations. In connection with the March 24, 2009 amendment and restatement to our credit agreement (see Note 13), we wrote off financing costs of $29.3 million during the year ended December 31, 2009, which was included in write-off of financing costs in the accompanying consolidated statements of operations. This included the write-off of $18.1 million of unamortized deferred financing costs and $11.2 million of credit agreement amendment fees paid in March 2009. Total deferred financing costs, net of accumulated amortization, included in other assets in the accompanying consolidated balance sheets were $29.2 million and $28.8 million, as of December 31, 2009 and 2008, respectively.
Revenue Recognition
We record commission revenue on real estate sales generally upon close of escrow or transfer of title, except when future contingencies exist. Real estate commissions on leases are generally recorded in revenue when all obligations under the commission agreement are satisfied. Terms and conditions of a commission agreement may include, but are not limited to, execution of a signed lease agreement and future contingencies including tenant occupancy, payment of a deposit or payment of a first month’s rent (or a combination thereof). As some of these conditions are outside of our control and are often not clearly defined, judgment must be exercised in determining when such required events have occurred in order to recognize revenue.
A typical commission agreement provides that we earn a portion of a lease commission upon the execution of the lease agreement by the tenant, with the remaining portion(s) of the lease commission earned at a later date, usually upon tenant occupancy or payment of rent. The existence of any significant future contingencies results in the delay of recognition of corresponding revenue until such contingencies are satisfied. For example, if we do not earn all or a portion of the lease commission until the tenant pays its first month’s rent, and the lease agreement provides the tenant with a free rent period, we delay revenue recognition until rent is paid by the tenant.
Property management revenues are generally based upon percentages of the revenue or profit generated by the entities managed or the square footage managed. These fees are recognized when earned under the provisions of the related management agreements.
Investment management fees are based predominantly upon a percentage of the equity deployed on behalf of our limited partners. Fees related to our indirect investment management programs are based upon a percentage of the fair value of those investments. These fees are recognized when earned under the provisions of the related investment management agreements. Our Global Investment Management segment earns performance-based incentive fees with regard to many of its investments. Such revenue is recognized at the end of the measurement periods when the conditions of the applicable incentive fee arrangements have been satisfied and following the expiration of any potential claw back provision. With many of these investments, our Global Investment Management team has participation interests in such incentive fees, which are commonly referred to as carried interest. This carried interest expense is generally accrued for based upon the probability of such performance-based incentive fees being earned over the related vesting period.
83
Table of Contents
CB RICHARD ELLIS GROUP, INC.
NOTES TO CONSOLIDATED FINANCIAL STATEMENTS—(Continued)
Appraisal fees are recorded after services have been rendered. Loan origination fees are recognized at the time a loan closes and we have no significant remaining obligations for performance in connection with the transaction, while loan servicing fees are recorded in revenue as monthly principal and interest payments are collected from mortgagors. Other commissions, consulting fees and referral fees are recorded as revenue at the time the related services have been performed, unless significant future contingencies exist.
Development services and project management services generate fees from development and construction management projects. For projects where we operate as a general contractor, fees are generally recognized using the percentage-of-completion method based on costs incurred as a percentage of total expected costs. Some development and construction management and project management assignments are subject to agreements that describe the calculation of fees and when we earn such fees. The earnings terms of these agreements dictate when we recognize the related revenue. We may earn incentive fees for project management services based upon achievement of certain performance criteria as set forth in the project management services agreement. We may earn incentive development fees by reaching specified time table, leasing, budget or value creation targets, as defined in the relevant development services agreement. Certain incentive development fees allow us to share in the fair value of the developed real estate asset above cost. This sharing creates additional revenue potential to us with no exposure to loss other than opportunity cost. We recognize such fees when the specified target is attained and fees are deemed collectible.
We record deferred income to the extent that cash payments have been received in accordance with the terms of underlying agreements, but such amounts have not yet met the criteria for revenue recognition in accordance with generally accepted accounting principles. We recognize such revenues when the appropriate criteria are met.
We account for certain reimbursements (primarily salaries and related charges) mainly related to our facilities and property management operations as revenue. Reimbursement revenue is recognized when the underlying reimbursable costs are incurred.
In establishing the appropriate provisions for trade receivables, we make assumptions with respect to future collectibility. Our assumptions are based on an assessment of a customer’s credit quality as well as subjective factors and trends, including the aging of receivables balances. In addition to these assessments, in general, outstanding trade accounts receivable amounts that are more than 180 days overdue are evaluated for collectibility and fully provided for if deemed uncollectible. Historically, our credit losses have generally been insignificant. However, estimating losses requires significant judgment, and conditions may change or new information may become known after any periodic evaluation. As a result, actual credit losses may differ from our estimates.
Real Estate
Classification and Impairment Evaluation
We classify real estate in accordance with the criteria of the “Property, Plant and Equipment” Topic of the FASB ASC (Topic 360) as follows: (i) real estate held for sale, which includes completed assets or land for sale in its present condition that meet all of Topic 360’s “held for sale” criteria, (ii) real estate under development (current), which includes real estate that we are in the process of developing that is expected to be completed and disposed of within one year of the balance sheet date; (iii) real estate under development (non-current), which includes real estate that we are in the process of developing that is expected to be completed and disposed of more than one year from the balance sheet date; or (iv) real estate held for investment, which consists of land on which development activities have not yet commenced and completed assets or land held for disposition that do
84
Table of Contents
CB RICHARD ELLIS GROUP, INC.
NOTES TO CONSOLIDATED FINANCIAL STATEMENTS—(Continued)
not meet the “held for sale” criteria. Any asset reclassified from real estate held for sale to real estate under development (current or non-current) or real estate held for investment is recorded individually at the lower of its fair value at the date of the reclassification or its carrying amount before it was classified as “held for sale,” adjusted (in the case of real estate held for investment) for any depreciation that would have been recognized had the asset been continuously classified as real estate held for investment.
Real estate held for sale is recorded at the lower of cost or fair value less cost to sell. If an asset’s fair value less cost to sell, based on discounted future cash flows, management estimates or market comparisons, is less than its carrying amount, an allowance is recorded against the asset.
Real estate under development and real estate held for investment are carried at cost less depreciation, as applicable. Buildings and improvements included in real estate held for investment are depreciated using the straight-line method over estimated useful lives, generally 39 years. Tenant improvements included in real estate held for investment are amortized using the straight-line method over the shorter of their estimated useful lives or terms of the respective leases. Land improvements included in real estate held for investment are depreciated over their estimated useful lives, up to 15 years.
When indicators of impairment are present, real estate under development and real estate held for investment are evaluated for impairment and losses are recorded when undiscounted cash flows estimated to be generated by an asset or market comparisons are less than the asset’s carrying amount. The amount of the impairment loss is calculated as the excess of the asset’s carrying value over its fair value, which is determined using a discounted cash flow analysis, management estimates or market comparisons.
Cost Capitalization and Allocation
When acquiring, developing and constructing real estate assets, we capitalize costs. Capitalization begins when the activities related to development have begun and ceases when activities are substantially complete and the asset is available for occupancy. Costs capitalized include pursuit costs, or pre-acquisition/pre-construction costs, taxes and insurance, development and construction costs and costs of incidental operations. We expense transaction costs for acquisitions that qualify as a business in accordance with the “Business Combinations” Topic of the FASB ASC (Topic 805). Pursuit costs capitalized in connection with a potential development project that we have determined not to pursue are written off in the period that determination is made.
At times, we purchase bulk land that we intend to sell or develop in phases. The land basis allocated to each phase is based on the relative estimated fair value of the phases before construction. We allocate construction costs incurred relating to more than one phase between the various phases; if the costs cannot be specifically attributed to a certain phase or the improvements benefit more than one phase, we allocate the costs between the phases based on their relative estimated sales values, where practicable, or other value methods as appropriate under the circumstances. Relative allocations of the costs are revised as the sales value estimates are revised.
When acquiring real estate with existing buildings, we allocate the purchase price between land, land improvements, building and intangibles related to in-place leases, if any, based on their relative fair values. The fair values of acquired land and buildings are determined based on an estimated discounted future cash flow model with lease-up assumptions as if the building was vacant upon acquisition. The fair value of in-place leases includes the value of lease intangibles for above or below-market rents and tenant origination costs, determined on a lease by lease basis. The capitalized values for both lease intangibles and tenant origination costs are amortized over the term of the underlying leases. Amortization related to lease intangibles is recorded as either an increase to or a reduction of rental income and amortization for tenant origination costs is recorded to amortization expense.
85
Table of Contents
CB RICHARD ELLIS GROUP, INC.
NOTES TO CONSOLIDATED FINANCIAL STATEMENTS—(Continued)
Disposition of Real Estate
Gains on disposition of real estate are recognized upon sale of the underlying project. We evaluate each real estate sale transaction to determine if it qualifies for gain recognition under the full accrual method. If the transaction does not meet the criteria for the full accrual method of profit recognition based on our assessment, we account for a sale based on an appropriate deferral method determined by the nature and extent of the buyer’s investment and our continuing involvement.
Discontinued Operations
Topic 360 extends the reporting of a discontinued operation to a “component of an entity,” and further requires that a component be classified as a discontinued operation if the operations and cash flows of the component have been or will be eliminated from the ongoing operations of the entity in the disposal transaction and the entity will not have any significant continuing involvement in the operations of the component after the disposal transaction. As defined in Topic 360, a “component of an entity” comprises operations and cash flows that can be clearly distinguished, operationally and for financial reporting purposes, from the rest of the entity. Because each of our real estate assets is generally accounted for in a discrete subsidiary, many constitute a component of an entity under Topic 360, increasing the likelihood that the disposition of assets that we hold for sale in the ordinary course of business must be reported as a discontinued operation unless we have significant continuing involvement in the operations of the asset after its disposition. Furthermore, operating profits and losses on such assets are required to be recognized and reported as operating profits and losses on discontinued operations in the periods in which they occur.
Business Promotion and Advertising Costs
The costs of business promotion and advertising are expensed as incurred. Business promotion and advertising costs of $27.5 million, $55.1 million and $66.5 million were included in operating, administrative and other expenses for the years ended December 31, 2009, 2008 and 2007, respectively.
Foreign Currencies
The financial statements of subsidiaries located outside the U.S. are generally measured using the local currency as the functional currency. The assets and liabilities of these subsidiaries are translated at the rates of exchange at the balance sheet date, and income and expenses are translated at the average monthly rate. The resulting translation adjustments are included in the accumulated other comprehensive loss component of equity. Gains and losses resulting from foreign currency transactions are included in the results of operations. The aggregate transaction losses (gains) included in the accompanying consolidated statements of operations for the years ended December 31, 2009, 2008 and 2007 was $0.6 million, ($6.4) million and $1.1 million, respectively.
Derivative Financial Instruments
We routinely monitor our exposure to currency exchange rate changes in connection with transactions and sometimes enter into foreign currency exchange swap, option and forward contracts to limit our exposure to such transactions, as appropriate. In the normal course of business, we also sometimes utilize derivative financial instruments in the form of foreign currency exchange contracts to mitigate foreign currency exchange exposure resulting from intercompany loans, expected cash flow and earnings. We apply the “Derivatives and Hedging” Topic of the FASB ASC (Topic 815) when accounting for any such contracts. Topic 815 requires us to recognize all qualifying derivative instruments as assets or liabilities on our balance sheet and measure them at fair value. This literature requires that changes in the fair value of derivatives be recognized in earnings unless specific
86
Table of Contents
CB RICHARD ELLIS GROUP, INC.
NOTES TO CONSOLIDATED FINANCIAL STATEMENTS—(Continued)
hedge accounting criteria are met. In all cases, we view derivative financial instruments as a risk management tool and, accordingly, do not engage in any speculative activities with respect to foreign currency.
On December 20, 2007, we entered into a foreign currency exchange forward contract with a notional amount of 46.0 million British pounds sterling, which expired on October 31, 2008, in order to hedge an intercompany loan. On February 28, 2008, we entered into three option agreements to sell a notional amount of 14.0 million of euros, 11.5 million of euros and 37.7 million of euros, which expired on June 26, 2008, September 26, 2008 and December 26, 2008, respectively. On December 22, 2008, we entered into a foreign currency exchange swap contract with an aggregate notional amount of 39.5 million British pounds sterling, which expired on February 18, 2009, at which time we entered into another contract with similar terms that was settled on April 6, 2009. On May 12, 2009, we entered into an option agreement to sell a notional amount of 25.0 million of euros, which expired on December 29, 2009. On June 26, 2009, we entered into two option agreements, including one to sell a notional amount of 5.5 million of British pounds sterling, which was exercised on September 28, 2009, and one to sell 10.0 million of British pounds sterling, which was sold on December 18, 2009. Included in the consolidated statements of operations were net losses of $3.7 million, net gains of $1.6 million and net losses of $8.1 million for the years ended December 31, 2009, 2008 and 2007, respectively, resulting from net losses and gains on foreign currency exchange swap, option and forward contracts. As of December 31, 2009, we had no foreign currency exchange contracts outstanding.
We also enter into loan commitments that relate to the origination or acquisition of commercial mortgage loans that will be held for resale. Topic 815 requires that these commitments be recorded at their fair values as derivatives. The net impact on our financial position and earnings resulting from these derivatives contracts has not been significant.
On February 26, 2007, we entered into two interest rate swap agreements with a total notional amount of $1.4 billion. On March 20, 2008, the total notional amount of the interest rate swap agreements was reduced to $950.0 million and on March 20, 2009, was reduced further to $410.0 million. The purpose of these interest rate swap agreements was to hedge potential changes to our cash flows due to the variable interest nature of our senior secured term loan facilities (see Note 13). On March 20, 2007, these interest rate swaps were designated as cash flow hedges. We incurred a loss on these interest rate swaps from the date we entered into the swaps up to the designation date of approximately $3.9 million, which is included in other loss in the accompanying consolidated statement of operations. There was no hedge ineffectiveness for the years ended December 31, 2009 and 2008 or for the period from March 20, 2007 through December 31, 2007. As of December 31, 2008, the fair value of these interest rate swap agreements was reflected as an $18.3 million liability and was included in other current liabilities in the accompanying consolidated balance sheets. The interest rate swaps expired on December 31, 2009. The fair value measurements employed for these interest rate swaps were based on observable market data, which falls within Level 2 of the fair value hierarchy.
From time to time, we enter into interest rate swap and cap agreements in order to limit our interest expense related to our notes payable on real estate. If any of these agreements are not designated as effective hedges, then they are marked to market each period with the change in fair value recognized in current period earnings. The net impact on our financial position and earnings resulting from gains and/or losses on interest rate swap and cap agreements associated with notes payable on real estate has not been significant.
Comprehensive Income (Loss)
Comprehensive income (loss) consists of net (loss) income and other comprehensive income (loss). In the accompanying consolidated balance sheets, accumulated other comprehensive loss consists of foreign currency translation adjustments, unrealized gains (losses) on interest rate swaps and interest rate caps, unrealized holding
87
Table of Contents
CB RICHARD ELLIS GROUP, INC.
NOTES TO CONSOLIDATED FINANCIAL STATEMENTS—(Continued)
gains (losses) on available for sale securities and other pension liability adjustments. Foreign currency translation adjustments exclude any income tax effect given that earnings of non-U.S. subsidiaries are deemed to be reinvested for an indefinite period of time (see Note 16). The income tax benefit (expense) associated with pension adjustments was $12.4 million, ($0.3) million and $2.3 million as of December 31, 2009, 2008 and 2007, respectively.
Marketable Securities
We account for investments in marketable debt and equity securities in accordance with the “Investments—Debt and Equity Securities” Topic of the FASB ASC (Topic 320). We determine the appropriate classification of debt and equity securities at the time of purchase and reevaluate such designation as of each balance sheet date. We classify marketable securities we acquire with the intent to generate a profit from short-term movements in market prices as trading securities. Debt securities are classified as held to maturity when we have the positive intent and ability to hold the securities to maturity. Marketable equity and debt securities not classified as trading or held to maturity are classified as available for sale.
Trading securities are carried at their fair value with realized and unrealized gains and losses included in net income. Available for sale securities are carried at their fair value and any difference between cost and fair value is recorded as unrealized gain or loss, net of income taxes, and is reported as accumulated other comprehensive loss in the consolidated statement of equity. Premiums and discounts are recognized in interest income using the effective interest method. Realized gains and losses and declines in value expected to be other-than-temporary on available for sale securities are included in other loss. The cost of securities sold is based on the specific identification method. Interest and dividends on securities classified as available for sale are included in interest income.
Warehouse Receivables
Our wholly-owned subsidiary CBRE Capital Markets is a Federal Home Loan Mortgage Corporation (Freddie Mac) approved Multifamily Program Plus Seller/Servicer and an approved Federal National Mortgage Association (Fannie Mae) Aggregation and Negotiated Transaction Seller/Servicer. In addition, CBRE Capital Markets wholly-owned subsidiary Multifamily Capital is an approved Fannie Mae Delegated Underwriting and Servicing (DUS) Seller/Servicer and CBRE Capital Markets wholly-owned subsidiary CBRE HMF is a U.S. Department of Housing and Urban Development (HUD) approved Non-Supervised Federal Housing Authority (FHA) Title II Mortgagee, an approved Multifamily Accelerated Processing (MAP) lender and an approved Government National Mortgage Association (Ginnie Mae) issuer of mortgage-backed securities (MBS). Under these arrangements, before loans are originated through proceeds from warehouse lines of credit, we obtain either a contractual loan purchase commitment from either Freddie Mac or Fannie Mae or a confirmed forward trade commitment for the issuance and purchase of a Fannie Mae or Ginnie Mae MBS that will be secured by the loans. The warehouse lines of credit are generally repaid within a one-month period when Freddie Mac or Fannie Mae buys the loans or upon settlement of the Fannie Mae or Ginnie Mae MBS, while we retain the servicing rights. Loans are funded at the prevailing market rates. We elect the fair value option for all warehouse receivables. At December 31, 2009, all of the warehouse receivables included in the accompanying consolidated balance sheets were either under commitment to be purchased by Freddie Mac or had confirmed forward trade commitments for the issuance and purchase of Fannie Mae or Ginnie Mae mortgage backed securities that will be secured by the underlying loans. At December 31, 2008, all of the warehouse receivables included in the accompanying consolidated balance sheets were under commitment to be purchased by Freddie Mac.
88
Table of Contents
CB RICHARD ELLIS GROUP, INC.
NOTES TO CONSOLIDATED FINANCIAL STATEMENTS—(Continued)
Mortgage Servicing Rights
In connection with the origination and sale of mortgage loans with servicing rights retained, we record servicing assets or liabilities based on the fair value of the mortgage servicing rights on the date the loans are sold. We also assume or purchase certain servicing assets. Servicing assets are carried at the lower of amortized cost or fair value in other intangible assets in the accompanying consolidated balance sheets and are amortized in proportion to and over the estimated period that net servicing income is expected to be received based on projections and timing of estimated future net cash flows.
Our recording of loan servicing rights at their fair value resulted in net gains, which have been reflected in the accompanying consolidated statements of operations. The amount of loan servicing rights recognized during the years ended December 31, 2009 and 2008 was as follows (dollars in thousands):
| Year Ended December 31, |
||||||||
| 2009 | 2008 | |||||||
| Beginning balance, loan servicing rights |
$ | 19,655 | $ | 12,989 | ||||
| Loan servicing rights recognized under Topic 860 |
27,622 | 11,793 | ||||||
| Loan servicing rights sold |
(1,416 | ) | (1,739 | ) | ||||
| Amortization expense |
(5,282 | ) | (3,388 | ) | ||||
| Ending balance, loan servicing rights |
$ | 40,579 | $ | 19,655 | ||||
Management evaluates its mortgage servicing assets for impairment on an annual basis or more often if circumstances or events indicate a change in the impairment status. Mortgage servicing rights do not actively trade in an open market with readily available observable prices; therefore, fair value is determined based on certain assumptions and judgments, including the estimation of the present value of future cash flows realized from servicing the underlying mortgage loans. Management’s assumptions include the benefits of servicing (servicing fee income and interest on escrow deposits), inflation, the cost of servicing, prepayment rates, delinquencies, discount rate and the estimated life of servicing cash flows. The assumptions used are subject to change based on management’s judgments and estimates of changes in future cash flows and interest rates, among other things. We did not incur any impairment charges related to our servicing rights during the years ended December 31, 2009, 2008 or 2007.
Accounting for Broker Draws
As part of our recruitment efforts relative to new U.S. brokers, we offer a transitional broker draw arrangement. Our broker draw arrangements generally last until such time as a broker’s pipeline of business is sufficient to allow him or her to earn sustainable commissions. This program is intended to provide the broker with a minimal amount of cash flow to allow adequate time for his or her training as well as time for him or her to develop business relationships. Similar to traditional salaries, the broker draws are paid irrespective of the actual revenues generated by the broker. Often these broker draws represent the only form of compensation received by the broker. Furthermore, it is not our general policy to pursue collection of unearned broker draws paid under this arrangement. As a result, we have concluded that broker draws are economically equivalent to salaries paid and accordingly charge them to compensation as incurred. The broker is also entitled to earn a commission on completed revenue transactions. This amount is calculated as the commission that would have been payable under our full commission program, less any amounts previously paid to the broker in the form of a draw.
89
Table of Contents
CB RICHARD ELLIS GROUP, INC.
NOTES TO CONSOLIDATED FINANCIAL STATEMENTS—(Continued)
Stock-Based Compensation
We account for all employee awards under the fair value recognition provisions of the “Compensation—Stock Compensation” Topic of the FASB ASC (Topic 718). Topic 718 requires the measurement of compensation cost at the grant date, based upon the estimated fair value of the award, and requires amortization of the related expense over the employee’s requisite service period.
See Note 15 for additional information on our stock-based compensation plans.
Income (Loss) Per Share
Basic income (loss) per share attributable to CB Richard Ellis Group, Inc. is computed by dividing net income (loss) attributable to CB Richard Ellis Group, Inc. shareholders by the weighted average number of common shares outstanding during each period. The computation of diluted income (loss) per share attributable to CB Richard Ellis Group, Inc. further assumes the dilutive effect of potential common shares, which include stock options and certain contingently issuable shares. Contingently issuable shares consist of non-vested stock awards. Stock options and contingently issuable shares are included in the dilutive (loss) income per share calculation under the treasury stock method. For the year ended December 31, 2008, all stock options and contingently issuable shares were anti-dilutive since we reported a net loss for this period. As a result, the weighted average number of common shares outstanding for the basic loss per share computation was equal to the weighted average number of common shares outstanding for the diluted loss per share computation for the year ended December 31, 2008 (see Note 18).
Income Taxes
Income taxes are accounted for under the asset and liability method in accordance with FASB ASC Topic 740, “Accounting for Income Taxes” (Topic 740). Deferred tax assets and liabilities are determined based on temporary differences between the financial reporting and the tax basis of assets and liabilities and operating loss and tax credit carry forwards. Deferred tax assets and liabilities are measured by applying enacted tax rates and laws and are released in the years in which the temporary differences are expected to be recovered or settled. The effect on deferred tax assets and liabilities of a change in tax rates is recognized in income in the period that includes the enactment date. Valuation allowances are provided against deferred tax assets when it is more likely than not that some portion or all of the deferred tax asset will not be realized.
Self-Insurance
Our wholly-owned captive insurance company, which is subject to applicable insurance rules and regulations, insures our exposure related to workers’ compensation benefits provided to employees and purchases excess coverage from an unrelated insurance carrier. We purchase general liability and automotive insurance through an unrelated insurance carrier. The captive insurance company reinsures the related deductibles. The captive insurance company also insures deductibles relating to other coverages. Given the nature of these types of claims, it may take several years for resolution and determination of the cost of these claims. We are required to estimate the cost of these claims in our financial statements. We are responsible for estimating our exposure to workers’ compensation, general liability and automotive claims.
The estimates that we utilize to record our potential losses on claims are inherently subjective, and actual claims could differ from amounts recorded, which could result in increased or decreased expense in future periods. As of December 31, 2009 and 2008, our reserve for claims under these insurance programs were $20.8 million and $16.2 million, respectively, which were included in other current and other long-term liabilities in the accompanying consolidated balance sheets. Of these amounts, $6.3 million and $5.7 million, respectively, represented our estimated current liabilities as of December 31, 2009 and 2008.
90
Table of Contents
CB RICHARD ELLIS GROUP, INC.
NOTES TO CONSOLIDATED FINANCIAL STATEMENTS—(Continued)
Non-Controlling Interests in Consolidated Limited Life Subsidiaries
As of December 31, 2009, the carrying value of non-controlling interests in our consolidated limited life subsidiaries, which was included in non-controlling interests in the accompanying consolidated balance sheets, was $113.3 million, which approximated its settlement value. As of December 31, 2008, the estimated settlement value of non-controlling interests in our consolidated limited life subsidiaries was $155.6 million, as compared to the carrying value of $150.5 million, which was included in non-controlling interests in the accompanying consolidated balance sheets.
Subsequent Events
We have evaluated events and transactions that have occurred subsequent to December 31, 2009 through the date of issuance of our consolidated financial statements for potential recognition or disclosure in these consolidated financial statements.
New Accounting Pronouncements
In December 2008, the FASB issued FASB Staff Position, Statement of Financial Accounting Standards (SFAS) No. 132R-1, “Employers’ Disclosures about Postretirement Benefit Plan Assets,” which is now included in the “Compensation-Retirement Benefits” Topic of the FASB ASC (Topic 715), requiring employers to provide additional disclosures about plan assets of a defined benefit pension or other post-retirement plan. These disclosures principally include information detailing investment policies and strategies, the major categories of plan assets, the inputs and valuation techniques used to measure the fair value of plan assets and an understanding of significant concentrations of risk within plan assets. As required, we have adopted this provision of Topic 715 and have expanded our disclosure requirements (see Note 15).
In December 2009, the FASB issued Accounting Standards Update (ASU) 2009-16, “Transfers and Servicing (ASC Topic 860)—Accounting for Transfers of Financial Assets.” ASU 2009-16 revises previous authoritative guidance related to accounting for transfers of financial assets, and will require more disclosures about transfers of financial assets, including securitization transactions, and where entities have continuing exposure to the risks related to transferred financial assets. Among other things, ASU 2009-16 eliminates the concept of a “qualifying special-purpose entity,” changes the requirements for derecognizing financial assets and enhances information reported to users of financial statements by providing greater transparency about transfers of financial assets and an entity’s continuing involvement in transferred financial assets. ASU 2009-16 is effective at the start of a reporting entity’s first fiscal year beginning after November 15, 2009, with early application prohibited. We are currently evaluating the impact of adoption, but do not expect it to have a material effect on our consolidated financial position or results of operations.
In December 2009, the FASB issued ASU 2009-17, “Consolidations (Topic 810): Improvements to Financial Reporting by Enterprises Involved with Variable Interest Entities.” This ASU incorporates SFAS No. 167, “Amendments to FASB Interpretation No. 46(R),” issued by the FASB in June 2009. The amendments in this ASU replace the quantitative-based risks and rewards calculation for determining which reporting entity, if any, has a controlling financial interest in a variable interest entity with an approach focused on identifying which reporting entity has the power to direct the activities of a variable interest entity that most significantly impact such entity’s economic performance and (i) the obligation to absorb losses of such entity or (ii) the right to receive benefits from such entity. ASU 2009-17 also requires additional disclosures about a reporting entity’s involvement in variable interest entities, which will enhance the information provided to users of financial statements. ASU 2009-17 is effective as of the start of the first annual and interim reporting periods beginning after November 15, 2009, with early adoption prohibited. We are currently evaluating the impact of adoption, but do not expect it to have a material effect on our consolidated financial position or results of operations.
91
Table of Contents
CB RICHARD ELLIS GROUP, INC.
NOTES TO CONSOLIDATED FINANCIAL STATEMENTS—(Continued)
In January 2010, the FASB issued ASU 2010-06, “Improving Disclosures about Fair Value Measurements,” which provides amendments to the FASB ASC Subtopic 820-10 that require new disclosures regarding (i) transfers in and out of Level 1 and Level 2 fair value measurements and (ii) activity in Level 3 fair value measurements. ASU 2010-06 also clarifies existing disclosures regarding (i) the level of asset and liability disaggregation and (ii) fair value measurement inputs and valuation techniques. The new disclosures and clarifications of existing disclosures are effective for interim and annual reporting periods beginning after December 15, 2009, except for the disclosures about purchases, sales, issuances, and settlements in the roll forward of activity in Level 3 fair value measurements. Those disclosures are effective for fiscal years beginning after December 15, 2010, and for interim periods within those fiscal years. We are currently evaluating the disclosure impact of adoption on our consolidated financial statements, but do not expect it to have a material impact.
3. Fair Value Measurements
The “Fair Value Measurements and Disclosures” Topic of the FASB ASC (Topic 820) defines fair value as the exchange price that would be received for an asset or paid to transfer a liability (an exit price) in the principal or most advantageous market for the asset or liability in an orderly transaction between market participants at the measurement date. Topic 820 also establishes a three-level fair value hierarchy that prioritizes the inputs used to measure fair value. This hierarchy requires entities to maximize the use of observable inputs and minimize the use of unobservable inputs. The three levels of inputs used to measure fair value are as follows:
| • | Level 1—Quoted prices in active markets for identical assets or liabilities. |
| • | Level 2—Observable inputs other than quoted prices included in Level 1, such as quoted prices for similar assets and liabilities in active markets; quoted prices for identical or similar assets and liabilities in markets that are not active; or other inputs that are observable or can be corroborated by observable market data. |
| • | Level 3—Unobservable inputs that are supported by little or no market activity and that are significant to the fair value of the assets or liabilities. This includes certain pricing models, discounted cash flow methodologies and similar techniques that use significant unobservable inputs. |
We do not have any material assets or liabilities that are required to be recorded at fair value on a recurring basis.
The following non-recurring fair value measurements were recorded during the year ended December 31, 2009 (dollars in thousands):
| Net Carrying Value as of December 31, 2009 |
Fair Value Measured and Recorded Using |
Total Impairment Charges for the Year Ended December 31, 2009 | |||||||||||||
| Level 1 | Level 2 | Level 3 | |||||||||||||
| Investments in unconsolidated subsidiaries |
$ | 67,756 | $ | — | $ | — | $ | 67,756 | $ | 35,738 | |||||
| Real estate |
$ | 130,786 | $ | — | $ | — | $ | 130,786 | 32,691 | ||||||
| Notes receivable |
$ | — | $ | — | $ | — | $ | — | 5,860 | ||||||
| Total impairment charges |
$ | 74,289 | |||||||||||||
92
Table of Contents
CB RICHARD ELLIS GROUP, INC.
NOTES TO CONSOLIDATED FINANCIAL STATEMENTS—(Continued)
Investments in Unconsolidated Subsidiaries
During the year ended December 31, 2009, we recorded investment write-downs of $35.7 million, which were included in equity loss from unconsolidated subsidiaries in the accompanying consolidated statements of operations. Of this amount, $9.2 million was attributable to non-controlling interests. During the year ended December 31, 2009, $10.7 million of the investment write-downs were reported in our Global Investment Management segment and were primarily driven by a decrease in the estimated holding period of certain assets held within our global investment management portfolio. In addition, $7.0 million of investment write-downs were reported in our Development Services segment, primarily resulting from the weak economic conditions, including high unemployment and slow leasing. Lastly, during the year ended December 31, 2009, we incurred an additional $18.0 million of impairment charges, mainly attributable to declines in value of several investments, primarily as a result of significant capital market turmoil, which has continued to adversely affect global commercial real estate fundamentals (as evidenced by low transaction volumes and illiquidity in the capital markets due to the tightened lending standards for commercial real estate). Of the additional impairment charges noted above, $9.9 million was reported in our Global Investment Management segment and $8.1 million was reported in our Development Services segment.
When we performed our impairment analysis, the assumptions utilized reflected our outlook for the commercial real estate industry and the impact on our business. This outlook incorporated our belief that market conditions continued to deteriorate and that these challenging conditions could persist for some time. If either general economic conditions or activity in the capital markets worsen, we may be required to evaluate additional investments or re-evaluate previously impaired investments for potential impairment. These evaluations could result in additional write-downs, which may be material. The fair value measurements employed for these investments were generally based on a discounted cash flow approach and/or review of comparable activities in the marketplace, which falls within Level 3 of the fair value hierarchy.
Real Estate
During the year ended December 31, 2009, we recorded charges of $32.7 million, including impairment charges on real estate and provision for losses on real estate held for sale. These charges were included in operating, administrative and other expenses in the accompanying consolidated statements of operations within our Development Services segment. Of this amount, $27.0 million was attributable to non-controlling interests. During the fourth quarter of 2008, commercial real estate fundamentals in the U.S. weakened significantly, impacted by the overall downturn in the economy and market illiquidity. These conditions continued through 2009. As a result, during the year ended December 31, 2009, we recorded impairment charges of $28.8 million related to 13 projects where the carrying value was not recoverable primarily due to a decrease in the estimated holding periods of the projects. Additionally, during the year ended December 31, 2009, we recorded provision for losses on real estate held for sale of $3.9 million to reduce the carrying values of a condominium project and two pieces of land to their fair value less cost to sell, primarily due to reduced selling prices resulting from market conditions.
If conditions in the broader economy, commercial real estate industry, specific markets or product types in which we operate worsen and/or markets remain illiquid, we may be required to evaluate additional projects or re-evaluate previously impaired projects for potential impairment. These evaluations could result in additional impairment charges, which may be material.
The fair value measurements employed for our impairment evaluations were generally based on a discounted cash flow approach and/or review of comparable activities in the marketplace, which falls within Level 3 of the fair value hierarchy.
93
Table of Contents
CB RICHARD ELLIS GROUP, INC.
NOTES TO CONSOLIDATED FINANCIAL STATEMENTS—(Continued)
Notes Receivable
During the year ended December 31, 2009, we recorded a $5.9 million impairment charge on two notes receivable secured by real estate as a result of the borrower defaulting on the notes. This impairment charge was included in operating, administrative and other expenses in the accompanying consolidated statement of operations within our Development Services segment. Of this amount, $5.4 million was attributable to non-controlling interests. These defaults resulted from the borrowers’ noncompliance with certain terms of the note agreements. As a result, we accepted assignment of the underlying real estate assets in lieu of foreclosing under our security deeds. The impairment charge we recorded represents the difference between the carrying amounts of the notes and the fair value of the real estate assets acquired. This transaction also resulted in a non-cash reclassification of $17.3 million from notes receivable to real estate held for investment during the year ended December 31, 2009.
The fair value measurements employed for this impairment evaluation were generally based on a discounted cash flow approach and review of comparable activities in the marketplace, which falls within Level 3 of the fair value hierarchy.
FASB ASC Topic 820 also requires disclosure of fair value information about financial instruments, whether or not recognized in the accompanying consolidated balance sheets, as follows:
Cash and Cash Equivalents and Restricted Cash: These balances include cash and cash equivalents as well as restricted cash with maturities of less than three months. The carrying amount approximates fair value due to the short-term maturities of these instruments.
Receivables, less Allowance for Doubtful Accounts: Due to their short-term nature, fair value approximates carrying value.
Warehouse Receivables: Due to their short-term nature, fair value approximates carrying value. Fair value is determined based on the terms and conditions of funded mortgage loans and generally reflects the values of the warehouse lines of credit outstanding for our wholly-owned subsidiary, CBRE Capital Markets (See Note 13).
Available for Sale Securities: These investments are carried at their fair value.
Short-Term Borrowings: The majority of this balance represents our revolving credit facility and our warehouse lines of credit outstanding for CBRE Capital Markets. Due to the short-term nature and variable interest rates of these instruments, fair value approximates carrying value (See Note 13).
Senior Secured Term Loans: Based upon information from third-party banks, the estimated fair value of our senior secured term loans was approximately $1.6 billion at December 31, 2009. Their actual carrying value totaled $1.7 billion at December 31, 2009 (See Note 13).
11.625% Senior Subordinated Notes: Based on dealers’ quotes, the estimated fair value of our 11.625% senior subordinated notes was $487.2 million at December 31, 2009. Their actual carrying value totaled $436.5 million at December 31, 2009 (See Note 13).
Notes Payable on Real Estate: As of December 31, 2009, the carrying value of our notes payable on real estate was $551.3 million (See Note 12). These borrowings mostly have floating interest rates at spreads over a market rate index. Given the credit crunch experienced during 2008 and 2009, it is likely that some portion of our notes payable on real estate have fair values lower than actual carrying values. However, given the volume of notes payable we have and the cost involved in estimating their fair value, we determined it was not practicable to do so. Additionally, only $3.5 million of these notes payable are recourse to us as of December 31, 2009.
94
Table of Contents
CB RICHARD ELLIS GROUP, INC.
NOTES TO CONSOLIDATED FINANCIAL STATEMENTS—(Continued)
4. Restricted Cash
Included in the accompanying consolidated balance sheets as of December 31, 2009 and 2008, is restricted cash of $46.8 million and $36.3 million, respectively. The balances primarily include restricted cash set aside to cover funding obligations as required by contracts executed by us in the normal course of business, including escrow accounts held in our Development Services segment. The balances also include restricted cash set aside to cover deferred purchase consideration associated with the Trammell Crow Company Acquisition, escrow accounts related to strategic in-fill acquisitions and cash pledged to secure the guarantee of certain short-term notes issued in connection with previous acquisitions by Insignia in the U.K. The deferred purchase consideration relates to outstanding shares of Trammell Crow Company common stock that have not yet been surrendered for payment. Payment in full is being made as share certificates are surrendered for payment.
5. Property and Equipment
Property and equipment consists of the following (dollars in thousands):
| December 31, | ||||||||||
| Useful Lives | 2009 | 2008 | ||||||||
| Computer hardware and software |
3 years | $ | 204,784 | $ | 201,894 | |||||
| Furniture and equipment |
3-10 years | 142,352 | 140,509 | |||||||
| Leasehold improvements |
1-10 years | 126,318 | 122,278 | |||||||
| Equipment under capital leases |
1-10 years | 5,473 | 7,339 | |||||||
| Total cost |
478,927 | 472,020 | ||||||||
| Accumulated depreciation |
(299,952 | ) | (264,044 | ) | ||||||
| Property and equipment, net |
$ | 178,975 | $ | 207,976 | ||||||
Depreciation expense associated with property and equipment was $59.4 million, $63.9 million and $53.9 million for the years ended December 31, 2009, 2008 and 2007, respectively.
95
Table of Contents
CB RICHARD ELLIS GROUP, INC.
NOTES TO CONSOLIDATED FINANCIAL STATEMENTS—(Continued)
6. Goodwill and Other Intangible Assets
The following table summarizes the changes in the carrying amount of goodwill for the years ended December 31, 2009 and 2008 (dollars in thousands):
| Americas | EMEA | Asia Pacific |
Global Investment Management |
Development Services |
Total | |||||||||||||||||||
| Balance as of December 31, 2007 |
||||||||||||||||||||||||
| Goodwill |
$ | 1,621,145 | $ | 345,710 | $ | 82,961 | $ | 38,231 | $ | 86,663 | $ | 2,174,710 | ||||||||||||
| Accumulated impairment losses |
— | — | — | — | — | — | ||||||||||||||||||
| 1,621,145 | 345,710 | 82,961 | 38,231 | 86,663 | 2,174,710 | |||||||||||||||||||
| Purchase accounting adjustments related to acquisitions |
15,039 | 166,117 | 11,811 | 9,576 | — | 202,543 | ||||||||||||||||||
| Impairment losses |
(798,290 | ) | (138,631 | ) | — | (44,922 | ) | (86,663 | ) | (1,068,506 | ) | |||||||||||||
| Foreign exchange movement |
(3,136 | ) | (42,731 | ) | (8,172 | ) | (2,885 | ) | — | (56,924 | ) | |||||||||||||
| Balance as of December 31, 2008 |
||||||||||||||||||||||||
| Goodwill |
1,633,048 | 469,096 | 86,600 | 44,922 | 86,663 | 2,320,329 | ||||||||||||||||||
| Accumulated impairment losses |
(798,290 | ) | (138,631 | ) | — | (44,922 | ) | (86,663 | ) | (1,068,506 | ) | |||||||||||||
| 834,758 | 330,465 | 86,600 | — | — | 1,251,823 | |||||||||||||||||||
| Purchase accounting adjustments related to acquisitions |
452 | 10,233 | 18,800 | — | — | 29,485 | ||||||||||||||||||
| Foreign exchange movement |
2,080 | 11,493 | 11,491 | — | — | 25,064 | ||||||||||||||||||
| Balance as of December 31, 2009 |
||||||||||||||||||||||||
| Goodwill |
1,635,580 | 490,822 | 116,891 | 44,922 | 86,663 | 2,374,878 | ||||||||||||||||||
| Accumulated impairment losses |
(798,290 | ) | (138,631 | ) | — | (44,922 | ) | (86,663 | ) | (1,068,506 | ) | |||||||||||||
| $ | 837,290 | $ | 352,191 | $ | 116,891 | $ | — | $ | — | $ | 1,306,372 | |||||||||||||
We completed 16 acquisitions with an aggregate purchase price of approximately $181 million during the year ended December 31, 2008, primarily in the first half of the year. The companies we acquired were generally quality regional firms, niche specialty firms that complemented our existing platform within a region, or affiliates in which, in some cases, we held an equity interest. These included three notable acquisitions within our EMEA segment: the acquisition of Eurisko Consulting SRL, the largest independent commercial real estate services company in Romania, which extends our ability to deliver the premier commercial real estate services offering across Central and Eastern Europe; the acquisition of CB Richard Ellis Cederholm A/S, an affiliate company in Denmark, which significantly strengthens our platform in Scandinavia by giving us a wholly-owned position in one of the region’s most active property markets; and the acquisition of Espansione Commerciale, the market leader in shopping centre leasing and property management in Italy, which extends our international retail services capability in that region. In light of the current economic environment, no acquisitions were completed during the year ended December 31, 2009.
Our annual assessment of goodwill and other intangible assets deemed to have indefinite lives has historically been completed as of the beginning of the fourth quarter of each year. We performed the 2009, 2008 and 2007 annual assessments as of October 1. We determined that no impairment of goodwill existed as of October 1, 2009 and 2007. However, we were required to re-perform the 2008 assessment as of December 31, 2008 because economic conditions worsened, the capital markets became distressed and our stock price dropped significantly in the fourth quarter of 2008. This was evidenced in our 2008 results by weak sales and leasing activity in our Americas and EMEA segments caused by the credit crunch and significant capital market turmoil
96
Table of Contents
CB RICHARD ELLIS GROUP, INC.
NOTES TO CONSOLIDATED FINANCIAL STATEMENTS—(Continued)
adversely affecting incentive-based revenue within our Global Investment Management segment as well as reduced real estate sales volume and values in our Development Services segment. Based on our assessments of goodwill in 2008, we determined that we had impairment in several reporting units, which was driven by these adverse economic conditions causing a decline in the estimated future discounted cash flows expected for such units. The amount of the pre-tax goodwill impairment charges included in our statement of operations for the year ended December 31, 2008 was $1.1 billion. If we experience a significant or sustained decline in our future cash flows and/or if the current economic conditions significantly worsen, we may need to perform additional impairment analysis in the future.
Other intangible assets totaled $322.9 million and $311.4 million, net of accumulated amortization of $138.2 million and $114.7 million, as of December 31, 2009 and 2008, respectively, and are comprised of the following (dollars in thousands):
| December 31, | ||||||||||||||
| 2009 | 2008 | |||||||||||||
| Gross Carrying Amount |
Accumulated Amortization |
Gross Carrying Amount |
Accumulated Amortization |
|||||||||||
| Unamortizable intangible assets |
||||||||||||||
| Trademarks |
$ | 56,800 | $ | 56,800 | ||||||||||
| Trade names |
19,826 | 19,826 | ||||||||||||
| $ | 76,626 | $ | 76,626 | |||||||||||
| Amortizable intangible assets |
||||||||||||||
| Customer relationships |
$ | 230,384 | (38,270 | ) | $ | 229,748 | (25,382 | ) | ||||||
| Backlog and incentive fees |
47,638 | (47,638 | ) | 47,126 | (47,126 | ) | ||||||||
| Management contracts |
25,546 | (23,653 | ) | 24,161 | (21,332 | ) | ||||||||
| Loan servicing rights |
55,294 | (14,715 | ) | 29,239 | (9,584 | ) | ||||||||
| Other |
25,660 | (13,968 | ) | 19,232 | (11,261 | ) | ||||||||
| $ | 384,522 | $ | (138,244 | ) | $ | 349,506 | $ | (114,685 | ) | |||||
| Total intangible assets |
$ | 461,148 | $ | (138,244 | ) | $ | 426,132 | $ | (114,685 | ) | ||||
Trademarks of $56.8 million were separately identified as a result of the 2001 Merger. As a result of the Insignia Acquisition, a $19.8 million trade name was separately identified, which represented the Richard Ellis trade name in the U.K. that was owned by Insignia.
During the year ended December 31, 2008, we determined that two of our intangible assets, $84.0 million representing the Trammell Crow trade name and $6.9 million representing the CBRE Melody trademark, identified as a result of the 2001 Merger, were fully impaired. The impairment of the Trammell Crow trade name was driven by the significant capital market turmoil reducing real estate sales volume and values in our Development Services segment in 2008 and causing a significant decline in the estimated future discounted cash flows such that we could not substantiate this trade name having any book value. The impairment of the CBRE Melody trademark was driven by our mortgage brokerage business’s plans to cease use of the Melody trademark and exclusively use the CBRE trademark. The amount of the pre-tax other non-amortizable intangible asset impairment charges included in our statement of operations for the year ended December 31, 2008 was $90.9 million. We did not record any impairment charges related to intangible assets during the years ended December 31, 2009 and 2007. Our remaining trademark and trade name at December 31, 2009 have indefinite useful lives and accordingly are not being amortized.
97
Table of Contents
CB RICHARD ELLIS GROUP, INC.
NOTES TO CONSOLIDATED FINANCIAL STATEMENTS—(Continued)
Customer relationships primarily represent intangible assets identified in the Trammell Crow Company Acquisition relating to existing relationships primarily in the brokerage, property management, project management and facilities management lines of business. These intangible assets are being amortized over useful lives of up to 20 years.
Backlog and incentive fees mostly represented the fair value of net revenue backlog and incentive fees acquired as part of the Trammell Crow Company Acquisition as well as other in-fill acquisitions. These intangible assets were amortized over useful lives of up to one year.
Management contracts consist primarily of property management contracts in the U.S., Canada, the U.K. and France, as well as valuation services and fund management contracts in the U.K. These management contracts are being amortized over useful lives of up to ten years.
Loan servicing rights represent the fair value of servicing assets in our mortgage brokerage line of business in the U.S. The loan servicing rights are being amortized over the useful lives of the underlying loans, which are generally up to ten years.
Other amortizable intangible assets mainly represent other intangible assets acquired as a result of the Trammell Crow Company Acquisition and Insignia Acquisition. These include certain acquired Trammell Crow Company contract intangibles. Additionally, these include other intangible assets recognized for non-contractual revenue acquired in the U.S. as well as franchise agreements and a trade name in France acquired in the Insignia Acquisition. Other intangible assets are being amortized over useful lives of up to 20 years.
Amortization expense related to intangible assets was $19.6 million, $20.8 million and $48.6 million for the years ended December 31, 2009, 2008 and 2007, respectively. The estimated annual amortization expense for each of the years ending December 31, 2010 through December 31, 2014 approximates $21.7 million, $20.3 million, $18.2 million, $17.3 million and $16.5 million, respectively.
7. Investments in Unconsolidated Subsidiaries
Investments in unconsolidated subsidiaries are accounted for under the equity method of accounting and include the following (dollars in thousands):
| December 31, | ||||||
| 2009 | 2008 | |||||
| Development Services |
$ | 31,045 | $ | 53,061 | ||
| Global Investment Management |
83,010 | 71,648 | ||||
| Other |
21,541 | 21,017 | ||||
| $ | 135,596 | $ | 145,726 | |||
98
Table of Contents
CB RICHARD ELLIS GROUP, INC.
NOTES TO CONSOLIDATED FINANCIAL STATEMENTS—(Continued)
Combined condensed financial information for the entities accounted for using the equity method is as follows (dollars in thousands):
Condensed Balance Sheets Information:
| December 31, | ||||||
| 2009 | 2008 | |||||
| Development Services: |
||||||
| Real estate |
$ | 2,131,633 | $ | 1,814,413 | ||
| Other assets |
106,971 | 107,050 | ||||
| Total assets |
$ | 2,238,604 | $ | 1,921,463 | ||
| Notes payable on real estate |
$ | 1,374,331 | $ | 1,044,768 | ||
| Other liabilities |
218,720 | 240,092 | ||||
| Total liabilities |
$ | 1,593,051 | $ | 1,284,860 | ||
| Global Investment Management: |
||||||
| Current assets |
$ | 820,523 | $ | 593,448 | ||
| Non-current assets |
7,792,724 | 7,298,472 | ||||
| Total assets |
$ | 8,613,247 | $ | 7,891,920 | ||
| Current liabilities |
$ | 1,661,246 | $ | 2,420,622 | ||
| Non-current liabilities |
4,529,392 | 2,661,824 | ||||
| Total liabilities |
$ | 6,190,638 | $ | 5,082,446 | ||
| Other: |
||||||
| Current assets |
$ | 84,233 | $ | 1,559,703 | ||
| Non-current assets |
41,455 | 122,455 | ||||
| Total assets |
$ | 125,688 | $ | 1,682,158 | ||
| Current liabilities |
$ | 52,106 | $ | 1,225,965 | ||
| Non-current liabilities |
24,406 | 62,027 | ||||
| Total liabilities |
$ | 76,512 | $ | 1,287,992 | ||
| Non-controlling interest |
$ | 2,409 | $ | 1,724 | ||
| Total: |
||||||
| Assets |
$ | 10,977,539 | $ | 11,495,541 | ||
| Liabilities |
$ | 7,860,201 | $ | 7,655,298 | ||
| Non-controlling interest |
$ | 2,409 | $ | 1,724 | ||
Condensed Statements of Operations Information:
| Year Ended December 31, | |||||||||||
| 2009 | 2008 | 2007 | |||||||||
| Development Services: |
|||||||||||
| Revenue |
$ | 95,004 | $ | 57,947 | $ | 60,347 | |||||
| Operating income |
$ | 31,484 | $ | 40,997 | $ | 88,637 | |||||
| Net income |
$ | 354 | $ | 22,595 | $ | 70,084 | |||||
| Global Investment Management: |
|||||||||||
| Revenue |
$ | 639,933 | $ | 566,439 | $ | 413,234 | |||||
| Operating (loss) income |
$ | (845,610 | ) | $ | 36,627 | $ | 82,080 | ||||
| Net (loss) income |
$ | (1,063,020 | ) | $ | (617,154 | ) | $ | 395,899 | |||
| Other: |
|||||||||||
| Revenue |
$ | 158,075 | $ | 292,064 | $ | 388,132 | |||||
| Operating income (loss) |
$ | 17,605 | $ | (88,745 | ) | $ | 145,214 | ||||
| Net income (loss) |
$ | 18,030 | $ | (10,382 | ) | $ | 8,469 | ||||
| Total: |
|||||||||||
| Revenue |
$ | 893,012 | $ | 916,450 | $ | 861,713 | |||||
| Operating (loss) income |
$ | (796,521 | ) | $ | (11,121 | ) | $ | 315,931 | |||
| Net (loss) income |
$ | (1,044,636 | ) | $ | (604,941 | ) | $ | 474,452 | |||
99
Table of Contents
CB RICHARD ELLIS GROUP, INC.
NOTES TO CONSOLIDATED FINANCIAL STATEMENTS—(Continued)
During the year ended December 31, 2009, we recorded non-cash write-downs of $20.6 million and $15.1 million, respectively, in our Global Investment Management and Development Services segments (see Note 3). Of these write-downs, $6.9 million and $2.3 million, respectively, were attributable to non-controlling interests.
During the year ended December 31, 2008, we recorded write-downs of $32.1 million and $29.5 million, respectively, in our Global Investment Management and Development Services segments. Of these write-downs, $3.3 million and $2.5 million, respectively, were attributable to non-controlling interests. These write-downs were attributable to declines in value of several investments, primarily as a result of significant capital market turmoil. During the fourth quarter of 2008, commercial real estate fundamentals in the U.S. weakened significantly, impacted by the overall downturn in the economy and market illiquidity. Transactions declined significantly due to illiquidity in the capital markets as many lenders tightened lending standards for commercial real estate. When we performed our impairment analysis, the assumptions utilized reflected our outlook for the commercial real estate industry and the impact on our business. This outlook incorporated our belief that market conditions deteriorated and that these challenging conditions could persist for some time. The fair value measurements employed for these investments were generally based on a discounted cash flow approach and/or review of comparable activities in the marketplace, which falls within Level 3 of the fair value hierarchy.
Additionally, during the year ended December 31, 2008, we recorded write-downs of $14.7 million in our Americas segment related to our investment in Realty Finance Corporation, a mortgage REIT. These write-downs were attributable to declines in market value. The fair value measurement utilized for Realty Finance Corporation was the stock price quoted on the New York Stock Exchange, which falls within Level 1 of the fair value hierarchy.
All of the write-downs discussed above were included in equity loss from unconsolidated subsidiaries in the accompanying consolidated statements of operations. We did not record any impairment charges related to our equity investments during the year ended December 31, 2007. If either general economic conditions or activity in the capital markets worsen, we may be required to evaluate additional investments or re-evaluate previously impaired investments for potential impairment. These evaluations could result in additional write-downs, which may be material.
During the year ended December 31, 2008, we also recorded a $10.9 million impairment charge on a note receivable related to one of our equity investments in our Development Services segment. Management did not believe that the note would ultimately be collected, based upon the estimated value of the related equity method investment. This estimated value was based upon market comparisons of similar assets, which falls within Level 3 of the fair value hierarchy. This impairment charge was included in operating, administrative and other expenses in the accompanying consolidated statements of operations. We did not record any impairment charges related to this note during the years ended December 31, 2009 or 2007.
Our Global Investment Management segment involves investing our own capital in certain real estate investments with clients. We have provided investment management, property management, brokerage and other professional services in connection with these real estate investments on an arm’s length basis and earned revenues from these unconsolidated subsidiaries of $83.6 million, $88.3 million and $93.4 million during the years ended December 31, 2009, 2008 and 2007, respectively.
Our Development Services segment has agreements to provide development, property management and brokerage services to certain of our unconsolidated development subsidiaries on an arm’s length basis and earned revenues from these unconsolidated subsidiaries. Revenue related to these agreements included in our results for the years ended December 31, 2009, 2008 and 2007 was $4.1 million, $10.6 million and $7.7 million, respectively.
100
Table of Contents
CB RICHARD ELLIS GROUP, INC.
NOTES TO CONSOLIDATED FINANCIAL STATEMENTS—(Continued)
8. Marketable Securities
The following tables are a summary of available for sale marketable securities held by us (dollars in thousands):
| December 31, 2009 | |||||||||||||
| Amortized Cost |
Gross Unrealized Gains |
Gross Unrealized Losses |
Estimated Fair Value | ||||||||||
| U.S. Treasury securities and obligations of U.S. government agencies |
$ | 16,637 | $ | 257 | $ | (44 | ) | $ | 16,850 | ||||
| Corporate debt securities |
4,609 | 422 | (17 | ) | 5,014 | ||||||||
| Asset-backed securities |
2,691 | 252 | (35 | ) | 2,908 | ||||||||
| Collateralized mortgage obligations |
996 | 19 | (2 | ) | 1,013 | ||||||||
| Other |
1,470 | 99 | (1 | ) | 1,568 | ||||||||
| Total debt securities |
26,403 | 1,049 | (99 | ) | 27,353 | ||||||||
| Equity securities |
4,808 | 806 | (86 | ) | 5,528 | ||||||||
| Total available for sale securities |
$ | 31,211 | $ | 1,855 | $ | (185 | ) | $ | 32,881 | ||||
| December 31, 2008 | |||||||||||||
| Amortized Cost |
Gross Unrealized Gains |
Gross Unrealized Losses |
Estimated Fair Value | ||||||||||
| U.S. Treasury securities and obligations of U.S. government agencies |
$ | 14,236 | $ | 408 | $ | (1 | ) | $ | 14,643 | ||||
| Corporate debt securities |
4,402 | 45 | (456 | ) | 3,991 | ||||||||
| Asset-backed securities |
3,460 | — | (198 | ) | 3,262 | ||||||||
| Collateralized mortgage obligations |
1,915 | 13 | (79 | ) | 1,849 | ||||||||
| Other |
747 | 5 | (119 | ) | 633 | ||||||||
| Total debt securities |
24,760 | 471 | (853 | ) | 24,378 | ||||||||
| Equity securities |
6,545 | 123 | (2,015 | ) | 4,653 | ||||||||
| Total available for sale securities |
$ | 31,305 | $ | 594 | $ | (2,868 | ) | $ | 29,031 | ||||
The net carrying value and estimated fair value of debt securities at December 31, 2009, by contractual maturity, are shown below. Actual repayment dates may differ from contractual maturities because the issuers of the securities may have the right to prepay obligations.
| December 31, 2009 | ||||||
| Amortized Cost |
Estimated Fair Value | |||||
| (Dollars in thousands) | ||||||
| Debt securities: |
||||||
| Due in one year or less |
$ | 871 | $ | 865 | ||
| Due after one year through five years |
15,613 | 15,912 | ||||
| Due after five years through ten years |
4,762 | 5,087 | ||||
| Asset-backed securities |
2,691 | 2,908 | ||||
| Collateralized mortgage obligations |
996 | 1,013 | ||||
| Other |
1,470 | 1,568 | ||||
| Total debt securities |
$ | 26,403 | $ | 27,353 | ||
101
Table of Contents
CB RICHARD ELLIS GROUP, INC.
NOTES TO CONSOLIDATED FINANCIAL STATEMENTS—(Continued)
During the year ended December 31, 2008, we recorded a $7.7 million write-down of our investment in New City Residence Investment Corp. due to a decline in market valuation, which is included in other loss in the accompanying consolidated statements of operations. The fair value measurement utilized was the stock price quoted on the Tokyo Stock Exchange (TSE), which is included in Level 1 of the fair value hierarchy.
In January 2007, we sold Trammell Crow Company’s 19% ownership interest in Savills plc and generated a pre-tax loss of $34.9 million during the year ended December 31, 2007, which was largely driven by stock price depreciation at the date of sale as compared to December 31, 2006 when the investment was marked to market. The loss is included in other loss in the accompanying consolidated statements of operations. We received approximately $311.0 million of pre-tax proceeds from the sale, net of selling expenses.
We did not record any significant dividends or interest income related to marketable securities in 2009, 2008 or 2007.
9. Other Assets
The following table summarizes the items included in other assets (dollars in thousands):
| December 31, | ||||||
| 2009 | 2008 | |||||
| Deferred financing costs, net |
$ | 28,828 | $ | 27,635 | ||
| Deposits |
27,596 | 28,400 | ||||
| Employee and affiliate loans (1) |
20,917 | 31,006 | ||||
| Lease costs and concessions, net |
7,905 | 12,255 | ||||
| Long-term trade receivables, net |
4,876 | 7,774 | ||||
| Miscellaneous |
16,968 | 19,493 | ||||
| Total |
$ | 107,090 | $ | 126,563 | ||
| (1) | See Note 24 for additional information. |
10. Real Estate and Other Assets Held for Sale and Related Liabilities
Real estate and other assets held for sale include completed real estate projects or land for sale in their present condition that have met all of the “held for sale” criteria of Topic 360 and other assets directly related to such projects. Liabilities related to real estate and other assets held for sale have been included as a single line item in the accompanying consolidated balance sheets.
102
Table of Contents
CB RICHARD ELLIS GROUP, INC.
NOTES TO CONSOLIDATED FINANCIAL STATEMENTS—(Continued)
Real estate and other assets held for sale and related liabilities were as follows at December 31, 2009 and 2008 (dollars in thousands):
| December 31, | ||||||
| 2009 | 2008 | |||||
| Assets: |
||||||
| Real estate held for sale (see Note 11) |
$ | 7,101 | $ | 39,582 | ||
| Other current assets |
8 | 689 | ||||
| Other assets |
— | 163 | ||||
| Total real estate and other assets held for sale |
7,109 | 40,434 | ||||
| Liabilities: |
||||||
| Notes payable on real estate held for sale (see Note 12) |
1,175 | 21,049 | ||||
| Accounts payable and accrued expenses |
92 | 1,511 | ||||
| Other current liabilities |
— | 180 | ||||
| Total liabilities related to real estate and other assets held for sale |
1,267 | 22,740 | ||||
| Net real estate and other assets held for sale |
$ | 5,842 | $ | 17,694 | ||
11. Real Estate
We provide build-to-suit services for our clients and also develop or purchase certain projects which we intend to sell to institutional investors upon project completion or redevelopment. Therefore, we have ownership of real estate until such projects are sold or otherwise disposed. Certain real estate assets owned by us secure the outstanding balances of underlying mortgage or construction loans. The majority of our real estate is included in our Development Services segment (see Note 23). Real estate owned by us consisted of the following (dollars in thousands):
| Land | Buildings and Improvements |
Other | Total | |||||||||||
| At December 31, 2009 | ||||||||||||||
| Real estate included in assets held for sale (see Note 10) |
$ | 4,738 | $ | 2,363 | $ | — | $ | 7,101 | ||||||
| Real estate under development (non-current) |
123,941 | 36,223 | — | 160,164 | ||||||||||
| Real estate held for investment |
167,189 | 331,896 | 27,084 | 526,169 | ||||||||||
| Total real estate |
$ | 295,868 | $ | 370,482 | (1) | $ | 27,084 | (2) | $ | 693,434 | ||||
| At December 31, 2008 | ||||||||||||||
| Real estate under development (current) |
$ | 38,652 | $ | 17,670 | $ | — | $ | 56,322 | ||||||
| Real estate included in assets held for sale (see Note 10) |
6,613 | 32,969 | — | 39,582 | ||||||||||
| Real estate under development (non-current) |
123,157 | 34,933 | — | 158,090 | ||||||||||
| Real estate held for investment |
186,949 | 333,461 | 15,569 | 535,979 | ||||||||||
| Total real estate |
$ | 355,371 | $ | 419,033 | (1) | $ | 15,569 | (2) | $ | 789,973 | ||||
| (1) | Net of accumulated depreciation of $26.7 million and $14.6 million at December 31, 2009 and 2008, respectively. |
| (2) | Includes balances for lease intangibles and tenant origination costs of $20.4 million and $5.9 million, respectively, at December 31, 2009 and $6.5 million and $8.3 million, respectively, at December 31, 2008. We record lease intangibles and tenant origination costs upon acquiring buildings with in-place leases. The balances are shown net of amortization, which is recorded as an increase to, or a reduction of, rental income for lease intangibles and as amortization expense for tenant origination costs. |
103
Table of Contents
CB RICHARD ELLIS GROUP, INC.
NOTES TO CONSOLIDATED FINANCIAL STATEMENTS—(Continued)
During the fourth quarter of 2008 and continuing through 2009, commercial real estate fundamentals in the U.S. weakened significantly, impacted by the overall downturn in the economy as evidenced by the decline in the U.S. Gross Domestic Product through the second quarter of 2009 and a high rate of unemployment. Market fundamentals in the primary product types which we develop/own weakened significantly. The high unemployment rate negatively impacted office markets as companies deferred occupancy decisions and placed space on the market for sublease. Weak industrial production has adversely affected warehouse and distribution markets. The retail sector has been negatively affected by declining sales and retailers experiencing financial difficulty. Transactions have declined significantly due to illiquidity in the capital markets as many lenders tightened lending standards for commercial real estate. Capitalization rates have increased as potential buyers of commercial real estate re-evaluated commercial real estate versus other asset classes available for investment.
At the time we performed our quarterly real estate impairment analyses, the assumptions utilized reflected our outlook for the commercial real estate industry and the impact on our business. This outlook incorporated our belief that market conditions deteriorated and that these challenging conditions could persist for some time. Accordingly, our impairment evaluations in 2009 and at December 31, 2008 indicated a significant number of properties had impairment indicators. In 2009, projects with a combined carrying value of $371.3 million as of December 31, 2009 had indicators of potential impairment and were evaluated for impairment. Through the evaluation process, it was determined that projects with a carrying value of $130.8 million were impaired. As a result, during the year ended December 31, 2009, we recorded impairment charges of $28.8 million to reduce the carrying value of the impaired real estate projects to their estimated fair value, $24.8 million of which were attributable to non-controlling interests. In addition, during the year ended December 31, 2009, we also recorded provisions for loss on real estate held for sale of $3.9 million, $2.2 million of which were attributable to non-controlling interests (See Note 3).
In 2008, projects with a combined carrying value of $542.1 million as of December 31, 2008, had indicators of potential impairment and were evaluated for impairment. Through the evaluation process, it was determined that projects with a carrying value of $157.8 million were impaired. As a result, during the year ended December 31, 2008, we recorded impairment charges of $48.7 million to reduce the carrying value of the impaired real estate projects to their estimated fair value, $35.5 million of which were attributable to non-controlling interests. No write-downs for impairment of real estate or provisions for losses on real estate held for sale were recorded by us during the year ended December 31, 2007.
If conditions in the broader economy, commercial real estate industry, specific markets or product types in which we operate worsen, we may be required to evaluate additional projects or re-evaluate previously impaired projects for potential impairment. These evaluations could result in additional impairment charges, which may be material.
104
Table of Contents
CB RICHARD ELLIS GROUP, INC.
NOTES TO CONSOLIDATED FINANCIAL STATEMENTS—(Continued)
In June 2009, upon substantial completion of a real estate project under development, one of our consolidated subsidiaries assigned its assets and liabilities (and contributed $0.5 million) to an entity controlled and owned 60% by a third party. Our consolidated subsidiary retained a 40% ownership in the new entity and now accounts for this investment using the equity method. No gain or loss was recognized as a result of this transaction, and we recorded the following non-cash activity (dollars in thousands):
| Debit (Credit) | ||||
| Assets: |
||||
| Real estate under development, current |
$ | (57,399 | ) | |
| Receivables |
(1,207 | ) | ||
| Other current assets |
(1,485 | ) | ||
| Total assets |
(60,091 | ) | ||
| Liabilities: |
||||
| Notes payable on real estate, current |
56,662 | |||
| Accounts payable and accrued expenses |
3,429 | |||
| Total liabilities |
$ | 60,091 | ||
In July 2009, our partner in a limited liability company that we accounted for as an investment in unconsolidated subsidiaries assigned their full interest in the limited liability company to us, in accordance with a buy-sell provision in the limited liability company agreement. As a result, we consolidated the limited liability company as it became our wholly-owned and controlled subsidiary. As a result of this transaction, we recorded the following non-cash activity (dollars in thousands):
| Debit (Credit) | ||
| Assets: |
||
| Real estate held for investment |
$12,533 | |
| Investments in unconsolidated subsidiaries |
(5,902) | |
| Total assets |
6,631 | |
| Liabilities: |
||
| Notes payable on real estate, current |
(6,400) | |
| Accounts payable and accrued expenses |
(231) | |
| Total liabilities |
$(6,631) | |
105
Table of Contents
CB RICHARD ELLIS GROUP, INC.
NOTES TO CONSOLIDATED FINANCIAL STATEMENTS—(Continued)
In the third quarter of 2009, we conveyed two real estate projects to their respective lenders in order to satisfy the underlying non-recourse notes that were in default. In addition, we sold short another property and the lender forgave the balance of the related non-recourse mortgage note. We recorded a net gain of $2.7 million from these transactions, which has been included in gain on disposition of real estate in the accompanying consolidated statements of operations within our Development Services segment for the year ended December 31, 2009 and recorded the following non-cash activity (dollars in thousands):
| Debit (Credit) | ||||
| Assets: |
||||
| Real estate held for investment |
$ | (29,856 | ) | |
| Restricted cash |
(1,118 | ) | ||
| Other current assets |
(869 | ) | ||
| Other assets |
(1,149 | ) | ||
| Total assets |
(32,992 | ) | ||
| Liabilities: |
||||
| Notes payable on real estate, current |
30,369 | |||
| Notes payable on real estate, long-term |
4,006 | |||
| Accounts payable and accrued expenses |
1,291 | |||
| Total liabilities |
$ | 35,666 | ||
In the fourth quarter of 2009, a receiver was appointed on one of our consolidated real estate projects, resulting in our losing control of the entity. As a result, we deconsolidated the entity and recorded the following non-cash activity (dollars in thousands):
| Debit (Credit) | ||||
| Assets: |
||||
| Real estate held for investment |
$ | (7,009 | ) | |
| Restricted cash |
(293 | ) | ||
| Receivables |
(373 | ) | ||
| Other current assets |
(801 | ) | ||
| Investments in unconsolidated subsidiaries |
338 | |||
| Total assets |
(8,138 | ) | ||
| Liabilities: |
||||
| Notes payable on real estate, current |
7,518 | |||
| Accounts payable and accrued expenses |
620 | |||
| Total liabilities |
$ | 8,138 | ||
The estimated costs to complete the four consolidated real estate projects under development or to be developed by us as of December 31, 2009 totaled approximately $43.0 million. At December 31, 2009, we had commitments for the sale of three of our projects.
Rental revenues (which are included in revenue) and expenses (which are included in operating, administrative and other expenses) relating to our operational real estate properties, excluding those reported as discontinued operations, were $53.3 million and $31.6 million, respectively, for the year ended December 31, 2009 and $46.1 million and $27.2 million, respectively, for the year ended December 31, 2008.
106
Table of Contents
CB RICHARD ELLIS GROUP, INC.
NOTES TO CONSOLIDATED FINANCIAL STATEMENTS—(Continued)
In 2008, we acquired a property in our Global Investment Management segment, which is classified as real estate held for investment in our accompanying consolidated balance sheets as of December 31, 2009 and 2008. We acquired this property for $21.1 million in cash and assumed $55.8 million of debt associated with the property, of which $0.6 million is included in current notes payable on real estate and $55.2 million is included in long-term notes payable on real estate in the accompanying consolidated balance sheets as of December 31, 2009. This debt requires monthly principal payments commencing on February 5, 2010, bears interest at 5.7% and has a maturity date of June 4, 2015.
12. Notes Payable on Real Estate
We had loans secured by real estate, which consisted of the following at December 31, 2009 and 2008 (dollars in thousands):
| December 31, | ||||||
| 2009 | 2008 | |||||
| Current portion of notes payable on real estate |
$ | 159,921 | $ | 176,372 | ||
| Notes payable on real estate included in liabilities related to real estate and other assets held for sale (see Note 10) |
1,175 | 21,049 | ||||
| Total notes payable on real estate, current portion |
161,096 | 197,421 | ||||
| Notes payable on real estate, non-current portion |
390,181 | 420,242 | ||||
| Total notes payable on real estate |
$ | 551,277 | $ | 617,663 | ||
Notes payable on real estate held for sale are included in liabilities related to real estate and other assets held for sale. Notes payable on real estate under development (current) are included in notes payable on real estate, current. Notes payable on real estate under development (non-current) and real estate held for investment are classified according to payment terms and maturity dates.
At December 31, 2009, $3.5 million of the non-current portion of notes payable on real estate were recourse to us, beyond being recourse to the single-purpose entity that held the real estate asset and was the primary obligor on the note payable.
Principal maturities of notes payable on real estate at December 31, 2009, were as follows (dollars in thousands):
| 2010 |
$ | 161,096 | |
| 2011 |
222,078 | ||
| 2012 |
38,851 | ||
| 2013 |
50,316 | ||
| 2014 |
6,862 | ||
| Thereafter |
72,074 | ||
| $ | 551,277 | ||
Interest rates on loans outstanding at December 31, 2009 and 2008, ranged from 1.75% to 8.25% and 2.32% to 8.00%, respectively. Generally, only interest is payable on the real estate loans and is usually drawn on the underlying loan with all unpaid principal and interest due at maturity. Capitalized interest for the years ended December 31, 2009 and 2008 totaled $5.8 million and $11.3 million, respectively.
107
Table of Contents
CB RICHARD ELLIS GROUP, INC.
NOTES TO CONSOLIDATED FINANCIAL STATEMENTS—(Continued)
13. Long-Term Debt and Short-Term Borrowings
Total long-term debt and short-term borrowings consist of the following (dollars in thousands):
| December 31, | ||||||
| 2009 | 2008 | |||||
| Long-Term Debt: |
||||||
| Senior secured term loans, with interest ranging from 1.96% to 6.75%, due from 2009 through 2015 |
$ | 1,683,610 | $ | 2,073,750 | ||
| 11.625% senior subordinated notes, net of unamortized discount of $13,498 at December 31, 2009, due in 2017 |
436,502 | — | ||||
| CB Richard Ellis Tucson, LLC loan note, with interest at 4.00%, due through June 2010 |
228 | 1,575 | ||||
| Other |
463 | 2,096 | ||||
| Subtotal |
2,120,803 | 2,077,421 | ||||
| Less current maturities of long-term debt |
138,682 | 210,662 | ||||
| Total long-term debt |
1,982,121 | 1,866,759 | ||||
| Short-Term Borrowings: |
||||||
| Warehouse line of credit, with interest at the daily LIBOR plus 1.35% with a LIBOR floor of 0.35%, with no maturity date |
133,615 | — | ||||
| Warehouse line of credit, with interest at daily one-month LIBOR plus 2.75%, with a maturity date of April 14, 2010 |
105,135 | 61,798 | ||||
| Warehouse line of credit, with interest at daily Chase-London LIBOR plus 2.00%, with a maturity date of January 29, 2010 |
74,122 | 56,375 | ||||
| Warehouse line of credit, with interest at National City Bank one-month internal funds transfer rate plus 1.75%, terminated November 30, 2009 |
— | 92,300 | ||||
| Total warehouse lines of credit |
312,872 | 210,473 | ||||
| Revolving credit facility, with interest ranging from 4.50% to 6.95%, maturing through 2013 |
21,050 | 25,765 | ||||
| Trammell Crow Company Acquisitions II, L.P. revolving line of credit, with interest at daily British Bankers Association LIBOR plus 0.65% and a maturity date of April 30, 2010 |
5,500 | 8,000 | ||||
| Westmark senior notes, with interest of 2.48%, repaid in January 2009 |
— | 1,073 | ||||
| Insignia acquisition loan notes, with interest at six-month LIBOR minus 2.0%, due on demand |
334 | 738 | ||||
| Other |
16 | 16 | ||||
| Total short-term borrowings |
339,772 | 246,065 | ||||
| Add current maturities of long-term debt |
138,682 | 210,662 | ||||
| Total current debt |
478,454 | 456,727 | ||||
| Total long-term debt and short-term borrowings |
$ | 2,460,575 | $ | 2,323,486 | ||
Future annual aggregate maturities of total consolidated debt at December 31, 2009 are as follows (dollars in thousands): 2010—$478,454; 2011—$203,301; 2012—$24,984; 2013—$1,022,138; 2014—$0; and $731,698 thereafter.
108
Table of Contents
CB RICHARD ELLIS GROUP, INC.
NOTES TO CONSOLIDATED FINANCIAL STATEMENTS—(Continued)
Since 2001, we have maintained a credit agreement with Credit Suisse (CS) and other lenders to fund strategic acquisitions and to provide for our working capital needs. On December 20, 2006, we entered into an amendment and restatement to our credit agreement to, among other things, allow the consummation of the Trammell Crow Company Acquisition and the incurrence of senior secured term loan facilities for an aggregate principal amount of up to $2.2 billion. On March 27, 2008, we exercised the accordion provision of the credit agreement, which added an additional $300.0 million term loan. On March 24, 2009, we entered into a second amendment and restatement to our credit agreement (the Credit Agreement) with a syndicate of banks led by CS, as administrative and collateral agent, amending and restating our amended and restated credit agreement dated December 20, 2006. On August 24, 2009, we entered into a loan modification agreement to our Credit Agreement, which included the conversion of $41.9 million of amounts outstanding under our revolving credit facility to term loans.
Subsequent to the August 24, 2009 loan modification, our Credit Agreement includes the following: (1) a $558.1 million revolving credit facility, including revolving credit loans, letters of credit and a swingline loan facility, with tranche 1 in the amount of $357.6 million maturing on June 24, 2011 and tranche 2 in the amount of $200.5 million maturing on June 24, 2013; (2) an $871.5 million A term loan facility, which is further broken down as follows: i) a $335.5 million tranche A term loan facility requiring quarterly principal payments through September 30, 2011, with the balance payable on December 20, 2011; ii) a $48.6 million tranche A-1 term loan facility payable on December 20, 2013; iii) a $290.3 million tranche A-2 term loan facility, requiring quarterly principal payments of $8.7 million beginning March 30, 2010 and continuing through March 31, 2013, with the balance payable on June 24, 2013; and iv) a $197.1 million tranche A-3 term loan facility payable on December 20, 2013; and (3) a $943.5 million B term loan facility, which is further broken down as follows: i) a $646.6 million tranche B term loan facility requiring quarterly principal payments of $1.9 million through September 30, 2013, with the balance payable on December 20, 2013; and ii) a $296.9 million tranche B-1 term loan facility payable on December 20, 2015. During the year ended December 31, 2009, we repaid the following amounts: $252.3 million of our tranche A term loan facility, which was applied to the required 2009 principal repayments and a portion of the first quarter 2010 principal payment; $52.0 million of our tranche A-1 term loan facility, which covered all the required quarterly principal payments and a portion of the balance due at maturity; $87.1 million of our tranche A-2 term loan facility, which was applied to quarterly principal payments from the first quarter of 2010 through the second quarter of 2012; $29.6 million of our tranche A-3 term loan facility, which covered a portion of the balance due at maturity; $9.3 million of our tranche B term loan facility, which covered all required quarterly principal payments in 2009; and $1.7 million of our tranche B-1 term loan facility, which covered a portion of the balance due at maturity. Some of these prepayments led to a reduction in the interest rate spreads governing our tranche A and A-1 term loan facilities as well as our revolving credit facility.
The revolving credit facility allows for borrowings outside of the U.S., with sub-facilities of $5.0 million available to one of our Canadian subsidiaries, $35.0 million in aggregate available to one of our Australian and one of our New Zealand subsidiaries and $50.0 million available to one of our U.K. subsidiaries. Additionally, outstanding borrowings under these sub-facilities may be up to 5.0% higher as allowed under the currency fluctuation provision in the Credit Agreement. Borrowings under the revolving credit facility as of December 31, 2009 bear interest at varying rates, based at our option, on either the applicable fixed rate plus 2.25% to 4.00% or the daily rate plus 1.25% to 3.00% for the tranche 1 facility, and on either the applicable fixed rate plus 2.50% to 4.75% or the daily rate plus 1.50% to 3.75% for the tranche 2 facility, in all cases as determined by reference to our ratio of total debt less available cash to EBITDA (as defined in the Credit Agreement). As of December 31, 2009 and 2008, we had $21.1 million ($13.1 million under tranche 1 and $8.0 million under tranche 2) and $25.8 million, respectively, of revolving credit facility principal outstanding with related weighted average interest rates of 5.3% and 5.7%, respectively, which are included in short-term borrowings in the accompanying consolidated balance sheets. As of December 31, 2009, letters of credit totaling $29.0 million were outstanding
109
Table of Contents
CB RICHARD ELLIS GROUP, INC.
NOTES TO CONSOLIDATED FINANCIAL STATEMENTS—(Continued)
under the revolving credit facility. These letters of credit primarily relate to letters of credit issued in the normal course of business as well as in connection with certain insurance programs and reduce the amount we may borrow under the revolving credit facility.
Borrowings under the term loan facilities as of December 31, 2009 bear interest, based on our option, on the following: for the tranche A term loan facility, on either the applicable fixed rate plus 2.75% to 4.50% or the daily rate plus 1.75% to 3.50%; for the tranche A-1 term loan facility, on either the applicable fixed rate plus 3.50% to 4.50% or the daily rate plus 2.50% to 3.50%; for the tranche A-2 term loan facility, on either the applicable fixed rate plus 3.25% to 5.50% or the daily rate plus 2.25% to 4.50%; for the tranche A-3 term loan facility, on either the applicable fixed rate plus 4.00% to 5.00% or the daily rate plus 3.00% to 4.00%; for the tranche B term loan facility, on either the applicable fixed rate plus 4.00% to 5.00% or the daily rate plus 3.00% to 4.00%; and for the tranche B-1 term loan facility, on either the applicable fixed rate plus 4.50% to 5.50% or the daily rate plus 3.50% to 4.50%. For all term loan facilities, both the fixed rate and daily rate options are determined by reference to our ratio of total debt less available cash to EBITDA (as defined in the Credit Agreement). The tranche A-1, A-2 and A-3 term loan facilities include a targeted outstanding amount (as defined in the Credit Agreement) provision that will increase the interest rate by 2% if the outstanding balance exceeds the targeted outstanding amount at the end of each quarter. As of December 31, 2009 and 2008, the outstanding balance did not exceed the targeted outstanding amount. As of December 31, 2009 and 2008, we had $326.3 million and $827.0 million of tranche A term loan facility principal outstanding, respectively, $48.6 million and $297.8 million of tranche A-1 term loan facility principal outstanding, respectively, and $642.8 million and $949.0 million of tranche B term loan facility principal outstanding, respectively, which are included in the accompanying consolidated balance sheets. As of December 31, 2009, we also had $203.2 million, $167.5 million and $295.2 million of tranche A-2 term loan facility principal outstanding, tranche A-3 term loan facility principal outstanding and tranche B-1 term loan facility principal outstanding, respectively, which are also included in the accompanying consolidated balance sheets.
The Credit Agreement is jointly and severally guaranteed by us and substantially all of our domestic subsidiaries. Borrowings under our Credit Agreement are secured by a pledge of substantially all of the capital stock of our U.S. subsidiaries and 65% of the capital stock of certain non-U.S. subsidiaries, and by a security interest in substantially all of the personal property of the U.S. subsidiaries. Also, the Credit Agreement requires us to pay a fee based on the total amount of the revolving credit facility commitment.
On June 18, 2009, CBRE, our wholly-owned subsidiary, issued $450.0 million in aggregate principal amount of 11.625% senior subordinated notes due June 15, 2017 for approximately $435.9 million, net of discount. The 11.625% senior subordinated notes are unsecured senior subordinated obligations of CBRE and are jointly and severally guaranteed on a senior subordinated basis by us and our domestic subsidiaries that guarantee our Credit Agreement. Interest accrues at a rate of 11.625% per year and is payable semi-annually in arrears on June 15 and December 15. The 11.625% senior subordinated notes are redeemable at our option, in whole or in part, on or after June 15, 2013 at 105.813% of par on that date and at declining prices thereafter. At any time prior to June 15, 2013, the 11.625% senior subordinated notes may be redeemed by us, in whole or in part, at a price equal to 100% of the principal amount, plus accrued and unpaid interest and an applicable premium (as defined in the indenture governing these notes), which is based on the present value of the June 15, 2013 redemption price plus all remaining interest payments through June 15, 2013. In addition, prior to June 15, 2012, up to 35.0% of the original issued amount of the 11.625% senior subordinated notes may be redeemed at 111.625% of par, plus accrued and unpaid interest, solely with the net cash proceeds from public equity offerings. In the event of a change of control (as defined in the indenture governing our 11.625% senior subordinated notes), we are obligated to make an offer to purchase the remaining 11.625% senior subordinated notes at a redemption price of 101.0% of the principal amount, plus accrued and unpaid interest. The amount of the 11.625% senior subordinated notes included in the accompanying consolidated balance sheets, net of unamortized discount, was $436.5 million at December 31, 2009.
110
Table of Contents
CB RICHARD ELLIS GROUP, INC.
NOTES TO CONSOLIDATED FINANCIAL STATEMENTS—(Continued)
Our Credit Agreement and the indenture governing our 11.625% senior subordinated notes contain numerous restrictive covenants that, among other things, limit our ability to incur additional indebtedness, pay dividends or make distributions to stockholders, repurchase capital stock or debt, make investments, sell assets or subsidiary stock, create or permit liens on assets, engage in transactions with affiliates, enter into sale/leaseback transactions, issue subsidiary equity and enter into consolidations or mergers. Our Credit Agreement also currently requires us to maintain a minimum coverage ratio of EBITDA (as defined in the Credit Agreement) to total interest expense of 2.00x through March 31, 2011 and 2.25x thereafter and a maximum leverage ratio of total debt less available cash to EBITDA (as defined in the Credit Agreement) of 4.25x through March 31, 2011 and 3.75x thereafter.
We had short-term borrowings of $339.8 million and $246.1 million with related average interest rates of 2.4% and 2.2% as of December 31, 2009 and 2008, respectively.
On March 2, 2007, we entered into a $50.0 million credit note with Wells Fargo Bank for the purpose of purchasing eligible investments, which include cash equivalents, agency securities, A1/P1 commercial paper and eligible money market funds. The proceeds of this note are not made generally available to us, but instead deposited in an investment account maintained by Wells Fargo Bank and used and applied solely to purchase eligible investment securities. This agreement has been amended several times and as of December 31, 2009, provides for a $40.0 million revolving credit note, bears interest at 0.25% and has a maturity date of November 1, 2010. As of December 31, 2009 and 2008, there were no amounts outstanding under this revolving credit note.
On March 4, 2008, we entered into a $35.0 million credit and security agreement with Bank of America (BofA) for the purpose of purchasing eligible financial instruments, which include A1/P1 commercial paper, U.S. Treasury securities, GSE discount notes (as defined in the credit and security agreement) and money market funds. The proceeds of this note are not made generally available to us, but instead deposited in an investment account maintained by BofA and used and applied solely to purchase eligible financial instruments. Borrowings under the revolving note bear interest at 1.0%. In February 2009, the amount available to us under this arrangement was reduced to $5.0 million and the maturity date was extended to February 28, 2010. As of December 31, 2009 and 2008, there were no amounts outstanding under this revolving note.
On August 19, 2008, we entered into a $15.0 million uncommitted facility with First Tennessee Bank for the purpose of purchasing investments, which include cash equivalents, agency securities, A1/P1 commercial paper and eligible money market funds. The proceeds of this facility are not made generally available to us, but instead are held in a collateral account maintained by First Tennessee Bank. Borrowings under this facility bear interest at 0.25% and had an original maturity date of August 3, 2009. Effective August 3, 2009, the amount available under the agreement was reduced to $4.0 million and the maturity date was extended to August 3, 2010. As of December 31, 2009 and 2008, there were no amounts outstanding under this facility.
Our wholly-owned subsidiary CBRE Capital Markets has the following warehouse lines of credit: credit agreements with JP Morgan Chase Bank, N.A. (JP Morgan) and BofA for the purpose of funding mortgage loans that will be resold and a funding arrangement with Fannie Mae for the purpose of selling a percentage of certain closed multi-family loans. CBRE Capital Markets also had a funding arrangement with Red Mortgage Capital Inc. (Red Capital) for the purpose of funding originations of multi-family property mortgage loans, which was terminated on November 30, 2009.
On November 15, 2005, CBRE Capital Markets entered into a secured credit agreement with JP Morgan to establish a warehouse line of credit. This agreement has been amended several times and as of December 31, 2009, provides for a $210.0 million senior secured revolving line of credit, bears interest at the daily Chase-London LIBOR plus 2.00% and has a maturity date of January 29, 2010.
111
Table of Contents
CB RICHARD ELLIS GROUP, INC.
NOTES TO CONSOLIDATED FINANCIAL STATEMENTS—(Continued)
On April 16, 2008, CBRE Capital Markets entered into a secured credit agreement with BofA to establish a warehouse line of credit. This agreement has been amended several times and as of December 31, 2009, provides for a $125.0 million senior secured revolving line of credit, bears interest at the daily one-month LIBOR plus 2.75% and has a maturity date of April 14, 2010.
In August 2009, CBRE Capital Markets entered into a funding arrangement with Fannie Mae under its Multifamily As Soon As Pooled Plus Agreement and its Multifamily As Soon As Pooled Sale Agreement (ASAP Program). Under the ASAP Program, CBRE Capital Markets may elect, on a transaction by transaction basis, to sell a percentage of certain closed multifamily loans to Fannie Mae on an expedited basis. After all contingencies are satisfied, the ASAP Program requires that CBRE Capital Markets repurchase the interest in the multifamily loan previously sold to Fannie Mae followed by either a full delivery back to Fannie Mae via whole loan execution or a securitization into a mortgage backed security. Under this agreement, the maximum outstanding under the ASAP Program cannot exceed $150.0 million and, between the sale date to Fannie Mae and the repurchase date by CBRE Capital Markets, the outstanding balance bears interest and is payable to Fannie Mae at the daily LIBOR rate plus 1.35% with a LIBOR floor of 0.35%. Effective December 1, 2009, the maximum outstanding under the ASAP Program was increased from $150.0 million to $225.0 million. This temporary increase will expire on January 15, 2010.
In February 2008, CBRE Capital Markets established a funding arrangement with Red Capital for the purpose of funding originations of Freddie Mac and Fannie Mae multi-family property mortgage loans. The maximum availability to any one entity was $150.0 million and was reduced by any outstanding participation interests with any other entity. Additionally, no individual mortgage loan financed under the arrangement could exceed $50.0 million. Effective September 19, 2008, the rate on borrowings was the National City Bank one-month internal funds transfer rate plus 1.75%. Effective March 1, 2009, Red Capital established a new rate on borrowings of daily one-month LIBOR plus 2.50%. This funding arrangement was terminated by Red Capital effective November 30, 2009, with any outstanding line balances completely settled and paid off by December 15, 2009.
During the year ended December 31, 2009, we had a maximum of $508.0 million of warehouse lines of credit principal outstanding. As of December 31, 2009 and 2008, we had $312.9 million and $210.5 million of warehouse lines of credit principal outstanding, respectively, which are included in short-term borrowings in the accompanying consolidated balance sheets. Additionally, we had $315.0 million and $210.5 million of mortgage loans held for sale (warehouse receivables), which represented mortgage loans funded through the lines of credit that, while committed to be purchased, had not yet been purchased as of December 31, 2009 and 2008, respectively, and which are also included in the accompanying consolidated balance sheets.
On July 31, 2006, CBRE Capital Markets entered into a revolving credit note with JP Morgan for the purpose of purchasing qualified investment securities, which include but are not limited to U.S. Treasury and Agency securities. This agreement has been amended several times and as of December 31, 2009, provides for a $100.0 million revolving credit note, bears interest at 0.50% and has a maturity date of January 29, 2010. As of December 31, 2009 and 2008, there were no amounts outstanding under this revolving credit note.
On April 30, 2007, Trammell Crow Company Acquisitions II, L.P. (Acquisitions II), a consolidated limited partnership within our Development Services segment, entered into a $100.0 million revolving credit agreement (WestLB Credit Agreement) with WestLB AG, as administrative agent for a lender group. During the second quarter of 2009, Acquisitions II opted to reduce the amount available under the WestLB Credit Agreement to $50.0 million. Borrowings under this credit agreement are used to fund acquisitions of real estate prior to receipt of capital contributions from Acquisitions II investors and permanent project financing, and are limited to a
112
Table of Contents
CB RICHARD ELLIS GROUP, INC.
NOTES TO CONSOLIDATED FINANCIAL STATEMENTS—(Continued)
portion of unfunded capital commitments of certain Acquisitions II investors. As of December 31, 2009, borrowing capacity under this agreement, net of outstanding amounts drawn, was $22.4 million. Borrowings under this agreement bear interest at the daily British Bankers Association LIBOR plus 0.65% and this agreement expires on April 30, 2010. Subject to certain conditions, Acquisitions II can extend the maturity date of the credit facility for an additional term of not longer than six months. Borrowings under the line are non-recourse to us and are secured by the capital commitments of the investors in Acquisitions II. As of December 31, 2009 and 2008, there was $5.5 million and $8.0 million, respectively, outstanding under the WestLB Credit Agreement included in short-term borrowings in the accompanying consolidated balance sheets.
In connection with our acquisition of Westmark Realty Advisors in 1995 (now known as CB Richard Ellis Investors), we issued approximately $20.0 million in aggregate principal amount of senior notes. The Westmark senior notes were redeemable at the discretion of the note holder and had a final maturity date of June 30, 2010. The interest rate on the Westmark senior notes was equal to the interest rate in effect for amounts outstanding under our Credit Agreement plus 12 basis points. The amount of the Westmark senior notes included in short-term borrowings in the accompanying consolidated balance sheets was $1.1 million as of December 31, 2008. In January 2009, the remaining outstanding balance of $1.1 million was redeemed by the final note holder.
Insignia, which we acquired in July 2003, issued loan notes as partial consideration for previous acquisitions of businesses in the U.K. The acquisition loan notes are payable to the sellers of the previously acquired U.K. businesses and are secured by restricted cash deposits in approximately the same amount. The acquisition loan notes are redeemable semi-annually at the discretion of the note holder and have a final maturity date of April 2010. As of December 31 2009 and 2008, $0.3 million and $0.7 million, respectively, of the acquisition loan notes were outstanding and are included in short-term borrowings in the accompanying consolidated balance sheets.
In July 2008, in connection with the purchase of the remaining 50% ownership interest we did not already own in our affiliate CB Richard Ellis Tucson, LLC, we issued a loan note that is payable to the seller. In June 2009, the purchase price was reduced, resulting in partial reduction of the loan amount by $1.2 million, with the remainder due on June 30, 2010. The amount of the CB Richard Ellis Tucson, LLC loan note included in the accompanying consolidated balance sheets at December 31, 2009 and 2008 was $0.2 million and $1.6 million, respectively.
A significant number of our subsidiaries in Europe have had a Euro cash pool loan since 2001, which is used to fund their short-term liquidity needs. The Euro cash pool loan is an overdraft line for our European operations issued by HSBC Bank. The Euro cash pool loan has no stated maturity date and bears interest at varying rates based on a base rate as defined by HSBC Bank plus 2.5%. At both December 31, 2009 and 2008, there were no amounts outstanding under this facility.
14. Commitments and Contingencies
We are a party to a number of pending or threatened lawsuits arising out of, or incident to, our ordinary course of business. Our management believes that any liability imposed upon us that may result from disposition of these lawsuits will not have a material effect on our business, consolidated financial position, cash flows or results of operations.
As a result of an internal review that began in the first quarter of 2010 and is ongoing, we have determined that some of our employees in certain of our offices in China have made payments in violation of company policy to local governmental officials, including payments for non-business entertainment and in the form of gifts. The payments we have discovered to date are limited in number, minor in amount and we believe relate to
113
Table of Contents
CB RICHARD ELLIS GROUP, INC.
NOTES TO CONSOLIDATED FINANCIAL STATEMENTS—(Continued)
only a few discrete transactions involving immaterial revenues. Nonetheless, we believe that the payments may have been in violation of the U.S. Foreign Corrupt Practices Act or other applicable laws. Consequently, we voluntarily disclosed these events to the U.S. Department of Justice (DOJ) and the Securities and Exchange Commission (SEC) on February 27, 2010 and have agreed to update the DOJ and the SEC periodically regarding further developments. We have engaged outside counsel to further investigate these events and we are implementing thorough remedial measures. As a result of these findings, we may be subject to consequences that could include fines, penalties and other costs, and our reputation and business may be impacted. However, we currently do not believe these consequences are reasonably likely to have a material adverse effect on our business, results of operations or financial condition.
Our leases generally relate to office space that we occupy, have varying terms and expire through 2029. The following is a schedule by year of future minimum lease payments for noncancellable operating leases as of December 31, 2009 (dollars in thousands):
| Operating leases | |||
| 2010 |
$ | 169,509 | |
| 2011 |
135,207 | ||
| 2012 |
105,752 | ||
| 2013 |
87,953 | ||
| 2014 |
75,832 | ||
| Thereafter |
244,581 | ||
| Total minimum payment required |
$ | 818,834 | |
Total minimum payments for noncancellable operating leases were not reduced by the minimum sublease rental income of $19.7 million due in the future under noncancellable subleases.
Substantially all leases require us to pay maintenance costs, insurance and property taxes. The composition of total rental expense under noncancellable operating leases consisted of the following (dollars in thousands):
| Year Ended December 31, | ||||||||||||
| 2009 | 2008 | 2007 | ||||||||||
| Minimum rentals |
$ | 180,378 | $ | 208,359 | $ | 171,883 | ||||||
| Less sublease rentals |
(444 | ) | (229 | ) | (219 | ) | ||||||
| $ | 179,934 | $ | 208,130 | $ | 171,664 | |||||||
We had outstanding letters of credit totaling $34.9 million as of December 31, 2009, excluding letters of credit for which we have outstanding liabilities already accrued on our consolidated balance sheet related to our subsidiaries’ outstanding reserves for claims under certain insurance programs. These letters of credit are primarily executed by us in the normal course of business as well as in connection with certain insurance programs. The letters of credit expire at varying dates through December 2010.
We had guarantees totaling $14.2 million as of December 31, 2009, excluding guarantees related to pension liabilities, consolidated indebtedness and other obligations for which we have outstanding liabilities already accrued on our consolidated balance sheet as well as operating leases. The $14.2 million primarily consists of guarantees of obligations of unconsolidated subsidiaries, which expire at varying dates through March 2014.
114
Table of Contents
CB RICHARD ELLIS GROUP, INC.
NOTES TO CONSOLIDATED FINANCIAL STATEMENTS—(Continued)
In addition, as of December 31, 2009, we had numerous completion and budget guarantees relating to development projects. These guarantees are made by us in the normal course of our Development Services business. Each of these guarantees requires us to complete construction of the relevant project within a specified timeframe and/or within a specified budget, with us potentially being liable for costs to complete in excess of such timeframe or budget. However, we generally have “guaranteed maximum price” contracts with reputable general contractors with respect to projects for which we provide these guarantees. These contracts are intended to pass the risk to such contractors. While there can be no assurance, we do not expect to incur any material losses under these guarantees.
From time to time, we act as a general contractor with respect to construction projects. We do not consider these activities to be a material part of our business. In connection with these activities, we seek to subcontract construction work for certain projects to reputable subcontractors. Should construction defects arise relating to the underlying projects, we could potentially be liable to the client for the costs to repair such defects, although we would generally look to the subcontractor that performed the work to remedy the defect and also look to insurance policies that cover this work. While there can be no assurance, we do not expect to incur material losses with respect to construction defects.
In January 2008, CBRE Capital Markets entered into an agreement with Fannie Mae, under Fannie Mae’s DUS Lender Program, to provide financing for apartments with five or more units. Under the DUS Program, CBRE Capital Markets originates, underwrites, closes and services loans without prior approval by Fannie Mae, and in selected cases, is subject to sharing up to one-third of any losses on loans issued under the DUS program. CBRE Capital Markets has funded loans subject to such loss sharing arrangements with unpaid principal balances of $1.1 billion. Additionally, CBRE Capital Markets has funded loans under the DUS program that are not subject to loss sharing arrangements with unpaid principal balances of approximately $378.3 million. CBRE Capital Markets, under its agreement with Fannie Mae, must post cash reserves under formulas established by Fannie Mae to provide for sufficient capital in the event losses occur. As of December 31, 2009 and 2008, CBRE Capital Markets had $1.2 million and $0.6 million, respectively, of cash deposited under this reserve arrangement, and had provided approximately $2.0 million and $0.2 million, respectively, of loan loss reserves.
An important part of the strategy for our Global Investment Management business involves investing our capital in certain real estate investments with our clients. These co-investments typically range from 2% to 5% of the equity in a particular fund. As of December 31, 2009, we had aggregate commitments of $34.9 million to fund future co-investments.
Additionally, an important part of our Development Services business strategy is to invest in unconsolidated real estate subsidiaries as a principal (in most cases co-investing with our clients). As of December 31, 2009, we had committed to fund $25.6 million of additional capital to these unconsolidated subsidiaries.
15. Employee Benefit Plans
Stock Incentive Plans
2001 Stock Incentive Plan. Our 2001 stock incentive plan was adopted by our board of directors and approved by our stockholders on June 7, 2001. However, our 2001 stock incentive plan was terminated in June 2004 in connection with the adoption of our 2004 stock incentive plan, which is described below. The 2001 stock incentive plan permitted the grant of nonqualified stock options, incentive stock options, stock appreciation rights, restricted stock, restricted stock units and other stock-based awards to our employees, directors or independent contractors. Since our 2001 stock incentive plan has been terminated, no shares remain available for issuance under it. However, as of December 31, 2009, outstanding stock options granted under the 2001 stock
115
Table of Contents
CB RICHARD ELLIS GROUP, INC.
NOTES TO CONSOLIDATED FINANCIAL STATEMENTS—(Continued)
incentive plan to acquire 4,349,433 shares of our Class A common stock remain outstanding according to their terms, and we will continue to issue shares to the extent required under the terms of such outstanding awards. Options granted under this plan have an exercise price of $1.92. As of December 31, 2009, all options granted under this plan were fully vested and exercisable. Options granted under the 2001 stock incentive plan are subject to a maximum term of ten years from the date of grant. The number of shares issued pursuant to the 2001 stock incentive plan, or pursuant to outstanding awards, is subject to adjustment on account of stock splits, stock dividends and other dilutive changes in our Class A common stock.
Second Amended and Restated 2004 Stock Incentive Plan. Our 2004 stock incentive plan was adopted by our board of directors and approved by our stockholders on April 21, 2004, and has been amended several times subsequently, including an amendment and restatement on June 2, 2008 and an amendment on December 3, 2008. The 2004 stock incentive plan authorizes the grant of stock-based awards to our employees, directors or independent contractors. A total of 20,785,218 shares of our Class A common stock initially were reserved for issuance under the 2004 stock incentive plan, which increased by 10,000,000 shares to a total of 30,785,218 shares in connection with the June 2, 2008 amendment and restatement. For awards granted prior to June 2, 2008 under this plan, this share reserve was reduced by one share upon grant of an option or stock appreciation right, and was reduced by 2.25 shares upon issuance of stock pursuant to other stock-based awards. For awards granted on or after June 2, 2008 under this plan, this share reserve is reduced by one share upon grant of all awards. In addition, full value awards, i.e., awards other than stock options and stock appreciation rights, are limited to no more than 75% of the total share reserve. Awards that expire, terminate or lapse will again be available for grant under this plan. No person is eligible to be granted awards in the aggregate covering more than 2,000,000 shares during any fiscal year. The number of shares issued or reserved pursuant to the 2004 stock incentive plan, or pursuant to outstanding awards, is subject to adjustment on account of mergers, consolidations, reorganizations, stock splits, stock dividends and other dilutive changes in our common stock. In addition, our board of directors may adjust outstanding awards to preserve the awards’ benefits or potential benefits.
Stock Option Exchange
On July 9, 2009, we completed a stock option exchange program (Exchange Offer) under which eligible employees tendered, and we accepted for cancellation, eligible options to purchase 2,599,307 shares of our Class A common stock. We granted new options to eligible employees to purchase 103,361 shares of our Class A common stock and issued 819,672 restricted shares of our Class A common stock in exchange for the cancellation of the tendered eligible options. The exercise price per share of the new options granted in the Exchange Offer was $8.09, the closing price of our common stock on July 9, 2009. The new options and restricted shares issued will vest and are exercisable in equal annual increments over four years from the date of grant. This Exchange Offer did not result in any incremental compensation expense as the estimated fair value of the new awards did not exceed the estimated fair value of the exchanged stock options immediately prior to the exchange.
Stock Options
As of December 31, 2009, 3,238,485 shares were subject to options issued under our 2004 stock incentive plan and 6,650,176 shares remained available for future grants under the 2004 stock incentive plan. Options granted under this plan during the years ended December 31, 2009, 2008 and 2007 have exercise prices in the ranges of $8.09 to $11.45, $13.29 to $22.00 and $25.18 to $37.43, respectively, which primarily vest and are exercisable generally in equal annual increments over four years from the date of grant. All options that have been granted under the 2004 stock incentive plan have a term of five or seven years from the date of grant.
116
Table of Contents
CB RICHARD ELLIS GROUP, INC.
NOTES TO CONSOLIDATED FINANCIAL STATEMENTS—(Continued)
A summary of the status of our outstanding stock options is presented in the tables below:
| Shares | Weighted Average Exercise Price | |||||
| Outstanding at December 31, 2006 |
13,729,892 | $ | 7.30 | |||
| Exercised |
(1,973,947 | ) | 6.01 | |||
| Granted |
1,197,175 | 27.40 | ||||
| Forfeited |
(386,225 | ) | 8.66 | |||
| Outstanding at December 31, 2007 |
12,566,895 | $ | 9.38 | |||
| Exercised |
(941,896 | ) | 4.27 | |||
| Granted |
1,694,340 | 13.41 | ||||
| Forfeited |
(518,043 | ) | 17.29 | |||
| Expired |
(52,703 | ) | 19.01 | |||
| Outstanding at December 31, 2008 |
12,748,593 | $ | 9.91 | |||
| Exercised |
(2,665,568 | ) | 5.79 | |||
| Granted (1) |
605,066 | 10.61 | ||||
| Canceled/Forfeited (2) |
(2,851,880 | ) | 20.66 | |||
| Expired |
(248,293 | ) | 15.27 | |||
| Outstanding at December 31, 2009 |
7,587,918 | $ | 7.04 | |||
| Vested and expected to vest at December 31, 2009 (3) |
7,451,549 | $ | 7.04 | |||
| Exercisable at December 31, 2009 |
5,963,319 | $ | 5.48 | |||
| (1) | Includes 103,361 shares granted in connection with the Exchange Offer. |
| (2) | Includes 2,599,307 shares canceled in connection with the Exchange Offer. |
| (3) | The expected to vest options are the result of applying the pre-vesting forfeiture rate assumption to total outstanding options. |
We estimate the fair value of our options on the date of grant using the Black-Scholes option-pricing model, which takes into account assumptions such as the dividend yield, the risk-free interest rate, the expected stock price volatility and the expected life of the options.
The total estimated grant date fair value of stock options that vested during the year ended December 31, 2009 was $4.9 million. The weighted average fair value of options granted by us was $6.63, $6.58 and $12.42 for the years ended December 31, 2009, 2008 and 2007, respectively. The fair value of each option grant is estimated on the date of grant using the Black-Scholes option pricing model, utilizing the following weighted average assumptions:
| Year ended December 31, | |||||||||
| 2009 | 2008 | 2007 | |||||||
| Dividend yield |
0 | % | 0 | % | 0 | % | |||
| Risk-free interest rate |
2.51 | % | 3.02 | % | 4.14 | % | |||
| Expected volatility |
75.18 | % | 51.97 | % | 44.41 | % | |||
| Expected life |
6 years | 5 years | 5 years | ||||||
The dividend yield assumption is excluded from the calculation, as it is our present intention to retain all earnings. The expected volatility is based on a combination of our historical stock price and implied volatility. The selection of implied volatility data to estimate expected volatility is based upon the availability of actively
117
Table of Contents
CB RICHARD ELLIS GROUP, INC.
NOTES TO CONSOLIDATED FINANCIAL STATEMENTS—(Continued)
traded options on our stock. The risk-free interest rate is based upon the U.S. Treasury yield curve in effect at the time of grant for periods corresponding with the expected life of the options. The expected life of our stock options represents the estimated period of time until exercise and is based on historical experience of similar options, giving consideration to the contractual terms, vesting schedules and expectations of future employee behavior.
Option valuation models require the input of subjective assumptions including the expected stock price volatility and expected life. Because our employee stock options have characteristics significantly different from those of traded options and because changes in the subjective input assumptions can materially affect the fair value estimate, we do not believe that the Black-Scholes model necessarily provides a reliable single measure of the fair value of our employee stock options.
Options outstanding at December 31, 2009 and their related weighted average exercise price, intrinsic value and life information is presented below:
| Outstanding Options | Exercisable Options | |||||||||||||||||
| Exercise Prices |
Number Outstanding |
Weighted Average Remaining Contractual Life |
Weighted Average Exercise Price |
Aggregate Intrinsic Value |
Number Exercisable |
Weighted Average Exercise Price |
Aggregate Intrinsic Value | |||||||||||
| $1.92 |
4,349,433 | 3.0 | $ | 1.92 | 4,349,433 | $ | 1.92 | |||||||||||
| $6.33 – $8.44 |
200,912 | 5.4 | 7.80 | 58,055 | 6.72 | |||||||||||||
| $11.10 – $15.43 |
2,932,397 | 4.7 | 13.89 | 1,481,820 | 14.81 | |||||||||||||
| $22.00 – $25.67 |
59,856 | 4.2 | 23.39 | 45,000 | 23.66 | |||||||||||||
| $27.19 – $37.43 |
45,320 | 4.6 | 29.97 | 29,011 | 30.93 | |||||||||||||
| 7,587,918 | 3.7 | $ | 7.04 | $ | 52,839,895 | 5,963,319 | $ | 5.48 | $ | 51,157,701 | ||||||||
At December 31, 2009, the aggregate intrinsic value and weighted average remaining contractual life for options vested and expected to vest were $52.8 million and 3.7 years, respectively.
Total compensation expense related to stock options was $7.4 million, $11.3 million and $10.0 million for the years ended December 31, 2009, 2008 and 2007, respectively. In addition, during the year ended December 31, 2007, we incurred $9.8 million of expense resulting from the acceleration of vesting of stock options in connection with the termination of duplicative employees as a result of the Trammell Crow Company Acquisition, which is included in merger-related charges in the accompanying consolidated statement of operations. At December 31, 2009, total unrecognized estimated compensation cost related to non-vested stock options was approximately $9.8 million, which is expected to be recognized over a weighted average period of approximately 2.9 years.
The total intrinsic value of stock options exercised during the years ended December 31, 2009, 2008 and 2007 was $11.4 million, $12.4 million and $55.4 million, respectively. We recorded cash received from stock option exercises of $15.4 million and $4.0 million and related tax benefit of $1.6 million and $4.3 million during the years ended December 31, 2009 and 2008, respectively. Upon option exercise, we issue new shares of stock. Excess tax benefits exist when the tax deduction resulting from the exercise of options exceeds the compensation cost recorded.
118
Table of Contents
CB RICHARD ELLIS GROUP, INC.
NOTES TO CONSOLIDATED FINANCIAL STATEMENTS—(Continued)
Non-Vested Stock Awards
We have issued non-vested stock awards, including shares and stock units, in our Class A common stock to certain of our employees and members of our board of directors. During the years ended December 31, 2009, 2008 and 2007, we granted non-vested stock awards of 6,711,288 shares, 2,371,987 shares and 819,679 shares (of which 57,902 shares were restricted stock awards which immediately vested at the date of grant), respectively, which primarily vest and are exercisable generally in equal annual increments over four years from the date of grant. We also granted 54,344, 529,907 and 297,779 of non-vested stock units to certain of our employees during the years ended December 31, 2009, 2008 and 2007, respectively. These non-vested stock units all vest in 2016. A summary of the status of our non-vested stock awards is presented in the table below:
| Shares /Units | Weighted Average Market Value Per Share | |||||
| Balance at December 31, 2006 |
1,881,669 | $ | 23.97 | |||
| Granted |
1,117,458 | 29.60 | ||||
| Vested |
(467,127 | ) | 24.04 | |||
| Forfeited |
(38,419 | ) | 21.60 | |||
| Balance at December 31, 2007 |
2,493,581 | $ | 26.52 | |||
| Granted |
2,901,894 | 14.40 | ||||
| Vested |
(504,736 | ) | 24.83 | |||
| Forfeited |
(252,196 | ) | 21.49 | |||
| Balance at December 31, 2008 |
4,638,543 | $ | 19.39 | |||
| Granted (1) |
6,765,632 | 10.98 | ||||
| Vested |
(1,077,906 | ) | 19.29 | |||
| Forfeited |
(116,824 | ) | 19.96 | |||
| Balance at December 31, 2009 |
10,209,445 | $ | 13.82 | |||
| (1) | Includes 819,672 shares granted in connection with the Exchange Offer. |
Total compensation expense related to non-vested stock awards was $30.5 million, $18.5 million and $14.7 million for the years ended December 31, 2009, 2008 and 2007, respectively. Total compensation expense for the year ended December 31, 2007 includes $2.0 million of compensation expense related to the 57,902 shares of restricted stock, which immediately vested at the date of grant. In addition, during the year ended December 31, 2007, we incurred $1.0 million of expense resulting from the acceleration of vesting of non-vested stock awards in connection with the termination of duplicative employees as a result of the Trammell Crow Company Acquisition, which is included in merger-related charges in the accompanying consolidated statement of operations. At December 31, 2009, total unrecognized estimated compensation cost related to non-vested stock awards was approximately $120.9 million, which is expected to be recognized over a weighted average period of approximately 3.7 years.
Deferred Compensation Plans. Our deferred compensation plans (DCPs) historically permitted our highly compensated employees, including members of management, to elect, prior to the beginning of each calendar year, to defer receipt of some or all of their compensation for the next year until a future distribution date and have it credited to one or more of several funds in the respective DCPs. Because a substantial majority of the deferrals under our DCPs had distribution dates based upon the end of a relevant participant’s employment with us, we had an ongoing obligation to make distributions to these participants as they left our employment. In addition, participants could receive unscheduled in-service withdrawals of amounts deferred prior to January 1, 2005, subject to a 7.5% penalty.
119
Table of Contents
CB RICHARD ELLIS GROUP, INC.
NOTES TO CONSOLIDATED FINANCIAL STATEMENTS—(Continued)
On November 5, 2008, based on prevailing market conditions, our board of directors authorized our Chief Executive Officer to modify or to terminate our U.S. DCPs, subject to applicable regulatory requirements. We notified participants that we would modify the DCPs pursuant to the transition rules under Section 409A of the Internal Revenue Code of 1986 to allow participants to make new elections prior to December 31, 2008 to receive distributions of plan assets at dates they specified in 2009. These actions accelerated distributions from the DCPs of cash and shares of our Class A common stock to the participants of such DCPs but did not have any material effect on our statement of operations. In connection such distributions in 2009, we will receive a cash tax benefit of approximately $95 million.
As of December 31, 2008, the accompanying consolidated balance sheets included an accumulated non-stock liability for our DCPs totaling $244.9 million and assets (in the form of insurance) set aside to cover the liability of $229.8 million. As of December 31, 2008, there were also 2,849,391 outstanding stock fund units under the DCPs, all of which were vested. Our stock fund unit deferrals included in additional paid-in capital totaled $5.5 million at December 31, 2008. All DCP liabilities and stock fund units that existed at December 31, 2008 were distributed to participants in 2009.
Bonuses. We have bonus programs covering select employees, including senior management. Awards are based on the position and performance of the employee and the achievement of pre-established financial, operating and strategic objectives. The amounts charged to expense for bonuses were $60.6 million, $66.7 million and $235.0 million for the years ended December 31, 2009, 2008 and 2007, respectively.
401(k) Plan. Our CB Richard Ellis 401(k) Plan (401(k) Plan) is a defined contribution profit sharing plan that allows participant deferrals under Section 401(k) of the Internal Revenue Code. Most of our non-union U.S. employees, other than qualified real estate agents having the status of independent contractors under section 3508 of the Internal Revenue Code, are eligible to participate in the plan. The 401(k) Plan provides for participant contributions as well as a company match. A participant is allowed to contribute to the 401(k) Plan from 1% to 75% of his or her compensation, subject to limits imposed by applicable law. Effective January 1, 2009, the company match was suspended until further notice. For 2008 and 2007, we contributed a 50% match on the first 3% of annual compensation (up to $150,000 of compensation) deferred by each participant. Effective January 1, 2007, all participants hired post January 1, 2007 vest in company match contributions 20% per year for each plan year they work 1,000 hours. All participants hired before January 1, 2007 are immediately vested in company match contributions. In connection with the 401(k) Plan, we charged to expense $0.7 million, $9.0 million and $12.6 million for the years ended December 31, 2009, 2008 and 2007, respectively.
Participants are entitled to invest up to 25% of their 401(k) account balance in shares of our common stock. As of December 31, 2009, approximately 1.3 million shares of our common stock were held as investments by participants in our 401(k) Plan.
Pension Plans. We have two contributory defined benefit pension plans in the U.K. The London-based firm of Hillier Parker May & Rowden, which we acquired in 1998, had a contributory defined benefit pension plan. A subsidiary of Insignia, which we acquired in connection with the Insignia Acquisition in 2003, also had a contributory defined benefit pension plan in the U.K. Our subsidiaries based in the U.K. maintain the plans to provide retirement benefits to existing and former employees participating in these plans. With respect to these plans, our historical policy has been to contribute annually an amount to fund pension cost as actuarially determined and as required by applicable laws and regulations. Effective July 1, 2007, we reached agreements with the active members of these plans to freeze future pension plan benefits. In return, the active members became eligible to enroll in a defined contribution plan. In connection with this change, we recorded a curtailment gain of $10.0 million during the year ended December 31, 2007 and certain plan assets and liabilities were remeasured.
120
Table of Contents
CB RICHARD ELLIS GROUP, INC.
NOTES TO CONSOLIDATED FINANCIAL STATEMENTS—(Continued)
We previously used a measurement date of September 30 for both of our defined benefit pension plans. For the year ended December 31, 2008, as required by the “Compensation – Retirement Benefits” Topic of the FASB ASC (Topic 715), we adopted the measurement date provisions, which required us to measure the funded status of our plans as of the date of our fiscal year-end statement of financial position. We used the “alternative” method of adoption for both of our plans. In connection with this adoption, during the year ended December 31, 2008, we recorded an increase in retained earnings of $0.2 million and a decrease in accumulated other comprehensive loss of $0.1 million, net of tax, representing the estimated periodic pension benefit for the period from October 1, 2007 through December 31, 2007. The following table sets forth a reconciliation of the benefit obligation, plan assets, plan’s funded status and amounts recognized in the accompanying consolidated balance sheets for both of our defined benefit pension plans (dollars in thousands):
| Year Ended December 31, | ||||||||
| 2009 | 2008 | |||||||
| Change in benefit obligation |
||||||||
| Benefit obligation at beginning of period |
$ | 205,315 | $ | 330,922 | ||||
| Interest cost |
14,285 | 21,508 | ||||||
| Actuarial loss (gain) |
67,028 | (58,927 | ) | |||||
| Benefits paid |
(6,345 | ) | (9,221 | ) | ||||
| Foreign currency translation |
24,629 | (78,967 | ) | |||||
| Benefit obligation at end of period |
$ | 304,912 | $ | 205,315 | ||||
| Change in plan assets |
||||||||
| Fair value of plan asset at beginning of period |
$ | 185,513 | $ | 296,759 | ||||
| Actuarial return on plan assets |
36,250 | (52,060 | ) | |||||
| Company contributions |
3,504 | 20,734 | ||||||
| Benefits paid |
(6,345 | ) | (9,221 | ) | ||||
| Foreign currency translation |
21,045 | (70,699 | ) | |||||
| Fair value of plan assets at end of period |
$ | 239,967 | $ | 185,513 | ||||
| Funded status |
$ | (64,945 | ) | $ | (19,802 | ) | ||
| Amounts recognized in the statement of financial position consist of: |
||||||||
| Non-current liabilities |
$ | (64,945 | ) | $ | (19,802 | ) | ||
The accumulated benefit obligation for our defined benefit pension plans was $304.9 million and $205.3 million at December 31, 2009 and 2008, respectively.
Items not yet recognized as a component of net periodic pension cost were as follows (dollars in thousands):
| Year Ended December 31, | ||||||
| 2009 | 2008 | |||||
| Unamortized actuarial loss |
$ | 93,869 | $ | 49,434 | ||
| Accumulated other comprehensive loss |
$ | 93,869 | $ | 49,434 | ||
The estimated net actuarial loss that will be amortized from accumulated other comprehensive loss into net periodic pension cost in 2010 is $2.3 million.
121
Table of Contents
CB RICHARD ELLIS GROUP, INC.
NOTES TO CONSOLIDATED FINANCIAL STATEMENTS—(Continued)
Components of net periodic pension cost (benefit) and other amounts recognized in other comprehensive (income) loss consisted of the following (dollars in thousands):
| Year Ended December 31, | ||||||||||||
| 2009 | 2008 | 2007 | ||||||||||
| Net Periodic Cost (Benefit) |
||||||||||||
| Service cost |
$ | — | $ | — | $ | 4,551 | ||||||
| Interest cost |
14,285 | 17,208 | 17,156 | |||||||||
| Expected return on plan assets |
(12,422 | ) | (19,045 | ) | (18,837 | ) | ||||||
| Curtailment gain |
— | — | (9,988 | ) | ||||||||
| Amortization of prior service benefit |
— | — | (446 | ) | ||||||||
| Amortization of unrecognized net loss |
1,042 | 604 | 1,053 | |||||||||
| Net periodic pension cost (benefit) |
$ | 2,905 | $ | (1,233 | ) | $ | (6,511 | ) | ||||
| Other Changes in Plan Assets and Benefit Obligations Recognized in Other Comprehensive (Income) Loss |
||||||||||||
| Net actuarial loss |
$ | 44,435 | $ | 13,434 | ||||||||
| Amortization of prior service cost |
— | 2,757 | ||||||||||
| Post-measurement date contributions |
— | (17,348 | ) | |||||||||
| Total recognized in other comprehensive loss (income) |
44,435 | (1,157 | ) | |||||||||
| Total recognized in net periodic cost (benefit) and other comprehensive loss (income) |
$ | 47,340 | $ | (2,390 | ) | |||||||
Weighted average assumptions used to determine our projected benefit obligation were as follows:
| Year Ended December 31, | ||||||
| 2009 | 2008 | |||||
| Discount rate |
5.60 | % | 6.60 | % | ||
| Expected return on plan assets |
6.92 | % | 6.53 | % | ||
Weighted average assumptions used to determine our net periodic pension cost (benefit) were as follows:
| Year Ended December 31, | |||||||||
| 2009 | 2008 | 2007 | |||||||
| Discount rate |
5.60 | % | 6.60 | % | 5.48 | % | |||
| Expected return on plan assets |
6.92 | % | 6.53 | % | 6.82 | % | |||
| Rate of compensation increase |
N/A | N/A | 1.31 | % | |||||
We select a discount rate by reference to yields available at our balance sheet date on U.K. AA-rated corporate bonds. The corporate bond yield curve is derived by taking a government bond yield curve, based on Bank of England data and adding an amount to reflect the yield spread on AA-rated bonds over government bonds. This discount rate selected is the weighted average of the yields on the resulting bond yield curve, where the weighting is based on the expected cash flow from the weighted average duration of the pension plans.
We review historical rates of return for equity and fixed income securities, as well as current economic conditions, to determine the expected long-term rate of return on plan assets. The assumed rate of return for 2009 is based on 63.8% of the portfolio being invested in equities yielding a 7.9% return and 31.9% of assets being primarily invested in corporate and government debt securities yielding a 5.0% return. Consideration is given to diversification and periodic rebalancing of the portfolio based on prevailing market conditions.
122
Table of Contents
CB RICHARD ELLIS GROUP, INC.
NOTES TO CONSOLIDATED FINANCIAL STATEMENTS—(Continued)
Our pension plan weighted average asset allocations by asset category were as follows:
| Asset Category |
Target Allocation 2009 |
Plan Assets At December 31, |
|||||||
| 2009 | 2008 | ||||||||
| Equity securities |
22 | %-74% | 63.8 | % | 61.5 | % | |||
| Debt securities |
18 | %-77% | 31.9 | % | 33.7 | % | |||
| Other |
1 | %-8% | 4.3 | % | 4.8 | % | |||
| Total |
100.0 | % | 100.0 | % | |||||
Our pension trust assets are invested with a long-term focus to achieve a return on investment that is based on levels of liquidity and investment risk that the trustees, in consultation with management believe are prudent and reasonable. The investment portfolio contains a diversified blend of equity and fixed income and index linked investments consisting primarily of government debt. The equity investments are diversified across U.K. and non-U.K. equities, as well as value, growth, and medium and large capitalizations. The portfolio’s asset mix is reviewed regularly, and the portfolio is rebalanced based on existing market conditions. Investment risk is measured and monitored on a regular basis through quarterly portfolio reviews, annual liability measurements and periodic asset/liability analyses.
In December 2008, the FASB issued FASB Staff Position SFAS No. 132R-1, “Employers’ Disclosures about Postretirement Benefit Plan Assets,” which is now included in Topic 715 of the FASB ASC, which required employers to provide additional disclosures about plan assets of a defined benefit pension or other post-retirement plan. We have incorporated below the disclosures on the major categories of plan assets, the inputs and valuation techniques used to measure the fair value of plan assets and an understanding of significant concentrations of risk within plan assets.
The fair value of our pension assets are comprised of the following (dollars in thousands):
| Fair Value Measured and Recorded Using: | ||||||||||||
| As of December 31, 2009 | Total | Quoted Prices in Active Markets for Identical Assets (Level 1) |
Significant Observable Inputs (Level 2) |
Significant Unobservable Inputs (Level 3) | ||||||||
| Asset Category |
||||||||||||
| Cash |
$ | 1,640 | $ | 1,640 | $ | — | $ | — | ||||
| Equity securities (a) |
153,081 | — | 153,081 | — | ||||||||
| Fixed income securities (a) |
76,585 | — | 76,585 | — | ||||||||
| Other types of investments (b) |
8,661 | — | — | 8,661 | ||||||||
| Total |
$ | 239,967 | $ | 1,640 | $ | 229,666 | $ | 8,661 | ||||
| As of December 31, 2008 |
||||||||||||
| Asset Category |
||||||||||||
| Cash |
$ | 1,465 | $ | 1,465 | $ | — | $ | — | ||||
| Equity securities (a) |
113,923 | — | 113,923 | — | ||||||||
| Fixed income securities (a) |
62,486 | — | 62,486 | — | ||||||||
| Other types of investments (b) |
7,639 | — | — | 7,639 | ||||||||
| Total |
$ | 185,513 | $ | 1,465 | $ | 176,409 | $ | 7,639 | ||||
123
Table of Contents
CB RICHARD ELLIS GROUP, INC.
NOTES TO CONSOLIDATED FINANCIAL STATEMENTS—(Continued)
| (a) | These investments represent investments in foreign equity and bond funds. Generally, these assets are valued using bid-market valuations provided by the funds’ investment managers. |
| (b) | These investments represent investments in a pooled property fund and a property unit trust that invest in commercial real estate properties in the U.K. The fair values for these investments are based on inputs obtained from broker quotes that are indicative of value and cannot be corroborated by observable market data. |
A summary of our pension assets measured and recorded using significant unobservable inputs is as follows (dollars in thousands):
| Real Estate Funds | |||
| Beginning balance at December 31, 2008 |
$ | 7,639 | |
| Actuarial return on plan assets |
184 | ||
| Foreign currency translation |
838 | ||
| Ending balance at December 31, 2009 |
$ | 8,661 | |
We expect to contribute $3.7 million to our pension plans in 2010. The following is a schedule by year of benefit payments, which reflect expected future service, as appropriate, that are expected to be paid (dollars in thousands):
| 2010 |
$ | 5,530 | |
| 2011 |
7,097 | ||
| 2012 |
7,415 | ||
| 2013 |
8,290 | ||
| 2014 |
8,275 | ||
| 2015-2019 |
53,361 | ||
| Total |
$ | 89,968 | |
We also have defined contribution plans for employees in the U.K. Our contributions to these plans were approximately $8.6 million, $7.2 million and $5.6 million for the years ended December 31, 2009, 2008 and 2007, respectively.
16. Income Taxes
The components of (loss) income from continuing operations before provision for income taxes consisted of the following (dollars in thousands):
| Year Ended December 31, | |||||||||||
| 2009 | 2008 | 2007 | |||||||||
| Domestic |
$ | (117,039 | ) | $ | (1,005,163 | ) | $ | 191,499 | |||
| Foreign |
116,394 | (20,516 | ) | 400,890 | |||||||
| $ | (645 | ) | $ | (1,025,679 | ) | $ | 592,389 | ||||
124
Table of Contents
CB RICHARD ELLIS GROUP, INC.
NOTES TO CONSOLIDATED FINANCIAL STATEMENTS—(Continued)
Our tax (benefit) provision consisted of the following (dollars in thousands):
| Year Ended December 31, | ||||||||||||
| 2009 | 2008 | 2007 | ||||||||||
| Federal: |
||||||||||||
| Current |
$ | (116,382 | ) | $ | (18,114 | ) | $ | 219,789 | ||||
| Deferred |
107,878 | 3,535 | (172,789 | ) | ||||||||
| (8,504 | ) | (14,579 | ) | 47,000 | ||||||||
| State: |
||||||||||||
| Current |
759 | (4,543 | ) | 49,338 | ||||||||
| Deferred |
5,968 | 15,583 | (15,990 | ) | ||||||||
| 6,727 | 11,040 | 33,348 | ||||||||||
| Foreign: |
||||||||||||
| Current |
26,581 | 55,340 | 93,946 | |||||||||
| Deferred |
2,189 | (991 | ) | 18,349 | ||||||||
| 28,770 | 54,349 | 112,295 | ||||||||||
| $ | 26,993 | $ | 50,810 | $ | 192,643 | |||||||
The following is a reconciliation, stated as a percentage of pre-tax (loss) income of the U.S. statutory federal income tax rate to our effective tax rate:
| Year Ended December 31, | |||||||||
| 2009 | 2008 | 2007 | |||||||
| Federal statutory tax rate |
35 | % | 35 | % | 35 | % | |||
| Credits and exemptions |
1,051 | 1 | (3 | ) | |||||
| Reserves for uncertain tax positions |
964 | — | (1 | ) | |||||
| Foreign rate differential |
234 | — | — | ||||||
| Non-controlling interests |
(3,309 | ) | (2 | ) | (1 | ) | |||
| Change in valuation allowance |
(1,962 | ) | (2 | ) | — | ||||
| Non-deductible expenses |
(926 | ) | — | 1 | |||||
| State taxes, net of federal benefit |
(234 | ) | (1 | ) | 2 | ||||
| Effect of non-deductible impairment charges |
— | (34 | ) | — | |||||
| Effect of life insurance contract gains and losses |
— | (2 | ) | (1 | ) | ||||
| Other |
(38 | ) | — | 1 | |||||
| Effective tax rate |
(4,185 | %) | (5 | %) | 33 | % | |||
During the years ended December 31, 2009, 2008 and 2007, respectively, we recorded a $3.5 million, $4.7 million and $21.1 million income tax benefit in connection with stock options exercised. Of this income tax benefit, $1.6 million, $4.3 million and $16.6 million was charged directly to additional paid-in capital within the equity section of the accompanying consolidated balance sheets in 2009, 2008 and 2007, respectively.
125
Table of Contents
CB RICHARD ELLIS GROUP, INC.
NOTES TO CONSOLIDATED FINANCIAL STATEMENTS—(Continued)
Cumulative tax effects of temporary differences are shown below at December 31, 2009 and 2008 (dollars in thousands):
| December 31, | ||||||||
| 2009 | 2008 | |||||||
| Asset (Liability) |
||||||||
| Property and equipment |
$ | (4,120 | ) | $ | 4,232 | |||
| Bad debt and other reserves |
46,559 | 68,454 | ||||||
| Capitalized costs and intangibles |
(108,145 | ) | (99,707 | ) | ||||
| Bonus and deferred compensation |
63,470 | 111,252 | ||||||
| Investments |
5,710 | 31,439 | ||||||
| NOL and state tax credits |
57,196 | 44,896 | ||||||
| Unconsolidated affiliates |
33,215 | 55,830 | ||||||
| Pension obligation |
21,701 | 11,639 | ||||||
| Acquisition |
527 | 2,586 | ||||||
| All other |
4,794 | (100 | ) | |||||
| Net deferred tax assets before valuation allowance |
120,907 | 230,521 | ||||||
| Valuation allowance |
(42,182 | ) | (38,268 | ) | ||||
| Net deferred tax assets |
$ | 78,725 | $ | 192,253 | ||||
As of December 31, 2009, we had U.S. federal net operating losses (NOLs) of approximately $6.7 million, translating to a deferred tax asset before valuation allowance of $2.3 million, which will begin to expire in 2023. As of December 31, 2009, there were also deferred tax assets of approximately $25.9 million related to state NOLs as well as $28.1 million related to foreign NOLs. The state NOLs begin to expire in 2011, and the foreign NOLs begin to expire in 2013. The utilization of NOLs may be subject to certain limitations under U.S. federal, state and foreign laws.
Management determined that as of December 31, 2009, $42.2 million of deferred tax assets do not satisfy the recognition criteria set forth in Topic 740. Accordingly, a valuation allowance has been recorded for this amount. If released, the entire amount would result in a benefit to continuing operations. During the year ended December 31, 2009, our valuation allowances increased by approximately $3.9 million. This was primarily the result of establishing valuation allowances on $5.9 million of foreign net operating losses, $5.8 million of state net operating losses and $6.5 million of other foreign assets. These increases were offset by decreases of $8.5 million related to foreign net operating loss adjustments, $3.4 million related to the reversal of valuation allowances on assets disposed of and $2.4 million related to the utilization of foreign net operating losses. Management believes it is more likely than not that future operations will generate sufficient taxable income to realize the benefit of the deferred tax assets recorded net of these valuation allowances.
Presently, we have not recorded a deferred tax liability for undistributed earnings of subsidiaries located outside of the U.S. These earnings may become taxable upon a payment of a dividend or as a result of a sale or liquidation of the subsidiaries. At this time, we do not have any plans to repatriate income from our foreign subsidiaries, however, to the extent that we are able to repatriate such earnings in a tax free manner, or in the event of a change in our capital situation or investment strategy, it is possible that the foreign subsidiaries may pay a dividend which would impact our effective tax rate. Unremitted earnings of foreign subsidiaries, which have been, or are intended to be permanently invested, aggregated approximately $847.1 million at December 31, 2009. The determination of the tax liability upon repatriation is not practicable.
126
Table of Contents
CB RICHARD ELLIS GROUP, INC.
NOTES TO CONSOLIDATED FINANCIAL STATEMENTS—(Continued)
The total amount of gross unrecognized tax benefits was approximately $69.2 million and $74.1 million as of December 31, 2009 and 2008, respectively. The total amount of unrecognized tax benefits that would affect our effective tax rate, if recognized, is $36.8 million ($34.9 million, net of federal benefit received from state positions) and $37.9 million ($35.6 million, net of federal benefit received from state positions) as of December 31, 2009 and 2008, respectively.
A reconciliation of the beginning and ending amount of unrecognized tax benefits for the years ended December 31, 2009 and 2008 is as follows (dollars in thousands):
| Year Ended December 31, | ||||||||
| 2009 | 2008 | |||||||
| Beginning balance, unrecognized tax benefits |
$ | (74,084 | ) | $ | (66,476 | ) | ||
| Gross increases—tax positions in prior period |
(3,425 | ) | (13,532 | ) | ||||
| Gross decreases—tax positions in prior period |
11,194 | 13,273 | ||||||
| Gross increases—current-period tax positions |
(5,148 | ) | (12,293 | ) | ||||
| Decreases relating to settlements |
1,625 | 2,711 | ||||||
| Reductions as a result of a lapse of statute of limitations |
1,900 | 126 | ||||||
| Foreign exchange movement |
(1,249 | ) | 2,107 | |||||
| Ending balance, unrecognized tax benefits |
$ | (69,187 | ) | $ | (74,084 | ) | ||
We currently anticipate a decrease of $1.0 million to unrecognized tax benefits during the next 12 months due to expiration of the statute of limitations relative to several immaterial items.
Our continuing practice is to recognize potential accrued interest and/or penalties related to income tax matters within income tax expense. During the years ended December 31, 2009, 2008 and 2007, we accrued an additional $2.8 million, $3.4 million and $4.9 million, respectively, in interest associated with uncertain tax positions. As of December 31, 2009 and 2008, we have recognized a liability for interest and penalties of $22.5 million ($19.1 million, net of related federal benefit received from interest expense) and $22.5 million ($19.2 million, net of related federal benefit received from interest expense), respectively.
We conduct business globally and, as a result, one or more of our subsidiaries files income tax returns in the U.S. federal jurisdiction and multiple state, local and foreign jurisdictions. We are no longer subject to U.S. federal Internal Revenue Service audits for years prior to 2005. With limited exception, our significant state and foreign tax jurisdictions are no longer subject to audit by the various tax authorities for tax years prior to 2002.
17. Stockholders’ Equity
On June 4, 2009, we filed a Certificate of Amendment to our Restated Certificate of Incorporation that increased the total number of shares of Class A common stock that we are authorized to issue from 325,000,000 to 525,000,000, with $0.01 par value per share. Holders of our Class A common stock are entitled to one vote per share on all matters on which our stockholders are entitled to vote. Holders of our Class A common stock are entitled to receive ratable dividends if and when declared from time to time by our board of directors out of funds legally available for that purpose, after payment of dividends required to be paid on any outstanding preferred stock. Our amended and restated credit agreement governing our revolving credit facility and senior secured term loan facilities imposes restrictions on our ability to declare dividends with respect to our Class A common stock.
127
Table of Contents
CB RICHARD ELLIS GROUP, INC.
NOTES TO CONSOLIDATED FINANCIAL STATEMENTS—(Continued)
Our board of directors is authorized, subject to any limitations imposed by law, without the approval of our stockholders, to issue a total of 25,000,000 shares of preferred stock, in one or more series, with each such series having rights and preferences including voting rights, dividend rights, conversion rights, redemption privileges and liquidation preferences, as our board of directors may determine.
In the fourth quarter of 2007, we completed the repurchase of 28,830,442 shares of our Class A common stock for a total cost of $635.0 million.
On November 18, 2008, we completed a secondary public offering of 57,500,000 shares of our common stock, which raised $206.7 million of net proceeds.
On June 10, 2009, we completed the sale of 13,440,860 shares of our Class A common stock through a direct placement to Paulson & Co. Inc., which raised approximately $97.6 million of net proceeds. On June 11, 2009, we completed the sale of 5,682,684 shares of our Class A common stock through an at-the-market offering program, which raised approximately $48.8 million of net proceeds.
In November 2009, we completed the sale of 28,289,960 shares of our Class A common stock pursuant to an at-the-market offering program, which raised approximately $293.8 million of net proceeds.
18. Earnings (Loss) Per Share Information
The following is a calculation of earnings (loss) per share (dollars in thousands, except share data):
| Year Ended December 31, | ||||||||||
| 2009 | 2008 | 2007 | ||||||||
| Computation of basic income (loss) per share attributable to CB Richard Ellis Group, Inc. shareholders: |
||||||||||
| Net income (loss) attributable to CB Richard Ellis Group, Inc. shareholders |
$ | 33,341 | $ | (1,012,066 | ) | $ | 390,505 | |||
| Weighted average shares outstanding for basic income (loss) per share |
277,361,783 | 210,539,032 | 228,476,724 | |||||||
| Basic income (loss) per share attributable to CB Richard Ellis Group, Inc. shareholders |
$ | 0.12 | $ | (4.81 | ) | $ | 1.71 | |||
| Computation of diluted income (loss) per share attributable to CB Richard Ellis Group, Inc. shareholders: |
||||||||||
| Net income (loss) attributable to CB Richard Ellis Group, Inc. shareholders |
$ | 33,341 | $ | (1,012,066 | ) | $ | 390,505 | |||
| Weighted average shares outstanding for diluted income (loss) per share |
277,361,783 | 210,539,032 | 228,476,724 | |||||||
| Dilutive effect of stock options |
2,302,046 | — | 6,012,342 | |||||||
| Dilutive effect of contingently issuable shares |
331,252 | — | 489,398 | |||||||
| Weighted average shares outstanding for diluted income (loss) per share |
279,995,081 | 210,539,032 | 234,978,464 | |||||||
| Diluted income (loss) per share attributable to CB Richard Ellis Group, Inc. shareholders |
$ | 0.12 | $ | (4.81 | ) | $ | 1.66 | |||
128
Table of Contents
CB RICHARD ELLIS GROUP, INC.
NOTES TO CONSOLIDATED FINANCIAL STATEMENTS—(Continued)
For the year ended December 31, 2009, options to purchase 3,037,573 shares of common stock were excluded from the computation of diluted earnings per share because their inclusion would have had an anti-dilutive effect. Had we reported net income for the year ended December 31, 2008, options to purchase 3,791,911 shares of common stock would have been included in the computation of diluted earnings per share for the year ended December 31, 2008, while options to purchase 3,501,014 shares of common stock would have been excluded from the computation of diluted earnings per share as their inclusion would have had an anti-dilutive effect. For the year ended December 31, 2007, options to purchase 1,202,891 shares of common stock were excluded from the computation of diluted earnings per share because their inclusion would have had an anti-dilutive effect.
19. Fiduciary Funds
The accompanying consolidated balance sheets do not include the net assets of escrow, agency and fiduciary funds, which are held by us on behalf of clients and which amounted to $1.3 billion and $1.2 billion at December 31, 2009 and 2008, respectively.
20. Merger-Related Charges
In connection with the Trammell Crow Company Acquisition, we recorded merger-related charges of $56.9 million for the year ended December 31, 2007. These charges primarily related to the termination of employees as well as the exit of facilities that were occupied by us prior to the Trammell Crow Company Acquisition, both of which became duplicative as a result of the Trammell Crow Company Acquisition. We recorded charges for the exit of these facilities as premises were vacated and for redundant employees as these employees were terminated.
The remaining liability associated with items previously charged to merger-related charges in connection with the Trammell Crow Company Acquisition consisted of the following (dollars in thousands):
| 2007 Charge |
Utilized to Date | To be Utilized at December 31, 2009 | ||||||||
| Severance |
$ | 34,345 | $ | (34,345 | ) | $ | — | |||
| Lease termination costs |
16,035 | (14,019 | ) | 2,016 | ||||||
| Consulting costs |
2,130 | (2,130 | ) | — | ||||||
| Costs associated with exiting contracts |
1,273 | (1,273 | ) | — | ||||||
| Other |
3,149 | (3,149 | ) | — | ||||||
| Total merger-related charges |
$ | 56,932 | $ | (54,916 | ) | $ | 2,016 | |||
The remaining liability for lease termination costs will be paid over the remaining contract periods through 2016.
The remaining liability associated with items previously charged to merger-related charges in connection with the Insignia Acquisition consisted of the following (dollars in thousands):
| Liability Balance at December 31, 2008 |
2009 Utilization |
To be Utilized at December 31, 2009 | ||||||||
| Lease termination costs |
$ | 7,898 | $ | (5,564 | ) | $ | 2,334 | |||
129
Table of Contents
CB RICHARD ELLIS GROUP, INC.
NOTES TO CONSOLIDATED FINANCIAL STATEMENTS—(Continued)
The remaining liability for lease termination costs will be paid over the remaining contract periods through 2012.
21. Liabilities Related to Acquisitions
The Trammell Crow Company Acquisition gave rise to the consolidation and elimination of some Trammell Crow Company duplicate facilities as well as lawsuits involving Trammell Crow Company, which resulted in the accrual of certain liabilities. The remaining liabilities assumed in connection with the Trammell Crow Company Acquisition consist of the following and are included in the accompanying consolidated balance sheets (dollars in thousands):
| Liability Balance at December 31, 2008 |
2009 Utilization |
To be Utilized at December 31, 2009 | ||||||||
| Lease termination costs |
$ | 3,410 | $ | (3,410 | ) | $ | — | |||
| Legal settlements anticipated |
3,157 | (1,368 | ) | 1,789 | ||||||
| $ | 6,567 | $ | (4,778 | ) | $ | 1,789 | ||||
The remaining liability covering our exposure in various lawsuits involving Trammell Crow Company that were pending prior to the Trammell Crow Company Acquisition will be paid as each case is settled.
The Insignia Acquisition gave rise to the consolidation and elimination of some Insignia duplicate facilities as well as lawsuits involving Insignia, which resulted in the accrual of certain liabilities. The remaining liabilities assumed in connection with the Insignia Acquisition consist of the following and are included in the accompanying consolidated balance sheets (dollars in thousands):
| Liability Balance at December 31, 2008 |
2009 Utilization |
To be Utilized at December 31, 2009 | ||||||||
| Lease termination costs |
$ | 4,541 | $ | (2,869 | ) | $ | 1,672 | |||
| Legal settlements anticipated |
2,128 | (24 | ) | 2,104 | ||||||
| $ | 6,669 | $ | (2,893 | ) | $ | 3,776 | ||||
The remaining liability for lease termination costs will be paid over the remaining contract periods through 2012. The remaining liability covering our exposure in various lawsuits involving Insignia that were pending prior to the Insignia Acquisition will be paid as the case is settled.
130
Table of Contents
CB RICHARD ELLIS GROUP, INC.
NOTES TO CONSOLIDATED FINANCIAL STATEMENTS—(Continued)
22. Discontinued Operations
In the ordinary course of business of our Development Services segment, we sell real estate assets, or hold real estate assets for sale, that may be considered components of an entity in accordance with Topic 360. If we do not have, or expect to have, significant continuing involvement with the operation of these real estate assets after sale, we are required to recognize operating profits or losses and gains or losses on sale of these assets as discontinued operations in our consolidated statements of operations in the periods in which they occur. Real estate operations and dispositions accounted for as discontinued operations for the years ended December 31, 2008 and 2007 were as follows (dollars in thousands):
| Year Ended December 31, | ||||||
| 2008 | 2007 | |||||
| Revenue |
$ | 1,251 | $ | 2,102 | ||
| Costs and expenses: |
||||||
| Operating, administrative and other |
659 | 812 | ||||
| Depreciation and amortization |
92 | 425 | ||||
| Total costs and expenses |
751 | 1,237 | ||||
| Gain on disposition of real estate |
32,816 | 7,878 | ||||
| Operating income |
33,316 | 8,743 | ||||
| Interest income |
124 | 15 | ||||
| Interest expense |
649 | 1,837 | ||||
| Income from discontinued operations, before provision for income taxes |
32,791 | 6,921 | ||||
| Provision for income taxes |
6,043 | 1,613 | ||||
| Income from discontinued operations, net of income taxes |
26,748 | 5,308 | ||||
| Less: Income from discontinued operations, net of income taxes, attributable to non-controlling interests |
16,523 | 2,674 | ||||
| Income from discontinued operations, net of income taxes, attributable to CB Richard Ellis Group, Inc. |
$ | 10,225 | $ | 2,634 | ||
23. Industry Segments
We report our operations through five segments. The segments are as follows: (1) Americas, (2) EMEA, (3) Asia Pacific, (4) Global Investment Management and (5) Development Services.
The Americas segment is our largest segment of operations and provides a comprehensive range of services throughout the U.S. and in the largest regions of Canada and selected parts of Latin America. The primary services offered consist of the following: real estate services, mortgage loan origination and servicing, valuation services, asset services and corporate services.
Our EMEA and Asia Pacific segments provide services similar to the Americas business segment. The EMEA segment has operations primarily in Europe, while the Asia Pacific segment has operations primarily in Asia, Australia and New Zealand.
Our Global Investment Management business provides investment management services to clients seeking to generate returns and diversification through direct and indirect investments in real estate in the U. S., Europe and Asia.
Our Development Services business consists of real estate development and investment activities primarily in the U.S., which we acquired in the Trammell Crow Company Acquisition on December 20, 2006.
131
Table of Contents
CB RICHARD ELLIS GROUP, INC.
NOTES TO CONSOLIDATED FINANCIAL STATEMENTS—(Continued)
Summarized financial information by segment is as follows (dollars in thousands):
| Year Ended December 31, | ||||||||||||
| 2009 | 2008 | 2007 | ||||||||||
| Revenue |
||||||||||||
| Americas |
$ | 2,594,127 | $ | 3,209,820 | $ | 3,689,737 | ||||||
| EMEA |
818,136 | 1,080,725 | 1,314,019 | |||||||||
| Asia Pacific |
524,308 | 558,183 | 548,650 | |||||||||
| Global Investment Management |
141,445 | 161,200 | 347,883 | |||||||||
| Development Services |
87,804 | 118,889 | 133,960 | |||||||||
| $ | 4,165,820 | $ | 5,128,817 | $ | 6,034,249 | |||||||
| Depreciation and amortization |
||||||||||||
| Americas |
$ | 56,883 | $ | 59,871 | $ | 77,076 | ||||||
| EMEA |
11,158 | 13,272 | 12,324 | |||||||||
| Asia Pacific |
8,726 | 9,079 | 6,489 | |||||||||
| Global Investment Management |
4,901 | 4,182 | 2,798 | |||||||||
| Development Services |
17,805 | 16,413 | 14,582 | |||||||||
| $ | 99,473 | $ | 102,817 | $ | 113,269 | |||||||
| Equity (loss) income from unconsolidated subsidiaries |
||||||||||||
| Americas |
$ | 8,305 | $ | (6,443 | ) | $ | 16,659 | |||||
| EMEA |
838 | 1,665 | 387 | |||||||||
| Asia Pacific |
(231 | ) | 12 | (31 | ) | |||||||
| Global Investment Management |
(27,548 | ) | (43,337 | ) | 19,222 | |||||||
| Development Services |
(15,459 | ) | (32,027 | ) | 28,702 | |||||||
| $ | (34,095 | ) | $ | (80,130 | ) | $ | 64,939 | |||||
| EBITDA |
||||||||||||
| Americas |
$ | 248,238 | $ | 345,243 | $ | 365,004 | ||||||
| EMEA |
66,545 | 105,474 | 261,199 | |||||||||
| Asia Pacific |
53,900 | 48,357 | 82,775 | |||||||||
| Global Investment Management |
4,112 | (7,615 | ) | 113,068 | ||||||||
| Development Services |
(716 | ) | (34,438 | ) | 12,218 | |||||||
| $ | 372,079 | $ | 457,021 | $ | 834,264 | |||||||
EBITDA represents earnings before net interest expense, write-off of financing costs, income taxes, depreciation and amortization, and goodwill and other non-amortizable intangible asset impairment. Our management believes EBITDA is useful in evaluating our operating performance compared to that of other companies in our industry because the calculation of EBITDA generally eliminates the effects of financing and income taxes and the accounting effects of capital spending and acquisitions, which would include impairment charges of goodwill and intangibles created from acquisitions. Such items may vary for different companies for reasons unrelated to overall operating performance. As a result, our management uses EBITDA as a measure to evaluate the operating performance of our various business segments and for other discretionary purposes, including as a significant component when measuring our operating performance under our employee incentive programs. Additionally, we believe EBITDA is useful to investors to assist them in getting a more accurate picture of our results from operations.
However, EBITDA is not a recognized measurement under U.S. generally accepted accounting principles (GAAP) and when analyzing our operating performance, readers should use EBITDA in addition to, and not as an alternative for, net income as determined in accordance with GAAP. Because not all companies use identical calculations, our presentation of EBITDA may not be comparable to similarly titled measures of other companies. Furthermore, EBITDA is not intended to be a measure of free cash flow for our management’s discretionary use, as it does not consider certain cash requirements such as tax and debt service payments. The amounts shown for EBITDA also differ from the amounts calculated under similarly titled definitions in our debt instruments, which are further adjusted to reflect certain other cash and non-cash charges and are used to determine compliance with financial covenants and our ability to engage in certain activities, such as incurring additional debt and making certain restricted payments.
132
Table of Contents
CB RICHARD ELLIS GROUP, INC.
NOTES TO CONSOLIDATED FINANCIAL STATEMENTS—(Continued)
Net interest expense, write-off of financing costs and goodwill and other non-amortizable intangible asset impairment have been expensed in the segment incurred. Provision (benefit) for income taxes has been allocated among our segments by using applicable U.S. and foreign effective tax rates. EBITDA for our segments is calculated as follows (dollars in thousands):
| Year Ended December 31, | ||||||||||||
| 2009 | 2008 | 2007 | ||||||||||
| Americas |
||||||||||||
| Net income (loss) attributable to CB Richard Ellis Group, Inc. |
$ | 4,121 | $ | (660,394 | ) | $ | 114,045 | |||||
| Add: |
||||||||||||
| Depreciation and amortization |
56,883 | 59,871 | 77,076 | |||||||||
| Goodwill and other non-amortizable intangible asset impairment |
— | 805,190 | — | |||||||||
| Interest expense |
157,619 | 129,716 | 141,070 | |||||||||
| Write-off of financing costs |
29,255 | — | — | |||||||||
| Royalty and management service income |
(19,280 | ) | (23,444 | ) | (24,050 | ) | ||||||
| Provision for income taxes |
23,705 | 40,988 | 71,630 | |||||||||
| Less: |
||||||||||||
| Interest income |
4,065 | 6,684 | 14,767 | |||||||||
| EBITDA |
$ | 248,238 | $ | 345,243 | $ | 365,004 | ||||||
| EMEA |
||||||||||||
| Net income (loss) attributable to CB Richard Ellis Group, Inc. |
$ | 33,341 | $ | (85,565 | ) | $ | 180,816 | |||||
| Add: |
||||||||||||
| Depreciation and amortization |
11,158 | 13,272 | 12,324 | |||||||||
| Goodwill impairment |
— | 138,631 | — | |||||||||
| Interest expense |
1,172 | 3,964 | 835 | |||||||||
| Royalty and management service expense |
13,401 | 14,147 | 17,290 | |||||||||
| Provision for income taxes |
7,861 | 24,686 | 61,299 | |||||||||
| Less: |
||||||||||||
| Interest income |
388 | 3,661 | 11,365 | |||||||||
| EBITDA |
$ | 66,545 | $ | 105,474 | $ | 261,199 | ||||||
| Asia Pacific |
||||||||||||
| Net income attributable to CB Richard Ellis Group, Inc. |
$ | 29,131 | $ | 10,334 | $ | 43,778 | ||||||
| Add: |
||||||||||||
| Depreciation and amortization |
8,726 | 9,079 | 6,489 | |||||||||
| Interest expense |
2,979 | 5,446 | 3,448 | |||||||||
| Royalty and management service expense |
4,969 | 8,087 | 5,511 | |||||||||
| Provision for income taxes |
8,625 | 16,262 | 24,157 | |||||||||
| Less: |
||||||||||||
| Interest income |
530 | 851 | 608 | |||||||||
| EBITDA |
$ | 53,900 | $ | 48,357 | $ | 82,775 | ||||||
| Global Investment Management |
||||||||||||
| Net (loss) income attributable to CB Richard Ellis Group, Inc. |
$ | (7,518 | ) | $ | (60,536 | ) | $ | 63,357 | ||||
| Add: |
||||||||||||
| Depreciation and amortization |
4,901 | 4,182 | 2,798 | |||||||||
| Goodwill impairment |
— | 44,922 | — | |||||||||
| Interest expense |
4,289 | 2,495 | 3,600 | |||||||||
| Royalty and management service expense |
910 | 1,210 | 1,249 | |||||||||
| Provision for income taxes |
2,031 | 1,124 | 43,400 | |||||||||
| Less: |
||||||||||||
| Interest income |
501 | 1,012 | 1,336 | |||||||||
| EBITDA |
$ | 4,112 | $ | (7,615 | ) | $ | 113,068 | |||||
| Development Services |
||||||||||||
| Net loss attributable to CB Richard Ellis Group, Inc. |
$ | (25,734 | ) | $ | (215,905 | ) | $ | (11,491 | ) | |||
| Add: |
||||||||||||
| Depreciation and amortization (1) |
17,805 | 16,505 | 15,007 | |||||||||
| Goodwill and other non-amortizable intangible asset impairment |
— | 170,663 | — | |||||||||
| Interest expense (2) |
23,087 | 26,184 | 20,447 | |||||||||
| Benefit of income taxes (3) |
(15,229 | ) | (26,207 | ) | (6,231 | ) | ||||||
| Less: |
||||||||||||
| Interest income (4) |
645 | 5,678 | 5,514 | |||||||||
| EBITDA (5) |
$ | (716 | ) | $ | (34,438 | ) | $ | 12,218 | ||||
133
Table of Contents
CB RICHARD ELLIS GROUP, INC.
NOTES TO CONSOLIDATED FINANCIAL STATEMENTS—(Continued)
| (1) | Includes depreciation and amortization related to discontinued operations of $0.1 million and $0.4 million for the years ended December 31, 2008 and 2007, respectively. |
| (2) | Includes interest expense related to discontinued operations of $0.6 million and $1.8 million for the years ended December 31, 2008 and 2007, respectively. |
| (3) | Includes provision for income taxes related to discontinued operations of $6.0 million and $1.6 million for the years ended December 31, 2008 and 2007, respectively. |
| (4) | Includes interest income related to discontinued operations of $0.1 million and $0.01 million for the years ended December 31, 2008 and 2007, respectively. |
| (5) | Includes EBITDA related to discontinued operations of $16.9 million and $6.5 million for the years ended December 31, 2008 and 2007, respectively. |
| Year Ended December 31, | |||||||||
| 2009 | 2008 | 2007 | |||||||
| (Dollars in thousands) | |||||||||
| Capital expenditures |
|||||||||
| Americas |
$ | 17,868 | $ | 28,811 | $ | 62,045 | |||
| EMEA |
3,825 | 9,522 | 13,295 | ||||||
| Asia Pacific |
2,805 | 9,563 | 11,401 | ||||||
| Global Investment Management |
3,502 | 3,264 | 4,156 | ||||||
| Development Services |
200 | 311 | 2,058 | ||||||
| $ | 28,200 | $ | 51,471 | $ | 92,955 | ||||
| December 31, | ||||||
| 2009 | 2008 | |||||
| (Dollars in thousands) | ||||||
| Identifiable assets |
||||||
| Americas |
$ | 2,186,777 | $ | 2,288,560 | ||
| EMEA |
746,275 | 688,891 | ||||
| Asia Pacific |
297,577 | 257,244 | ||||
| Global Investment Management |
250,433 | 225,760 | ||||
| Development Services |
738,062 | 914,883 | ||||
| Corporate |
820,282 | 351,076 | ||||
| $ | 5,039,406 | $ | 4,726,414 | |||
Identifiable assets by industry segment are those assets used in our operations in each segment. Corporate identifiable assets include cash and cash equivalents and net deferred tax assets.
| December 31, | ||||||
| 2009 | 2008 | |||||
| (Dollars in thousands) | ||||||
| Investments in unconsolidated subsidiaries |
||||||
| Americas |
$ | 20,323 | $ | 19,423 | ||
| EMEA |
1,203 | 1,345 | ||||
| Asia Pacific |
15 | 249 | ||||
| Global Investment Management |
83,010 | 71,648 | ||||
| Development Services |
31,045 | 53,061 | ||||
| $ | 135,596 | $ | 145,726 | |||
134
Table of Contents
CB RICHARD ELLIS GROUP, INC.
NOTES TO CONSOLIDATED FINANCIAL STATEMENTS—(Continued)
Geographic Information:
| Year ended December 31, | |||||||||
| 2009 | 2008 | 2007 | |||||||
| (Dollars in thousands) | |||||||||
| Revenue |
|||||||||
| U.S. |
$ | 2,533,371 | $ | 3,110,043 | $ | 3,787,978 | |||
| U.K. |
392,319 | 521,074 | 687,776 | ||||||
| All other countries |
1,240,130 | 1,497,700 | 1,558,495 | ||||||
| $ | 4,165,820 | $ | 5,128,817 | $ | 6,034,249 | ||||
The revenue shown in the table above is allocated based upon the country in which services are performed.
| December 31, | ||||||
| 2009 | 2008 | |||||
| (Dollars in thousands) | ||||||
| Long-lived assets |
||||||
| U.S. |
$ | 108,261 | $ | 127,679 | ||
| U.K. |
18,314 | 17,663 | ||||
| All other countries |
52,400 | 62,634 | ||||
| $ | 178,975 | $ | 207,976 | |||
The long-lived assets shown in the table above include net property and equipment.
24. Related Party Transactions
Included in prepaid expenses, other current assets and other long-term assets, net in the accompanying consolidated balance sheets are loans to related parties, primarily employees, of $59.4 million and $70.8 million as of December 31, 2009 and 2008, respectively. The majority of these loans represent sign-on and retention bonuses issued or assumed in connection with acquisitions as well as prepaid retention and recruitment awards issued to employees. These loans are at varying principal amounts, bear interest at rates up to 9.75% per annum and mature on various dates through 2014.
From time to time, directors and executive officers are given an opportunity to invest in investment vehicles managed by certain of our subsidiaries on the same terms as other unaffiliated investors. Bradford Freeman, Frederic Malek and Ray Wirta, three of our directors, committed to invest $5.0 million, $2.0 million and $1.0 million, respectively, and Blum Family Partners, L.P., a significant stockholder affiliated with Richard Blum, our Chairman of the board of directors, committed to invest $1.5 million, in CB Richard Ellis Strategic Partners IV, L.P. (through pooled co-investment vehicles organized for the investment of certain employees). As of December 31, 2008, Mr. Freeman, Mr. Malek, Blum Family Partners, L.P. and Mr. Wirta had fully funded their respective commitments in this investment. CB Richard Ellis Strategic Partners IV, L.P. fund is a closed-end real estate investment fund managed and sponsored by our subsidiary, CBRE Investors. Each of these investments had been approved by our board of directors, including all of the disinterested members.
Bob Sulentic, an executive officer, has committed to invest a minimum of $0.8 million in Trammell Crow Company Acquisitions I, L.P., and Trammell Crow Company Acquisitions II, L.P. (through pooled co-investment vehicles organized for the investment of certain employees). As of December 31, 2009,
135
Table of Contents
CB RICHARD ELLIS GROUP, INC.
NOTES TO CONSOLIDATED FINANCIAL STATEMENTS—(Continued)
Mr. Sulentic had funded $0.7 million of his commitment in these investments. These funds are closed-end real estate investment funds managed and sponsored by our subsidiary, Trammell Crow Company. These investments have been approved by our board of directors, including all of the disinterested members.
25. Guarantor and Nonguarantor Financial Statements
The following condensed consolidating financial information includes:
(1) Condensed consolidating balance sheets as of December 31, 2009 and 2008; condensed consolidating statements of operations for the years ended December 31, 2009, 2008 and 2007; and condensed consolidating statements of cash flows for the years ended December 31, 2009, 2008 and 2007, of (a) CB Richard Ellis Group as the parent, (b) CBRE as the subsidiary issuer, (c) the guarantor subsidiaries, (d) the nonguarantor subsidiaries and (e) CB Richard Ellis Group, Inc. on a consolidated basis; and
(2) Elimination entries necessary to consolidate CB Richard Ellis Group as the parent, with CBRE and its guarantor and nonguarantor subsidiaries.
Investments in consolidated subsidiaries are presented using the equity method of accounting. The principal elimination entries eliminate investments in consolidated subsidiaries and intercompany balances and transactions.
136
Table of Contents
CB RICHARD ELLIS GROUP, INC.
NOTES TO CONSOLIDATED FINANCIAL STATEMENTS—(Continued)
CONDENSED CONSOLIDATING BALANCE SHEET
AS OF DECEMBER 31, 2009
(Dollars in thousands)
| Parent | CBRE | Guarantor Subsidiaries |
Nonguarantor Subsidiaries |
Elimination | Consolidated Total | ||||||||||||||
| Current Assets: |
|||||||||||||||||||
| Cash and cash equivalents |
$ | 4 | $ | 242,586 | $ | 283,251 | $ | 215,716 | $ | — | $ | 741,557 | |||||||
| Restricted cash |
— | — | 13,786 | 33,011 | — | 46,797 | |||||||||||||
| Receivables, net |
— | 2 | 297,717 | 478,210 | — | 775,929 | |||||||||||||
| Warehouse receivables (a) |
— | — | 315,033 | — | — | 315,033 | |||||||||||||
| Income taxes receivable |
14,062 | 171,549 | — | 23,046 | (45,625 | ) | 163,032 | ||||||||||||
| Prepaid expenses |
— | — | 44,148 | 55,161 | — | 99,309 | |||||||||||||
| Deferred tax assets, net |
— | — | 54,183 | 21,147 | — | 75,330 | |||||||||||||
| Real estate and other assets held for sale |
— | — | — | 7,109 | — | 7,109 | |||||||||||||
| Available for sale securities |
— | — | 865 | — | — | 865 | |||||||||||||
| Other current assets |
— | 4,660 | 25,371 | 11,733 | — | 41,764 | |||||||||||||
| Total Current Assets |
14,066 | 418,797 | 1,034,354 | 845,133 | (45,625 | ) | 2,266,725 | ||||||||||||
| Property and equipment, net |
— | — | 106,488 | 72,487 | — | 178,975 | |||||||||||||
| Goodwill |
— | — | 797,142 | 509,230 | — | 1,306,372 | |||||||||||||
| Other intangible assets, net |
— | — | 293,886 | 29,018 | — | 322,904 | |||||||||||||
| Investments in unconsolidated subsidiaries |
— | — | 68,144 | 67,452 | — | 135,596 | |||||||||||||
| Investments in consolidated subsidiaries |
811,588 | 2,535,355 | 903,699 | — | (4,250,642 | ) | — | ||||||||||||
| Intercompany loan receivable |
— | — | 635,000 | 47,271 | (682,271 | ) | — | ||||||||||||
| Deferred tax assets, net |
— | — | — | 34,162 | (30,767 | ) | 3,395 | ||||||||||||
| Real estate under development |
— | — | — | 160,164 | — | 160,164 | |||||||||||||
| Real estate held for investment |
— | — | 4,680 | 521,489 | — | 526,169 | |||||||||||||
| Available for sale securities |
— | — | 31,796 | 220 | — | 32,016 | |||||||||||||
| Other assets, net |
— | 25,914 | 40,671 | 40,505 | — | 107,090 | |||||||||||||
| Total Assets |
$ | 825,654 | $ | 2,980,066 | $ | 3,915,860 | $ | 2,327,131 | $ | (5,009,305 | ) | $ | 5,039,406 | ||||||
| Current Liabilities: |
|||||||||||||||||||
| Accounts payable and accrued expenses |
$ | — | $ | 5,905 | $ | 126,319 | $ | 326,286 | $ | — | $ | 458,510 | |||||||
| Compensation and employee benefits payable |
— | 626 | 118,310 | 121,600 | — | 240,536 | |||||||||||||
| Accrued bonus and profit sharing |
— | — | 128,133 | 150,311 | — | 278,444 | |||||||||||||
| Income taxes payable |
— | — | 45,625 | — | (45,625 | ) | — | ||||||||||||
| Short-term borrowings: |
|||||||||||||||||||
| Warehouse lines of credit (a) |
— | — | 312,872 | — | — | 312,872 | |||||||||||||
| Revolving credit facility |
— | 10,501 | — | 10,549 | — | 21,050 | |||||||||||||
| Other |
— | — | 350 | 5,500 | — | 5,850 | |||||||||||||
| Total short-term borrowings |
— | 10,501 | 313,222 | 16,049 | — | 339,772 | |||||||||||||
| Current maturities of long-term debt |
— | 138,120 | 232 | 330 | — | 138,682 | |||||||||||||
| Notes payable on real estate |
— | — | — | 159,921 | — | 159,921 | |||||||||||||
| Liabilities related to real estate and other assets held for sale |
— | — | — | 1,267 | — | 1,267 | |||||||||||||
| Other current liabilities |
1,190 | — | 8,946 | 1,773 | — | 11,909 | |||||||||||||
| Total Current Liabilities |
1,190 | 155,152 | 740,787 | 777,537 | (45,625 | ) | 1,629,041 | ||||||||||||
| Long-Term Debt: |
|||||||||||||||||||
| Senior secured term loans |
— | 1,545,490 | — | — | — | 1,545,490 | |||||||||||||
| 11.625% senior subordinated notes, net |
— | 436,502 | — | — | — | 436,502 | |||||||||||||
| Other long-term debt |
— | — | — | 129 | — | 129 | |||||||||||||
| Intercompany loan payable |
195,342 | 31,334 | 455,595 | — | (682,271 | ) | — | ||||||||||||
| Total Long-Term Debt |
195,342 | 2,013,326 | 455,595 | 129 | (682,271 | ) | 1,982,121 | ||||||||||||
| Deferred tax liabilities, net |
— | — | 30,767 | — | (30,767 | ) | — | ||||||||||||
| Pension liability |
— | — | — | 64,945 | — | 64,945 | |||||||||||||
| Non-current tax liabilities |
— | — | 73,462 | — | — | 73,462 | |||||||||||||
| Notes payable on real estate |
— | — | — | 390,181 | — | 390,181 | |||||||||||||
| Other liabilities |
— | — | 79,894 | 35,467 | — | 115,361 | |||||||||||||
| Total Liabilities |
196,532 | 2,168,478 | 1,380,505 | 1,268,259 | (758,663 | ) | 4,255,111 | ||||||||||||
| Commitments and contingencies |
— | — | — | — | — | — | |||||||||||||
| Equity: |
|||||||||||||||||||
| CB Richard Ellis Group, Inc. Stockholders’ Equity |
629,122 | 811,588 | 2,535,355 | 903,699 | (4,250,642 | ) | 629,122 | ||||||||||||
| Non-controlling interests |
— | — | — | 155,173 | — | 155,173 | |||||||||||||
| Total Equity |
629,122 | 811,588 | 2,535,355 | 1,058,872 | (4,250,642 | ) | 784,295 | ||||||||||||
| Total Liabilities and Equity |
$ | 825,654 | $ | 2,980,066 | $ | 3,915,860 | $ | 2,327,131 | $ | (5,009,305 | ) | $ | 5,039,406 | ||||||
| (a) | Although CBRE Capital Markets is included among our domestic subsidiaries, which jointly and severally guarantee our 11.625% senior subordinated notes and our Credit Agreement, a substantial majority of warehouse receivables funded under the JP Morgan, BofA and the Fannie Mae ASAP lines of credit are pledged to JP Morgan, BofA and Fannie Mae, and accordingly, are not included as collateral for these notes or our other outstanding debt. |
137
Table of Contents
CB RICHARD ELLIS GROUP, INC.
NOTES TO CONSOLIDATED FINANCIAL STATEMENTS—(Continued)
CONDENSED CONSOLIDATING BALANCE SHEET
AS OF DECEMBER 31, 2008
(Dollars in thousands)
| Parent | CBRE | Guarantor Subsidiaries |
Nonguarantor Subsidiaries |
Elimination | Consolidated Total | ||||||||||||||
| Current Assets: |
|||||||||||||||||||
| Cash and cash equivalents |
$ | 4 | $ | 7,203 | $ | 9,467 | $ | 142,149 | $ | — | $ | 158,823 | |||||||
| Restricted cash |
— | — | 11,313 | 25,009 | — | 36,322 | |||||||||||||
| Receivables, net |
— | — | 341,037 | 410,903 | — | 751,940 | |||||||||||||
| Warehouse receivables (a) |
— | — | 210,473 | — | — | 210,473 | |||||||||||||
| Deferred compensation assets |
— | 225,704 | — | — | — | 225,704 | |||||||||||||
| Income taxes receivable |
11,146 | 48,339 | 42,275 | 15,960 | — | 117,720 | |||||||||||||
| Prepaid expenses |
— | — | 46,494 | 47,788 | — | 94,282 | |||||||||||||
| Deferred tax assets, net |
— | 97,059 | 30,266 | 20,445 | — | 147,770 | |||||||||||||
| Real estate under development |
— | — | — | 56,322 | — | 56,322 | |||||||||||||
| Real estate and other assets held for sale |
— | — | 172 | 40,262 | — | 40,434 | |||||||||||||
| Available for sale securities |
— | — | 237 | — | — | 237 | |||||||||||||
| Other current assets |
— | — | 26,832 | 48,674 | — | 75,506 | |||||||||||||
| Total Current Assets |
11,150 | 378,305 | 718,566 | 807,512 | — | 1,915,533 | |||||||||||||
| Property and equipment, net |
— | — | 127,436 | 80,540 | — | 207,976 | |||||||||||||
| Goodwill |
— | — | 799,591 | 452,232 | — | 1,251,823 | |||||||||||||
| Other intangible assets, net |
— | — | 283,715 | 27,732 | — | 311,447 | |||||||||||||
| Investments in unconsolidated subsidiaries |
— | — | 99,792 | 45,934 | — | 145,726 | |||||||||||||
| Investments in consolidated subsidiaries |
763,426 | 2,424,837 | 772,762 | — | (3,961,025 | ) | — | ||||||||||||
| Intercompany loan receivable |
— | 274,458 | 635,000 | 63,208 | (972,666 | ) | — | ||||||||||||
| Deferred tax assets, net |
— | — | 18,874 | 25,609 | — | 44,483 | |||||||||||||
| Real estate under development |
— | — | — | 158,090 | — | 158,090 | |||||||||||||
| Real estate held for investment |
— | — | 4,612 | 531,367 | — | 535,979 | |||||||||||||
| Available for sale securities |
— | — | 28,569 | 225 | — | 28,794 | |||||||||||||
| Other assets, net |
— | 26,674 | 60,806 | 39,083 | — | 126,563 | |||||||||||||
| Total Assets |
$ | 774,576 | $ | 3,104,274 | $ | 3,549,723 | $ | 2,231,532 | $ | (4,933,691 | ) | $ | 4,726,414 | ||||||
| Current Liabilities: |
|||||||||||||||||||
| Accounts payable and accrued expenses |
$ | — | $ | 3,826 | $ | 152,938 | $ | 243,113 | $ | — | $ | 399,877 | |||||||
| Compensation and employee benefits payable |
— | — | 138,224 | 117,184 | — | 255,408 | |||||||||||||
| Accrued bonus and profit sharing |
— | — | 136,416 | 158,803 | — | 295,219 | |||||||||||||
| Deferred compensation liabilities |
— | 239,464 | — | — | — | 239,464 | |||||||||||||
| Short-term borrowings: |
|||||||||||||||||||
| Warehouse lines of credit (a) |
— | — | 210,473 | — | — | 210,473 | |||||||||||||
| Revolving credit facility |
— | — | — | 25,765 | — | 25,765 | |||||||||||||
| Other |
— | — | 1,827 | 8,000 | — | 9,827 | |||||||||||||
| Total short-term borrowings |
— | — | 212,300 | 33,765 | — | 246,065 | |||||||||||||
| Current maturities of long-term debt |
— | 208,550 | 805 | 1,307 | — | 210,662 | |||||||||||||
| Notes payable on real estate |
— | — | — | 176,372 | — | 176,372 | |||||||||||||
| Liabilities related to real estate and other assets held for sale |
— | — | — | 22,740 | — | 22,740 | |||||||||||||
| Other current liabilities |
234 | 18,348 | 6,862 | 1,594 | — | 27,038 | |||||||||||||
| Total Current Liabilities |
234 | 470,188 | 647,545 | 754,878 | — | 1,872,845 | |||||||||||||
| Long-Term Debt: |
|||||||||||||||||||
| Senior secured term loans |
— | 1,865,200 | — | — | — | 1,865,200 | |||||||||||||
| Other long-term debt |
— | — | 788 | 771 | — | 1,559 | |||||||||||||
| Intercompany loan payable |
659,656 | — | 313,010 | — | (972,666 | ) | — | ||||||||||||
| Total Long-Term Debt |
659,656 | 1,865,200 | 313,798 | 771 | (972,666 | ) | 1,866,759 | ||||||||||||
| Pension liability |
— | — | — | 19,802 | — | 19,802 | |||||||||||||
| Non-current tax liabilities |
— | — | 77,460 | 1,245 | — | 78,705 | |||||||||||||
| Notes payable on real estate |
— | — | — | 420,242 | — | 420,242 | |||||||||||||
| Other liabilities |
— | 5,460 | 86,083 | 30,795 | — | 122,338 | |||||||||||||
| Total Liabilities |
659,890 | 2,340,848 | 1,124,886 | 1,227,733 | (972,666 | ) | 4,380,691 | ||||||||||||
| Commitments and contingencies |
— | — | — | — | — | — | |||||||||||||
| Equity: |
|||||||||||||||||||
| CB Richard Ellis Group, Inc. Stockholders’ Equity |
114,686 | 763,426 | 2,424,837 | 772,762 | (3,961,025 | ) | 114,686 | ||||||||||||
| Non-controlling interests |
— | — | — | 231,037 | — | 231,037 | |||||||||||||
| Total Equity |
114,686 | 763,426 | 2,424,837 | 1,003,799 | (3,961,025 | ) | 345,723 | ||||||||||||
| Total Liabilities and Equity |
$ | 774,576 | $ | 3,104,274 | $ | 3,549,723 | $ | 2,231,532 | $ | (4,933,691 | ) | $ | 4,726,414 | ||||||
| (a) | Although CBRE Capital Markets is included among our domestic subsidiaries, which jointly and severally guarantee our Credit Agreement, all warehouse receivables funded under the BofA, JP Morgan and Red Capital lines of credit are pledged to BofA, JP Morgan and Red Capital, and accordingly, are not included as collateral for these notes or our other outstanding debt. |
138
Table of Contents
CB RICHARD ELLIS GROUP, INC.
NOTES TO CONSOLIDATED FINANCIAL STATEMENTS—(Continued)
CONDENSED CONSOLIDATING STATEMENT OF OPERATIONS
FOR THE YEAR ENDED DECEMBER 31, 2009
(Dollars in thousands)
| Parent | CBRE | Guarantor Subsidiaries |
Nonguarantor Subsidiaries |
Elimination | Consolidated Total |
|||||||||||||||||||
| Revenue |
$ | — | $ | — | $ | 2,472,685 | $ | 1,693,135 | $ | — | $ | 4,165,820 | ||||||||||||
| Costs and expenses: |
||||||||||||||||||||||||
| Cost of services |
— | — | 1,519,705 | 928,180 | — | 2,447,885 | ||||||||||||||||||
| Operating, administrative and other |
35,437 | 6,938 | 714,558 | 626,646 | — | 1,383,579 | ||||||||||||||||||
| Depreciation and amortization |
— | — | 54,806 | 44,667 | — | 99,473 | ||||||||||||||||||
| Total costs and expenses |
35,437 | 6,938 | 2,289,069 | 1,599,493 | — | 3,930,937 | ||||||||||||||||||
| Gain on disposition of real estate |
— | — | — | 6,959 | — | 6,959 | ||||||||||||||||||
| Operating (loss) income |
(35,437 | ) | (6,938 | ) | 183,616 | 100,601 | — | 241,842 | ||||||||||||||||
| Equity loss from unconsolidated subsidiaries |
— | — | (21,249 | ) | (12,846 | ) | — | (34,095 | ) | |||||||||||||||
| Other income |
— | 3,880 | — | — | — | 3,880 | ||||||||||||||||||
| Interest income |
— | 48 | 4,665 | 3,067 | (1,651 | ) | 6,129 | |||||||||||||||||
| Interest expense |
— | 158,964 | 1,041 | 30,792 | (1,651 | ) | 189,146 | |||||||||||||||||
| Write-off of financing costs |
— | 29,255 | — | — | — | 29,255 | ||||||||||||||||||
| Royalty and management service (income) expense |
— | — | (22,340 | ) | 22,340 | — | — | |||||||||||||||||
| Income from consolidated subsidiaries |
54,717 | 170,756 | 71,876 | — | (297,349 | ) | — | |||||||||||||||||
| Income before (benefit) provision for income taxes |
19,280 | (20,473 | ) | 260,207 | 37,690 | (297,349 | ) | (645 | ) | |||||||||||||||
| (Benefit) provision for income taxes |
(14,061 | ) | (75,190 | ) | 89,451 | 26,793 | — | 26,993 | ||||||||||||||||
| Net income |
33,341 | 54,717 | 170,756 | 10,897 | (297,349 | ) | (27,638 | ) | ||||||||||||||||
| Less: Net loss attributable to non-controlling interests |
— | — | — | (60,979 | ) | — | (60,979 | ) | ||||||||||||||||
| Net income attributable to CB Richard Ellis Group, Inc. |
$ | 33,341 | $ | 54,717 | $ | 170,756 | $ | 71,876 | $ | (297,349 | ) | $ | 33,341 | |||||||||||
139
Table of Contents
CB RICHARD ELLIS GROUP, INC.
NOTES TO CONSOLIDATED FINANCIAL STATEMENTS—(Continued)
CONDENSED CONSOLIDATING STATEMENT OF OPERATIONS
FOR THE YEAR ENDED DECEMBER 31, 2008
(Dollars in thousands)
| Parent | CBRE | Guarantor Subsidiaries |
Nonguarantor Subsidiaries |
Elimination | Consolidated Total |
|||||||||||||||||||
| Revenue |
$ | — | $ | — | $ | 3,060,127 | $ | 2,068,690 | $ | — | $ | 5,128,817 | ||||||||||||
| Costs and expenses: |
||||||||||||||||||||||||
| Cost of services |
— | — | 1,820,243 | 1,106,478 | — | 2,926,721 | ||||||||||||||||||
| Operating, administrative and other |
27,507 | 4,116 | 905,936 | 809,523 | — | 1,747,082 | ||||||||||||||||||
| Depreciation and amortization |
— | — | 55,870 | 46,947 | — | 102,817 | ||||||||||||||||||
| Goodwill and other non-amortizable intangible asset impairment |
— | — | 1,012,449 | 146,957 | — | 1,159,406 | ||||||||||||||||||
| Total costs and expenses |
27,507 | 4,116 | 3,794,498 | 2,109,905 | — | 5,936,026 | ||||||||||||||||||
| Gain on disposition of real estate |
— | — | 1,331 | 17,409 | — | 18,740 | ||||||||||||||||||
| Operating loss |
(27,507 | ) | (4,116 | ) | (733,040 | ) | (23,806 | ) | — | (788,469 | ) | |||||||||||||
| Equity loss from unconsolidated subsidiaries |
— | — | (44,597 | ) | (35,533 | ) | — | (80,130 | ) | |||||||||||||||
| Other loss |
— | — | — | (7,686 | ) | — | (7,686 | ) | ||||||||||||||||
| Interest income |
2 | 2,254 | 10,392 | 8,884 | (3,770 | ) | 17,762 | |||||||||||||||||
| Interest expense |
382 | 133,005 | 3,323 | 34,216 | (3,770 | ) | 167,156 | |||||||||||||||||
| Royalty and management service (income) expense |
— | — | (27,919 | ) | 27,919 | — | — | |||||||||||||||||
| Loss from consolidated subsidiaries |
(995,325 | ) | (890,329 | ) | (92,890 | ) | — | 1,978,544 | — | |||||||||||||||
| Loss from continuing operations before (benefit) provision for income taxes |
(1,023,212 | ) | (1,025,196 | ) | (835,539 | ) | (120,276 | ) | 1,978,544 | (1,025,679 | ) | |||||||||||||
| (Benefit) provision for income taxes |
(11,146 | ) | (29,871 | ) | 54,790 | 37,037 | — | 50,810 | ||||||||||||||||
| Net loss from continuing operations |
(1,012,066 | ) | (995,325 | ) | (890,329 | ) | (157,313 | ) | 1,978,544 | (1,076,489 | ) | |||||||||||||
| Income from discontinued operations, net of income taxes |
— | — | — | 26,748 | — | 26,748 | ||||||||||||||||||
| Net loss |
(1,012,066 | ) | (995,325 | ) | (890,329 | ) | (130,565 | ) | 1,978,544 | (1,049,741 | ) | |||||||||||||
| Less: Net loss attributable to non-controlling interests |
— | — | — | (37,675 | ) | — | (37,675 | ) | ||||||||||||||||
| Net loss attributable to CB Richard Ellis Group, Inc. |
$ | (1,012,066 | ) | $ | (995,325 | ) | $ | (890,329 | ) | $ | (92,890 | ) | $ | 1,978,544 | $ | (1,012,066 | ) | |||||||
140
Table of Contents
CB RICHARD ELLIS GROUP, INC.
NOTES TO CONSOLIDATED FINANCIAL STATEMENTS—(Continued)
CONDENSED CONSOLIDATING STATEMENT OF OPERATIONS
FOR THE YEAR ENDED DECEMBER 31, 2007
(Dollars in thousands)
| Parent | CBRE | Guarantor Subsidiaries |
Nonguarantor Subsidiaries |
Elimination | Consolidated Total |
||||||||||||||||||
| Revenue |
$ | — | $ | — | $ | 3,759,374 | $ | 2,274,875 | $ | — | $ | 6,034,249 | |||||||||||
| Costs and expenses: |
|||||||||||||||||||||||
| Cost of services |
— | — | 2,132,791 | 1,067,927 | — | 3,200,718 | |||||||||||||||||
| Operating, administrative and other |
23,586 | 4,115 | 1,194,096 | 766,861 | — | 1,988,658 | |||||||||||||||||
| Depreciation and amortization |
— | — | 78,092 | 35,177 | — | 113,269 | |||||||||||||||||
| Merger-related charges |
— | — | 55,416 | 1,516 | — | 56,932 | |||||||||||||||||
| Total costs and expenses |
23,586 | 4,115 | 3,460,395 | 1,871,481 | — | 5,359,577 | |||||||||||||||||
| Gain on disposition of real estate |
— | — | 164 | 24,135 | — | 24,299 | |||||||||||||||||
| Operating (loss) income |
(23,586 | ) | (4,115 | ) | 299,143 | 427,529 | — | 698,971 | |||||||||||||||
| Equity income from unconsolidated subsidiaries |
— | — | 60,193 | 4,746 | — | 64,939 | |||||||||||||||||
| Other loss |
— | (3,880 | ) | (33,654 | ) | — | — | (37,534 | ) | ||||||||||||||
| Interest income |
6 | 140 | 17,408 | 14,472 | (3,022 | ) | 29,004 | ||||||||||||||||
| Interest expense |
— | 141,341 | 1,553 | 23,119 | (3,022 | ) | 162,991 | ||||||||||||||||
| Royalty and management service (income) expense |
— | — | (28,346 | ) | 28,346 | — | — | ||||||||||||||||
| Income from consolidated subsidiaries |
404,203 | 484,756 | 273,036 | — | (1,161,995 | ) | — | ||||||||||||||||
| Income from continuing operations before (benefit) provision for income taxes |
380,623 | 335,560 | 642,919 | 395,282 | (1,161,995 | ) | 592,389 | ||||||||||||||||
| (Benefit) provision for income taxes |
(9,882 | ) | (68,643 | ) | 158,163 | 113,005 | — | 192,643 | |||||||||||||||
| Income from continuing operations |
390,505 | 404,203 | 484,756 | 282,277 | (1,161,995 | ) | 399,746 | ||||||||||||||||
| Income from discontinued operations, net of income taxes |
— | — | — | 5,308 | — | 5,308 | |||||||||||||||||
| Net income |
390,505 | 404,203 | 484,756 | 287,585 | (1,161,995 | ) | 405,054 | ||||||||||||||||
| Less: Net income attributable to non-controlling interests |
— | — | — | 14,549 | — | 14,549 | |||||||||||||||||
| Net income attributable to CB Richard Ellis Group, Inc. |
$ | 390,505 | $ | 404,203 | $ | 484,756 | $ | 273,036 | $ | (1,161,995 | ) | $ | 390,505 | ||||||||||
141
Table of Contents
CB RICHARD ELLIS GROUP, INC.
NOTES TO CONSOLIDATED FINANCIAL STATEMENTS—(Continued)
CONDENSED CONSOLIDATING STATEMENT OF CASH FLOWS
FOR THE YEAR ENDED DECEMBER 31, 2009
(Dollars in thousands)
| Parent | CBRE | Guarantor Subsidiaries |
Nonguarantor Subsidiaries |
Consolidated Total |
||||||||||||||||
| CASH FLOWS PROVIDED BY (USED IN) OPERATING ACTIVITIES: |
$ | 13,633 | $ | (131,264 | ) | $ | 263,164 | $ | 68,112 | $ | 213,645 | |||||||||
| CASH FLOWS FROM INVESTING ACTIVITIES: |
||||||||||||||||||||
| Capital expenditures |
— | — | (18,181 | ) | (10,019 | ) | (28,200 | ) | ||||||||||||
| Acquisition of businesses including net assets acquired, intangibles and goodwill |
— | — | (5,762 | ) | (24,908 | ) | (30,670 | ) | ||||||||||||
| Contributions to unconsolidated subsidiaries |
— | — | (9,475 | ) | (37,927 | ) | (47,402 | ) | ||||||||||||
| Distributions from unconsolidated subsidiaries |
— | — | 8,208 | 1,024 | 9,232 | |||||||||||||||
| Proceeds from the sale of servicing rights and other assets |
— | — | 11,901 | 382 | 12,283 | |||||||||||||||
| Additions to real estate held for investment |
— | — | — | (26,656 | ) | (26,656 | ) | |||||||||||||
| Net proceeds from disposition of real estate held for investment |
— | — | — | 3,408 | 3,408 | |||||||||||||||
| Increase in restricted cash |
— | — | (2,474 | ) | (8,069 | ) | (10,543 | ) | ||||||||||||
| Other investing activities, net |
— | — | (814 | ) | — | (814 | ) | |||||||||||||
| Net cash used in investing activities |
— | — | (16,597 | ) | (102,765 | ) | (119,362 | ) | ||||||||||||
| CASH FLOWS FROM FINANCING ACTIVITIES: |
||||||||||||||||||||
| Repayment of senior secured term loans |
— | (432,000 | ) | — | — | (432,000 | ) | |||||||||||||
| Proceeds from revolving credit facility |
— | 793,049 | — | 7,879 | 800,928 | |||||||||||||||
| Repayment of revolving credit facility |
— | (741,646 | ) | — | (31,075 | ) | (772,721 | ) | ||||||||||||
| Proceeds from 11.625% senior subordinated notes, net |
— | 435,928 | — | — | 435,928 | |||||||||||||||
| Proceeds from notes payable on real estate held for investment |
— | — | — | 16,690 | 16,690 | |||||||||||||||
| Repayment of notes payable on real estate held for investment |
— | — | — | (7,185 | ) | (7,185 | ) | |||||||||||||
| Proceeds from notes payable on real estate held for sale and under development |
— | — | — | 63,040 | 63,040 | |||||||||||||||
| Repayment of notes payable on real estate held for sale and under development |
— | — | — | (46,642 | ) | (46,642 | ) | |||||||||||||
| Repayment of short-term borrowings and other loans, net |
— | — | (1,703 | ) | (2,607 | ) | (4,310 | ) | ||||||||||||
| Proceeds from issuance of common stock, net |
440,173 | — | — | — | 440,173 | |||||||||||||||
| Proceeds from exercise of stock options |
15,443 | — | — | — | 15,443 | |||||||||||||||
| Incremental tax benefit from stock options exercised |
1,586 | — | — | — | 1,586 | |||||||||||||||
| Non-controlling interests contributions |
— | — | — | 21,348 | 21,348 | |||||||||||||||
| Non-controlling interests distributions |
— | — | — | (13,496 | ) | (13,496 | ) | |||||||||||||
| Payment of financing costs |
— | (38,269 | ) | — | (1,133 | ) | (39,402 | ) | ||||||||||||
| (Increase) decrease in intercompany receivables, net |
(469,700 | ) | 349,585 | 28,920 | 91,195 | — | ||||||||||||||
| Other financing activities, net |
(1,135 | ) | — | — | (1,477 | ) | (2,612 | ) | ||||||||||||
| Net cash (used in) provided by financing activities |
(13,633 | ) | 366,647 | 27,217 | 96,537 | 476,768 | ||||||||||||||
| Effect of currency exchange rate changes on cash and cash equivalents |
— | — | — | 11,683 | 11,683 | |||||||||||||||
| NET INCREASE IN CASH AND CASH EQUIVALENTS |
— | 235,383 | 273,784 | 73,567 | 582,734 | |||||||||||||||
| CASH AND CASH EQUIVALENTS, AT BEGINNING OF PERIOD |
4 | 7,203 | 9,467 | 142,149 | 158,823 | |||||||||||||||
| CASH AND CASH EQUIVALENTS, AT END OF PERIOD |
$ | 4 | $ | 242,586 | $ | 283,251 | $ | 215,716 | $ | 741,557 | ||||||||||
| SUPPLEMENTAL DISCLOSURES OF CASH FLOW INFORMATION: |
||||||||||||||||||||
| Cash paid (received) during the period for: |
||||||||||||||||||||
| Interest |
$ | — | $ | 149,565 | $ | 98 | $ | 18,914 | $ | 168,577 | ||||||||||
| Income tax (refunds) payments, net |
$ | (2,126 | ) | $ | (9,221 | ) | $ | (60,967 | ) | $ | 23,959 | $ | (48,355 | ) | ||||||
142
Table of Contents
CB RICHARD ELLIS GROUP, INC.
NOTES TO CONSOLIDATED FINANCIAL STATEMENTS—(Continued)
CONDENSED CONSOLIDATING STATEMENT OF CASH FLOWS
FOR THE YEAR ENDED DECEMBER 31, 2008
(Dollars in thousands)
| Parent | CBRE | Guarantor Subsidiaries |
Nonguarantor Subsidiaries |
Consolidated Total |
||||||||||||||||
| CASH FLOWS PROVIDED BY (USED IN) OPERATING ACTIVITIES: |
$ | 11,615 | $ | (83,799 | ) | $ | (28,504 | ) | $ | (29,685 | ) | $ | (130,373 | ) | ||||||
| CASH FLOWS FROM INVESTING ACTIVITIES: |
||||||||||||||||||||
| Capital expenditures |
— | — | (28,160 | ) | (23,311 | ) | (51,471 | ) | ||||||||||||
| Acquisition of businesses including net assets acquired, intangibles and goodwill, net of cash acquired |
— | — | (35,336 | ) | (204,590 | ) | (239,926 | ) | ||||||||||||
| Contributions to unconsolidated subsidiaries |
— | — | (28,723 | ) | (27,627 | ) | (56,350 | ) | ||||||||||||
| Distributions from unconsolidated subsidiaries |
— | — | 21,647 | 3,797 | 25,444 | |||||||||||||||
| Proceeds from the sale of servicing rights and other assets |
— | — | 28,662 | 494 | 29,156 | |||||||||||||||
| Additions to real estate held for investment |
— | — | — | (128,487 | ) | (128,487 | ) | |||||||||||||
| (Increase) decrease in restricted cash |
— | — | (1,218 | ) | 7,191 | 5,973 | ||||||||||||||
| Other investing activities, net |
— | 120 | (3,468 | ) | — | (3,348 | ) | |||||||||||||
| Net cash provided by (used in) investing activities |
— | 120 | (46,596 | ) | (372,533 | ) | (419,009 | ) | ||||||||||||
| CASH FLOWS FROM FINANCING ACTIVITIES: |
||||||||||||||||||||
| Proceeds from senior secured term loans |
— | 300,000 | — | — | 300,000 | |||||||||||||||
| Repayment of senior secured term loans |
— | (13,250 | ) | — | — | (13,250 | ) | |||||||||||||
| Proceeds from revolving credit facility |
— | 1,915,860 | — | 108,902 | 2,024,762 | |||||||||||||||
| Repayment of revolving credit facility |
— | (2,109,860 | ) | — | (98,785 | ) | (2,208,645 | ) | ||||||||||||
| Proceeds from notes payable on real estate held for investment |
— | — | — | 115,676 | 115,676 | |||||||||||||||
| Repayment of notes payable on real estate held for investment |
— | — | — | (16,427 | ) | (16,427 | ) | |||||||||||||
| Proceeds from notes payable on real estate held for sale and under development |
— | — | — | 144,296 | 144,296 | |||||||||||||||
| Repayment of notes payable on real estate held for sale and under development |
— | — | — | (142,222 | ) | (142,222 | ) | |||||||||||||
| Repayment of short-term borrowings and other loans, net |
— | — | (9,304 | ) | (35,259 | ) | (44,563 | ) | ||||||||||||
| Proceeds from issuance of common stock, net |
206,700 | — | — | — | 206,700 | |||||||||||||||
| Proceeds from exercise of stock options |
4,026 | — | — | — | 4,026 | |||||||||||||||
| Incremental tax benefit from stock options exercised |
4,294 | — | — | — | 4,294 | |||||||||||||||
| Non-controlling interests contributions |
— | — | — | 48,533 | 48,533 | |||||||||||||||
| Non-controlling interests distributions |
— | — | — | (37,646 | ) | (37,646 | ) | |||||||||||||
| Payment of financing costs |
— | (6,226 | ) | — | (4,667 | ) | (10,893 | ) | ||||||||||||
| (Increase) decrease in intercompany receivables, net |
(227,829 | ) | (14,090 | ) | 106,078 | 135,841 | — | |||||||||||||
| Other financing activities, net |
1,195 | — | — | (1,877 | ) | (682 | ) | |||||||||||||
| Net cash (used in) provided by financing activities |
(11,614 | ) | 72,434 | 96,774 | 216,365 | 373,959 | ||||||||||||||
| Effect of currency exchange rate changes on cash and cash equivalents |
— | — | — | (8,628 | ) | (8,628 | ) | |||||||||||||
| NET INCREASE (DECREASE) IN CASH AND CASH EQUIVALENTS |
1 | (11,245 | ) | 21,674 | (194,481 | ) | (184,051 | ) | ||||||||||||
| CASH AND CASH EQUIVALENTS, AT BEGINNING OF PERIOD |
3 | 18,448 | (12,207 | ) | 336,630 | 342,874 | ||||||||||||||
| CASH AND CASH EQUIVALENTS, AT END OF PERIOD |
$ | 4 | $ | 7,203 | $ | 9,467 | $ | 142,149 | $ | 158,823 | ||||||||||
| SUPPLEMENTAL DISCLOSURES OF CASH FLOW INFORMATION: |
||||||||||||||||||||
| Cash paid during the period for: |
||||||||||||||||||||
| Interest |
$ | — | $ | 126,051 | $ | 934 | $ | 21,841 | $ | 148,826 | ||||||||||
| Income tax payments, net |
$ | — | $ | — | $ | 92,931 | $ | 104,422 | $ | 197,353 | ||||||||||
143
Table of Contents
CB RICHARD ELLIS GROUP, INC.
NOTES TO CONSOLIDATED FINANCIAL STATEMENTS—(Continued)
CONDENSED CONSOLIDATING STATEMENT OF CASH FLOWS
FOR THE YEAR ENDED DECEMBER 31, 2007
(Dollars in thousands)
| Parent | CBRE | Guarantor Subsidiaries |
Nonguarantor Subsidiaries |
Consolidated Total |
||||||||||||||||
| CASH FLOWS PROVIDED BY (USED IN) OPERATING ACTIVITIES: |
$ | 16,643 | $ | (132,428 | ) | $ | 583,396 | $ | 180,599 | $ | 648,210 | |||||||||
| CASH FLOWS FROM INVESTING ACTIVITIES: |
||||||||||||||||||||
| Capital expenditures |
— | — | (60,557 | ) | (32,398 | ) | (92,955 | ) | ||||||||||||
| Acquisition of businesses including net assets acquired, intangibles and goodwill, net of cash acquired |
— | — | (17,248 | ) | (73,225 | ) | (90,473 | ) | ||||||||||||
| Cash paid for Trammell Crow Company |
— | — | (94,483 | ) | — | (94,483 | ) | |||||||||||||
| Contributions to unconsolidated subsidiaries |
— | — | (61,906 | ) | (35,924 | ) | (97,830 | ) | ||||||||||||
| Distributions from unconsolidated subsidiaries |
— | — | 32,292 | 25,520 | 57,812 | |||||||||||||||
| Proceeds from the sale of servicing rights and other assets |
— | — | 28,126 | 4,378 | 32,504 | |||||||||||||||
| Additions to real estate held for investment |
— | — | — | (189,602 | ) | (189,602 | ) | |||||||||||||
| Net proceeds from disposition of real estate held for investment |
— | — | — | 10,898 | 10,898 | |||||||||||||||
| Decrease in restricted cash |
— | — | 163,897 | 4,914 | 168,811 | |||||||||||||||
| Other investing activities, net |
— | 222 | (3,557 | ) | 14,232 | 10,897 | ||||||||||||||
| Net cash provided by (used in) investing activities |
— | 222 | (13,436 | ) | (271,207 | ) | (284,421 | ) | ||||||||||||
| CASH FLOWS FROM FINANCING ACTIVITIES: |
||||||||||||||||||||
| Repayment of senior secured term loans |
— | (286,000 | ) | — | — | (286,000 | ) | |||||||||||||
| Proceeds from revolving credit facility |
— | 561,500 | — | 42,686 | 604,186 | |||||||||||||||
| Repayment of revolving credit facility |
— | (367,500 | ) | — | (14,204 | ) | (381,704 | ) | ||||||||||||
| Repayment of 9 3/4% senior notes |
— | (3,310 | ) | — | — | (3,310 | ) | |||||||||||||
| Proceeds from notes payable on real estate held for investment |
— | — | — | 142,862 | 142,862 | |||||||||||||||
| Repayment of notes payable on real estate held for investment |
— | — | — | (21,621 | ) | (21,621 | ) | |||||||||||||
| Proceeds from notes payable on real estate held for sale and under development |
— | — | — | 210,532 | 210,532 | |||||||||||||||
| Repayment of notes payable on real estate held for sale and under development |
— | — | — | (126,066 | ) | (126,066 | ) | |||||||||||||
| (Repayment of) proceeds from short-term borrowings and other loans, net |
— | — | (421 | ) | 33,946 | 33,525 | ||||||||||||||
| Repurchase of common stock |
(635,000 | ) | — | — | — | (635,000 | ) | |||||||||||||
| Proceeds from exercise of stock options |
11,867 | — | — | — | 11,867 | |||||||||||||||
| Incremental tax benefit from stock options exercised |
16,568 | — | — | — | 16,568 | |||||||||||||||
| Non-controlling interests contributions |
— | — | — | 198,446 | 198,446 | |||||||||||||||
| Non-controlling interests distributions |
— | — | — | (34,842 | ) | (34,842 | ) | |||||||||||||
| Payment of financing costs |
— | (900 | ) | — | (4,709 | ) | (5,609 | ) | ||||||||||||
| Decrease (increase) in intercompany receivables, net |
589,920 | 162,491 | (611,755 | ) | (140,656 | ) | — | |||||||||||||
| Other financing activities, net |
— | — | — | (1,087 | ) | (1,087 | ) | |||||||||||||
| Net cash (used in) provided by financing activities |
(16,645 | ) | 66,281 | (612,176 | ) | 285,287 | (277,253 | ) | ||||||||||||
| Effect of currency exchange rate changes on cash and cash equivalents |
— | — | — | 11,862 | 11,862 | |||||||||||||||
| NET (DECREASE) INCREASE IN CASH AND CASH EQUIVALENTS |
(2 | ) | (65,925 | ) | (42,216 | ) | 206,541 | 98,398 | ||||||||||||
| CASH AND CASH EQUIVALENTS, AT BEGINNING OF PERIOD |
5 | 84,373 | 30,009 | 130,089 | 244,476 | |||||||||||||||
| CASH AND CASH EQUIVALENTS, AT END OF PERIOD |
$ | 3 | $ | 18,448 | $ | (12,207 | ) | $ | 336,630 | $ | 342,874 | |||||||||
| SUPPLEMENTAL DISCLOSURES OF CASH FLOW INFORMATION: |
||||||||||||||||||||
| Cash paid during the period for: |
||||||||||||||||||||
| Interest |
$ | — | $ | 136,009 | $ | 1,002 | $ | 11,933 | $ | 148,944 | ||||||||||
| Income tax payments, net |
$ | — | $ | — | $ | 210,973 | $ | 106,421 | $ | 317,394 | ||||||||||
144
Table of Contents
QUARTERLY RESULTS OF OPERATIONS
(Unaudited)
| Three Months Ended December 31, 2009 |
Three Months Ended September 30, 2009 |
Three Months Ended June 30, 2009 |
Three Months Ended March 31, 2009 |
||||||||||||
| (Dollars in thousands, except share data) | |||||||||||||||
| Revenue |
$ | 1,296,499 | $ | 1,023,205 | $ | 955,667 | $ | 890,449 | |||||||
| Operating income |
$ | 140,445 | $ | 56,994 | $ | 38,924 | $ | 5,479 | |||||||
| Net income (loss) attributable to CB Richard Ellis Group, Inc. |
$ | 64,290 | $ | 12,377 | $ | (6,637 | ) | $ | (36,689 | ) | |||||
| Basic EPS (1) |
$ | 0.22 | $ | 0.04 | $ | (0.02 | ) | $ | (0.14 | ) | |||||
| Weighted average shares outstanding for basic EPS (1) |
298,570,778 | 282,732,848 | 265,683,366 | 261,999,151 | |||||||||||
| Diluted EPS (1) |
$ | 0.21 | $ | 0.04 | $ | (0.02 | ) | $ | (0.14 | ) | |||||
| Weighted average shares outstanding for diluted EPS (1) |
301,799,194 | 285,923,601 | 265,683,366 | 261,999,151 | |||||||||||
| Three Months Ended December 31, 2008 |
Three Months Ended September 30, 2008 |
Three Months Ended June 30, 2008 |
Three Months Ended March 31, 2008 |
||||||||||||
| (Dollars in thousands, except share data) | |||||||||||||||
| Revenue |
$ | 1,283,284 | $ | 1,299,735 | $ | 1,314,873 | $ | 1,230,925 | |||||||
| Operating (loss) income |
$ | (1,055,025 | ) | $ | 108,375 | $ | 87,849 | $ | 70,332 | ||||||
| Net (loss) income attributable to CB Richard Ellis Group, Inc. |
$ | (1,089,456 | ) | $ | 40,373 | $ | 16,563 | $ | 20,454 | ||||||
| Basic EPS (1) |
$ | (4.70 | ) | $ | 0.20 | $ | 0.08 | $ | 0.10 | ||||||
| Weighted average shares outstanding for basic EPS (1) |
231,756,165 | 203,680,475 | 203,435,495 | 203,110,675 | |||||||||||
| Diluted EPS (1) |
$ | (4.70 | ) | $ | 0.19 | $ | 0.08 | $ | 0.10 | ||||||
| Weighted average shares outstanding for diluted EPS (1) |
231,756,165 | 207,706,250 | 208,388,563 | 207,730,837 | |||||||||||
| (1) | EPS is defined as earnings (loss) per share. |
145
Table of Contents
Item 9. Changes in and Disagreements with Accountants on Accounting and Financial Disclosure
Not applicable.
Item 9A. Controls and Procedures
Management’s Report on Internal Control Over Financial Reporting
Our management is responsible for establishing and maintaining adequate internal control over financial reporting, as such term is defined in Securities Exchange Act Rules 13a-15(f), including maintenance of (i) records that in reasonable detail accurately and fairly reflect the transactions and dispositions of our assets, and (ii) policies and procedures that provide reasonable assurance that (a) transactions are recorded as necessary to permit preparation of financial statements in accordance with accounting principles generally accepted in the United States of America, (b) our receipts and expenditures are being made only in accordance with authorizations of management and our Board of Directors and (c) we will prevent or timely detect unauthorized acquisition, use, or disposition of our assets that could have a material effect on the financial statements.
Internal control over financial reporting cannot provide absolute assurance of achieving financial reporting objectives because of the inherent limitations of any system of internal control. Internal control over financial reporting is a process that involves human diligence and compliance and is subject to lapses of judgment and breakdowns resulting from human failures. Internal control over financial reporting also can be circumvented by collusion or improper overriding of controls. As a result of such limitations, there is risk that material misstatements may not be prevented or detected on a timely basis by internal control over financial reporting. However, these inherent limitations are known features of the financial reporting process. Therefore, it is possible to design into the process safeguards to reduce, though not eliminate, this risk.
Under the supervision and with the participation of our management, including our Chief Executive Officer and Chief Financial Officer, we conducted an evaluation of the effectiveness of our internal control over financial reporting based on the criteria established in Internal Control-Integrated Framework issued by the Committee of Sponsoring Organizations (COSO) of the Treadway Commission. Based on our evaluation under the COSO framework, our management concluded that our internal control over financial reporting was effective as of December 31, 2009. The effectiveness of internal control over financial reporting as of December 31, 2009 has been audited by KPMG LLP, an independent registered public accounting firm, as stated in their report which is included herein.
Disclosure Controls and Procedures
Our policy for disclosure controls and procedures provides guidance on the evaluation of disclosure controls and procedures and is designed to ensure that all corporate disclosure is complete and accurate in all material respects and that all information required to be disclosed in the periodic reports submitted by us under the Securities Exchange Act of 1934 is recorded, processed, summarized and reported within the time periods and in the manner specified in the Securities and Exchange Commission’s rules and forms. Disclosure controls and procedures include, without limitation, controls and procedures that are designed to ensure that information required to be disclosed by a company in the reports that it files or submits under the Securities and Exchange Act is accumulated and communicated to the company’s management, including its principal executive and principal financial officers, as appropriate to allow timely decisions regarding required disclosure. As of the end of the period covered by this report, we carried out an evaluation, under the supervision and with the participation of our Chief Executive Officer and Chief Financial Officer, of the effectiveness of our disclosure controls and procedures. Our Disclosure Committee consisting of the principal accounting officer, general counsel, chief communication officer, senior officers of each significant business line and other select employees assisted the Chief Executive Officer and the Chief Financial Officer in this evaluation. Based upon that evaluation, our Chief Executive Officer and Chief Financial Officer concluded that our disclosure controls and procedures were effective as required by the Securities Exchange Act Rule 13a-15(c) as of the end of the period covered by this report.
146
Table of Contents
Changes in Internal Controls Over Financial Reporting
No changes in our internal control over financial reporting occurred during the last fiscal quarter that have materially affected, or are reasonably likely to materially affect, our internal control over financial reporting.
Not applicable.
Item 10. Directors, Executive Officers and Corporate Governance
The information under the headings “Information About the Board”, “Corporate Governance”, “Executive Officers” and “Stock Ownership” in the definitive proxy statement for our 2010 Annual Meeting of Stockholders is incorporated herein by reference.
We are filing the certifications by the Chief Executive Officer and Chief Financial Officer required under Section 302 of the Sarbanes-Oxley Act as exhibits to this Annual Report on Form 10-K.
Item 11. Executive Compensation
The information contained under the headings “Information About the Board—Compensation of Directors”, “Information About the Board—Board Committees”, “Corporate Governance—Compensation Committee Interlocks and Insider Participation” and “Executive Compensation” in the definitive proxy statement for our 2010 Annual Meeting of Stockholders is incorporated herein by reference.
Item 12. Security Ownership of Certain Beneficial Owners and Management and Related Stockholder Matters
The information contained under the heading “Stock Ownership” in the definitive proxy statement for our 2010 Annual Meeting of Stockholders is incorporated herein by reference.
Item 13. Certain Relationships and Related Transactions, and Director Independence
The information contained under the headings “Executive Compensation”, “Related Party Transactions” and “Corporate Governance” in the definitive proxy statement for our 2010 Annual Meeting of Stockholders is incorporated herein by reference.
Item 14. Principal Accountant Fees and Services
The information contained under the heading “Corporate Governance-Principal Accountant Fees and Services” in the definitive proxy statement for our 2010 Annual Meeting of Stockholders is incorporated herein by reference.
147
Table of Contents
Item 15. Exhibits and Financial Statement Schedules
| 1. | Financial Statements |
See Index to Consolidated Financial Statements set forth on page 70.
| 2. | Financial Statement Schedules |
See Schedule II on page 149.
See Schedule III beginning on page 150.
| 3. | Exhibits |
See Exhibit Index beginning on page 156 hereof.
148
Table of Contents
SCHEDULE II—VALUATION AND QUALIFYING ACCOUNTS
(Dollars in thousands)
| Allowance for Doubtful Accounts |
||||
| Balance, December 31, 2006 |
$ | 22,190 | ||
| Charges to expense |
17,688 | |||
| Acquired through acquisitions |
628 | |||
| Write-offs, payments and other |
(5,758 | ) | ||
| Balance, December 31, 2007 |
$ | 34,748 | ||
| Charges to expense |
32,735 | |||
| Acquired through acquisitions |
69 | |||
| Write-offs, payments and other |
(11,249 | ) | ||
| Balance, December 31, 2008 |
$ | 56,303 | ||
| Charges to expense |
9,226 | |||
| Write-offs, payments and other |
(24,132 | ) | ||
| Balance, December 31, 2009 |
$ | 41,397 | ||
See accompanying reports of independent registered public accounting firms.
149
Table of Contents
SCHEDULE III—REAL ESTATE INVESTMENTS AND ACCUMULATED DEPRECIATION
December 31, 2009
(Dollars in thousands)
| Related Encumbrances |
Initial Cost | Costs Subsequent to Acquisition |
Balance at December 31, 2009 | Depreciable Lives in Years (D) |
Date of Construction |
Date Acquired | |||||||||||||||||||||||
| Description |
Land | Buildings and Improvements |
Other | Land | Buildings and Improvements |
Other | Total (A), (B),(C) |
Accumulated Depreciation |
|||||||||||||||||||||
| REAL ESTATE HELD FOR SALE | |||||||||||||||||||||||||||||
| Industrial |
|||||||||||||||||||||||||||||
| Brampton, Brampton, ON |
— | 2,473 | — | — | 730 | 3,203 | — | — | 3,203 | — | — | N/A | 2006 | ||||||||||||||||
| Mixed Use (Multi-family/Retail) |
|||||||||||||||||||||||||||||
| High Street Emerson, Denver, CO |
1,175 | 2,094 | — | — | (494 | ) | 1,482 | 118 | — | 1,600 | — | — | N/A | 2006 | |||||||||||||||
| High Street Rainey, Austin, TX |
— | 482 | — | — | 1,816 | 53 | 2,245 | — | 2,298 | — | — | 2008 | 2006 | ||||||||||||||||
| REAL ESTATE UNDER DEVELOPMENT (NON-CURRENT) | |||||||||||||||||||||||||||||
| Industrial |
|||||||||||||||||||||||||||||
| TCDFW I-20 II, Dallas, TX |
24,857 | 1,921 | — | — | 23,406 | 7,946 | 17,381 | — | 25,327 | — | — | (E | ) | 2006 | |||||||||||||||
| Land |
|||||||||||||||||||||||||||||
| 301 Ocean, Santa Monica, Ca |
12,400 | 50,396 | — | — | (16,623 | ) | 33,773 | — | — | 33,773 | — | — | N/A | 2007 | |||||||||||||||
| Branford, Los Angeles, CA |
13,364 | 19,105 | — | — | 5,092 | 24,197 | — | — | 24,197 | — | — | N/A | 2007 | ||||||||||||||||
| Timbercreek, Dallas, TX |
46,002 | 33,865 | — | — | 13,989 | 47,854 | — | — | 47,854 | — | — | N/A | 2006 | ||||||||||||||||
| Office |
|||||||||||||||||||||||||||||
| Saracen Building 1, Waltham, MA |
16,114 | 4,510 | 288 | — | 15,709 | 6,210 | 14,297 | — | 20,507 | — | — | (E | ) | 2007 | |||||||||||||||
| Retail |
|||||||||||||||||||||||||||||
| Atascocita Commons II, Humble, TX |
7,841 | 2,834 | — | — | 5,672 | 3,961 | 4,545 | — | 8,506 | — | — | (E | ) | 2006 | |||||||||||||||
| REAL ESTATE HELD FOR INVESTMENT | |||||||||||||||||||||||||||||
| Hotel |
|||||||||||||||||||||||||||||
| Oceanside Inn, Jekyll Island, GA |
— | — | — | 3,877 | (188 | ) | — | — | 3,689 | 3,689 | — | — | 1958 | 2009 | |||||||||||||||
| Industrial |
|||||||||||||||||||||||||||||
| 2801 Summit, Plano, TX |
1,981 | 1,082 | 1,986 | 345 | (1,609 | ) | 381 | 1,423 | — | 1,804 | (146 | ) | 39 | 1989 | 2006 | ||||||||||||||
| Baker Industrial, Memphis, TN |
1,275 | 498 | 641 | 269 | (46 | ) | 504 | 858 | — | 1,362 | (55 | ) | 39 | 1972 | 2007 | ||||||||||||||
| Bellbrook Industrial, Memphis, TN |
16,777 | 9,642 | 1,627 | 3,657 | 4,946 | 9,706 | 9,523 | 643 | 19,872 | (706 | ) | 39 | 1975 | 2007 | |||||||||||||||
| Hobby, Oklahoma City, OK |
5,996 | 1,339 | 6,591 | — | 913 | 1,420 | 7,423 | — | 8,843 | (475 | ) | 39 | 1975 | 2008 | |||||||||||||||
150
Table of Contents
| Related Encumbrances |
Initial Cost | Costs Subsequent to Acquisition |
Balance at December 31, 2009 | Depreciable Lives in Years (D) |
Date of Construction |
Date Acquired | ||||||||||||||||||||||
| Description |
Land | Buildings and Improvements |
Other | Land | Buildings and Improvements |
Other | Total (A), (B),(C) |
Accumulated Depreciation |
||||||||||||||||||||
| Jasco, Oklahoma City, OK |
5,608 | 497 | 5,797 | — | 1,127 | 499 | 6,922 | — | 7,421 | (388 | ) | 39 | 1983 | 2008 | ||||||||||||||
| MROTC, Oklahoma City, OK |
10,112 | 3,223 | 3,347 | — | 3,289 | 4,307 | 4,960 | 592 | 9,859 | (1,372 | ) | 39 | 2006 | 2006 | ||||||||||||||
| MROTC Steel Hangers, Oklahoma City, OK |
14,551 | — | 2,470 | 740 | 10,274 | — | 13,484 | — | 13,484 | (1,274 | ) | 39 | 2008 | 2006 | ||||||||||||||
| SC Industrial, Memphis, TN |
6,159 | 3,506 | 317 | 666 | 2,293 | 3,580 | 3,130 | 72 | 6,782 | (283 | ) | 39 | 1969 | 2007 | ||||||||||||||
| 615 N. 48th Street, Phoenix, AZ |
55,793 | 14,550 | 62,123 | 518 | 548 | 14,550 | 62,418 | 771 | 77,739 | (3,183 | ) | 39 | 2005 | 2008 | ||||||||||||||
| Land |
||||||||||||||||||||||||||||
| 150 Beachview, Jekyll Island, GA |
— | — | — | 2,900 | (37 | ) | — | — | 2,863 | 2,863 | — | — | N/A | 2009 | ||||||||||||||
| ADC II Associates LLC, Oklahoma City, OK |
560 | 558 | — | — | 352 | 910 | — | — | 910 | — | — | N/A | 2006 | |||||||||||||||
| Ballpark Way, Houston, TX |
5,380 | 8,218 | — | — | — | 8,218 | — | — | 8,218 | — | — | N/A | 2006 | |||||||||||||||
| Buccaneer, Jekyll Island, GA |
— | — | — | 9,600 | (440 | ) | — | — | 9,160 | 9,160 | — | — | N/A | 2009 | ||||||||||||||
| CG Interstate, Phoenix, AZ |
4,561 | 5,051 | — | — | 584 | 5,635 | — | — | 5,635 | — | — | N/A | 2006 | |||||||||||||||
| CG Sunland, Phoenix, AZ |
— | 1,472 | — | — | 174 | 1,646 | — | — | 1,646 | — | — | N/A | 2006 | |||||||||||||||
| Greenhill, Tulsa, OK |
1,484 | 1,347 | — | — | 1,541 | 2,888 | — | — | 2,888 | — | — | N/A | 2006 | |||||||||||||||
| High Street Glennwilde, Maricopa, AZ |
— | 1,394 | — | — | 30 | 1,424 | — | — | 1,424 | — | — | N/A | 2008 | |||||||||||||||
| Laguna, Laguna Niguel, CA |
6,400 | 12,357 | — | — | (5,669 | ) | 6,688 | — | — | 6,688 | — | — | N/A | 2007 | ||||||||||||||
| Lakeline Retail, Cedar Park, TX |
— | 5 | — | — | — | 5 | — | — | 5 | — | — | N/A | 2006 | |||||||||||||||
| Memphis Land, Memphis, TN |
— | 103 | 99 | — | (19 | ) | 105 | 78 | — | 183 | (5 | ) | 39 | N/A | 2008 | |||||||||||||
| NCC Consortium, Reston, VA |
— | 145 | — | — | 68 | 213 | — | — | 213 | — | — | N/A | 2006 | |||||||||||||||
| Oak Park, Houston, TX |
— | 669 | — | — | 261 | 930 | — | — | 930 | — | — | N/A | 2007 | |||||||||||||||
| SA Crossroads II, San Antonio, TX |
— | 2,131 | — | — | 16 | 2,147 | — | — | 2,147 | — | — | N/A | 2006 | |||||||||||||||
| Saracen, Waltham, MA |
2,576 | 5,330 | — | — | 1 | 5,331 | — | — | 5,331 | — | — | N/A | 2007 | |||||||||||||||
| Saracen Building 4, Waltham, MA |
116 | 234 | — | — | 3 | 237 | — | — | 237 | — | — | N/A | 2007 | |||||||||||||||
| Sierra Corporate Center, Reno, NV |
— | 2,056 | — | — | (998 | ) | 1,058 | — | — | 1,058 | — | — | N/A | 2006 | ||||||||||||||
| TCDFW LCT, Irving, TX |
— | 3,452 | — | — | (2,894 | ) | 558 | — | — | 558 | — | — | N/A | 2006 | ||||||||||||||
| TCEP, Austin, TX |
— | 1,456 | — | — | 30 | 1,486 | — | — | 1,486 | — | — | N/A | 2008 | |||||||||||||||
151
Table of Contents
| Related Encumbrances |
Initial Cost | Costs Subsequent to Acquisition |
Balance at December 31, 2009 | Depreciable Lives in Years (D) |
Date of Construction |
Date Acquired | |||||||||||||||||||||||
| Description |
Land | Buildings and Improvements |
Other | Land | Buildings and Improvements |
Other | Total (A), (B),(C) |
Accumulated Depreciation |
|||||||||||||||||||||
| Medical Office | |||||||||||||||||||||||||||||
| Ballenger Crow Development LLC, Flint, MI |
6,110 | — | 2,861 | — | 4,993 | — | 7,854 | — | 7,854 | (850 | ) | 39 | 2006 | 2006 | |||||||||||||||
| Old Lancaster Med Office LLC, Bryn Mawr, PA |
— | — | — | — | 494 | — | 494 | — | 494 | — | — | N/A | 2008 | ||||||||||||||||
| Mixed Use (Multi-family/Retail) | |||||||||||||||||||||||||||||
| Frisco Fairways, Frisco, TX |
19,873 | 4,011 | — | — | 23,814 | 4,212 | 23,613 | — | 27,825 | (213 | ) | 39 | 2009 | 2008 | |||||||||||||||
| High Street Rainey, Austin, TX |
— | 320 | 237 | — | (221 | ) | 336 | — | — | 336 | — | — | N/A | 2006 | |||||||||||||||
| Office |
|||||||||||||||||||||||||||||
| 1105 Schrock, Columbus, OH |
11,717 | 1,844 | 7,089 | 2,465 | 191 | 1,811 | 8,725 | 1,053 | 11,589 | (1,346 | ) | 39 | 1982 | 2006 | |||||||||||||||
| 6460 Busch, Columbus, OH |
1,592 | 483 | 950 | 444 | (661 | ) | 375 | 773 | 68 | 1,216 | (79 | ) | 39 | 1980 | 2006 | ||||||||||||||
| 6600 Busch, Columbus, OH |
1,196 | 642 | 185 | 458 | (252 | ) | 588 | 324 | 121 | 1,033 | (52 | ) | 39 | 1972 | 2006 | ||||||||||||||
| 6660 Doubletree, Columbus, OH |
1,316 | 570 | 157 | 789 | (612 | ) | 480 | 198 | 226 | 904 | (50 | ) | 39 | 1974 | 2006 | ||||||||||||||
| 814 Commerce, Oak Brook, IL |
16,329 | 4,784 | 8,217 | — | (192 | ) | 3,299 | 9,510 | — | 12,809 | (652 | ) | 39 | 1972 | 2007 | ||||||||||||||
| 898 Sepulveda, El Segundo, CA |
18,615 | 6,986 | 13,209 | 3,122 | (1,368 | ) | 7,548 | 13,316 | 1,085 | 21,949 | (987 | ) | 39 | 1978 | 2006 | ||||||||||||||
| Aurora Building 1, Aurora, CO |
4,988 | 1,989 | 2,783 | 20 | 219 | 1,745 | 3,264 | 2 | 5,011 | (570 | ) | 39 | 1983 | 2008 | |||||||||||||||
| Aurora Building 2, Aurora, CO |
7,531 | 2,250 | 5,811 | 1,699 | (2,013 | ) | 2,050 | 4,895 | 802 | 7,747 | (673 | ) | 39 | 1983 | 2008 | ||||||||||||||
| Aurora Building 3, Aurora, CO |
1,992 | 731 | 1,505 | 209 | (356 | ) | 653 | 1,407 | 29 | 2,089 | (203 | ) | 39 | 1983 | 2008 | ||||||||||||||
| Aurora Building 4, Aurora, CO |
5,908 | 1,673 | 4,634 | 1,450 | (1,450 | ) | 1,533 | 4,039 | 735 | 6,307 | (530 | ) | 39 | 1986 | 2008 | ||||||||||||||
| Aurora Building 5, Aurora, CO |
2,232 | 666 | 1,756 | 386 | (309 | ) | 606 | 1,766 | 127 | 2,499 | (210 | ) | 39 | 1986 | 2008 | ||||||||||||||
| Bixel, Los Angeles, CA |
2,316 | 3,565 | 256 | — | 140 | 3,703 | 258 | — | 3,961 | (2 | ) | 39 | N/A | 2008 | |||||||||||||||
| Bixel Building 1, Los Angeles, CA |
3,300 | 5,168 | 366 | 58 | 118 | 5,373 | 365 | (28 | ) | 5,710 | (2 | ) | 39 | 1967 | 2008 | ||||||||||||||
| Bixel Building 2, Los Angeles, CA |
5,384 | 8,371 | 597 | 398 | (232 | ) | 8,206 | 597 | 331 | 9,134 | (4 | ) | 39 | 1955 | 2008 | ||||||||||||||
| Cascade Station Office II, Portland, OR |
7,622 | 1,233 | 282 | — | 7,603 | 1,887 | 7,231 | — | 9,118 | (512 | ) | 39 | 2008 | 2006 | |||||||||||||||
| Colwick, Charlotte, NC |
— | 593 | 2,997 | — | (1,837 | ) | 141 | 1,612 | — | 1,753 | (284 | ) | 39 | 1970 | 2007 | ||||||||||||||
| Hamilton, Torrance, CA |
16,520 | 6,630 | 12,492 | 581 | (2,288 | ) | 5,526 | 11,605 | 284 | 17,415 | (1,194 | ) | 39 | 1984 | 2007 | ||||||||||||||
| Meriden—530 Preston Avenue, Meriden, CT |
6,508 | 1,079 | 4,837 | 1,292 | 181 | 1,080 | 5,306 | 1,003 | 7,389 | (466 | ) | 39 | 1986 | 2008 | |||||||||||||||
| Meriden—538 Preston Avenue, Meriden, CT |
4,492 | 1,194 | 4,271 | 698 | 657 | 1,194 | 5,308 | 318 | 6,820 | (443 | ) | 39 | 1989 | 2008 | |||||||||||||||
152
Table of Contents
| Related Encumbrances |
Initial Cost | Costs Subsequent to Acquisition |
Balance at December 31, 2009 | Depreciable Lives in Years (D) |
Date of Construction |
Date Acquired | ||||||||||||||||||||||||||||||||
| Description |
Land | Buildings and Improvements |
Other | Land | Buildings and Improvements |
Other | Total (A), (B),(C) |
Accumulated Depreciation |
||||||||||||||||||||||||||||||
| Park South, Charlotte, NC |
10,513 | 2,155 | 10,111 | 556 | (441 | ) | 1,952 | 10,373 | 56 | 12,381 | (890 | ) | 39 | 1980 | 2007 | |||||||||||||||||||||||
| Saracen Building 2, Waltham, MA |
1,406 | 1,722 | 1,000 | 173 | (13 | ) | 1,722 | 1,032 | 128 | 2,882 | (199 | ) | 39 | 1959 | 2007 | |||||||||||||||||||||||
| Saracen Building 3, Waltham, MA |
12,194 | 8,745 | 11,625 | 4,019 | (509 | ) | 8,770 | 12,184 | 2,926 | 23,880 | (1,376 | ) | 39 | 1959 | 2007 | |||||||||||||||||||||||
| Seafed, Seattle, WA |
6,540 | 827 | 5,875 | — | 135 | 743 | 6,094 | — | 6,837 | (417 | ) | 39 | 1984 | 2007 | ||||||||||||||||||||||||
| South Executive, Charlotte, NC |
18,279 | 1,690 | 12,195 | 532 | 6,717 | 1,693 | 19,428 | 13 | 21,134 | (1,998 | ) | 39 | 1973 | 2007 | ||||||||||||||||||||||||
| Torrey Pines, San Diego, CA |
10,237 | 5,782 | 9,044 | — | 49 | 5,795 | 9,080 | — | 14,875 | (388 | ) | 39 | 2001 | 2008 | ||||||||||||||||||||||||
| Warwick, West Warwick, RI |
16,500 | 3,420 | 17,482 | 1,361 | 518 | 3,438 | 19,343 | — | 22,781 | (1,269 | ) | 39 | 1973 | 2007 | ||||||||||||||||||||||||
| Retail |
||||||||||||||||||||||||||||||||||||||
| Atascocita Commons, Humble, TX |
36,054 | 7,605 | 9,187 | — | 23,383 | 8,740 | 31,435 | — | 40,175 | (1,579 | ) | 39 | 2008 | 2006 | ||||||||||||||||||||||||
| Bellbrook Retail, Memphis, TN |
2,409 | 899 | 411 | 85 | 416 | 905 | 891 | 15 | 1,811 | (97 | ) | 39 | 1975 | 2007 | ||||||||||||||||||||||||
| Centre Point Commons, Bradenton, FL |
20,820 | 7,484 | 13,223 | — | 4,278 | 7,822 | 17,163 | — | 24,985 | (1,108 | ) | 39 | 2007 | 2006 | ||||||||||||||||||||||||
| Fairway Centre, Pasadena, TX |
9,702 | 3,061 | 1,797 | — | 2,919 | 3,007 | 4,770 | — | 7,777 | (216 | ) | 39 | 2008 | 2006 | ||||||||||||||||||||||||
| Total |
$ | 551,277 | $ | 296,167 | $ | 252,728 | $ | 43,367 | $ | 127,918 | $ | 300,038 | $ | 393,058 | $ | 27,084 | $ | 720,180 | $ | (26,746 | ) | |||||||||||||||||
| (A) | Includes depreciation and costs subsequent to December 20, 2006, the date we acquired Trammell Crow Company. |
| (B) | The aggregate cost for Federal Income Tax purposes is $804.2 million. |
| (C) | Reflects writedowns for impairments of real estate and provisions for loss on real estate held for sale totaling $67.1 million on assets we own at December 31, 2009. These charges were recorded in 2008 and 2009, as a result of capital market turmoil and weakening real estate fundamentals in the United States. |
| (D) | Land, real estate under development and real estate held for sale are not depreciated. |
| (E) | Project is under construction at December 31, 2009. |
153
Table of Contents
CB RICHARD ELLIS GROUP, INC.
NOTE TO SCHEDULE III—REAL ESTATE INVESTMENTS AND ACCUMULATED
DEPRECIATION
DECEMBER 31, 2009 AND 2008
(Dollars in thousands)
Changes in real estate investments and accumulated depreciation for the year ended December 31 were as follows:
| 2009 | 2008 | |||||||
| Real estate investments: |
||||||||
| Balance at beginning of year |
$ | 804,597 | $ | 689,362 | ||||
| Additions and improvements |
33,804 | 344,146 | ||||||
| Dispositions |
(80,245 | ) | (180,327 | ) | ||||
| Other adjustments (1) |
(37,976 | ) | (48,584 | ) | ||||
| Balance at end of year |
$ | 720,180 | $ | 804,597 | ||||
| Accumulated depreciation: |
||||||||
| Balance at beginning of year |
$ | (14,624 | ) | $ | (3,122 | ) | ||
| Depreciation expense |
(14,334 | ) | (11,502 | ) | ||||
| Dispositions |
2,212 | — | ||||||
| Balance at end of year |
$ | (26,746 | ) | $ | (14,624 | ) | ||
| (1) | Includes impairment charges and amortization of lease intangibles and tenant origination costs. |
154
Table of Contents
Pursuant to the requirements of the Securities Exchange Act of 1934, the registrant has duly caused this report to be signed on its behalf by the undersigned, thereunto duly authorized.
| CB RICHARD ELLIS GROUP, INC. | ||
| By: |
/S/ BRETT WHITE | |
| Brett White Chief Executive Officer | ||
| Date: March 1, 2010 | ||
Pursuant to the requirements of the Securities Exchange Act of 1934, this report has been signed below by the following persons on behalf of the registrant and in the capacities and on the dates indicated.
| Signature |
Title |
Date | ||
| /S/ RICHARD C. BLUM Richard C. Blum |
Chairman of the Board |
March 1, 2010 | ||
| /S/ GIL BOROK Gil Borok |
Chief Accounting Officer (principal accounting officer) |
March 1, 2010 | ||
| /S/ CURTIS F. FEENY Curtis F. Feeny |
Director |
March 1, 2010 | ||
| /S/ BRADFORD M. FREEMAN Bradford M. Freeman |
Director |
March 1, 2010 | ||
| /S/ MICHAEL KANTOR Michael Kantor |
Director |
March 1, 2010 | ||
| /S/ FREDERIC V. MALEK Frederic V. Malek |
Director |
March 1, 2010 | ||
| /S/ JANE J. SU Jane J. Su |
Director |
March 1, 2010 | ||
| /S/ ROBERT E. SULENTIC Robert E. Sulentic |
Chief Financial Officer (principal financial officer) |
March 1, 2010 | ||
| /S/ BRETT WHITE Brett White |
Director and Chief Executive Officer (principal executive officer) |
March 1, 2010 | ||
| /S/ GARY L. WILSON Gary L. Wilson |
Director |
March 1, 2010 | ||
| /S/ RAY WIRTA Ray Wirta |
Vice Chairman |
March 1, 2010 | ||
155
Table of Contents
EXHIBIT INDEX
| Exhibit |
Description | ||
| 2.1 | Amended and Restated Agreement and Plan of Merger, dated as of May 28, 2003, by and among Insignia Financial Group, Inc., CB Richard Ellis Group, Inc., CB Richard Ellis Services, Inc. and Apple Acquisition Corp. (incorporated by reference to Exhibit 2.2 of the CB Richard Ellis Services, Inc. Registration Statement on Form S-4 (No. 333-190841) filed with the SEC on October 20, 2003) | ||
| 2.2 | Purchase Agreement, dated as of May 28, 2003, by and among Insignia Financial Group, Inc., CB Richard Ellis Group, Inc., CB Richard Ellis Services, Inc., Apple Acquisition Corp. and Island Fund I LLC (incorporated by reference to Exhibit 2.3 of the CB Richard Ellis Services, Inc. Registration Statement on Form S-4 filed with the SEC (No. 333-190841) on October 20, 2003) | ||
| 2.3 | Agreement and Plan of Merger, dated as of October 30, 2006, by and among Trammell Crow Company, CB Richard Ellis Group, Inc. and A-2 Acquisition Corp. (incorporated by reference to Exhibit 2.01 of the CB Richard Ellis Group, Inc. Current Report on Form 8-K filed with the SEC on November 1, 2006) | ||
| 3.1 | Restated Certificate of Incorporation of CB Richard Ellis Group, Inc. filed on June 16, 2004, as amended by the Certificate of Amendment filed on June 4, 2009 (incorporated by reference to Exhibit 3.1 of the CB Richard Ellis Group, Inc. Quarterly Report on Form 10-Q filed with the SEC on August 10, 2009) | ||
| 3.2 | Amended and Restated By-laws of CB Richard Ellis Group, Inc. (incorporated by reference to Exhibit 3.2 of the CB Richard Ellis Group, Inc. Current Report on Form 8-K filed with the SEC on December 5, 2008) | ||
| 4.1 | Form of Class A common stock certificate of CB Richard Ellis Group, Inc. (incorporated by reference to Exhibit 4.1 of the CB Richard Ellis Group, Inc. Amendment No. 2 to Registration Statement on Form S-1 filed with the SEC (No. 333-112867) on April 30, 2004) | ||
| 4.2 | (a) | Securityholders’ Agreement, dated as of July 20, 2001 (“Securityholders’ Agreement”), by and among, CB Richard Ellis Group, Inc., CB Richard Ellis Services, Inc., Blum Strategic Partners, L.P., Blum Strategic Partners II, L.P., Blum Strategic Partners II GmbH & Co. KG, FS Equity Partners III, L.P., FS Equity Partners International, L.P., Credit Suisse First Boston Corporation, DLJ Investment Funding, Inc., The Koll Holding Company, Frederic V. Malek, the management investors named therein and the other persons from time to time party thereto (incorporated by reference to Exhibit 25 to Amendment No. 9 to Schedule 13D with respect to CB Richard Ellis Services, Inc. filed with the SEC on July 25, 2001) | |
| 4.2 | (b) | Amendment and Waiver to Securityholders’ Agreement, dated as of April 14, 2004, by and among, CB Richard Ellis Group, Inc., CB Richard Ellis Services, Inc. and the other parties to the Securityholders’ Agreement (incorporated by reference to Exhibit 4.2(b) of the CB Richard Ellis Group, Inc. Amendment No. 2 to Registration Statement on Form S-1 filed with the SEC (No. 333-112867) on April 30, 2004) | |
| 4.2 | (c) | Second Amendment and Waiver to Securityholders’ Agreement, dated as of November 24, 2004, by and among CB Richard Ellis Group, Inc., CB Richard Ellis Services, Inc. and certain of the other parties to the Securityholders’ Agreement (incorporated by reference to Exhibit 4.2(c) of the CB Richard Ellis Group, Inc. Amendment No. 1 to Registration Statement on Form S-1 filed with the SEC (No. 333-120445) on November 24, 2004) | |
| 4.2 | (d) | Third Amendment and Waiver to Securityholders’ Agreement, dated as of August 1, 2005, by and among CB Richard Ellis Group, Inc., CB Richard Ellis Services, Inc. and certain of the other parties to the Securityholders’ Agreement (incorporated by reference to Exhibit 4.1 of the CB Richard Ellis Group, Inc. Current Report on Form 8-K filed with the SEC on August 2, 2005) | |
| 4.3 | Anti-Dilution Agreement, dated as of July 20, 2001, by and between CB Richard Ellis Group, Inc. and Credit Suisse First Boston Corporation (incorporated by reference to Exhibit 20 to Amendment No. 9 to Schedule 13D with respect to CB Richard Ellis Services, Inc. filed with the SEC on July 25, 2001) | ||
156
Table of Contents
| Exhibit |
Description | ||
| 4.4 | (a) | Indenture, dated as of June 18, 2009, among CB Richard Ellis Services, Inc., CB Richard Ellis Group, Inc., the other guarantors party thereto and Wells Fargo Bank, National Association, as trustee, for the 11.625% Senior Subordinated Notes Due June 15, 2017 (incorporated by reference to Exhibit 4.1 of the CB Richard Ellis Group, Inc. Form 8-K filed with the SEC on June 23, 2009) | |
| 4.4 | (b) | Form of Supplemental Indenture among CB Richard Ellis Services, Inc., CB Richard Ellis Group, Inc., certain new U.S. subsidiaries from time-to-time, the other guarantors party thereto and Wells Fargo Bank, National Association, as trustee, for the 11.625% Senior Subordinated Notes Due June 15, 2017 (incorporated by reference to Exhibit 4.1 of the CB Richard Ellis Group, Inc. Form 8-K filed with the SEC on September 10, 2009) | |
| 4.5 | Form of Exchange Note (included in Exhibit 4.4(a)) | ||
| 4.6 | Registration Rights Agreement, dated June 15, 2009, among CB Richard Ellis Services, Inc., CB Richard Ellis Group, Inc., the other guarantors party thereto, and Banc of America Securities LLC, Credit Suisse Securities (USA) LLC and J.P. Morgan Securities Inc., as representatives of the initial purchasers (incorporated by reference to Exhibit 4.4 of the CB Richard Ellis Group, Inc. Form 8-K filed with the SEC on June 23, 2009) | ||
| 10.1 | (a) | Credit Agreement, dated as of June 26, 2006, among CB Richard Ellis Services, Inc., CB Richard Ellis Group, Inc., certain Subsidiaries of CB Richard Ellis Services, Inc., the Lenders named therein and Credit Suisse, as Administrative Agent and Collateral Agent (incorporated by reference to Exhibit 10.1 of the CB Richard Ellis Group, Inc. Current Report on Form 8-K filed with the SEC on June 30, 2006) | |
| 10.1 | (b) | Guarantee and Pledge Agreement, dated as of June 26, 2006, among CB Richard Ellis Services, Inc., CB Richard Ellis Group, Inc., the Subsidiaries of CB Richard Ellis Services, Inc. from time to time party thereto and Credit Suisse, as Collateral Agent (incorporated by reference to Exhibit 10.2 of the CB Richard Ellis Group, Inc. Current Report on Form 8-K filed with the SEC on June 30, 2006) | |
| 10.1 | (c) | Amended and Restated Credit Agreement, dated December 20, 2006, by and among CB Richard Ellis Services, Inc., CB Richard Ellis Group, Inc., certain Subsidiaries of CB Richard Ellis Services, Inc., the lenders named therein and Credit Suisse, as Administrative Agent and Collateral Agent (incorporated by reference to Exhibit 10.1 of the CB Richard Ellis Group, Inc. Current Report on Form 8-K filed with the SEC on December 22, 2006) | |
| 10.1 | (d) | Incremental Term Loan Assumption Agreement, dated as of March 27, 2008, relating to the Amended and Restated Credit Agreement, dated as of December 20, 2006, among CB Richard Ellis Services, Inc., CB Richard Ellis Group, Inc., certain Subsidiaries of CB Richard Ellis Services, Inc., the lenders party thereto and Credit Suisse, Cayman Islands branch, as Administrative Agent and Collateral Agent thereunder (incorporated by reference to Exhibit 10.1 of the CB Richard Ellis Group, Inc. Quarterly Report on Form 10-Q/A filed with the SEC on November 10, 2008) | |
| 10.1 | (e) | Second Amended and Restated Credit Agreement, dated as of March 24, 2009, by and among CB Richard Ellis Services, Inc., CB Richard Ellis Group, Inc., certain Subsidiaries of CB Richard Ellis Services, Inc., the lenders named therein and Credit Suisse, as Administrative Agent and Collateral Agent (incorporated by reference to Exhibit 10.1 of the CB Richard Ellis Group, Inc. Form 8-K filed with the SEC on March 26, 2009) | |
| 10.1 | (f) | Amendment No. 1, dated as of August 6, 2009, to the Second Amended and Restated Credit Agreement, dated as of March 24, 2009, among CB Richard Ellis Services, Inc., certain Subsidiaries of CB Richard Ellis Services, Inc., CB Richard Ellis Group, Inc., the lenders parties thereto and Credit Suisse, as administrative agent and collateral agent (incorporated by reference to Exhibit 10.1 of the CB Richard Ellis Group, Inc. Form 8-K filed with the SEC on August 12, 2009) | |
157
Table of Contents
| Exhibit |
Description | ||
| 10.1 | (g) | Loan Modification Agreement, dated as of August 24, 2009, relating to the Second Amended and Restated Credit Agreement, dated as of March 24, 2009, among CB Richard Ellis Services, Inc., certain Subsidiaries of CB Richard Ellis Services, Inc., CB Richard Ellis Group, Inc., the lenders parties thereto and Credit Suisse, as administrative agent and collateral agent (incorporated by reference to Exhibit 10.1 of the CB Richard Ellis Group, Inc. Form 8-K filed with the SEC on August 28, 2009) | |
| 10.1 | (h) | Amended and Restated Guarantee and Pledge Agreement, dated as of March 24, 2009, by and among CB Richard Ellis Services, Inc., CB Richard Ellis Group, Inc., certain Subsidiaries of CB Richard Ellis Services, Inc. and Credit Suisse, as Collateral Agent (incorporated by reference to Exhibit 10.2 of the CB Richard Ellis Group, Inc. Form 8-K filed with the SEC on March 26, 2009) | |
| 10.1 | (i) | Form of Supplement, between certain new U.S. subsidiaries from time-to-time and Credit Suisse, as collateral agent, to the Amended and Restated Guarantee and Pledge Agreement, dated as of March 24, 2009, by and among CB Richard Ellis Services, Inc., CB Richard Ellis Group, Inc., certain Subsidiaries of CB Richard Ellis Services, Inc. and Credit Suisse, as collateral agent (incorporated by reference to Exhibit 10.1 of the CB Richard Ellis Group, Inc. Form 8-K filed with the SEC on September 10, 2009) | |
| 10.2 | CB Richard Ellis Group, Inc. 2001 Stock Incentive Plan, as amended (incorporated by reference to Exhibit 10.1 of the CB Richard Ellis Group, Inc. Annual Report on Form 10-K filed with the SEC on March 25, 2003) + | ||
| 10.3 | (a) | Amended and Restated 2004 Stock Incentive Plan of CB Richard Ellis Group, Inc. (incorporated by reference to Exhibit 10.3 of the CB Richard Ellis Group, Inc. Quarterly Report on Form 10-Q filed with the SEC on May 10, 2005) + | |
| 10.3 | (b) | Amendment No. 1, dated September 6, 2006, to the Amended and Restated 2004 Stock Incentive Plan of CB Richard Ellis, Group, Inc. (incorporated by reference to Exhibit 10.1 of the CB Richard Ellis Group, Inc. Current Report on Form 8-K filed with the SEC on September 12, 2006) + | |
| 10.3 | (c) | Amendment No. 2, dated June 1, 2007, to the Amended and Restated 2004 Stock Incentive Plan of CB Richard Ellis Group, Inc. (incorporated by reference to Exhibit 10.2 of the CB Richard Ellis Group, Inc. Quarterly Report on Form 10-Q filed with the SEC on August 9, 2007) + | |
| 10.3 | (d) | Second Amended and Restated 2004 Stock Incentive Plan of CB Richard Ellis Group, Inc., dated June 2, 2008 (incorporated by reference to Exhibit 10.1 of the CB Richard Ellis Group, Inc. Current Report on Form 8-K filed with the SEC on June 6, 2008) + | |
| 10.3 | (e) | Amendment No. 1 to the Second Amended and Restated 2004 Stock Incentive Plan of CB Richard Ellis Group, Inc., dated December 3, 2008 (incorporated by reference to Exhibit 10.3 of the CB Richard Ellis Group, Inc. Quarterly Report on Form 10-Q filed with the SEC on May 11, 2009) + | |
| 10.4 | (a) | CB Richard Ellis Services, Inc. Amended and Restated 401(k) Plan, as amended (incorporated by reference to Exhibit 10.12 of the CB Richard Ellis Group, Inc. Annual Report on Form 10-K filed with the SEC on March 25, 2003) + | |
| 10.4 | (b) | Amendment to CB Richard Ellis Services, Inc. Amended and Restated 401(k) Plan, dated March 31, 2006 (incorporated by reference to Exhibit 10.5(b) of the CB Richard Ellis Group, Inc. Quarterly Report on Form 10-Q filed with the SEC on May 10, 2006) + | |
| 10.5 | (a) | CB Richard Ellis Services, Inc. Amended and Restated Deferred Compensation Plan, as amended (incorporated by reference to Exhibit 10.11 of the CB Richard Ellis Group, Inc. Annual Report on Form 10-K filed with the SEC on March 25, 2003) + | |
| 10.5 | (b) | CB Richard Ellis Deferred Compensation Plan effective as of August 1, 2004 (incorporated by reference to Exhibit 4.1 of the CB Richard Ellis Group, Inc. Registration Statement on Form S-8 filed with the SEC (No. 333-119362) on September 29, 2004) + | |
158
Table of Contents
| Exhibit |
Description | ||
| 10.5 | (c) | Amendment, dated as of November 18, 2005, to CB Richard Ellis Deferred Compensation Plan (incorporated by reference to Exhibit 10.12(b) of the CB Richard Ellis Group, Inc. Annual Report on Form 10-K filed with the SEC on March 16, 2006) + | |
| 10.5 | (d) | Amended and Restated CB Richard Ellis Deferred Compensation Plan (incorporated by reference to Exhibit 10.1 of the CB Richard Ellis Group, Inc. Current Report on Form 8-K filed with the SEC on August 18, 2008) + | |
| 10.5 | (e) | Amendment No. 2 to the CB Richard Ellis Pre August 1, 2004 Deferred Compensation Plan (incorporated by reference to Exhibit 10.2 of the CB Richard Ellis Group, Inc. Current Report on Form 8-K filed with the SEC on August 18, 2008) + | |
| 10.5 | (f) | Merger and Amendment of CB Richard Ellis Deferred Compensation Plans, dated as of November 21, 2008 + * | |
| 10.6 | Executive Bonus Plan, amended and restated as of March 19, 2007 (incorporated by reference to Exhibit 10.1 of the CB Richard Ellis Group, Inc. Quarterly Report on Form 10-Q filed with the SEC on May 10, 2007) + | ||
| 10.7 | Executive Incentive Plan, effective as of January 1, 2007 (incorporated by reference to Exhibit 10.1 of the CB Richard Ellis Group, Inc. Quarterly Report on Form 10-Q filed with the SEC on August 9, 2007) + | ||
| 10.8 | Form of Indemnification Agreement for Directors and Officers (incorporated by reference to Exhibit 10.1 of the CB Richard Ellis Group, Inc. Current Report on Form 8-K filed with the SEC on December 8, 2009) + | ||
| 10.9 | Employment Agreement, dated November 21, 2008, between Gil Borok and CB Richard Ellis, Inc. (incorporated by reference to Exhibit 10.16 of the CB Richard Ellis Group, Inc. Annual Report on Form 10-K filed with the SEC on March 2, 2009) + | ||
| 11 | Statement concerning Computation of Per Share Earnings (filed as Note 18 of the Consolidated Financial Statements) | ||
| 12 | Computation of Ratio of Earnings to Fixed Charges* | ||
| 21 | Subsidiaries of CB Richard Ellis Group, Inc.* | ||
| 23.1 | Consent of Independent Registered Public Accounting Firm* | ||
| 23.2 | Consent of Independent Registered Public Accounting Firm* | ||
| 31.1 | Certification of Chief Executive Officer, pursuant to Rule 13a-14(a) and Rule 15d-14(a) of the Securities Exchange Act of 1934, as amended (adopted pursuant to Section 302 of the Sarbanes-Oxley Act of 2002)* | ||
| 31.2 | Certification of Chief Financial Officer, pursuant to Rule 13a-14(a) and Rule 15d-14(a) of the Securities Exchange Act of 1934, as amended (adopted pursuant to Section 302 of the Sarbanes-Oxley Act of 2002)* | ||
| 32 | Certifications by Chief Executive Officer and Chief Financial Officer, pursuant to 18 U.S.C. 1350 (adopted pursuant to Section 906 of the Sarbanes-Oxley Act of 2002)* | ||
| + | Denotes a management contract or compensatory plan or arrangement |
| * | Filed herewith |
159