Attached files
| file | filename |
|---|---|
| 8-K - 8-K - REGIONAL HEALTH PROPERTIES, INC | a12-4337_18k.htm |
| EX-99.1 - EX-99.1 - REGIONAL HEALTH PROPERTIES, INC | a12-4337_1ex99d1.htm |
Exhibit 99.2
|
|
February 2012 NYSE AMEX: ADK AdCare Health Systems, Inc. “Setting the Standard for Senior Living” ® |
|
|
Forward-Looking Statements Statements contained in this presentation that are not historical facts may be forward-looking statements within the meaning of federal law. Such statement can be identified by the use of forward-looking terminology, such as "believes," "expects," "plans," "intends," "anticipates" and variations of such words or similar expressions, but their absence does not mean that the statement is not forward-looking. Statements in this presentation that are forward-looking include, but are not limited to, statements regarding expected closing dates and final terms of pending transactions, and expected annualized revenue run-rates. Such forward-looking statements reflect management's beliefs and assumptions and are based on information currently available to management. The forward-looking statements involve known and unknown risks, results, performance or achievements of the Company to differ materially from those expressed or implied in such statements. Such factors are identified in the public filings made by the Company with the Securities and Exchange Commission and include the Company's ability to secure lines of credit and/or an acquisition credit facility, find suitable acquisition properties at favorable terms, changes in the health care industry because of political and economic influences, changes in regulations governing the industry, changes in reimbursement levels including those under the Medicare and Medicaid programs and changes in the competitive marketplace. There can be no assurance that such factors or other factors will not affect the accuracy of such forward-looking statements. This presentation is copyright 2012 by AdCare Health Systems, Inc. 2 |
|
|
Stock Price (2/2/12) $4.77 Avg. Daily Vol. (3 mo.) 21,995 52 Week Low/High $3.70 – $6.69 Shares Out. 12.2M Public Float, est. (mrq) 9.8M Founded 1991 Valuation Measures¹ Market Cap. $58.1M Enterprise Value $159.7M EV/Revenue (ttm) 1.2x Ownership Institutional, est. 22% Insider, est. 27% Key Stats (Sources: AdCare, Capital IQ) 3 Income Statement – TTM (at 9/30/11) Revenue (ttm) $134.6M Adjusted EBITDAR ¹ (mrq) $4.7M EPS (basic & diluted) (ttm) $(0.31) Balance Sheet – Q3 2011 (as of 9/30/11) Cash & Equivalents $10.0M Total Assets $158.3M Total Debt $112.2M ¹ Please refer to definition and a reconciliation of Adj. EBITDAR to GAAP measures in the slide “Use of Non-GAAP Financial Information” at the end of this presentation. |
|
|
What we do. Founded in 1991, AdCare is a leading developer, owner and operator of: Skilled Nursing Facilities Assisted Living Facilities Retirement Communities Successfully pursuing an aggressive M&A growth strategy, designed to build upon the company’s ability to deliver high-quality care and strong operational efficiency 4 |
|
|
MN IA MO AR LA WI IL IN MI PA OH NY VA WV KY TN MS AL GA SC NC OK ME KS NE SD ND TX FL NH VT MA RI CT NJ DE DC MD Where we operate Since initiating an M&A campaign in the fall of 2009, AdCare has built upon its original base in Ohio, and expanded to Alabama, Arkansas, Georgia, Missouri, North Carolina & Oklahoma Operating 44 facilities, with a total of ~3,900+ beds/units in service Current closing on signed agreements for 25 additional facilities, with a ~3,100 beds/units in service: 15 SNFs across the Southeast 5 SNFs in Oklahoma 5 SNFs in Arkansas 5 • AdCare Facility Locations • Signed Agreement to Lease, Purchase, or Manage SNF= Skilled Nursing Facility ALF= Assisted Living Facility |
|
|
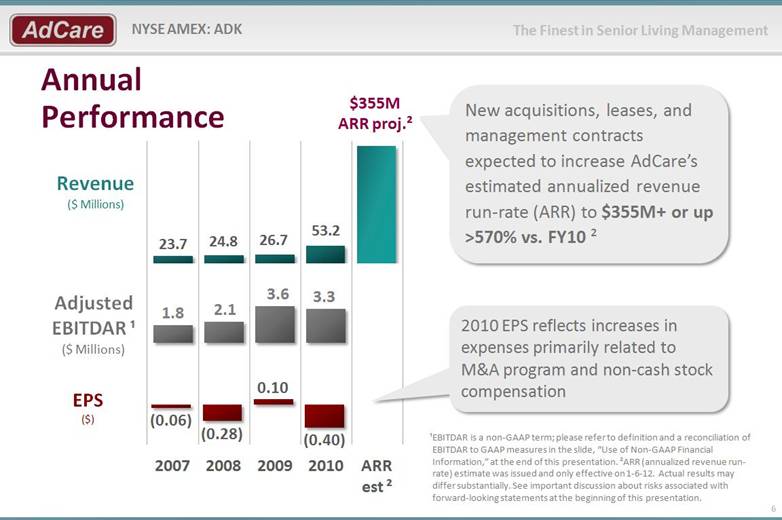
2010 EPS reflects increases in expenses primarily related to M&A program and non-cash stock compensation 6 New acquisitions, leases, and management contracts expected to increase AdCare’s estimated annualized revenue run-rate (ARR) to $355M+ or up >570% vs. FY10 ² ¹EBITDAR is a non-GAAP term; please refer to definition and a reconciliation of EBITDAR to GAAP measures in the slide, “Use of Non-GAAP Financial Information,” at the end of this presentation. ²ARR (annualized revenue run-rate) estimate was issued and only effective on 1-6-12. Actual results may differ substantially. See important discussion about risks associated with forward-looking statements at the beginning of this presentation. Annual Performance |
|
|
Q3 2011 Results (period ended Sept. 30, 2011) Record Revenue: $40.9M up 208% from Q3-10 Increase due to new acquisitions, as well as organic growth in existing Skill Nursing and Assisted Living facilities Net Income: $3.5M gain primarily due to a non-cash derivative gain of $4.7M Adjusted EBITDAR: $4.7 million, up 711% from Q3-10* Expecting min. 10% EBITDAR margin on new facilities (exclusive of acquisition related costs) 7 * Adjusted EBITDAR is a non-GAAP term; please refer to definition and a reconciliation of adjusted EBITDAR to GAAP measures in the slide “Use of Non-GAAP Financial Information” at the end of this presentation. $ millions |
|
|
8 An Expanding $226B+ Market Opportunity¹ Age 85+ population is growing 3X faster than the general population² vs. declining supply of available nursing facilities Sources: ¹CMS ²U.S. Department of Commerce, Bureau of the Census Source: AHCA 15.7 16.9 2000 2003 2006 2009 Declining Number of Available Nursing Facilities (U.S. in thousands) |
|
|
Industry Characteristics Favor AdCare High barriers to entry Regulatory hurdles: “Certificate of Need” requirements limit number of new facilities Staff/management requires licenses & expertise Experienced back office capability required for insurance/government reimbursement Lending institutions require Proven record of operations Limited availability of facilities for patients Due in part to high cost of land acquisition & construction Fragmented market presents significant consolidation & acquisition opportunities to well-established providers like AdCare 9 |
|
|
Corporate Milestones: 2009 - 2012 10 SNF= Skilled Nursing Facility ALF= Assisted Living Facility Sept 24: Chris Brogdon new Vice Chmn. & CAO March 31: Acquired partners’ 50% interest in 3 ALFs in Ohio Jun 22: Mgmt contract & option for assisted living facility in AL Aug 2: Leased 5 nursing homes in GA Sept 2: Leased 3 nursing homes in GA Oct 1: Bought 2 nursing homes in AL Nov 2: Leased 2 nursing homes in GA Dec 31: Bought Nursing Home in NC Jun 1: Closed last of three SNF in Georgia Jun 28: Signed agreement for 15 SNFs Sep 8: Closed Four Skilled Nursing Facilities in AK Nov 14: Closed last of 5 SNLs in AK & MS Dec 30: Acquired SNF & ALF in Ohio FY 2009: 8th consecutive year of record revenue; 1st profitable year as ADK Dec 30: Boyd Gentry & Josh McClellan appointed indep. directors Dec 9: $2.8M private placement to fund growth initiatives July 6: Closed $6.8M Equity Offering Aug 11: Declared 5% stock dividend Nov 1: $11.8M convertible note closed Dec 31: 9th consecutive year of record revenue Nov 3: new $5M credit line Apr 1 - May 7: $4.6M convertible note Jun 3: Appointed Boyd CEO and Martin CFO Jun 27: Joined Russell Microcap Index Sep 7: Declared 5% Stock Dividend Oct 4: Completed $6.9M warrant call Oct 17: To acquire 5 SNFs OK Dec 2: Acquired SNF & ALF in AR Dec 12: Appointed David Rubenstein as COO |2010 | 2011 | 2012 Dec 29: To Acquire 3 SNFs in Arkansas Jan 5 & 17: To acquire one SNF in Arkansas |
|
|
AdCare Revenue Sources (For Three Months Ended September 30, 2011) 11 |
|
|
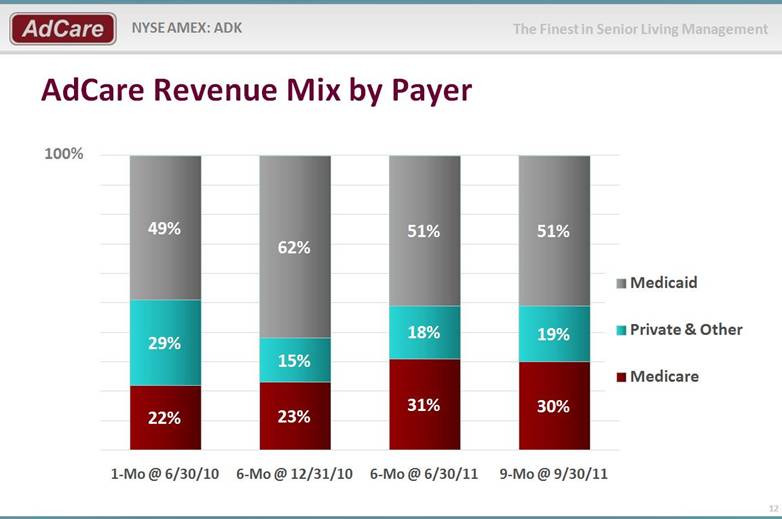
AdCare Revenue Mix by Payer 12 |
|
|
Medicare Sector 2010 Spend ($ billions) 13 Source: Medicare Finances: Findings of the 2011 Trustees Report; National Academy of Social Insurance (NASI), May 2011 AdCare’s target markets represent relatively small portions of the total Medicare spend |
|
|
SNF Industry Valuation Overview Industry Valuation Overview 4 publicly traded companies in the Skilled Nursing Facility (SNF) sector, SUNH, AVCA, ENSG, and SKH Valuations generally higher for those that predominantly “own” rather than “rent” the underlying facilities No publicly-traded competitor is growing anywhere near as fast as AdCare Valuations of the comparable public competitors, while varied, averaged 0.6x revenues and 8.5x EBITDA 14 AdCare Acquisition Valuation Most AdCare acquisitions have initially fallen into these value ranges Value is created by improving or “optimizing” operating results over time Example: Powder Springs historical, pre-acquisition EBITDA was negative and therefore its overall valuation was estimated at ~$4 million (apx. $20K a bed) Based on the subsequent optimized EBITDA run rate, Powder Springs can now be valued at more than $9 million – more than double from the time of its acquisition |
|
|
Acquisition Program Strategy & Process AdCare’s recent acquisitions have had an average facility Medicare rate of $381 per day at the time of acquisition vs. company’s average facility Medicare rate of $494 in Q3 2011 The company’s operating team has a proven record of increasing the Medicare census and rates of its acquisitions Achieved a 36% increase in Medicare census in facilities operated for 14 months Census improvement resulted in quality mix increase to 13% for entire company vs. average of 10% at time of acquisition 15 |
|
|
Recent Optimization Example: Powder Springs Once under the AdCare umbrella, the company has effectively optimized acquired facilities 12 months after acquiring Powder Springs, AdCare was able to raise the average daily Medicare census from 22 to 35 — up 59+% Further, after 12 months, AdCare raised Medicare PPD (Per Patient Day) from $344 to $552 — up 60+% Since Medicare PPD is the average rate a facility can charge to Medicare per patient per day, any increase in rate has a direct correlation to increased profitability 16 |
|
|
Facility Optimization: Powder Springs Performance Comparison* 17 ($ thousands) First Quarter Under AdCare Fourth Quarter Under AdCare Urban Facility Example Annualized Aug-Oct 2010 Annualized Apr-Jun AdCare Revenues $13,490 $16,055 EBITDAR $ $1,172 $3,123 EBITDAR % 8.7% 19.4% EBITDA $ ($332) $1,619 EBITDA % (2.5%) 10.1% Total Beds 208 208 Occupancy % 89.6% 92.3% % Medicare 12.4% 20.0% % MediCaid + Private 87.6% 80.0% Average Medicare Rate $371 $539 *This case study may not be representative of any other company acquisitions or new leases. Atlanta, GA Powder Springs Nursing & Rehab Center |
|
|
Portfolio Optimization 18 Over the past year AdCare has been able to significantly increase the average daily census of acquired facilities Average daily census represents average number of Medicare patients occupying beds at any given time. Most facilities experience a certain amount of churn as patients enter and leave. The average daily census allows the company to measure progress. AdCare has been able to significantly increase the average daily census of facilities acquired, representing a direct increase in profitability over time. Additionally, the company has increased the average per day Medicare reimbursement of acquired facilities by ~30%. Up 36% Up 30% |
|
|
Chief Acquisition Officer Leading M&A Program Chris Brogdon joined AdCare’s already strong senior management team in Sept. 2009 as vice chairman & CAO to lead AdCare’s new M&A program AdCare’s largest individual shareholder Veteran industry executive: 20+ years owning, operating and financing assisted living and retirement care facilities Former Chairman of NYSE-traded Retirement Care Associates (NYSE:RCA) Expanded RCA from 3 to 120 facilities Increased annual revenue from $1.0M to $350M Sold to Sun Healthcare for more then $350M Former Chairman of Contour Medical (NASDAQ: CTMI) Increased annual revenue sevenfold: $5.0M to $35M Sold to Sun Healthcare @$12/share, vs. $1 when he assumed chairmanship 19 Chris Brogdon Vice Chairman & CAO |
|
|
Growth Opportunity – Acquisitions Company in ideal position to leverage existing management & infrastructure to operate a much larger enterprise Purchase skilled nursing and assisted living operations in the Southeast and Midwest Improve quality mix thereby increase revenue & cash flow Create a significant private-to-public arbitrage through acquisitions 20 *See footnote on slide 5 |
|
|
M&A Campaign Targets Financially Sound States 21 Map Key 10-year bond yield, Dec 09 - Dec 10 average spread over AAA -rated general obligation municipal bonds > 35 25 – 35 15 – 25 0 - 15 n.a.* *No debt issued or actively traded. Sources: Thomson Reuters MMD; NCSL Southeastern state governments among least indebted Southeast states 0-15 (basis point) muni-bond yields amongst lowest Sound state budgets lowers payment risk on Medicaid reimbursement |
|
|
2010 M&A Activity Overview 22 Description Size Location Type ARR Terms Closing Status Three ALF 72 beds Ohio Purchase (Remaining 50%) $3.2 million Cash Closed 3-31 One ALF 104 Units Hoover, AL Consolidated Variable Interest Entity (CVIE) $1.4 million 1 yr purchase option, expiring June 2011 Signed Option 6-25. Currently a CVIE Five SNF 600 beds Georgia Lease $38.8 million 10-yr lease Closed 7-30 Three SNF 269 beds Georgia Lease $18.4 million 10-yr lease (combined with above) Closed 9-2 Two SNF 304 beds Gadsden, AL Purchase $19.5 million Long-term fixed rate loan, USDA guaranteed Closed 10-1 Two SNF 299 beds Atlanta, GA Lease $20.8 million 12-yr lease with renewal option Closed 11-2 One SNF 106 beds Sylva, NC Purchase $8.0 million Long-term fixed rate loan, USDA guaranteed Closed 12-31 Total 1,754 $110.1 million ALF= Assisted Living Facility SNF= Skilled Nursing Facility ARR= Annualized Revenue Run-rate |
|
|
2011 M&A Activity Overview 23 Description Size Location Type ARR Terms Closing Status Three SNF 329 beds GA Purchase $18.0 million Long-term fixed rate loan, USDA guaranteed Closed 6-1-11 Five SNF 314 beds OK CVIE $12.7 million Long-term loan (SBA guaranteed) Currently CVIE Since 8-1-11 Five SNF 482 beds AR & MO Purchase four in AK & Lease one in MO $27.5 million Standard bank loan, loan guaranteed by USDA, seller notes & 10 yr lease Closed purchase 9-8-11. Closed lease 11-16-11 One SNF & One ALF 128 beds Mountain View, AR Purchase $5.4 million Long-term loan, USDA guaranteed Closed 12-2-11 One SNF & One ALF 179 beds OH Purchase $12.5 million 30 yr, fixed-rated, tax-exempt bond issuance & standard bank loan Closed 12-30-11 Total 1,432 $76.1 million ALF= Assisted Living Facility SNF= Skilled Nursing Facility ARR= Annualized Revenue Run-rate |
|
|
2012 Pending Deals 24 Description Size Location Type ARR Terms Closing Status Fifteen SNF 1,991 beds NC, SC, TN & VA Purchase/Lease/Manage $121.3 million Cash, shares of AdCare common stock, & seller notes Q1-12 Five SNF 456 beds OK Purchase $13.2 million Long-term loan, SBA guaranteed Q1-12 Three SNF 439 beds AR Purchase $24.5 million Traditional bank loan Q1-12 One SNF 141 beds AR Purchase $6.4 million Traditional bank loan Q1-12 One SNF 120 beds AR Purchase $3.3 million Traditional bank loan Q2-12 Total 3,147 $168.7 million ALF= Assisted Living Facility SNF= Skilled Nursing Facility ARR= Annualized Revenue Run-rate |
|
|
SNF= Skilled Nursing Facility ALF= Assisted Living Facility CVIE= Consolidated Variable Interest Entity M&A Activity: Bed/Unit Acquisition Growth | 2010 | 2011 | 2012 25 |
|
|
AdCare Key Take-Aways $226+ billion opportunity in expanding Senior Living industry w/ high barriers to entry for competitors Strong leverage in operating model available for rapid growth – both organically and through acquisitions At inflection point: Nine straight years of record revenue growth Aggressive M&A program on track to increase AdCare’s annualized revenue run-rate to $355M+ or up >570% vs. FY10¹ – with more in pipeline 26 ¹See footnote on slide 5 |
|
|
For More Information Company Contacts David A. Tenwick, Chairman Christopher Brogdon, Vice Chairman & CAO Boyd Gentry, CEO AdCare Health Systems, Inc., Springfield, Ohio Tel 404.386.9607 • www.adcarehealth.com Investor Relations Ron Both, Liolios Group, Inc. Tel 949.574.3860 • adcare@liolios.com 27 |
|
|
Appendix 28 |
|
|
Senior Management Team Boyd Gentry Chris Brogdon David Rubenstein Martin D. Brew CEO Vice Chairman & CAO COO CFO & Treasurer Healthcare executive with 25+ years of experience in M&A, financing and capital markets Former president of Mariner Health Care, Inc. BA in Economics, Knox College MBA in Finance & Accounting, Southern Methodist University Veteran industry executive with 20+ years of experience in the nursing home, assisted living and retirement community industry Former chairman of Retirement Care and Contour Medical Georgia State University 23+ years of experience in long-term care facility management Former CEO of LaVie Management Services, Coastal Administrative Services BS in Accounting, University of Rhode Island Process master certified by Hammer and Company 29+ years of extensive financial management and post-acquisition integration experience Former VP of Finance at Formation Capital, LLC BS in Business, Indiana University CPA 29 |
|
|
Skilled Nursing Facilities Market Overview 30 Facility Ownership Status and Geographical Characteristics Top SNF Providers Market Concentration With approximately 16,000 facilities, no one provider has a market share of more than a few percent The 10 largest SNFs account for less than 15% of total facilities. Of the top 10 providers based on bed count, five are publicly traded and five are privately held Performance & Margins Medicare margins as captured by MedPAC have varied over time but have generally been above 10% After shrinking drastically to 10.8% in 2003 from 17.4% in 2002, margins have begun to climb again and reached 14.5% in 2007, but are expected to decline somewhat to 12.6% in 2009 For the for-profit operators, margins have been even better, usually above 15%, and in 2007 were 17.5% compared to much lower non-profit margins (most recently at 4.5%) After home health, SNFs show the highest absolute margins of the post-acute operators Here margins are greatly influenced on the revenue side by case mix, with the higher-margin business residing in the newer upper nine payment categories, and on the cost side by better census management and economies of scale While the margin profile is attractive, given the current regulatory/political environment and state budget concerns as well as the backdrop of healthcare reform, margins could be pressured over the intermediate to longer term Ownership Status Hospital Based vs Free-/standing Rural vs Urban Source: Company reports, MedPAC, AHD, AHA, and Wall Street research Source: Company reports, MedPAC and J.P. Morgan estimates Name Ownership Beds Facilities % of Total 1 HCR M a norCare Private 38 , 140 277 1.8 2 Golden Living Private 33 , 351 324 2.2 3 LifeCare Centers Private 29 , 367 223 1.5 4 Kindred Healthcare Public 28 , 525 228 1.5 5 Genesis Healthcare Corp. Private 27 , 947 227 1.5 6 Sun Healthcare Group Public 23 , 3 45 207 1.4 7 Extendicare REIT Public 18 , 157 175 1.2 8 Good Sama ri tan Society Private 13 , 409 185 1.2 9 National Healthcare Corp Public 9 , 772 76 0.5 10 Skilled Healthcare Group Public 9 , 373 75 0.5 Top 10 1 , 997 13.3 Others 13 , 063 86.7 Total Industry 15 , 060 100.0 Non-Profit 27% For-Profit 68% Govt. 5% Rural 33% Urban 67% Hospital Based 7% Free-Standing 93% |
|
|
31 Sept. 30, 2011 Unrestricted Cash $ 10,049,883 Funded Indebtedness Working Capital Line of Credit $ 7,720,415 Total Line of Credit = $7,500K, secured by A/R, matures 10/29/2013, Interest Rate = LIBOR + 5.0% HUD Financing(s) $ 15,794,838 Six term loans secured by 7 facilities having 246 beds in Ohio. [35] year term, fully amortizing, range of 5.1-8.5% interest (8.5% loan is being refinanced). USDA Financings $ 32,891,444 Three term loans secured by 3 facilities having 416 beds in AL & NC .25 year term, fully amortizing, prime +1.5% interest. Other Mortgage Indebtedness $ 37,544,292 30 year term, 7.9% interest Miscellaneous Indebtedness $ 2,041,896 Subtotal Senior Debt $ 95,992,885 Convertible Notes $ 11,725,000 $ 4,508,700 $ 16,233,700 Balloon Maturity of 10/26/13. Interest Rate 10%, Convertible into 2,838,983 shares at $4.13. Balloon Maturity of 3/31/14. Interest Rate 10%, Convertible into 850,698 shares at $5.30. Weighted Average Common Shares Outstanding Basic 9,450,507 Diluted 12,689,231 Capital Structure |
|
|
Q3 2011 Operational Highlights Completed the acquisition of four skilled nursing facilities in Arkansas: 402 beds in service, generated >$25M in 2010 Began providing back office and administrative services to five skilled nursing facilities in Oklahoma: 314 beds in service, generating an estimated $12.7M ARR. In Q3 2011, AdCare consolidated this group of facilities per GAAP accounting rules Signed agreement to purchase SNF & ALF in Ohio: 179 beds in service, generating an estimated $12M gross ARR. Expected to close in late Q4 2011 Signed agreement to purchase SNF & ALF in Mountain View, Arkansas: 129 beds in service, generating an estimated $8.0M gross ARR. Expected to close late Q4 2011 By end of Q3, AdCare operated 40 facilities, comprised of 32 SNFs, seven ALFs and one independent living/senior housing facility, totaling >3,600 units. The AdCare’s communities are located in Alabama, Arkansas, Georgia, North Carolina, Ohio and Oklahoma 32 SNF=Skilled Nursing Facility ALF=Assisted Living Facility CVIE = Consolidated Variable Interest Entity |
|
|
Annual Income Statement *See footnote on slide 5 $ in Millions (except EPS) FY Ending Dec. 31, 2007 2008 2009 2010 ARR* Revenue $ 23.7 $ 24.8 $ 26.7 $53.2 $355+ Expenses: Payroll 14.8 15.6 15.4 32.4 Other 7.7 8.2 8.6 18.3 Depreciation 0.8 0.9 0.9 1.3 Op. Income $ 0.3 $ 0.01 $ 1.8 $(1.7) EPS $(0.05) $(0.28) $ 0.10 $(0.40) 33 |
|
|
Use of Non-GAAP Financial Information Beginning with the reporting of results for this first quarter of 2011, the company has transitioned from reporting EBITDA, and EBITDAR, to also reporting adjusted EBITDAR. These are measures of operating performance that are not calculated in accordance with U.S. generally accepted accounting principles (“GAAP”). The company defines EBITDA as net income (loss) before interest income, interest expense, income tax expense, depreciation and amortization (including amortization of non-cash stock-based compensation). The company defines EBITDAR as net income (loss) before interest income, interest expense, income tax expense, depreciation, amortization (including amortization of non-cash stock-based compensation) and rent cost. The company defines adjusted EBITDAR as net income (loss) before interest income; interest expense; income tax expense; depreciation; amortization (including amortization of non-cash stock-based compensation); rent cost; gain on acquisitions, net of acquisition costs; and derivative loss. EBITDA, EBITDAR, and adjusted EBITDAR should not be considered in isolation or as a substitute for net income, income from operations or cash flows provided by or used in operations, as determined in accordance with GAAP. The metrics are a key measures of AdCare Health Systems’ operating performance used by management to focus on operating performance and management without mixing in items of income and expense that relate to the financing and capitalization of the business, fixed rent or lease payments of facilities, derivative loss and certain gains on acquisitions. The company believes these measures are useful to investors in evaluating the company’s performance, results of operations and financial position for the following reasons: It is helpful in identifying trends in the company’s day-to-day performance because the items excluded have little or no significance to the company’s day-to-day operations; It provides an assessment of controllable expenses and affords management the ability to make decisions, which are expected to facilitate meeting current financial goals as well as achieve optimal financial performance; and It is an indication to determine if adjustments to current spending decisions are needed. AdCare believes that the use of the measures provides a meaningful and consistent comparison of the company’s underlying business between periods by eliminating certain items required by GAAP, which have little or no significance in the company’s day-to-day operations. 34 |
|
|
Use of Non-GAAP Financial Information 35 Note: The Adjusted EBITDA and Adjusted EBITDAR calculations for the three months ended June 30, 2011 have been adjusted downward $206,394 from that originally reported, as a result of a correction of the amortization of stock based compensation for the second quarter. 2011 2010 2011 2010 Net Income (loss) $2,780,384 ($1,643,663) ($2,723,625) ($1,034,641) Interest expense, net 2,230,211 420,448 5,524,682 1,005,908 Income tax expense 214,424 10,641 446,060 31,925 Amortization of stock based compensation 183,983 215,760 741,464 647,330 Depreciation and amortization 840,116 303,190 2,201,083 779,164 Acquisition costs, net of gains 1,146,651 402,850 789,432 (1,226,854) Loss on extinguishment of debt 58,440 - 135,840 - Derivative (gain) loss (4,744,694) - (806,657) - Other income from recovery of receivables - - (632,001) - Salary retirement and continuation costs - - 621,605 - Adjusted EBITDA $2,709,515 ($290,774) $6,297,883 $202,832 Rent expense 1,981,332 869,400 5,830,923 1,158,933 Adjusted EBITDAR $4,690,847 $578,626 $12,128,806 $1,361,765 AdCare Health Systems, Inc. and Subsidiaries Reconciliation of Net (Loss) Income to Adjusted EBITDA and Adjusted EBITDAR (Unaudited) 77,400 2,588,171 Three Months Ended June 30, 2011 ($4,562,377) 1,854,281 135,265 167,487 See Note 709,774 622,120 Three Months Ended September 30, Nine Months Ended September 30, $4,160,594 - 621,605 $2,213,726 1,946,868 |