Attached files
| file | filename |
|---|---|
| EX-99.3 - FINANCIAL STATEMENTS - KEYCORP /NEW/ | d286107dex993.htm |
| EX-99.1 - PRESS RELEASE, DATED JANUARY 24, 2012 - KEYCORP /NEW/ | d286107dex991.htm |
| 8-K - FORM 8-K - KEYCORP /NEW/ | d286107d8k.htm |
| KeyCorp
Fourth Quarter 2011 Earnings Review
January 24, 2012
Beth E. Mooney
Chairman and
Chief Executive Officer
Jeffrey B. Weeden
Chief Financial Officer
Exhibit 99.2 |
| 2
This presentation contains forward-looking statements within the meaning of the
Private Securities Litigation Reform Act of 1995, including statements about
Key’s financial condition, results of operations, earnings outlook, asset quality trends
and profitability. Forward-looking statements are not historical facts
but instead represent only management’s current expectations and
forecasts regarding future events, many of which, by their nature, are inherently uncertain and outside
of Key’s control. Key’s actual results and financial condition may
differ, possibly materially, from the anticipated results and financial
condition indicated in these forward-looking statements. Factors that could cause Key’s actual results to
differ materially from those described in the forward-looking statements can be
found in KeyCorp’s Annual Report on Form 10-K for the year ended
December 31, 2010, and its Quarterly Reports on Form 10-Q for the periods ended March
31, 2011, June 30, 2011 and September 30, 2011, which have been filed with the
Securities and Exchange Commission and are available on Key’s website
(www.key.com/ir) and on the Securities and Exchange Commission’s website
(www.sec.gov). Forward-looking statements are not guarantees of future
performance and should not be relied upon as representing management’s
views as of any subsequent date. Key does not undertake any obligation to update the
forward-looking statements to reflect the impact of circumstances or events
that may arise after the date of the forward- looking statements.
PRIVATE SECURITIES LITIGATION REFORM ACT OF
1995 FORWARD-LOOKING STATEMENT DISCLOSURE |
 3
Returned to solid profitability
Continued improvement in credit quality
New leadership team committed to focused strategy execution
Reached inflection point for loan portfolio
Leveraged differentiated business model to build sustainable momentum
Continued investment in the business
Growing the
Franchise
Maintained strong balance sheet and moderate risk profile
Disciplined approach to capital management to maximize shareholder value
Positioned to meet Basel III requirements
Execution of
Business Plan
Investor Highlights –
Full Year 2011
Strategic statement: Key grows by building enduring relationships
through client-focused solutions and extraordinary service
Disciplined
Capital
Management |
 4
(a) Continuing operations, unless otherwise noted
(b) Represents period-end consolidated total loans and loans held for
sale (excluding education loans in the securitization trusts) divided by
period-end consolidated total deposits (excluding deposits in foreign office)
Executing Business Plan: Progress on Targets for Success
1.17%
68%
44%
3.16%
1.11%
87%
KEY
FY 2011
Improve funding mix
Focus on risk-adjusted returns
Grow client relationships
Leverage Key’s total client solutions and
cross-selling capabilities
>3.50%
3.13%
Net interest margin
Growing high
quality, diverse
revenue streams
>40%
42%
Noninterest income
to total revenue
Improve efficiency and effectiveness
Leverage technology
Change cost base to more variable from
fixed
60-65%
73%
Efficiency ratio
Creating positive
operating
leverage
Execute our client insight-driven
relationship model
Focus on operating leverage
Improved funding mix with lower cost core
deposits
1.00-1.25%
1.01%
Return on average
assets
Executing our
strategies
Focus on relationship clients
Exit noncore portfolios
Limit concentrations
Focus on risk-adjusted returns
40-50 bps
.86%
NCOs to average loans
Returning to a
moderate risk
profile
Leverage integrated model to grow
relationships and loans
Improve deposit mix
90-100%
87%
Loan to deposit ratio
(b)
Core funded
Action Plans
Targets
KEY
4Q11
KEY Metrics
(a)
KEY Business
Model |
 5
Financial Review |
 6
Financial Summary –
Fourth Quarter 2011
Capital
(b)
Asset Quality
(a)
Financial
Performance
(a)
TE = Taxable equivalent, EOP = End of Period
(a) From continuing operations
(b) From consolidated operations
(c) 12-31-11 ratios are estimated
Income from continuing operations attributable to Key
$.21
$.24
$.33
common shareholders
Net interest margin (TE)
3.13%
3.09%
3.31%
Return on average total assets
1.01
1.14
1.53
Tier 1 common equity
(c)
11.28%
11.28%
9.34%
Tier 1 risk-based capital
(c)
13.01
13.49
15.16
Tangible common equity to tangible assets
9.88
9.82
8.19
Book value per common share
$10.09
$10.09
$9.52
Net loan charge-offs to average loans
.86%
.90%
2.00%
NPLs to EOP portfolio loans
1.47
1.64
2.13
NPAs to EOP portfolio loans + OREO + Other NPAs
1.73
1.89
2.66
Allowance for loan losses to period-end loans
2.03
2.35
3.20
Allowance for loan losses to NPLs
138.10
143.53
150.19
Metrics
4Q11
3Q11 4Q10 |
 7
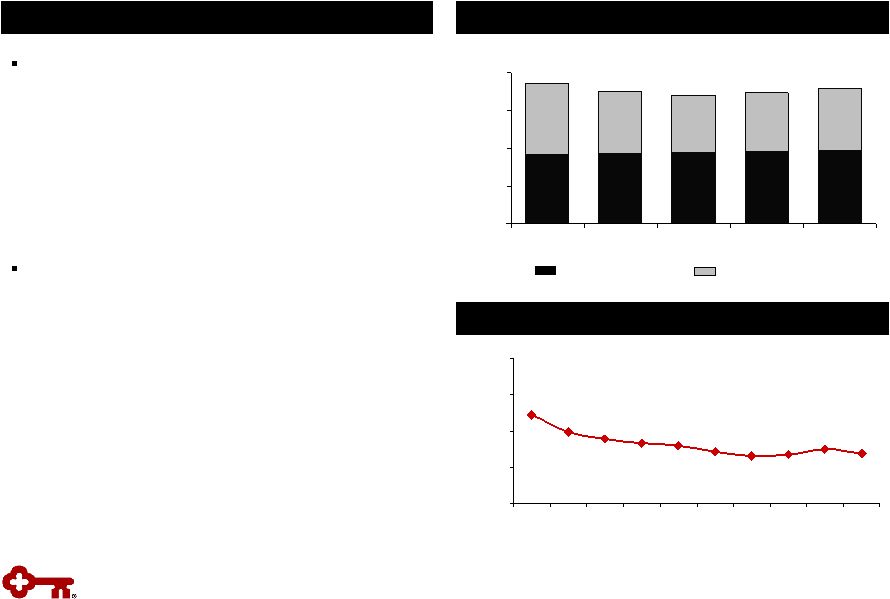
Period-end loans grew for the second consecutive
quarter and average balances increased for the
first time since 4Q08
Average CF&A loans increased 5.4% in 4Q11
Positioned to continue to grow loans by
leveraging integrated business model and
focusing on targeted segments
$0
$10
$20
$30
$40
$50
$60
4Q10
1Q11
2Q11
3Q11
4Q11
Loan Growth –
Past the Inflection Point
$ in billions
Highlights
Average Commercial, Financial & Agricultural Loans
CF&A loans
Utilization rate
Quarterly % Change in Average CF&A Loans
Average Loans
Exit Portfolios
Home Equity & Other
CF&A & Leasing
Commercial Real Estate
$ in billions
$50.8
$49.3
$48.5
$18.3
$17.4
$16.9
$16.3
$16.6
46.3%
44.4%
43.4%
43.2%
42.9%
$0
$5
$10
$15
$20
4Q10
1Q11
2Q11
3Q11
4Q11
30%
40%
50%
60%
(10.3)%
(5.2)%
(5.7)%
(4.4)%
(2.3)%
3.7%
2.7%
5.4%
(1.5)%
(12.0)%
(8.0)%
(4.0)%
.0%
4.0%
8.0%
4Q09
1Q10
2Q10
3Q10
4Q10
1Q11
2Q11
3Q11
4Q11
$48.0
$48.7 |
 8
$10.8
$11.7
$12.4
$13.6
$15.0
2.66%
2.60%
2.69%
2.59%
2.53%
$0
$5
$10
$15
$20
4Q10
1Q11
2Q11
3Q11
4Q11
.00%
1.00%
2.00%
3.00%
4.00%
5.00%
$45.8
$45.4
$45.3
$46.5
$48.2
.13%
.15%
.18%
.17%
.18%
$20
$30
$40
$50
4Q10
1Q11
2Q11
3Q11
4Q11
.00%
.10%
.20%
.30%
85%
85%
81%
80%
82%
0%
25%
50%
75%
100%
4Q10
1Q11
2Q11
3Q11
4Q11
Improving Deposit Mix
Highlights
Average Non-time Deposits
(a)
Higher cost CDs continue to decline, while lower
cost deposits have remained strong
Improved funding mix has reduced the cost of
total deposits, which is down 7 bps from 3Q11
Total CD maturities and average cost
–
2012 Q1: $2.4 billion at 0.89%
–
2012 Q2: $1.8 billion at 2.00%
–
2012 Q3: $1.6 billion at 3.40%
–
2012 Q4: $1.0 billion at 2.73%
–
2013 & beyond: $3.5 billion at 3.28%
Average
CD Balances
$ in billions
$ in billions
(a) Excludes time deposits and deposits in foreign office
(b) Represents period-end consolidated total loans and loans held for
sale (excluding education loans in the securitization trusts) divided by
period-end consolidated total deposits (excluding deposits in foreign office)
Loan to Deposit Ratio
(b)
Continuing operations
Discontinued operations
90%
91%
Cost of non-time deposits
Non-time deposits
Average rate on CDs
Total average CDs
86%
86%
87% |
 9
$859
$914
$950
$1,089
1.47%
1.64%
1.76%
1.82%
2.13%
$0
$500
$1,000
$1,500
$2,000
4Q10
1Q11
2Q11
3Q11
4Q11
0.00%
1.00%
2.00%
3.00%
4.00%
$1,338
$1,004
$1,131
$1,230
$1,372
$1,604
2.83%
2.57%
3.20%
2.35%
2.03%
$0
$500
$1,000
$1,500
$2,000
4Q10
1Q11
2Q11
3Q11
4Q11
0.00%
2.00%
4.00%
6.00%
138.1%
143.5%
146.1%
155.0%
150.2%
0%
50%
100%
150%
200%
4Q10
1Q11
2Q11
3Q11
4Q11
$256
$193
$134
$109
$105
$(22)
$10
$(8)
$(40)
$(97)
2.00%
1.59%
.90%
.86%
1.11%
-$100
$0
$100
$200
$300
$400
4Q10
1Q11
2Q11
3Q11
4Q11
-1.00%
.00%
1.00%
2.00%
3.00%
4.00%
Nonperforming Assets
Net Charge-offs & Provision for Loan Losses
NPLs
NPLs to period-end loans
NCOs
Provision for loan losses
NCOs to average loans
Allowance for Loan Losses
Allowance to Nonperforming Loans
Allowance for loan losses
ALLL to period-end loans
$ in millions
$ in millions
$ in millions
NPLs held for sale,
OREO & other NPAs
Continued Improvement in Asset Quality |
 10
Total Revenue
TE = Taxable equivalent
$ in millions
Continuing Operations
Net interest margin
Net interest income
Highlights
Net Interest Margin (TE) Trend
Continued funding cost reductions contribute
to stability and improvement in net interest
income
Lower noninterest income primarily driven by:
–
Volatility in principal investing income
–
Full quarter impact of debit price controls
–
Visa related charge -
$24 million in 4Q11
–
Trust Preferred redemptions
New client acquisition and execution of
relationship-based model provide opportunities
to grow noninterest income
Noninterest Income and % of Total Revenue
Noninterest income
Noninterest income to
total revenue
$ in millions
$563
$555
$570
$604
$635
3.25%
3.19%
3.31%
3.09%
3.13%
$0
$150
$300
$450
$600
$750
4Q10
1Q11
2Q11
3Q11
4Q11
0.00%
2.00%
4.00%
6.00%
$526
$457
$454
$483
$414
42.4%
46.5%
45.3%
44.3%
43.1%
$0
$200
$400
$600
4Q10
1Q11
2Q11
3Q11
4Q11
30.0%
40.0%
50.0%
60.0% |
 11
$365
$371
$380
$382
$387
$379
$330
$300
$310
$330
$0
$200
$400
$600
$800
4Q10
1Q11
2Q11
3Q11
4Q11
Focused Expense Management
Noninterest Expense
Personnel expense
$ in millions
Highlights
Noninterest expense declined $27 million from the
prior year and increased $25 million compared to
3Q11
–
Improvement from prior year due to lower
FDIC expense, a decline in lease operating
expense and Key’s efficiency initiatives
–
4Q11 expense levels reflect higher business
services and marketing, offset by lower
provision for lending commitments
Key remains focused on operating leverage
–
Shifting FTE mix towards client-facing
positions
–
Leveraging continuous improvement
practices
–
Strengthening processes, alignment and
accountability across the organization
Average FTEs
Non-personnel expense
$680
$701
$744
15,973
15,349
15,381
15,772
16,436
15,665
15,584
15,424
15,301
15,490
14,000
15,000
16,000
17,000
18,000
3Q09
4Q09
1Q10
2Q10
3Q10
4Q10
1Q11
2Q11
3Q11
4Q11
$692
$717 |
 12
$977
$717
$260
Total revenue
Noninterest
expense
PPNR
4Q11 Pre-Provision Net Revenue
Pre-Provision Net Revenue Trend
Pre-Provision Net Revenue
(a)
and ROAA
(b)
(a) Net interest income plus taxable-equivalent adjustment and
noninterest income less noninterest expense (b) From continuing
operations Return on Average Assets
$ in millions
$ in millions
Noninterest
income
42%
Personnel
expense
54%
$417
$360
$344
$346
$260
$0
$100
$200
$300
$400
$500
4Q10
1Q11
2Q11
3Q11
4Q11
1.01%
1.14%
1.23%
1.32%
1.53%
.00%
.50%
1.00%
1.50%
2.00%
4Q10
1Q11
2Q11
3Q11
4Q11
Net interest
income
58%
Non-personnel
expense
46% |
 13
Peer leading capital position supports growth
Positioned for successful transition to Basel III
Continued capital generation through execution
of strategy
Disciplined approach to capital management
Tier 1 Common Equity
(a)
Tangible Common Equity to Tangible Assets
Strong Capital Ratios
Highlights
Book Value per Share
9.88%
9.82%
8.19%
9.16%
9.67%
0.00%
2.00%
4.00%
6.00%
8.00%
10.00%
4Q10
1Q11
2Q11
3Q11
4Q11
$10.09
$10.09
$9.52
$9.58
$9.88
$8.00
$8.50
$9.00
$9.50
$10.00
$10.50
4Q10
1Q11
2Q11
3Q11
4Q11
11.28%
11.28%
9.34%
10.74%
11.14%
0.00%
2.00%
4.00%
6.00%
8.00%
10.00%
12.00%
4Q10
1Q11
2Q11
3Q11
4Q11
(a) 12-31-11 ratio is estimated |
 14
Appendix |
 15
3.07%
3.15%
3.20%
3.19%
3.44%
$0
$5
$10
$15
$20
$25
4Q10
1Q11
2Q11
3Q11
4Q11
0.00%
1.00%
2.00%
3.00%
4.00%
5.00%
$21.3
$21.2
$19.0
$18.5
$18.4
Average Total Investment Securities
Highlights
Average AFS securities
$ in billions
High Quality Investment Portfolio
Portfolio composed of Agency or GSE backed:
GNMA, Fannie & Freddie
–
No private label MBS or financial paper
Average portfolio maturity at 12/31/11: 2.2 years
Unrealized net gain of $522 million on available-
for-sale securities portfolio at 12/31/11
Mortgage paydowns
in 4Q11 were $1.5 billion vs.
$1.1 billion in 3Q11
4Q11 purchases classified as held-to-maturity
Securities to Total Assets
(a)
(a) Includes end of period held-to-maturity and
available-for-sale securities 20.4%
21.0%
23.9%
21.6%
21.1%
0.0%
5.0%
10.0%
15.0%
20.0%
25.0%
4Q10
1Q11
2Q11
3Q11
4Q11
Average yield
Average HTM securities |
 16
N/M = Not Meaningful
(a)
Net charge-off amounts are annualized in calculation. NCO ratios for
discontinued operations and consolidated Key exclude education loans in the
securitization trusts since valued at fair-market value (b)
12-31-11 allowance by portfolio is estimated. Allowance/period loans
ratios for discontinued operations and consolidated Key exclude education
loans in the securitization trusts since valued at fair-market value Credit
Quality Credit Quality by Portfolio
$ in millions
Period-end
loans
Average
loans
12/31/11
4Q11
4Q11
3Q11
4Q11
3Q11
12/31/11
9/30/11
12/31/11
12/31/11
12/31/11
Commercial, financial and agricultural
$19,378
$18,323
$28
$23
.61
%
.52
%
$188
$188
$334
1.72
%
177.66
%
Commercial real estate:
Commercial mortgage
8,037
8,090
23
25
1.13
1.24
218
237
272
3.38
124.77
Construction
1,312
1,380
(6)
8
(1.72)
2.05
54
93
63
4.80
116.67
Commercial lease financing
6,055
5,982
-
2
-
.13
27
31
78
1.29
288.89
Real estate -
residential mortgage
1,946
1,918
7
4
1.45
.86
87
88
37
1.90
42.53
Home equity:
Key Community Bank
9,229
9,280
20
18
.86
.76
108
102
103
1.12
95.37
Other
535
553
9
8
6.46
5.45
12
12
29
5.42
241.67
Consumer other—
Key Community Bank
1,192
1,191
9
9
3.00
3.05
1
4
41
3.44
N/M
Consumer other:
Marine
1,766
1,820
14
11
3.05
2.26
31
32
46
2.60
148.39
Other
125
127
1
1
3.12
2.85
1
1
1
.80
100.00
Continuing total
$49,575
$48,664
$105
$109
.86
%
.90
%
$727
$788
$1,004
2.03
%
138.10
%
Discontinued
operations
-
education
lending business
5,812
5,906
25
31
3.19
3.93
23
22
104
3.37
452.17
Consolidated total
$55,387
$54,570
$130
$140
1.00
%
1.09
%
$750
$810
$1,108
2.10
%
147.73
%
Allowance /
period-end
loans
(b)
Allowance /
NPLs
Net loan
charge-offs
Net
loan
charge-offs
(a)
/
average loans
Nonperforming
loans
Ending
allowance
(b) |
 17
Commercial Real Estate by Property Type and Geography
N/M = Not Meaningful
(a) Nonresidential land and development loans
Commercial Real Estate Loans –
12/31/11
$ in millions
(a)
Geographic Region
% of
Commercial
West
Southwest
Central
Midwest
Southeast
Northeast
Total
Total CRE
Mortgage
Construction
Nonowner-occupied:
Retail properties
$341
$115
$207
$208
$365
$206
$1,442
15.4
%
$219
$1,223
Multifamily properties
194
131
212
312
258
203
1,310
14.0
383
927
Health facilities
110
-
105
154
164
229
762
8.2
-
762
Office buildings
118
37
110
168
46
199
678
7.3
84
594
Warehouses
230
34
44
76
106
83
573
6.1
18
555
Residential properties
48
14
25
65
42
46
240
2.6
165
75
Hotels/motels
71
-
23
6
81
20
201
2.1
40
161
Land and development
15
13
29
11
30
67
165
1.8
152
13
Manufacturing facilities
1
-
1
7
65
4
78
.8
-
78
Other
133
7
274
22
112
90
638
6.8
64
574
Total nonowner-occupied
1,261
351
1,030
1,029
1,269
1,147
6,087
65.1
1,125
4,962
Owner-occupied
1,309
37
331
722
124
739
3,262
34.9
187
3,075
Total
$2,570
$388
$1,361
$1,751
$1,393
$1,886
$9,349
100.0
%
$1,312
$8,037
Nonowner-occupied: December 31, 2011
Nonperforming loans
$41
$24
$2
$30
$33
$44
$174
N/M
$50
$124
90+ days past due
-
-
21
8
47
10
86
N/M
86
-
30-89 days past due
32
-
1
6
-
22
61
N/M
6
55
Nonowner-occupied: September 30, 2011
Nonperforming loans
$50
$49
$2
$39
$38
$50
$228
N/M
$141
$87
90+ days past due
-
-
-
-
-
8
8
N/M
-
8
30-89 days past due
14
-
7
14
47
23
105
N/M
97
8
|
 18
(a) Nonresidential land and development loans
Commercial Real Estate
Commercial Real Estate Credit Quality
$ in millions
(a)
Period-end
loans
12-31-11
9-30-11
12-31-11
9-30-11
12-31-11
9-30-11
Retail properties
$1,442
$1,515
38
$63
$8
-
Multifamily properties
1,310
1,405
42
44
-
$10
Health facilities
762
855
8
10
-
-
Office builldings
678
671
20
26
7
7
Warehouses
573
539
8
10
-
-
Residential properties
240
292
32
49
(4)
13
Hotels/motels
201
216
3
4
1
1
Land and development
165
173
6
6
-
(8)
Other CRE
716
345
16
16
(1)
5
Total nonowner-occupied
6,087
6,011
173
228
11
28
Owner-occupied
3,262
3,403
99
102
6
5
Total
$9,349
$9,414
$271
$330
$17
$33
Nonperforming
loans
charge-offs
Net loan |
 19
(a) Average
LTVs
are
at
origination.
Current
average
LTVs
for
Community
Bank
total
home
equity
loans
and
lines
is
approximately
78%,
which compares to 78% at the end of the third quarter 2011.
Community Bank –
Home Equity
Exit Portfolio –
Home Equity
$ in millions, except average loan size
$ in millions, except average loan size
(a)
(a)
Home Equity Loans –
12/31/11
Vintage (% of Loans)
Loan Balances
Average Loan
Size ($)
Average
FICO
Average
LTV
% of Loans
LTV>90%
2010 and
2011
2009
2008
2007
2006 and
prior
Home equity loans and lines
First lien
4,877
$
58,282
$
752
66
%
.6
%
21
%
9
%
11
%
8
%
51
%
Second lie
4,352
45,146
751
75
3.3
16
7
17
17
43
Total home equity loans and lines
9,229
$
51,251
$
751
70
1.9
19
8
14
12
47
Nonaccrual loans
First lien
58
$
63,993
$
712
74
%
.8
%
2
%
5
%
5
%
17
%
71
%
Second lie
50
53,650
713
78
4.9
2
5
13
22
58
Total home equity nonaccrual loans
108
$
58,724
$
713
75
2.6
2
5
8
19
66
Community Bank - Home Equity
Fourth quarter net charge-offs
20
$
-
3
%
21
%
27
%
49
%
Net loan charge-offs to average loans
.86
%
Vintage (% of Loans)
Loan Balances
Average Loan
Size ($)
Average
FICO
Average
LTV
% of Loans
LTV>90%
2010 and
2011
2009
2008
2007
2006 and
prior
Home equity loans and lines
First lien
23
$
22,950
$
747
33
%
.4
%
-
-
1
%
25
%
74
%
Second lien
512
$
24,837
730
82
32.7
-
-
1
41
58
Total home equity loans and lines
535
$
24,748
$
731
80
31.3
-
-
2
40
58
Nonaccrual loans
First lien
1
$
21,748
$
738
32
%
-
-
-
-
20
%
80
%
Second lien
11
27,033
711
83
36.9
%
-
-
2
%
42
56
Total home equity nonaccrual loans
12
$
26,631
$
712
81
34.7
-
-
2
40
58
Exit Portfolio -
Home Equity
Fourth quarter net charge-offs
9
$
-
-
1
%
48
%
51
%
Net loan charge-offs to average loans
6.46
% |
 20
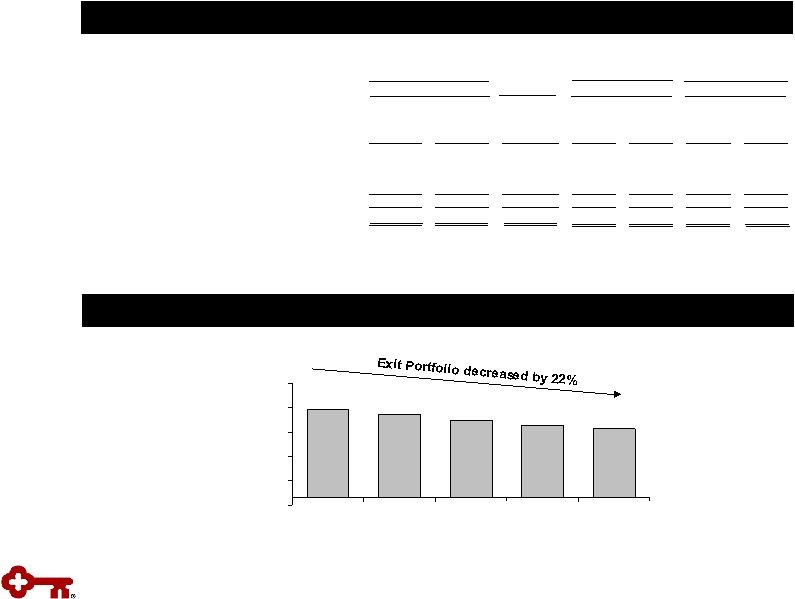
$4,217
$4,435
$5,388
$5,048
$4,736
-$500
$1,000
$2,500
$4,000
$5,500
$7,000
4Q10
1Q11
2Q11
3Q11
4Q11
Exit Loan Portfolio Trend (Excluding Discontinued Operations)
Exit Loan Portfolio
$ in millions
(a) Includes the business aviation, commercial vehicle, office products,
construction and industrial leases, and Canadian lease financing portfolios; and
all remaining balances related to lease in, lease out; sale in, sale out; service
contract leases; and qualified technological equipment leases (b) Includes
loans in Key’s consolidated education loan securitization trusts (c)
Credit amounts indicate recoveries exceeded charge-offs $ in
millions Exit Loan Portfolio
Change
12-31-11 vs.
12-31-11
9-30-11
9-30-11
4Q11
(c)
3Q11
12-31-11
9-30-11
Residential properties –
homebuilder
$41
$48
$(7)
$(2)
$4
$23
$28
Marine and RV floor plan
81
92
(11)
2
3
45
38
Commercial lease financing
(a)
1,669
1,728
(59)
(2)
-
7
9
Total commercial loans
1,791
1,868
(77)
(2)
7
75
75
Home equity –
Other
535
565
(30)
9
8
12
12
Marine
1,766
1,871
(105)
14
11
31
32
RV and other consumer
125
131
(6)
1
1
1
-
Total consumer loans
2,426
2,567
(141)
24
20
44
44
Total exit loans in loan portfolio
$4,217
$4,435
$(218)
$22
$27
$119
$119
Discontinued operations -
education
lending business (not included in exit loans above)
(b)
$5,812
$5,984
$(172)
$25
$31
$23
$22
Balance on
Nonperforming
Status
Balance
Outstanding
Charge-offs
Net Loan |
 21
Credit Quality Trends
Quarterly Change in Criticized Outstandings
(a)
Delinquencies to Period-end Total Loans
(a)
Loan and Lease Outstandings
.89%
.99%
.97%
.98%
.95%
1.29%
1.14%
1.14%
1.59%
1.72%
1.61%
1.87%
1.69%
.33%
.24%
.25%
.32%
.48%
.30%
.45%
.78%
.56%
.60%
.82%
.62%
.57%
0.00%
0.50%
1.00%
1.50%
2.00%
2.50%
30 –
89 days delinquent
90+ days delinquent
(13.6)%
(10.2)%
(12.3)%
(11.2)%
(16.7)%
(14.3)%
(12.8)%
(1.0)%
(8.1)%
(2.0)%
2.8%
35.1%
41.5%
-20%
-10%
0%
10%
20%
30%
40%
50%
4Q08
1Q09
2Q09
3Q09
4Q09
1Q10
2Q10
3Q10
4Q10
1Q11
2Q11
3Q11
4Q11 |