Attached files
| file | filename |
|---|---|
| 8-K - 8-K - CEDAR FAIR L P | d284326d8k.htm |
 Investor Presentation
January 19, 2012
Exhibit 99.1 |
 2
Forward Looking Statements
Some slides and comments included here, particularly related to estimates,
comments on expectations about future performance or business conditions,
may contain “forward looking statements”
within the meaning of the federal
securities laws which involve risks and uncertainties. You can identify
forward- looking statements because they contain words such as
“believes,” “project,”
“might,”
“expects,”
“may,”
“will,”
“should,”
“seeks,”
“approximately,”
“intends,”
“plans,”
“estimates”
or “anticipates”
or similar expressions that concern our
strategy, plans or intentions. These forward-looking statements are subject to
risks and uncertainties that may change at any time, and could cause actual
results to differ materially from those that we anticipate. While we believe
that the expectations reflected in such forward-looking statements are
reasonable, we caution that it is very difficult to predict the impact of
unknown factors, and it is impossible for us to anticipate all factors that
could affect our actual results. Important factors, including those listed
under Item 1A in the Partnership’s Form 10-K could adversely affect
our future financial performance and cause actual results to differ
materially from our expectations. |
 Investor Presentation
January 19, 2012 |
 4
*
*
*
*
*
*
*
*
*
*
*
*
* |
 5
AGENDA
Company Overview &
Key Investment Considerations
Matt Ouimet
Park Review
Richard Zimmerman
Financial Review
Brian Witherow
Strategic Growth Opportunities
Matt Ouimet
Financial Goals
Matt Ouimet
Summary
Matt Ouimet
Q&A |
 Net
Revenue 2011E: ~$1,028
2011E Adj. EBITDA
(a)
~$375
Market Capitalization
(b)
$1,283
($ in millions)
Headquartered in Sandusky, OH
Full-Time Employees
~1,700
Seasonal/Part-Time Employees
~35,000
Facilities:
11
Best-in-Class Amusement Parks
1 Amusement Park Under Contract
6 Separately Gated Water Parks
5 Hotels
(c)
-
~1,700 Rooms
5 Campgrounds, including deluxe RV sites and cabins
2
Marinas
850+ rides and attractions
120+ roller coasters
(a)
As defined on slide 39
(b)
Based on $23.18 unit price as of January 13, 2012 and 55.4 million units
outstanding (c)
One hotel with indoor water park
We entertain more than
23 million guests
annually, generating
more than
$1 billion in revenue
Company Overview
6 |
 7
People Have Choices…
Entertainment of Choice
•
Deliver the “best-day-of-the-year”
experience for our guests
Employer of Choice
•
Respect, value and appreciate
our employees
Investment of Choice
•
Drive attractive total return
Our Approach |
 8
•
Smooth leadership transition
•
Record year in 2011, on top of
record 2010
•
2010 refinancing created significant
financial flexibility
•
Restoration of meaningful unit
distributions
Building Positive Momentum |
 9
Favorable Industry Dynamics
•
Significant barriers to entry
•
Compelling value compared with
other forms of entertainment
•
Recession resilient
•
Loyal, high-repeat customer base
(75%+ repeat visitation)
•
No comparable at-home digital
experience
•
North American focus
Key Investment Considerations |
 10
Proven Ability to Deliver
Results
•
2010 and 2011 –
Record
attendance and Adjusted EBITDA
•
Decades-long, industry-leading
Adjusted EBITDA margins
•
Stable and diversified cash flows
•
Experienced management team
Key Investment Considerations |
 11
Attractive Strategic Growth
Opportunities Exist
•
Enhanced guest experience
•
Improved consumer messaging
•
Dynamic pricing and advance
purchase commitments
•
Premium product offerings
•
Strategic alliance fees and
promotional leverage
•
Capital and expense productivity
Key Investment Considerations |
 12
Total Return Investment
•
Anchored by attractive
distribution yield
•
Unit price appreciation driven by
earnings growth
•
Balanced approach to allocation
of excess cash
Key Investment Considerations |
 Capital Costs
Estimated cost of approximately $500+ million to construct a quality
regional park
•
Limited visibility on return on capital at inception
Real Estate
Requirements
Minimum requirement of 100-150 acres for park
•
Additional
land
generally
required
for
construction
of
roads
and
local
businesses that are complementary to the park (i.e., lodging and
restaurants)
•
Transportation infrastructure in close proximity to the park
Zoning Restrictions
Local governments often believe the negative impact of increased
traffic and environmental effects outweigh promise of increased tax
revenue and job creation
Long Development
Times
Generally requires approximately three years
•
One year used for planning process—feasibility analysis, public approval
process, design development and financing
•
Two years used for construction—procuring and installing rides, show
facilities and other equipment
Few Viable Markets
First mover advantage already taken in key domestic markets
Favorable Industry Dynamics
Significant Barriers to Entry
13 |
 Industry-Leading Adjusted EBITDA Margins
Adjusted
EBITDA
Margins
The Company has some of
the highest Adjusted EBITDA
margins in the industry
We maintain strict cost controls
•
Carefully manage seasonal
staffing levels
•
Minimal corporate overhead
Pricing integrity
•
Strategic use of marketable
discounts to create urgency
•
Value-enhancing special events
and offerings
14
(a)
Source: SEC filings for 2007 –
2010
(b)
Information not available for Six Flags
(a) |
 15
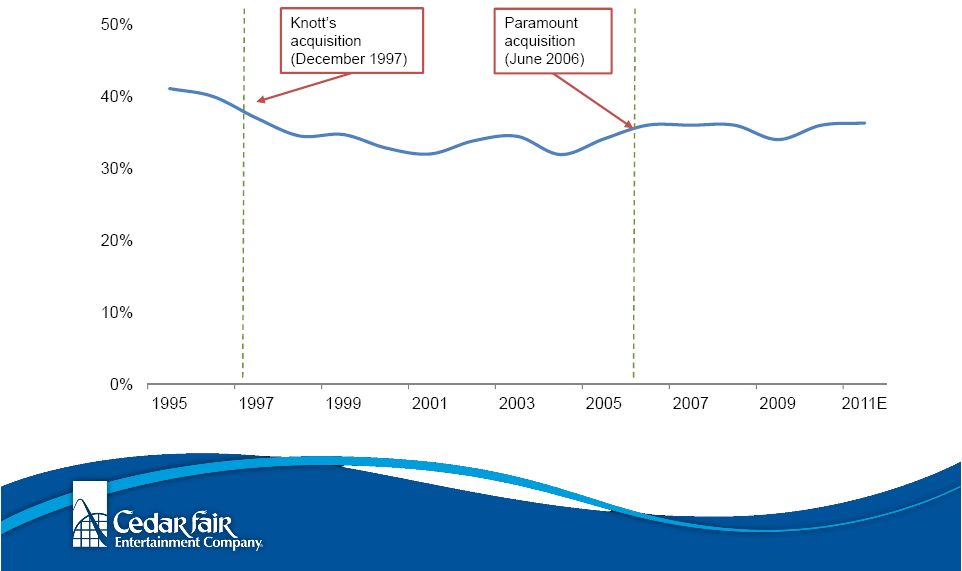
Historical Adjusted EBITDA Margin |
 16
(d)
Acquisition of Geauga Lake in 2004
(e)
Acquisition of Kings Island, Canada’s Wonderland, Kings Dominion, Carowinds
and California’s Great America in 2006
(f)
As defined on slide 39
Note: 2007 to 2011E Adjusted EBITDA represents
Consolidated EBITDA as defined in the 2010 Credit *Agreement (a)
Includes attendance for amusement parks and separately-gated outdoor water
parks (b)
Acquisition of Knott’s Berry Farm in December 1997
(c)
Acquisition
of
Michigan’s
Adventure
and
Knott’s
Soak
City
–
Palm
Springs
in
2001
Stable and Diversified Cash Flows
We generate consistent revenue and cash flow |
 Stable
and Diversified Cash Flows 17
Resilient performance during recessions
(a)
Acquisition of Knott’s Berry Farm in December 1997
(b)
Acquisition
of
Michigan’s
Adventure
and
Knott’s
Soak
City
–
Palm
Springs
in
2001
(c)
Acquisition of Geauga Lake in 2004
(d)
Acquisition of Kings Island, Canada’s Wonderland, Kings Dominion, Carowinds
and California’s Great America in 2006
(e)
As defined on slide 39 |
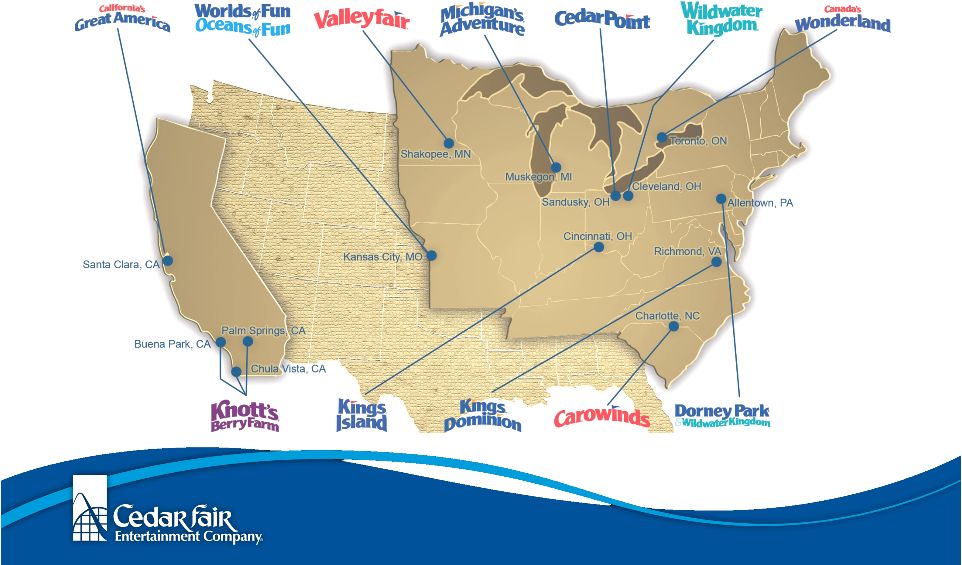 Stable
and Diversified Cash Flows The Company has a national footprint that mitigates
regional economic and weather risk
18 |
 Stable
and Diversified Cash Flows We are not dependent on any one park or region
19 |
 Experienced Management Team
Management team with proven experience both with
Cedar Fair and in the leisure and hospitality industry
Name
Position
Years with
Cedar Fair
Years In
Industry
Matt
A.
Ouimet
(53)
President and Chief Executive Officer
6 mos
22
Richard
A.
Zimmerman
(51)
Chief Operating Officer
21
25
Brian
C.
Witherow
(45)
Executive Vice President and Chief Financial Officer
17
17
H.
Philip
Bender
(56)
Executive Vice President
33
40
David
R.
Hoffman
(43)
Senior Vice President and Chief Accounting Officer
6
6
Craig
J.
Freeman
(58)
Corporate Vice President of Administration
32
32
Duffield
E.
Milkie
(46)
Corporate Vice President and General Counsel
4
4
Robert
A.
Decker
(51)
Corporate Vice President of Planning & Design
13
23
Lee
A.
Alexakos
(55)
Corporate Vice President of Marketing
33
33
20 |
 21
AGENDA
Company Overview &
Key Investment Considerations
Matt Ouimet
Park Review
Richard Zimmerman
Financial Review
Brian Witherow
Strategic Growth Opportunities
Matt Ouimet
Financial Goals
Matt Ouimet
Summary
Matt Ouimet
Q&A |
 Leading operator of high-quality,
well-maintained parks
Balanced mix of families and thrill
seekers
Innovation leader
Seasoned, dedicated management
22
Our Core Strengths |
 23
Our Cornerstones |
 Industry-leading attractions with
long useful lives
•
Thrill rides are unique content that
drive attendance
•
Family rides appeal to all generations
•
Minimal IP royalty payments
Capital investments average 9% of
net revenues
•
Excludes annual maintenance
expense (included in operating
expense on income statement)
•
Combined, capital expenditures and
maintenance represent approximately
18% of revenue spent annually to
maintain and improve asset base
High-Quality, Well-Maintained Parks
24 |
 Innovation Leader
25+ years of record-breaking rides
•
Introduced the world’s first 200-foot,
300-foot and 400-foot-tall coasters
•
Introduced the world’s first corkscrew
element and magnetic launched
coasters
First Halloween Haunt event
•
Successfully rolled out to other parks
within our portfolio
Develop new attraction concepts
•
Low-cost laboratory
•
Dinosaurs Alive!
•
Wind Seeker –
300-foot-tall swing
ride
25
Create and dominate entire
categories of new rides and
attractions |
 Provide the best and highest value
family entertainment in each market
•
Strong regional identity
•
Multi-generational appeal
•
Lifetime guests
•
Extensive presence of classic and
timeless PEANUTS characters
•
High guest satisfaction and repeat
visitation
Balanced Mix of Families and Thrill Seekers
26 |
 Seasoned, Dedicated Management
Our park General Managers have an average of 25 years of
experience with Cedar Fair and 27 years within the industry
27
Name
Park
Years with
Cedar Fair
Years In
Industry
H.
John
Hildebrandt
(62)
Cedar Point
38
38
Raffi
Kaprelyan
(49)
Knott’s Berry Farm
33
33
Norm
Pirtovshek
(57)
Canada’s Wonderland
32
32
Greg
Scheid
(48)
Kings Island
23
24
Bart
Kinzel
(45)
Carowinds
21
21
Pat
Jones
(50)
Kings Dominion
32
32
Jason
McClure
(41)
Dorney Park
11
11
Raul
Rehnborg
(42)
California’s Great America
25
25
Larry
MacKenzie
(55)
Valleyfair
34
34
Frank
Wilburn
(46)
Worlds of Fun
17
21
Camille
Jourden-Mark
(45)
Michigan’s Adventure
11
24 |
 Parks that entertain ~3.0+
million guests on an annual
basis include:
•
Cedar Point –
Sandusky, OH
•
Knott’s Berry Farm –
Buena Park, CA
•
Canada’s Wonderland –
Toronto, ON
•
Kings Island –
Cincinnati, OH
28
Our Parks |
 Parks that entertain ~1.5+
million guests on an annual
basis include:
•
Carowinds –
Charlotte, NC
•
Kings Dominion –
Richmond, VA
•
Dorney Park –
Allentown, PA
•
California’s Great America –
Santa Clara, CA
29
Our Parks |
 Parks that entertain ~1.0
million or fewer guests on an
annual basis include:
•
Valleyfair –
Shakopee, MN
•
Worlds of Fun –
Kansas City, MO
•
Michigan’s Adventure –
Muskegon, MI
30
Our Parks |
 Cedar Point
31
Sandusky, Ohio
Super regional draw –
largest seasonal
amusement park in the U.S.
Named the “Best Amusement Park in
the World”
for 14 consecutive years
(a)
Features five of the top 25 steel roller
coasters in the world
(a)
, four hotels,
two marinas and an upscale campsite
Serves a six-state region in the
Midwest that is home to approximately
26 million people
(a)
Source: Amusement Today, September 2011 |
 Orange County, California
32
Year-round park with renowned
seasonal events including one of the
top-rated Halloween events in the
country
(a)
Includes three separately gated water
parks in California and an adjacent
320-room, full-service hotel
Located in Southern California serving
a market of approximately 20 million
people with a large tourism industry
(a)
Source: Amusement Today, September 2011 |
 33
One of the largest seasonal
amusement parks in the U.S.
Features a children’s area named
“Best
Kids’
Area
in
the
World”
for
eleven
consecutive
years
(a)
Local market includes approximately
15 million people
Cincinnati, Ohio
(a)
Source: Amusement Today, September 2011 |
 34
Toronto, Canada
Largest amusement park in Canada
Hosts several cultural festivals per year
in the park
Serves diverse Toronto metropolitan
market of approximately nine million
people
One of the “Top Three”
destinations in
the world for coaster quantity |
 Broad and compelling rides,
attractions and events
Investing ~$90 million across all of
our properties
Leviathan
–
306-foot-tall, 92-mph roller
coaster at Canada’s Wonderland
•
One of the tallest and fastest roller
coasters in the world
Stinger
–
138-foot-tall inverted shuttle
coaster at Dorney Park
WindSeeker
–
300-foot-tall thrill ride
providing guests with panoramic views at
Carowinds and Kings Dominion
New Fun For 2012
35 |
 Focus on balancing family
attractions and thrill rides
Dinosaurs Alive! –
coming to Cedar Point,
Canada’s Wonderland, Dorney Park and
Kings Dominion
Soak City Water Park –
rebranding and
expansion of water park at Kings Island,
including the addition of a new wave pool
“Luminosity -
Ignite the Night!”
–
a new
night time celebration at Cedar Point
More than 25 new live entertainment shows
General infrastructure improvements and
upgrades include resort refreshment, new
point-of-sale system, and premium guest
experiences
36
New Fun For 2012 |
 37
New Fun for 2012
Leviathan Video |
 38
AGENDA
Company Overview &
Key Investment Considerations
Matt Ouimet
Park Review
Richard Zimmerman
Financial Review
Brian Witherow
Strategic Growth Opportunities
Matt Ouimet
Financial Goals
Matt Ouimet
Summary
Matt Ouimet
Q&A |
 39
Updated Guidance
•
Preliminary results project Net Revenues of ~$1.028 billion
•
Preliminary
results
project
Adjusted
EBITDA(a)
of
~$375
million
•
Both net revenues and Adjusted EBITDA at the high end of previous
guidance
Highlights
•
Entertained
a
record
23.4
million
guests
–
up
3%
year-over-year
•
Average in-park guest per capita spending increased to
$40.03 –
up 2% year-over-year
•
Costs in line with our expectations
2011 Financial Highlights
(a) Adjusted
EBITDA
represents
earnings
before
interest,
taxes, depreciation,
amortization, other non-cash items, and adjustments as defined in the
Amended 2010 Credit Agreement. |
 2011
Financial Highlights Year-over-year record attendance
trends
Season pass visits up significantly
•
High perceived value
•
Strong “influence factor”
Group business improving
Successfully converted some front
gate admissions into season
passes
40
Attendance Breakdown |
 Cash Flow Outlook
41
Cash Flow Outlook
Capital Expenditures
•
~$75 million in 2011
•
~$90 million in 2012
•
~9% of net revenues going forward for organic growth
Cash Interest Costs
•
~$150 million in 2011
•
~$100 million in 2012 and beyond |
 42
Cash Flow Outlook
Cash Taxes
•
~$10 million in 2011
•
Modest increases through 2014 as revenues and income increase
•
Approaching ~$35 million in 2015 as NOLs are exhausted
One-Time Items
•
~$50 million for the termination of a Canadian swap
(February 2012)
•
~$11 million in retirement costs (mid-year 2012)
|
 43
(in millions)
12/31/2011
Revolving
Credit
Loans
(due
2015)
$
– Term Debt:
Term loan averaging 4.0%
(due 2017)
1,156
Notes:
9.125% senior unsecured notes
(due 2018)
400
Less Current Portion
–
Total Long-Term Debt
$ 1,556
Total Leverage Ratio
~4.2x
Senior Secured Leverage Ratio
~3.1x
Debt Profile |
 Debt Profile
44
Debt Profile
•
~$800 million of outstanding term debt has been converted to a
fixed-rate through the use of several interest rate swap
agreements
•
No debt maturities until our revolving credit facility matures in
2015
Revolver capacity = $260 million
•
Cost of debt is expected to be ~6.3% in 2012 down from 9.5% in
2011 |
 Key
Financial Considerations We generate a significant amount of free cash flow
(FCF) •
Record guest attendance and financial results in 2011
•
Additional revenue and FCF growth opportunities in 2012 and beyond
•
Additional FCF from ~$50 million reduction of debt service costs
beginning in 2013
Capital structure provides substantial operating flexibility
•
No longer constrained by credit agreements
•
Staggered debt maturities
•
Predictable financing costs
45
Year-end
earnings
conference
call
on
February
21,
2012
at
10:00
am
ET |
 46
AGENDA
Company Overview &
Key Investment Considerations
Matt Ouimet
Park Review
Richard Zimmerman
Financial Review
Brian Witherow
Strategic Growth Opportunities
Matt Ouimet
Financial Goals
Matt Ouimet
Summary
Matt Ouimet
Q&A |
 Strategic Growth Opportunities
47
There are six key growth
drivers in our business
1.
Enhanced guest experience
2.
Improved consumer messaging
3.
Dynamic pricing and advanced
4.
Premium product offerings
5.
Strategic alliance fees and
6. Capital and expense productivity
purchase commitments
promotional leverage |
 Enhanced Guest
Experience
We deliver compelling value for
the price paid, at every park on
every day
48
“New Fun”
–
Compelling new rides,
shows and events at rational capital
levels
•
Balancing of thrill and family-friendly
offerings to sustain valuable
family
:
teen audience mix
Quality enhancements in food and
resorts to drive greater capture and
support pricing premiums
Extending length-of-stay through
evening events
•
“Luminosity –
Ignite the Night!”
at
Cedar Point in 2012
•
Highly marketable, reprogrammable
seasonally/annually
We deliver compelling
value for the price paid, at
every park, every day |
 Improved Consumer Messaging and
Relationship Management
49
Added resources and capabilities to
modernize our marketing and sales
strategy and execution
•
New agency of record –
Cramer-Krasselt
•
Internal resources added selectively
to support best practice transfer and
enhanced consumer insights
•
Incentive compensation program
implemented for sales force
We speak to consumers
with messages that break
through the noise and
create action within our
operating season
(i.e., urgency) |
 Improved Consumer Messaging and
Relationship Management
50
Improve messaging to drive greater
emotional response
•
Leverages off existing, strong
emotional attachment and multi-
generation memories
•
Supports pricing growth in difficult
economy and re-invigorates lapsed
users
•
“Thrills Connect”
underpinning
designed to encourage larger party
sizes
Adapt media mix to evolving
consumer channels
We speak to consumers
with messages that break
through the noise and
create action within our
operating season
(i.e., urgency) |
 51 |
 52 |
 53 |
 Dynamic Pricing and Advance Purchase
Commitments
54
We offer all consumers
the right price (and no
less), focused on true
incremental behavior
New “accesso”
e-commerce
platform installed
•
Common to other industry players
•
Provides real-time data and dynamic
pricing modification
•
Supports incremental programs
Season pass installment sales and
intelligent up-sell of benefits and
value
•
Reduces reliance on non-aligned
intermediaries
Multi-year migration to “Best Value
Guarantee”
on our site |
 Dynamic Pricing and Advance Purchase
Commitments
55
New “accesso”
e-commerce
platform installed (cont.)
•
Data capture supports customer
relationship management
Advance purchase commitments
provide protection against visitation
disruption events and drives in-park
spending elasticity
We offer all consumers
the right price (and no
less), focused on true
incremental behavior |
 56
Fast Lane to be launched in all
parks; Fright Lane at Halloween
Early entry for resort guests and
strategic partners
Premium parking and dining
experiences
Others under development
Premium Product Offerings
We will continue to
expand our premium
offerings to benefit-
oriented consumers |
 57
•
Experienced business development executive added to drive
appropriate relationships
•
Develops over multiple years
Strategic Alliance Fees and Promotional
Leverage
Industry benchmarking indicates an opportunity to
expand our strategic alliances while still protecting
the integrity of the guest experience |
 Capital and Expense Productivity
58
•
Multi-year strategic plan for capital that protects the base and
supports new reasons to visit
Encouraging manufacturers to innovate at lower costs
•
Avoiding creep in the fixed cost base through removal of inefficient
capacity
•
IT system investments to reduce costs and drive revenue
:
labor
management, POS, financial reporting
•
Undeveloped land reserved for activities and investments that
leverage the installed asset base
“Strategic Admission Drivers”
We apply disciplined metrics to the prioritization of
capital and management of expenses |
 59
AGENDA
Company Overview &
Key Investment Considerations
Matt Ouimet
Park Review
Richard Zimmerman
Financial Review
Brian Witherow
Strategic Growth Opportunities
Matt Ouimet
Financial Goals
Matt Ouimet
Summary
Matt Ouimet
Q&A |
 60
•
Disciplined execution of our business plan
•
Solid balance sheet
FUN is a Total Return Investment
Total Return
1. Quality Distribution
2. Unit Price Appreciation
Reliable and Growing
Sustainable Earnings Growth
Achieved
by
Driving
•
An attractive distribution yield in a low yield environment
•
Record distribution target for 2013 |
 Financial Performance Objectives
•
Target $450+ million in Adjusted EBITDA by 2016
~4% CAGR
•
Sustain margin discipline
•
Target total leverage ratio of <4.0x
Repayment of $25 million term debt in 2012
Opportunistic prepayments beyond 2012
61 |
 Financial Performance Objectives
62
Adjusted EBITDA
(a)
Growth
•
Enhanced guest experience
•
Improved consumer messaging
•
Dynamic pricing and advance
purchase commitments
•
Premium product offerings
•
Strategic alliance fees and
promotional leverage
•
Capital and expense productivity
($ in millions)
Strategic Growth Drivers
(a) As defined on slide 39 |
 Distribution Outlook
•
Anticipate 2012 annual distribution of $1.60 per LP unit
Pay out in $0.40 quarterly cash installments
Implied yield of ~7% at $23 unit price
•
Target record
distribution in excess of $2.00 per LP unit in 2013
•
Considerations for future distribution growth
Growth of FCF
Investment opportunities
Capital structure opportunities
Distribution yield / unit price
63 |
 Distribution Outlook
64
$1.29
$1.43
$1.53
$1.60
$1.66
$1.76
$1.80
$1.84
$1.87
$1.90
$1.92
$1.23
$0.25
$1.00
$1.60
More than
$2.00
$0.00
$0.50
$1.00
$1.50
$2.00
$2.50
1998
1999
2000
2001
2002
2003
2004
2005
2006
2007
2008
2009
2010
2011
2012
2013
Restoring historical distribution commitment |
 65
AGENDA
Company Overview &
Key Investment Considerations
Matt Ouimet
Park Review
Richard Zimmerman
Financial Review
Brian Witherow
Strategic Growth Opportunities
Matt Ouimet
Financial Goals
Matt Ouimet
Summary
Matt Ouimet
Q&A |
 66
Favorable industry dynamics
Proven ability to deliver results
Attractive strategic growth
opportunities exist
Total Return Investment
•
Anchored by attractive
distribution yield
•
Unit price appreciation driven by
earnings growth
•
Balanced approach to allocation
of excess cash
Key Investment Considerations |
 *
*
*
*
*
* |
 APPENDIX |
 EBITDA Adjustments
($ in millions)
12/31/10
12/31/09
EBITDA
$247.6
$307.8
Plus: loss on early extinguishment of debt
35.3
--
Plus: net effect of swaps
18.2
9.2
Plus: unrealized foreign exchange (gain) on Note
(17.5)
--
Plus: equity-based compensation
(0.1)
(0.0)
Plus: loss on impairment of goodwill and other intangibles
2.3
4.5
Plus: loss on impairment / retirement of fixed assets, net
62.8
0.2
Plus: (gain) on sale of other assets
--
(23.1)
Plus: terminated merger costs
10.4
5.6
Plus: refinancing costs
--
0.8
Plus: licensing dispute settlement costs
--
2.0
Plus: class action settlement costs
0.3
9.5
Adjusted EBITDA
$359.2
$316.5
For years prior to 2009, a reconciliation of Adjusted EBITDA to net income (loss)
can be found in our Annual Report on Form 10-K for that year.
|