Attached files
| file | filename |
|---|---|
| EX-21 - SUBSIDIARIES - CEDAR FAIR L P | exhibit212015.htm |
| EX-32 - SECTION 906 CERTIFICATION - CEDAR FAIR L P | cedarfair-q4x2015xex32.htm |
| EX-31.2 - SECTION 302 CERTIFICATION - CEDAR FAIR L P | cedarfair-q4x2015xex312.htm |
| EX-12.1 - RATIO OF EARNINGS TO FIXED CHARGES - CEDAR FAIR L P | exhibit121fixedchargeratio.htm |
| EX-10.21 - EXHIBIT 10.21 - CEDAR FAIR L P | exhibit10212016deferreduni.htm |
| EX-10.18 - EXHIBIT 10.18 - CEDAR FAIR L P | exhibit1018amendment2tothe.htm |
| EX-23 - CONSENT OF INDEPENDENT REGISTERED PUBLIC ACCOUNTING FIRM - CEDAR FAIR L P | exhibit232015.htm |
| EX-31.1 - SECTION 302 CERTIFICATION - CEDAR FAIR L P | cedarfair-q4x2015xex311.htm |
UNITED STATES
SECURITIES AND EXCHANGE COMMISSION
Washington, D.C. 20549
FORM 10-K
(Mark One)
x | ANNUAL REPORT PURSUANT TO SECTION 13 OR 15(d) OF THE SECURITIES EXCHANGE ACT OF 1934 |
For the fiscal year ended: December 31, 2015
OR
o | TRANSITION REPORT PURSUANT TO SECTION 13 OR 15(d) OF THE SECURITIES EXCHANGE ACT OF 1934 |
For the transition period from to .
Commission file number 1-9444
CEDAR FAIR, L.P.
(Exact name of registrant as specified in its charter)
DELAWARE | 34-1560655 | |
(State or other jurisdiction of incorporation or organization) | (I.R.S. Employer Identification No.) | |
One Cedar Point Drive | ||
Sandusky, Ohio | 44870-5259 | |
(Address of principal executive offices) | (Zip Code) | |
Registrant's telephone number, including area code: (419) 626-0830 |
Securities registered pursuant to Section 12(b) of the Act:
Title of each class | Name of each exchange on which registered | |||
Depositary Units (Representing Limited Partner Interests) | New York Stock Exchange | |||
Indicate by check mark if the registrant is a well-known seasoned issuer, as defined in Rule 405 of the Securities Act. Yes x No o
Indicate by check mark if the registrant is not required to file reports pursuant to Section 13 or Section 15(d) of the Act. Yes o No x
Indicate by check mark whether the registrant (1) has filed all reports required to be filed by Section 13 or 15(d) of the Securities Exchange Act of 1934 during the preceding 12 months (or for such shorter period that the registrant was required to file such reports), and (2) has been subject to such filing requirements for the past 90 days. Yes x No o
Indicate by check mark whether the registrant has submitted electronically and posted on its corporate Web site, if any, every Interactive Data File required to be submitted and posted pursuant to Rule 405 of Regulation S-T (§232.405 of this chapter) during the preceding 12 months (or for such shorter period that the registrant was required to submit and post such files). Yes x No o
Indicate by check mark if disclosure of delinquent filers pursuant to Item 405 of Regulation S-K (§229.405 of this chapter) is not contained herein, and will not be contained, to the best of registrant's knowledge, in definitive proxy or information statements incorporated by reference in Part III of this Form 10-K or any amendment to this Form 10-K. o
Indicate by check mark whether the registrant is a large accelerated filer, an accelerated filer, a non-accelerated filer, or a smaller reporting company. See the definitions of “large accelerated filer,” “accelerated filer” and “smaller reporting company” in Rule 12b-2 of the Exchange Act:
Large accelerated filer | x | Accelerated filer | o | |||
Non-accelerated filer | o (Do not check if a smaller reporting company) | Smaller reporting company | o | |||
Indicate by check mark whether the registrant is a shell company (as defined in Rule 12b-2 of the Exchange Act). Yes o No x
The aggregate market value of Depositary Units held by non-affiliates of the Registrant based on the closing price of such units on June 26, 2015 of $55.38 per unit was approximately $3,047,889,483.
Number of Depositary Units representing limited partner interests outstanding as of February 19, 2016: 56,019,973
DOCUMENTS INCORPORATED BY REFERENCE
Part III of this Form 10-K incorporates by reference certain information from the Registrant's definitive proxy statement to be used in connection with its annual meeting of unitholders to be held in June.
************
The Exhibit Index is located on page 63
Page 1 of 84 pages
CEDAR FAIR, L.P.
INDEX
PAGE | |||||
3 | |||||
7 | |||||
11 | |||||
11 | |||||
12 | |||||
12 | |||||
12 | |||||
14 | |||||
15 | |||||
25 | |||||
25 | |||||
56 | |||||
56 | |||||
58 | |||||
58 | |||||
58 | |||||
58 | |||||
59 | |||||
59 | |||||
59 | |||||
62 | |||||
63 | |||||
Consent | 81 | ||||
Certifications | 82 | ||||
PART I
ITEM 1. BUSINESS.
Introduction
Cedar Fair, L.P. (together with its affiliated companies, the "Partnership") is a publicly traded Delaware limited partnership formed in 1987 and managed by Cedar Fair Management, Inc., an Ohio corporation (the "General Partner"), whose shares are held by an Ohio trust. The Partnership is one of the largest regional amusement park operators in the world and owns eleven amusement parks, three outdoor water parks, one indoor water park and five hotels.
In 2015, the Partnership entertained more than 24 million visitors. All of the Partnership's parks are family-oriented, with recreational facilities for people of all ages, and provide clean and attractive environments with exciting rides and entertainment. The amusement parks include: Cedar Point, located on Lake Erie between Cleveland and Toledo in Sandusky, Ohio; Kings Island near Cincinnati, Ohio; Canada's Wonderland near Toronto, Canada; Dorney Park & Wildwater Kingdom (“Dorney Park”), located near Allentown in South Whitehall Township, Pennsylvania; Valleyfair, located near Minneapolis/St. Paul in Shakopee, Minnesota; Michigan's Adventure located near Muskegon, Michigan; Kings Dominion located near Richmond, Virginia; Carowinds in Charlotte, North Carolina; Worlds of Fun located in Kansas City, Missouri; Knott's Berry Farm, located near Los Angeles in Buena Park, California; and California's Great America (“Great America”) located in Santa Clara, California. Additionally, the Partnership has a contract to manage and operate Gilroy Gardens Family Theme Park in Gilroy, California.
The Partnership also owns and operates the Castaway Bay Indoor Waterpark Resort in Sandusky, Ohio, and three separately gated outdoor water parks. Two of the outdoor water parks are located adjacent to Cedar Point and Knott's Berry Farm, and the third is Wildwater Kingdom located near Cleveland in Aurora, Ohio. With limited exceptions, all rides and attractions at the amusement and water parks are owned and operated by the Partnership.
The Partnership's seasonal amusement parks are generally open during weekends beginning in April or May, and then daily from Memorial Day until Labor Day, after which they are open during weekends in September and, in most cases, October. The three outdoor water parks also operate seasonally, generally from Memorial Day to Labor Day, plus some additional weekends before and after this period. As a result, virtually all of the operating revenues of these parks are generated during an approximately 130- to 140-day operating season. Knott's Berry Farm is open daily on a year-round basis. Castaway Bay is generally open daily from Memorial Day to Labor Day, plus a limited daily schedule for the balance of the year. Each park charges a basic daily admission price, which allows unlimited use of most rides and attractions.
The demographic groups that are most important to the parks are young people ages 12 through 24 and families. Families are believed to be attracted by a combination of rides, live entertainment and the clean, wholesome atmosphere. Young people are believed to be attracted by the action-packed rides. During their operating season, the parks conduct active television, radio, newspaper and internet advertising campaigns in their major market areas geared toward these two groups.
Description of Parks
Cedar Point
Cedar Fair's flagship park, Cedar Point, was first developed as a recreational area in 1870. Located on a peninsula in Sandusky, Ohio bordered by Lake Erie and Sandusky Bay, the park is approximately 60 miles west of Cleveland and 100 miles southeast of Detroit. Cedar Point is believed to be the largest seasonal amusement park in the United States, measured by the number of rides and attractions and the hourly ride capacity. Attractive to both families and thrill-seekers, the park features 15 world-class roller coasters, including many record-breakers, and four children's areas. Cedar Point serves a six-state region which includes nearly all of Ohio and Michigan, western Pennsylvania and New York, northern West Virginia and Indiana, as well as southwestern Ontario, Canada. The park's market area includes Cleveland, Detroit, Toledo, Akron, Columbus, Grand Rapids, Flint and Lansing.
Located adjacent to the park is Soak City, a separately gated water park that features more than 20 water rides and attractions, as well as Challenge Park, which features several extra-charge attractions.
Wildwater Kingdom, located near Cleveland, Ohio, is a seasonal water-park that is operated as a division of Cedar Point. The park offers many water rides and attractions, including numerous water slides, a giant wave pool, a lazy river inner tube ride and two children's areas, as well as various food and merchandise shops.
The Partnership also owns and operates four hotels at Cedar Point. The park's only year-round hotel is Castaway Bay Indoor Waterpark Resort, which is located adjacent to the Causeway entrance to the park. Castaway Bay features a tropical Caribbean theme hotel rooms centered around an indoor water park. The park's largest hotel, the historic Hotel Breakers, has various dining and lounge facilities, a mile-long beach, lake swimming, a conference/meeting center, an indoor pool and two outdoor pools. Located near the Causeway entrance to the park, Breakers Express is a limited-service seasonal hotel. In addition to Hotel Breakers and Breakers Express, Cedar Point offers the lake-front Sandcastle Suites Hotel, which features suites, a courtyard pool, tennis courts and a contemporary waterfront restaurant.
The Partnership also owns and operates the Cedar Point Marina, Castaway Bay Marina and Camper Village. Cedar Point Marina is one of the largest full-service marinas on the Great Lakes and provides dock facilities, including floating docks and full guest amenities. In addition, Cedar
3
Point Marina features two restaurants accessible by the general public. Castaway Bay Marina is a full-service marina. Camper Village includes RV campsites and Lighthouse Point, which offers lake-front cottages, cabins and full-service RV campsites.
The Partnership, through a wholly owned subsidiary, owns and operates the Cedar Point Causeway across Sandusky Bay. This Causeway is a major access route to Cedar Point. The Partnership also owns dormitory facilities located near the park that housed approximately 6,400 of the park's seasonal and part-time employees.
Knott's Berry Farm
Knott's Berry Farm, located near Los Angeles in Buena Park, California, first opened in 1920 and was acquired by the Partnership in late 1997. The park is one of several year-round theme parks in Southern California and serves a market area centered in Orange County with a large national and international tourism population.
The park is renowned for its seasonal events, including a special Christmas promotion, “Knott's Merry Farm,” and a Halloween event called “Knott's Scary Farm,” which has been held for more than 40 years and is annually rated one of the best Halloween events in the industry by Amusement Today's international survey.
Adjacent to Knott's Berry Farm is “Knott's Soak City-Orange County,” a separately gated seasonal water park that features more than 20 water rides and attractions.
The Partnership also owns and operates the Knott's Berry Farm Hotel, a full-service hotel located adjacent to Knott's Berry Farm, which features a pool, tennis courts and meeting/banquet facilities.
Canada's Wonderland
Canada's Wonderland, a combination amusement and water park located near Toronto in Vaughan, Ontario, first opened in 1981 and was acquired by the Partnership in June of 2006. It contains more than 200 attractions, including 16 roller coasters, and is one of the most attended regional amusement parks in North America. Canada's Wonderland is in a culturally diverse metropolitan market with large populations of different ethnicities and national origins. Each year the park showcases an extensive entertainment and special event line-up, which includes cultural festivals featuring renowned music artists from around the world.
Kings Island
Kings Island, a combination amusement and water park located near Cincinnati, Ohio, first opened in 1972 and was acquired by the Partnership in June of 2006. Kings Island is one of the largest seasonal amusement parks in the United States, measured by the number of rides and attractions and the hourly ride capacity. The park features a children's area that has been consistently named the "Best Kids' Area in the World" by Amusement Today.
The park's market area includes Cincinnati, Dayton and Columbus, Ohio, Louisville and Lexington, Kentucky, and Indianapolis, Indiana.
Dorney Park
Dorney Park, a combination amusement and water park located near Allentown, in South Whitehall Township, Pennsylvania, was first developed as a summer resort area in 1884 and was acquired by the Partnership in 1992. Dorney Park is one of the largest amusement parks in the Northeastern United State and the park's major markets include Philadelphia, Lancaster, Harrisburg, York, Scranton, Wilkes-Barre, Hazleton and the Lehigh Valley, Pennsylvania, New York City, and New Jersey.
Kings Dominion
Kings Dominion, a combination amusement and water park located near Richmond, Virginia, first opened in 1975 and was acquired by the Partnership in June of 2006. The park's market area includes Richmond and Norfolk, Virginia, Raleigh, North Carolina, Baltimore, Maryland and Washington, D.C.
Additionally, the park offers Kings Dominion Camp Wilderness Campground, a camping area featuring luxury cabins, a swimming pool, playground, volleyball courts, miniature golf, and laundry facilities. The campground also offers a free shuttle service between the campground and amusement park.
The Partnership also owns a dormitory facility located adjacent to Kings Dominion that houses up to 300 of the park's seasonal employees.
4
Carowinds
Carowinds, a combination amusement and water park located in Charlotte, North Carolina, first opened in 1973 and was acquired by the Partnership in June of 2006. Carowinds' major markets include Charlotte, Greensboro, and Raleigh, North Carolina as well as Greenville and Columbia, South Carolina.
The park also offers Camp Wilderness Resort, a camping area that features a convenience and merchandise store, laundry facilities, and a swimming pool. The campground features RV sites, tent and pop-up sites, and luxury cabins. The campground also offers a free shuttle service between the campground and amusement park.
Great America
Great America, a combination amusement and water park located in Santa Clara, California, first opened in 1976 and was acquired by the Partnership in June of 2006. The park draws its visitors primarily from San Jose, San Francisco, Sacramento, Modesto and Monterey, among other cities in northern California.
Valleyfair
Valleyfair, which opened in 1976 and was acquired by the Partnership's predecessor in 1978, is a combination amusement and water park located near Minneapolis-St. Paul in Shakopee, Minnesota. It is the largest amusement park in Minnesota. Valleyfair's market area is centered in Minneapolis-St. Paul, but the park also draws visitors from other areas in Minnesota and surrounding states.
The Partnership also owns a dormitory facility located adjacent to Valleyfair that houses approximately 400 of the park's seasonal employees.
Worlds of Fun
Worlds of Fun, which opened in 1973 and was acquired by the Partnership in 1995, is a combination amusement and water park located in Kansas City, Missouri. Worlds of Fun serves a market area centered in Kansas City, as well as most of Missouri and portions of Kansas and Nebraska.
Worlds of Fun also features Worlds of Fun Village, an upscale camping area that offers overnight guest accommodations next to the park with wood-side cottages, log cabins and deluxe RV sites. Included within the Village is a clubhouse with a swimming pool and arcade games.
Michigan's Adventure
Michigan's Adventure, which was acquired by the Partnership in 2001, is the largest amusement park in Michigan. The combination amusement and water park located near Muskegon, Michigan serves a market area principally from central and western Michigan and eastern Indiana.
5
CAPITAL EXPENDITURES AND WORKING CAPITAL
The Partnership believes that annual park attendance is influenced by the investment in new attractions from year to year. Capital expenditures are planned on a seasonal basis with the majority of such capital expenditures made in the period from October through May, prior to the beginning of the peak operating season. Capital expenditures made in a calendar year may differ materially from amounts identified with a particular operating season because of timing considerations such as weather conditions, site preparation requirements and availability of ride components, which may result in accelerated or delayed expenditures around calendar year-end.
During the operating season, the Partnership carries significant receivables and inventories of food and merchandise, as well as payables and payroll-related accruals. Amounts are substantially reduced in non-operating periods. Seasonal working capital needs are funded with revolving credit facilities, which are established at levels sufficient to accommodate the Partnership's peak borrowing requirements in April and May as the seasonal parks complete preparations for opening. Revolving credit borrowings are reduced daily with the Partnership's positive cash flow during the seasonal operating period.
COMPETITION
In general, the Partnership competes for discretionary spending with all aspects of the recreation industry within its primary market areas, including several destination and regional amusement parks. The Partnership also competes with other forms of entertainment and recreational activities, including movies, sports events, restaurants and vacation travel.
The principal competitive factors in the amusement park industry include the uniqueness and perceived quality of the rides and attractions in a particular park, its proximity to metropolitan areas, the atmosphere and cleanliness of the park, and the quality and variety of the food and entertainment available. The Partnership believes that its amusement parks feature a sufficient quality and variety of rides and attractions, restaurants, gift shops and family atmosphere to make them highly competitive with other parks and forms of entertainment.
GOVERNMENT REGULATION
The Partnership's properties and operations are subject to a variety of federal, state and local environmental, health and safety laws and regulations. Currently, the Partnership believes it is in substantial compliance with applicable requirements under these laws and regulations. However, such requirements have generally become more strict over time, and there can be no assurance that new requirements, changes in enforcement policies or newly discovered conditions relating to its properties or operations will not require significant expenditures in the future.
All rides are operated and inspected daily by both the Partnership's maintenance and ride operations personnel before being put into operation. The parks are also periodically inspected by the Partnership's insurance carrier and, at all parks except Michigan’s Adventure, Valleyfair, Worlds of Fun, and Carowinds' South Carolina rides, by state or county ride-safety inspectors. Valleyfair, Worlds of Fun and Carowinds each contract with a third party to inspect its rides pursuant to Minnesota, Missouri, and South Carolina law, respectively, and submit the third-party report to the respective state agency. Michigan’s Adventure also contracts an outside third party to inspect their rides even though there is no Michigan law requirement. Additionally, all parks have added ride maintenance and operation inspections done by third party qualified inspectors to make sure our standards are being maintained.
EMPLOYEES
The Partnership has approximately 1,900 full-time employees. During the operating season, the Partnership employs in aggregate approximately 37,800 seasonal and part-time employees, many of whom are high school and college students. Approximately 6,400 of Cedar Point's seasonal employees, 400 of Valleyfair's seasonal employees, and 300 of Kings Dominion's seasonal employees live in dormitories owned by the Partnership. The Partnership maintains training programs for all new employees and believes that its relations with its employees are good.
AVAILABLE INFORMATION
Copies of the Partnership's annual report on Form 10-K, quarterly reports on Form 10-Q, and current reports on Form 8-K and all amendments to those reports as filed or furnished with the SEC are available without charge upon written request to the Partnership's Investor Relations Office or through its website (www.cedarfair.com).
We use our website www.cedarfair.com as a channel of distribution of the Partnership's information. The information we post through this channel may be deemed material. Accordingly, investors should monitor this channel, in addition to following our news releases, SEC filings, and public conference calls and webcasts. The contents of our website shall not be deemed to be incorporated herein by reference.
You may read and copy any materials filed with the SEC at the SEC's Public Reference Room at 100 F Street, N.E., Washington, DC 20549. You may obtain information on the operation of the Public Reference Room by calling the SEC at 1-800-SEC-0330. The SEC maintains an Internet site at http://www.sec.gov that contains the Partnership's reports, proxy statements and other information. See Item 6 for Selected Financial Data, including net revenues, net income (loss) and total assets.
6
SUPPLEMENTAL ITEM. Executive Officers of Cedar Fair
Name | Age | Position(s) | |||
Matthew A. Ouimet | 57 | Matt Ouimet has served as Chief Executive Officer since January 2012 and as President since June 2011. Before joining Cedar Fair, Matt served in multiple roles from 2009 through 2010 at Corinthian Colleges, including President and Chief Executive Officer. Prior to joining Corinthian Colleges, he served as President, Hotel Group for Starwood Hotels and Resorts Worldwide from 2006 through 2008. | |||
Richard A. Zimmerman | 55 | Richard Zimmerman has served as Chief Operating Officer since October 2011. Prior to that, he served as Executive Vice President since November 2010, previously serving as Regional Vice President since June 2007 and has been with Cedar Fair since 2006. Richard served as Vice President and General Manager of Kings Dominion from 1998 through 2006. | |||
Brian C. Witherow | 49 | Brian Witherow has served as Executive Vice President and Chief Financial Officer since January 2012. Prior to that, Brian served as Vice President and Corporate Controller beginning in July 2005. Brian has been with Cedar Fair in various other positions since 1995. | |||
H. Philip Bender | 60 | Phil Bender has served as Executive Vice President, Operations, since November 2010, previously serving as Regional Vice President beginning in June 2006. Prior to being promoted to a corporate executive, he served as Vice President and General Manager of Worlds of Fun / Oceans of Fun from 2000 through 2006. | |||
Robert A. Decker | 55 | Rob Decker was promoted to Senior Vice President of Planning & Design in January 2015. Prior to that, Rob served as Corporate Vice President of Planning & Design since the end of 2002, and he has been with Cedar Fair since 1999. Prior to joining Cedar Fair, Rob served as Design Director at Jack Rouse Associates, Inc., a consultant firm to the entertainment industry, from 1989 through 1999. | |||
Craig J. Freeman | 62 | Craig Freeman was promoted to Senior Vice President of Administration in January 2015. Prior to that, he served as Corporate Vice President of Administration since September 2005. Craig served as Vice President and General Manager of Knott’s Camp Snoopy at the Mall of America from 1996 through 2005. | |||
Duffield E. Milkie | 50 | Duff Milkie was promoted to Executive Vice President and General Counsel in January 2015 and has served as Corporate Secretary since February 2012. He served as Corporate Vice President and General Counsel and served as Corporate Secretary from February 2012 to February 2015. He served as Corporate Vice President and General Counsel from February 2008 to February 2012. Prior to joining Cedar Fair, Duff was a partner in the law firm of Wickens, Herzer, Panza, Cook, & Batista from 1998 through 2008. | |||
David R. Hoffman | 47 | Dave Hoffman has served as Senior Vice President and Chief Accounting Officer since January 2012. Prior to that, he served as Vice President of Finance and Corporate Tax since November 2010. He served as Vice President of Corporate Tax from October 2006 until November 2010. Prior to joining Cedar Fair, Dave served as a business advisor with Ernst & Young from 2002 through 2006. | |||
Kelley Semmelroth | 51 | Kelley Semmelroth has served as Executive Vice President and Chief Marketing Officer since February 2012. Prior to joining Cedar Fair, Kelley served as Senior Vice President, Marketing Planning Director for TD Bank from 2010 through 2012. Prior to joining TD Bank, she served as Senior Vice President of Brand Strategy and Management at Bank of America from 2005 through 2010. | |||
ITEM 1A. RISK FACTORS.
We compete for discretionary spending and discretionary free-time with many other entertainment alternatives and are subject to factors that generally affect the recreation and leisure industry, including general economic conditions.
Our parks compete for discretionary spending and discretionary free-time with other amusement, water and theme parks and with other types of recreational activities and forms of entertainment, including movies, sporting events, restaurants and vacation travel. Our business is also subject to factors that generally affect the recreation and leisure industries and are not within our control. Such factors include, but are not limited to, general economic conditions, including relative fuel prices, and changes in consumer tastes and spending habits. Uncertainty regarding regional economic conditions and deterioration in the economy generally may adversely impact attendance figures and guest spending patterns at our parks, and disproportionately affect different demographics of our target customers within our core markets. For example, group sales and season-pass sales, which represent a significant portion of our revenues, are disproportionately affected by general economic conditions. Both attendance and guest per capita spending at our parks are key drivers of our revenues and profitability, and reductions in either can directly and negatively affect revenues and profitability.
Uncertain economic conditions, such as unemployment rates, affect our guests' levels of discretionary spending. A decrease in discretionary spending due to a decline in consumer confidence in the economy, an economic slowdown or deterioration in the economy could adversely affect the frequency with which our guests choose to attend our amusement parks and the amount that our guests spend on our products when they visit. The materialization of these risks could lead to a decrease in our revenues, operating income and cash flows.
7
The operating season at most of our parks is of limited duration, which can magnify the impact of adverse conditions or events occurring within that operating season.
Ten of our amusement parks are seasonal, generally operating during a portion of April or May, then daily from Memorial Day through Labor Day, and during weekends in September and, in most cases, October. Our outdoor water parks also operate seasonally, generally from Memorial Day through Labor Day and during some additional weekends before and after that period. Most of our revenues are generated during this 130- to 140-day annual operating season. As a result, when conditions or events described as risk factors occur during the operating season, particularly during the peak vacation months of July and August or the important fall season, there is only a limited period of time during which the impact of those conditions or events can be mitigated. Accordingly, the timing of such conditions or events may have a disproportionate adverse effect upon our revenues.
Bad or extreme weather conditions can adversely impact attendance at our parks, which in turn would reduce our revenues.
Because most of the attractions at our parks are outdoors, attendance at our parks can be adversely affected by continuous bad or extreme weather and by forecasts of bad or mixed weather conditions, which would negatively affect our revenues. We believe that our ownership of many parks in different geographic locations reduces, but does not completely eliminate, the effect that adverse weather can have on our consolidated results.
The high fixed cost structure of amusement park operations can result in significantly lower margins if revenues decline.
A large portion of our expenses is relatively fixed because the costs for full-time employees, maintenance, utilities, advertising and insurance do not vary significantly with attendance. These fixed costs may increase at a greater rate than our revenues and may not be able to be reduced at the same rate as declining revenues. If cost-cutting efforts are insufficient to offset declines in revenues or are impractical, we could experience a material decline in margins, revenues, profitability and cash flows. Such effects can be especially pronounced during periods of economic contraction or slow economic growth.
Our business depends on our ability to meet our workforce needs.
Our success depends on our ability to attract, motivate and retain qualified employees to keep pace with our needs. If we are unable to do so, our results of operations and cash flows may be adversely affected. In addition, we employ a significant seasonal workforce. We recruit year-round to fill thousands of seasonal staffing positions each season and work to manage seasonal wages and the timing of the hiring process to ensure the appropriate workforce is in place. There is no assurance that we will be able to recruit and hire adequate seasonal personnel as the business requires or that we will not experience material increases in the cost of securing our seasonal workforce in the future.
Increased costs of labor and employee health and welfare benefits may impact our results of operations.
Labor is a primary component in the cost of operating our business. Increased labor costs, due to competition, increased minimum wage or employee benefit costs, including health care costs, or otherwise, could adversely impact our operating expenses. The Patient Protection and Affordable Care Act of 2010 contains provisions which could impact our future health-care costs. Continued increases to both market wage rates and the statutory minimum wage rates could also materially impact our future seasonal labor rates. It is possible that these changes could significantly increase our labor costs, which would adversely affect our operating results and cash flows.
If we lose key personnel, our business may be adversely affected.
Our success depends in part upon a number of key employees, including our senior management team, whose members have been involved in the leisure and hospitality industries for an average of more than 20 years. The loss of services of our key employees could have a material adverse effect on our business.
Our growth strategy may not achieve the anticipated results.
Our future success will depend on our ability to grow our business, including capital investments to improve our parks through new rides and attractions, as well as in-park product offerings and product offerings outside of our parks. Our growth and innovation strategies require significant commitments of management resources and capital investments and may not grow our revenues at the rate we expect or at all. As a result, we may not be able to recover the costs incurred in developing our new projects and initiatives or to realize their intended or projected benefits, which could have a material adverse effect on our business, financial condition or results of operations.
Cyber-security risks and the failure to maintain the integrity of internal or customer data could result in damages to our reputation and/or subject us to costs, fines or lawsuits.
In the normal course of business, we collect and retain large volumes of internal and customer data, including credit card numbers and other personally identifiable information, which is used for target marketing and promotional purposes, and our various information technology systems enter, process, summarize and report such data. We also maintain personally identifiable information about our employees. The integrity and protection of such data is critical to our business, and our guests and employees have a high expectation that we will adequately protect their personal information. The regulatory environment, as well as the requirements imposed on us by the credit card industry, governing information, security and privacy laws is increasingly demanding and continues to evolve. Maintaining compliance with applicable security and privacy regulations may increase our operating costs and/or adversely impact our ability to market our parks, products and services to our guests. Furthermore, if a person is able to circumvent our security measures, he or she could destroy or steal valuable information or disrupt our operations. Any security breach could expose us to risks of data loss, which could harm our reputation and result in remedial and other costs, fines or lawsuits. Although we carry liability insurance to cover this risk, there can be no assurance that our coverage will be adequate to cover liabilities, or that we will be able to obtain adequate coverage should a catastrophic incident occur.
There is a risk of incidents occurring at amusement parks, which may reduce attendance and negatively impact our revenues.
The safety of our guests and employees is one of our top priorities. All of our amusement parks feature thrill rides. There are inherent risks involved with these attractions, and an accident or a serious injury at any of our amusement parks may result in negative publicity and could
8
reduce attendance and result in decreased revenues. In addition, accidents or injuries at parks operated by our competitors could influence the general attitudes of amusement park patrons and adversely affect attendance at our amusement parks. Other types of incidents such as food borne illnesses which have either been alleged or proven to be attributable to our parks or our competitors, could adversely affect attendance revenues.
Our operations, our workforce and our ownership of property subject us to various laws and regulatory compliance, which may create uncertainty regarding future expenditures and liabilities.
We may be required to incur costs to comply with regulatory requirements, such as those relating to employment practices, environmental requirements, and other regulatory matters, and the costs of compliance, investigation, remediation, litigation, and resolution of regulatory matters could be substantial. We are subject to extensive federal and state employment laws and regulations, including wage and hour laws and other pay practices and employee record-keeping requirements. We periodically may have to defend against lawsuits asserting non-compliance. Such lawsuits can be costly, time consuming and distract management, and adverse rulings in these types of claims could negatively affect our business, financial condition or results.
We also are subject to federal, state and local environmental laws and regulations such as those relating to water resources; discharges to air, water and land; the handling and disposal of solid and hazardous waste; and the cleanup of properties affected by regulated materials. Under these laws and regulations, we may be required to investigate and clean up hazardous or toxic substances or chemical releases from current or formerly owned or operated facilities or to mitigate potential environmental risks. Environmental laws typically impose cleanup responsibility and liability without regard to whether the relevant entity knew of or caused the presence of the contaminants. The costs of investigation, remediation or removal of regulated materials may be substantial, and the presence of those substances, or the failure to remediate a property properly, may impair our ability to use, transfer or obtain financing regarding our property.
Unanticipated construction delays in completing capital improvement projects in our parks and resort facilities, significant ride downtime, or other unplanned park closures could adversely affect our revenues.
A principal competitive factor for an amusement park is the uniqueness and perceived quality of its rides and attractions in a particular market area. Accordingly, the regular addition of new rides and attractions is important, and a key element of our revenue growth is strategic capital spending on new rides and attractions. Any construction delays or ride down-time can adversely affect our attendance and our ability to realize revenue growth. Further, when rides, attractions, or an entire park, have unplanned downtime and/or closures, our revenue could be adversely affected.
Instability in general economic conditions could impact our profitability and liquidity while increasing our exposure to counter-party risk.
The existence of unfavorable general economic conditions, such as high unemployment rates, constrained credit markets, and higher prices for consumer goods, may hinder the ability of those with which we do business, including vendors, concessionaires and customers, to satisfy their obligations to us. Our exposure to credit losses will depend on the financial condition of our vendors, concessionaires and customers and other factors beyond our control, such as deteriorating conditions in the world economy or in the theme/amusement park industry. The presence of market turmoil, coupled with a reduction of business activity, generally increases our risks related to our status as an unsecured creditor of most of our vendors, concessionaires and customers. Credit losses, if significant, would have a material adverse effect on our business, financial condition and results of operations. Moreover, these issues could also increase the counter-party risk inherent in our business, including with our suppliers, vendors and financial institutions with which we enter into hedging agreements and long-term debt agreements, such as our credit facilities. The soundness of these counter-parties could adversely affect us. Our credit evaluations may be inaccurate and we cannot assure you that credit performance will not be materially worse than anticipated, and, as a result, materially and adversely affect our business, financial position and results of operations.
Our debt agreements contain restrictions that could limit our flexibility in operating our business.
Our credit agreement and the indentures governing our notes contain, and any future indebtedness of ours will likely contain, a number of covenants that could impose significant operating and financial restrictions on us, including restrictions on our and our subsidiaries' ability to, among other things:
• | pay distributions on or make distributions in respect of our capital stock or units or make other restricted payments; |
• | incur additional debt or issue certain preferred equity; |
• | make certain investments; |
• | sell certain assets; |
• | create restrictions on distributions from restricted subsidiaries; |
• | create liens on certain assets to secure debt; |
• | consolidate, merge, amalgamate, sell or otherwise dispose of all or substantially all of our assets; |
• | enter into certain transactions with our affiliates; and |
• | designate our subsidiaries as unrestricted subsidiaries. |
The 2013 Credit Agreement requires us to maintain specified financial ratios, which if breached for any reason and not cured, could result in an event of default under the agreement. The most restrictive of these ratios is the Consolidated Leverage Ratio. At the end of the fourth quarter of 2015 and 2014, this ratio was set at 5.75x and 6.00x consolidated total debt (excluding the revolving debt)-to-consolidated EBITDA, respectively. The ratio decreased by 0.25x at the beginning of the second quarter and will decrease each second quarter until it reaches 5.25x. As of December 31, 2015 and 2014 , we were in compliance with this ratio and all other covenants under the 2013 Credit Agreement. The 2013 Credit Agreement allows restricted payments of up to $60 million annually so long as no default or event of default has occurred and is continuing
9
and so long as the Partnership would be in compliance with certain financial ratios after giving effect to the payments. Additional restricted payments are allowed to be made based on an Excess-Cash-Flow formula, should our pro-forma Consolidated Leverage Ratio be less than or equal to 5.00x.
The indentures governing our notes also include annual restricted payment limitations and additional permitted payment formulas. We can make restricted payments of $60 million annually so long as no default or event of default has occurred and is continuing. Our ability to make additional restricted payments is permitted should our pro forma Total Indebtedness-to-Consolidated-Cash-Flow Ratio be less than or equal to 5.00x.
Variable rate indebtedness subjects us to the risk of higher interest rates, which could cause our future debt service obligations to increase.
As of December 31, 2015, after giving consideration to current outstanding interest-rate swap arrangements, most of our indebtedness under our term loan facility accrues interest that is either fixed or swapped to a fixed rate. After the expiration of outstanding interest-rate swap agreements, certain of our borrowings may be at variable rates of interest and expose us to interest rate risk. If interest rates increase, our annual debt service obligations on any variable-rate indebtedness would increase even though the amount borrowed remained the same, and our net income would decrease.
The amount of our indebtedness could adversely affect our ability to raise additional capital to fund our operations, limit our ability to react to changes in the economy or our industry and prevent us from fulfilling our obligations under our debt agreements.
We had $1,575.2 million of outstanding indebtedness as of December 31, 2015 (after giving effect to $16.3 million of outstanding letters of credit under our revolving credit facility.
The amount of our indebtedness could have important consequences. For example, it could:
• | limit our ability to borrow money for our working capital, capital expenditures, debt service requirements, strategic initiatives or other purposes; |
• | limit our flexibility in planning or reacting to changes in business and future business operations; and |
• | make it more difficult for us to satisfy our obligations with respect to our indebtedness, and any failure to comply with the obligations of any of our debt instruments, including restrictive covenants and borrowing conditions, could result in an event of default under the agreements governing other indebtedness. |
In addition, we may not be able to generate sufficient cash flow from operations, or be able to draw under our revolving credit facility or otherwise, in an amount sufficient to fund our liquidity needs, including the payment of principal and interest on our debt obligations. If our cash flows and capital resources are insufficient to service our indebtedness, we may be forced to reduce or delay capital expenditures, sell assets, seek additional capital or restructure or refinance our indebtedness. These alternative measures may not be successful and may not permit us to meet our scheduled debt service obligations. Our ability to restructure or refinance our debt in the future will depend on the condition of the capital markets and our financial condition at such time. Any refinancing of our debt could be at higher interest rates and may require us to comply with more onerous covenants, which could further restrict our business operations. In addition, the terms of our existing or future debt agreements, including our credit agreement and the indenture governing our notes, may restrict us from adopting some of these alternatives. In the absence of such operating results and resources, we could face substantial liquidity problems and might be required to dispose of material assets or operations to meet our debt service and other obligations. We may not be able to consummate those dispositions for fair market value or at all. Furthermore, any proceeds that we could realize from any such dispositions may not be adequate to meet our debt service obligations then due.
Despite the amount of our indebtedness, we may be able to incur significant additional amounts of debt, which could further exacerbate the risks associated with the amount of our indebtedness.
Our insurance coverage may not be adequate to cover all possible losses that we could suffer, and our insurance costs may increase.
Companies engaged in the amusement park business may be sued for substantial damages in the event of an actual or alleged accident. An accident occurring at our parks or at competing parks could reduce attendance, increase insurance premiums, and negatively impact our operating results. Although we carry liability insurance to cover this risk, there can be no assurance that our coverage will be adequate to cover liabilities, that we will be able to obtain coverage at commercially reasonable rates, or that we will be able to obtain adequate coverage should a catastrophic incident occur at our parks or at other parks.
Our tax treatment is dependent on our status as a partnership for federal income tax purposes. If the tax laws were to treat us as a corporation or we become subject to a material amount of entity-level taxation, it may substantially reduce the amount of cash available for distribution to our unitholders.
We are a limited partnership under Delaware law and are treated as a partnership for federal income tax purposes. A change in current tax law may cause us to be taxed as a corporation for federal income tax purposes or otherwise subject us to taxation as an entity. If we were treated as a corporation for federal income tax purposes, we would pay federal income tax on our entire taxable income at the corporate tax rate, rather than only on the taxable income from our corporate subsidiaries, and may be subject to additional state taxes at varying rates. Further, unitholder distributions would generally be taxed again as corporate distributions or dividends and no income, gains, losses, or deductions would flow through to unitholders. Because additional entity level taxes would be imposed upon us as a corporation, our cash available for distribution could be substantially reduced. Although we are not currently aware of any legislative proposal that would adversely impact our treatment as a partnership, we are unable to predict whether any changes or other proposals will ultimately be enacted.
Other factors, including local events, natural disasters and terrorist activities, could adversely impact park attendance and our revenues.
Lower attendance may result from various local events, natural disasters or terrorist activities, all of which are outside of our control.
10
ITEM 1B. UNRESOLVED STAFF COMMENTS.
None.
ITEM 2. PROPERTIES.
Cedar Point and Soak City are located on approximately 365 acres, virtually all of which have been developed, on the Cedar Point peninsula in Sandusky, Ohio. Wildwater Kingdom, located near Cleveland, Ohio, is situated on approximately 670 total acres, of which 65 acres have been developed and are in use at the water park and an additional 65 acres are available for future expansion. The remaining acreage is available for sale.
The Partnership also owns approximately 100 acres of property on the mainland adjoining the approach to the Cedar Point Causeway. The Breakers Express hotel, the Castaway Bay Indoor Waterpark Resort and an adjoining restaurant, Castaway Bay Marina and two seasonal-employee housing complexes are located on this property.
The Partnership controls, through ownership or an easement, a six-mile public highway and owns approximately 40 acres of vacant land adjacent to this highway, which is a secondary access route to Cedar Point and serves about 250 private residences. The roadway is maintained by the Partnership pursuant to deed provisions. The Cedar Point Causeway, a four-lane roadway across Sandusky Bay, is the principal access road to Cedar Point and is owned by a subsidiary of the Partnership.
The Partnership purchased approximately 100 acres of property for development on the mainland located along an approaching public highway to Cedar Point. This land is intended to be used to develop a youth sporting complex.
Knott's Berry Farm and Knott's Soak City-Orange County, located in California, are situated on approximately 170 acres, virtually all of which have been developed.
Kings Island, located in Ohio, is situated on approximately 680 acres, of which 330 acres have been developed and 350 acres remain available for future expansion.
Canada's Wonderland, located near Toronto in Vaughn, Ontario, is situated on approximately 295 acres, virtually all of which have been developed.
Kings Dominion, located in Virginia, is situated on approximately 740 acres, of which 280 acres have been developed and 460 acres remain available for future expansion.
Dorney Park, located in Pennsylvania, is situated on approximately 210 acres, of which 180 acres have been developed and 30 acres remain available for future expansion.
Carowinds, located in Charlotte, North Carolina, is situated on approximately 400 acres, of which 300 acres have been developed and 100 acres remain available for future expansion.
Valleyfair, located in Minnesota, is situated on approximately 190 acres, of which 110 acres have been developed and approximately 80 additional acres remain available for future expansion.
Worlds of Fun / Oceans of Fun, located in Missouri, is situated on approximately 350 acres, of which 250 acres have been developed and 100 acres remain available for future expansion or other uses.
Great America, located in California, is situated on approximately 165 acres, virtually all of which have been developed.
Michigan's Adventure, located in Michigan, is situated on approximately 260 acres, of which 120 acres have been developed and 140 acres remain available for future expansion.
All of the Partnership's property is owned in fee simple, with the exception of Great America in Santa Clara, California, and portions of the six-mile public highway that serves as secondary access route to Cedar Point, and is encumbered by the Partnership's credit agreement. The Partnership leases the land at Great America from the City of Santa Clara through a long-term lease agreement that is renewable in 2039 with options to terminate at the Partnership's discretion. The Partnership considers its properties to be well maintained, in good condition and adequate for its present uses and business requirements.
11
ITEM 3. LEGAL PROCEEDINGS.
Ortegon, et al vs. Cedar Fair, L.P., Cedar Fair Management Company, et al
The Partnership and Cedar Fair Management, Inc. were defendants in a class action lawsuit filed in Superior Court of the State of California for Santa Clara County on October 3, 2013 by Frank Ortegon-Ramirez seeking damages and injunctive relief for claims related to certain employment and pay practices at our parks in California, including those related to certain check-out, time reporting, discharge and pay statement practices. The defendants filed an answer on November 21, 2013 denying the allegations in the complaint and requesting a dismissal of all claims. On November 12, 2014, the Partnership participated in a mediation relating to the claims alleged in the lawsuit. Following this mediation, the Partnership negotiated a $4.75 million settlement with the named Plaintiff on a class wide basis which was subject to final court approval. On September 28, 2015, the court granted final approval of the proposed settlement and the amounts were paid during the fourth quarter.
ITEM 4. MINE SAFETY DISCLOSURES.
Not applicable.
PART II - OTHER INFORMATION
ITEM 5. MARKET FOR REGISTRANT'S DEPOSITARY UNITS, RELATED UNITHOLDER MATTERS AND ISSUER PURCHASES OF DEPOSITARY UNITS.
Cedar Fair, L.P. Depositary Units representing limited partner interests are listed for trading on The New York Stock Exchange under the symbol “FUN.” As of January 31, 2016, there were approximately 5,800 registered holders of Cedar Fair, L.P. Depositary Units, representing limited partner interests. Attention is directed to Item 12 in this Form 10-K for information regarding the Partnership's equity incentive plan, which information is incorporated herein by reference. The cash distributions declared and the high and low prices of the Partnership's units for each quarter of the past two years are shown in the table below:
2015 | Distribution | High | Low | ||||||||
4th quarter | $ | 0.83 | $ | 59.00 | $ | 50.60 | |||||
3rd quarter | 0.75 | 58.12 | 48.94 | ||||||||
2nd quarter | 0.75 | 60.64 | 54.78 | ||||||||
1st quarter | 0.75 | 58.94 | 47.00 | ||||||||
2014 | |||||||||||
4th quarter | $ | 0.75 | $ | 48.25 | $ | 42.75 | |||||
3rd quarter | 0.70 | 53.15 | 45.05 | ||||||||
2nd quarter | 0.70 | 55.77 | 48.84 | ||||||||
1st quarter | 0.70 | 54.70 | 47.21 | ||||||||
The Partnership's credit agreement includes provisions that allow the Partnership to make restricted payments up to $60 million annually at the discretion of the Board of Directors, so long as no default or event of default has occurred and is continuing and so long as the Partnership would be in compliance with certain financial ratios after giving effect to the payments. Additional restricted payments are allowed to be made based on an Excess-Cash-Flow formula, should the Partnership’s pro-forma Consolidated Leverage Ratio be less than or equal to 5.0x as measured quarterly utilizing trailing twelve month information.
Under the indentures governing our notes, the Partnership can make restricted payments of $60 million annually so long as no default or event of event of default has occurred and is continuing, and additional restricted payments may be made if the Partnership's pro-forma trailing-twelve-month Total Indebtedness-to-consolidated-Cash-Flow ratio would be less than or equal to 5.00x.
12
Issuer Purchases of Equity Securities
The following table presents information about repurchases of Cedar Fair, L.P. Depositary Units representing limited partner interests made by the Partnership during the fourth quarter of fiscal 2015:
Period | (a) Total Number of Units Purchased (1) | (b) Average Price Paid per Unit | (c) Total Number of Units Purchased as Part of Publicly Announced Plans or Programs | (d) Maximum Number (or Approximate Dollar Value) of Units that May Yet Be Purchased Under the Plans or Programs | ||||||||||||
September 28 - October 27 | $ | — | $ | — | $ | — | $ | — | ||||||||
October 28 - November 29 | 268 | 57.00 | — | — | ||||||||||||
November 30 - December 31 | 15,770 | 55.84 | — | — | ||||||||||||
$ | 16,038 | $ | 55.86 | $ | — | $ | — | |||||||||
(1) | All of the units reported as purchased are attributable to units that were reacquired by the Partnership in satisfaction of tax obligations related to the vesting of restricted units which were granted under the Cedar Fair, L.P. 2008 Omnibus Incentive Plan. |
Unitholder Return Performance Graph
The graph below shows a comparison of the five-year cumulative total return (assuming all distributions/dividends reinvested) on Cedar Fair, L.P. limited partnership units, the S&P 500 Index, the S&P 400 Index and the S&P - Movies and Entertainment Index, assuming investment of $100 on December 31, 2010.
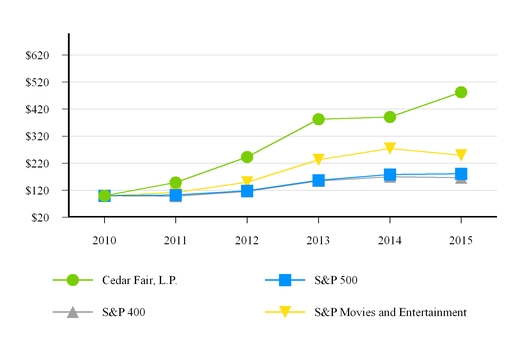
Base Period | Return | |||||||||||||||||||||||||
2010 | 2011 | 2012 | 2013 | 2014 | 2015 | |||||||||||||||||||||
Cedar Fair, L.P. | $ | 100.00 | $ | 148.63 | $ | 243.39 | $ | 382.79 | $ | 391.16 | $ | 482.22 | ||||||||||||||
S&P 500 | 100.00 | 102.11 | 118.45 | 156.81 | 178.28 | 180.78 | ||||||||||||||||||||
S&P 400 | 100.00 | 98.27 | 115.84 | 154.65 | 169.76 | 166.06 | ||||||||||||||||||||
S&P Movies and Entertainment | 100.00 | 111.34 | 149.91 | 233.21 | 274.76 | 249.36 | ||||||||||||||||||||
13
ITEM 6. SELECTED FINANCIAL DATA.
2015 (1) | 2014 (2) | 2013 (3) | 2012 (4) | 2011 | ||||||||||||||||
(In thousands, except per unit and per capita amounts) | ||||||||||||||||||||
Statement of Operations | ||||||||||||||||||||
Net revenues | $ | 1,235,778 | $ | 1,159,605 | $ | 1,134,572 | $ | 1,068,454 | $ | 1,028,472 | ||||||||||
Operating income | 295,331 | 278,332 | 301,761 | 233,675 | 227,946 | |||||||||||||||
Income before taxes | 134,414 | 114,100 | 128,447 | 133,614 | 73,173 | |||||||||||||||
Net income | 112,222 | 104,215 | 108,204 | 101,857 | 65,296 | |||||||||||||||
Net income per unit - basic | 2.01 | 1.88 | 1.95 | 1.83 | 1.18 | |||||||||||||||
Net income per unit - diluted | 1.99 | 1.86 | 1.94 | 1.82 | 1.17 | |||||||||||||||
Balance Sheet Data | ||||||||||||||||||||
Total assets | $ | 1,994,907 | $ | 2,038,319 | $ | 2,014,627 | $ | 2,019,865 | $ | 2,047,168 | ||||||||||
Working capital (deficit) | (2,457 | ) | 5,498 | 27,698 | 2,904 | (104,928 | ) | |||||||||||||
Long-term debt | 1,556,375 | 1,558,850 | 1,520,632 | 1,532,180 | 1,556,379 | |||||||||||||||
Partners' equity | 57,009 | 96,217 | 139,131 | 154,451 | 136,350 | |||||||||||||||
Distributions | ||||||||||||||||||||
Declared per limited partner unit | $ | 3.08 | $ | 2.85 | $ | 2.58 | $ | 1.60 | $ | 1.00 | ||||||||||
Paid per limited partner unit | 3.08 | 2.85 | 2.58 | 1.60 | 1.00 | |||||||||||||||
Other Data | ||||||||||||||||||||
Depreciation and amortization | $ | 125,631 | $ | 124,286 | $ | 122,487 | $ | 126,306 | $ | 125,837 | ||||||||||
Adjusted EBITDA (5) | 459,238 | 431,280 | 425,430 | 390,954 | 374,576 | |||||||||||||||
Capital expenditures | 175,865 | 166,719 | 120,488 | 96,232 | 90,190 | |||||||||||||||
Combined attendance (6) | 24,448 | 23,305 | 23,519 | 23,300 | 23,386 | |||||||||||||||
Combined in-park guest per capita spending (7) | $ | 46.20 | $ | 45.54 | $ | 44.15 | $ | 41.95 | $ | 40.03 | ||||||||||
(1) | Operating results for 2015 include a non-cash charge of $8.6 million for the impairment of a long-lived asset at Cedar Point. |
(2) | Operating results for 2014 include a charge of $29.3 million for the loss on early debt extinguishment and a non-cash charge of $2.4 million for the impairment of long-lived assets at Wildwater Kingdom. |
(3) | Operating results for 2013 include a non-cash charge of $34.6 million for the loss on early debt extinguishment. |
(4) | Operating results for 2012 include a non-cash charge of $25.0 million for the impairment of long-lived assets at Wildwater Kingdom. |
(5) | Adjusted EBITDA represents earnings before interest, taxes, depreciation, amortization, other non-cash items, and adjustments as defined in our current credit agreement. Adjusted EBITDA is not a measurement of operating performance computed in accordance with GAAP and should not be considered as a substitute for operating income, net income or cash flows from operating activities computed in accordance with GAAP. We believe that Adjusted EBITDA is a meaningful measure of park-level operating profitability and we use it for measuring returns on capital investments, evaluating potential acquisitions, determining awards under incentive compensation plans, and calculating compliance with certain loan covenants. Adjusted EBITDA may not be comparable to similarly titled measures of other companies. A reconciliation of net income to Adjusted EBITDA is provided below. |
(6) | Combined attendance includes attendance figures from the eleven amusement parks and all separately gated outdoor water parks. |
(7) | Combined in-park guest per capita spending ("per capita spending") includes all amusement park, outdoor water park, causeway tolls and parking revenues for the amusement park and water park operating seasons. Revenues from indoor water park, hotel, campground, marina and other out-of-park operations are excluded from per capita statistics. |
14
We believe that Adjusted EBITDA (earnings before interest, taxes, depreciation, amortization, other non-cash items, and adjustments as defined in our credit agreement) is a meaningful measure of park-level operating profitability and we use it for measuring returns on capital investments, evaluating potential acquisitions, determining awards under incentive compensation plans, and calculating compliance with certain loan covenants. Adjusted EBITDA is provided in the discussion of results of operations that follows as a supplemental measure of our operating results and is not intended to be a substitute for operating income, net income or cash flows from operating activities as defined under generally accepted accounting principles. In addition, Adjusted EBITDA may not be comparable to similarly titled measures of other companies.
Reconciliation of Net Income to Adjusted EBITDA:
2015 | 2014 | 2013 | 2012 | 2011 | ||||||||||||||||
(In thousands ) | ||||||||||||||||||||
Net income | $ | 112,222 | $ | 104,215 | $ | 108,204 | $ | 101,857 | $ | 65,296 | ||||||||||
Interest expense | 86,849 | 96,286 | 103,071 | 110,619 | 157,185 | |||||||||||||||
Interest income | (64 | ) | (126 | ) | (154 | ) | (68 | ) | (157 | ) | ||||||||||
Provision for taxes | 22,192 | 9,885 | 20,243 | 31,757 | 7,877 | |||||||||||||||
Depreciation and amortization | 125,631 | 124,286 | 122,487 | 126,306 | 125,837 | |||||||||||||||
EBITDA | 346,830 | 334,546 | 353,851 | 370,471 | 356,038 | |||||||||||||||
Loss on early debt extinguishment | — | 29,261 | 34,573 | — | — | |||||||||||||||
Net effect of swaps | (6,884 | ) | (2,062 | ) | 6,883 | (1,492 | ) | (13,119 | ) | |||||||||||
Unrealized foreign currency loss (gain) | 80,946 | 40,883 | 29,085 | (9,181 | ) | 9,830 | ||||||||||||||
Equity-based compensation | 15,470 | 12,536 | 5,535 | 3,265 | (239 | ) | ||||||||||||||
Loss on impairment/retirement of fixed assets, net | 20,873 | 9,757 | 2,539 | 30,336 | 11,355 | |||||||||||||||
Gain on sale of other assets | — | (921 | ) | (8,743 | ) | (6,625 | ) | — | ||||||||||||
Terminated merger costs | — | — | — | — | 230 | |||||||||||||||
Refinancing costs | — | — | — | — | 955 | |||||||||||||||
Class action settlement costs | 259 | 4,953 | — | — | — | |||||||||||||||
Other non-recurring costs (1) | 1,744 | 2,327 | 1,707 | 4,180 | 9,526 | |||||||||||||||
Adjusted EBITDA | $ | 459,238 | $ | 431,280 | $ | 425,430 | $ | 390,954 | $ | 374,576 | ||||||||||
(1) | The Company's current and prior credit agreements reference certain costs as non-recurring or unusual. These items are excluded in the calculation of Adjusted EBITDA and have included litigation expenses and costs for SEC compliance matters related to Special Meeting requests, costs associated with certain unusual ride abandonment and relocation expenses, and costs associated with the transition to a new advertising agency. |
ITEM 7. | MANAGEMENT'S DISCUSSION AND ANALYSIS OF FINANCIAL CONDITION AND RESULTS OF OPERATIONS. |
Business Overview
We generate our revenues primarily from sales of (1) admission to our parks, (2) food, merchandise and games inside our parks, and (3) hotel rooms, food and other attractions outside our parks. Our principal costs and expenses, which include salaries and wages, advertising, maintenance, operating supplies, utilities and insurance, are relatively fixed and do not vary significantly with attendance.
Each of our properties is overseen by a park general manager and operates autonomously. Management reviews operating results, evaluates performance and makes operating decisions, including the allocation of resources, on a property-by-property basis.
Discrete financial information and operating results are prepared at the individual park level for use by the CEO, who is the Chief Operating Decision Maker (CODM), as well as by the Chief Financial Officer, the Chief Operating Officer, the Executive Vice President of Operations, and the park general managers.
15
The following table presents certain financial data expressed as a percent of total net revenues and selective statistical information for the periods indicated.
For the years ended December 31, | 2015 | 2014 | 2013 | |||||||||||||||||||
( amounts in millions, except attendance, per capita spending and percentages) | ||||||||||||||||||||||
Net revenues: | ||||||||||||||||||||||
Admissions | $ | 687.4 | 55.6 | % | $ | 661.5 | 57.0 | % | $ | 647.0 | 57.0 | % | ||||||||||
Food, merchandise and games | 398.0 | 32.2 | % | 365.5 | 31.5 | % | 356.1 | 31.4 | % | |||||||||||||
Accommodations and other | 150.3 | 12.2 | % | 132.6 | 11.4 | % | 131.5 | 11.6 | % | |||||||||||||
Net revenues | 1,235.7 | 100.0 | % | 1,159.6 | 100.0 | % | 1,134.6 | 100.0 | % | |||||||||||||
Operating costs and expenses | 793.9 | 64.2 | % | 748.1 | 64.5 | % | 716.5 | 63.2 | % | |||||||||||||
Depreciation and amortization | 125.6 | 10.2 | % | 124.2 | 10.7 | % | 122.5 | 10.8 | % | |||||||||||||
Loss on impairment / retirement of fixed assets | 20.9 | 1.7 | % | 9.8 | 0.8 | % | 2.5 | 0.2 | % | |||||||||||||
Gain on sale of other assets | — | — | % | (0.9 | ) | (0.1 | )% | (8.7 | ) | (0.8 | )% | |||||||||||
Operating income | 295.3 | 23.9 | % | 278.4 | 24.0 | % | 301.8 | 26.6 | % | |||||||||||||
Interest and other expense, net | 86.8 | 7.0 | % | 96.2 | 8.3 | % | 102.9 | 9.0 | % | |||||||||||||
Net effect of swaps | (6.9 | ) | (0.6 | )% | (2.1 | ) | (0.2 | )% | 6.9 | 0.6 | % | |||||||||||
Loss on early debt extinguishment | — | — | % | 29.3 | 2.5 | % | 34.6 | 3.0 | % | |||||||||||||
Unrealized / realized foreign currency loss | 81.0 | 6.6 | % | 40.9 | 3.5 | % | 28.9 | 2.5 | % | |||||||||||||
Provision for taxes | 22.2 | 1.8 | % | 9.9 | 0.9 | % | 20.3 | 1.8 | % | |||||||||||||
Net income | $ | 112.2 | 9.1 | % | $ | 104.2 | 9.0 | % | $ | 108.2 | 9.5 | % | ||||||||||
Other data: | ||||||||||||||||||||||
Combined attendance (in thousands) | 24,448 | 23,305 | 23,519 | |||||||||||||||||||
Combined in-park guest per capita spending | $ | 46.20 | $ | 45.54 | $ | 44.15 | ||||||||||||||||
Critical Accounting Policies
Management's Discussion and Analysis of Financial Condition and Results of Operations is based upon our consolidated financial statements, which were prepared in accordance with accounting principles generally accepted in the United States of America. These principles require us to make judgments, estimates and assumptions during the normal course of business that affect the amounts reported in the Consolidated Financial Statements and related notes. The following discussion addresses our critical accounting policies, which are those that are most important to the portrayal of our financial condition and operating results or involve a higher degree of judgment and complexity (see Note 2 to our Consolidated Financial Statements for a complete discussion of our significant accounting policies). Application of the critical accounting policies described below involves the exercise of judgment and the use of assumptions as to future uncertainties, and, as a result, actual results could differ from these estimates and assumptions.
Impairment of Long-Lived Assets
The carrying values of long-lived assets, including property and equipment, are reviewed whenever events or changes in circumstances indicate that the carrying values of the assets may not be recoverable. An impairment loss may be recognized when estimated undiscounted future cash flows expected to result from the use of the assets, including disposition, are less than the carrying value of the assets. The measurement of the impairment loss to be recognized is based on the difference between the fair value and the carrying amounts of the assets. Fair value is generally determined based on a discounted cash flow analysis. In order to determine if an asset has been impaired, assets are grouped and tested at the lowest level for which identifiable, independent cash flows are available.
The determination of both undiscounted and discounted cash flows requires management to make significant estimates and consider an anticipated course of action as of the balance sheet date. Subsequent changes in estimated undiscounted and discounted cash flows arising from changes in anticipated actions could impact the determination of whether impairment exists, the amount of the impairment charge recorded and whether the effects could materially impact the consolidated financial statements.
At the end of the fourth quarter of 2015, the Partnership decided to permanently remove from service a long-lived asset at Cedar Point. Accordingly, the Partnership recognized and recorded an $8.6 million charge for impairment equal to the remaining net book value of this long-lived asset. The amount was recorded in "Loss on impairment / retirement of fixed assets, net" on the consolidated statement of operations and comprehensive income.
16
At the end of the fourth quarter of 2014, the Partnership concluded based on 2014 operating results and updated forecasts for the coming years, that a review of the carrying value of operating long-lived assets at Wildwater Kingdom was warranted. After performing its review, the Partnership determined that the park's fixed assets were impaired by $2.4 million. This amount was recorded in "Loss on impairment / retirement of fixed assets, net" on the consolidated statement of operations and comprehensive income.
There was no impairment of any long-lived assets in 2013.
Goodwill and Other Intangible Assets
Goodwill and other indefinite-lived intangible assets, including trade-names, are reviewed for impairment annually, or more frequently if indicators of impairment exist. A significant amount of judgment is involved in determining if an indicator of impairment has occurred. Such indicators may include, among others: a significant decline in expected future cash flows; a sustained, significant decline in equity price and market capitalization; a significant adverse change in legal factors or in the business climate; unanticipated competition; the testing for recoverability of a significant asset group within a reporting unit; and slower growth rates. Any adverse change in these factors could have a significant impact on the recoverability of these assets and could have a material impact on our consolidated financial statements.
An impairment loss may be recognized if the carrying value of the reporting unit is higher than its fair value, which is estimated using both an income (discounted cash flow) and market approach. The amount of impairment is determined by comparing the implied fair value of reporting unit goodwill to the carrying value of the goodwill in the same manner as if the reporting unit was being acquired in a business combination. If the implied fair value of goodwill is less than the recorded goodwill, an impairment charge is recorded for the difference. Goodwill and trade-names have been assigned at the reporting unit, or park level, for purposes of impairment testing.
During 2015, we changed the annual goodwill impairment testing date from the last day of the fourth quarter to the first day of the fourth quarter. We believe this voluntary change is preferable because it better aligns our goodwill impairment testing procedures with the completion of our annual financial and strategic planning process and provides us with adequate time to evaluate goodwill for impairment. This change in accounting principle did not delay, accelerate or avoid an impairment loss, nor did the change have a cumulative effect on net income or loss, or partners' equity. The Partnership determined that it would be impracticable to objectively determine projected cash flows and related valuation estimates that would have been used as of each first day of the fourth quarter for each of our prior reporting periods without the use of hindsight. As such, the Partnership applied the change in annual goodwill impairment testing date prospectively beginning September 28, 2015, the first day of the fourth quarter.
We completed the review of goodwill and other indefinite-lived intangibles as of September 28, 2015, December 31, 2014 and December 31, 2013, respectively, and determined the goodwill and other indefinite-lived intangibles were not impaired at these testing dates. Further, as of the testing dates, all reporting units with goodwill had fair values in excess of their carrying values by greater than 10%.
It is possible that our assumptions about future performance, as well as the economic outlook and related conclusions regarding the valuation of our reporting units (parks), could change adversely, which may result in additional impairment that would have a material effect on our financial position and results of operations in future periods.
Self-Insurance Reserves
Reserves are recorded for the estimated amounts of guest and employee claims and expenses incurred each period that are not covered by insurance. Reserves are established for both identified claims and incurred but not reported (IBNR) claims. Such amounts are accrued for when claim amounts become probable and estimable. Reserves for identified claims are based upon our own historical claims experience and third-party estimates of settlement costs. Reserves for IBNR claims, which are not material to our consolidated financial statements, are based upon our own claims data history. All reserves are periodically reviewed for changes in facts and circumstances and adjustments are made as necessary.
Derivative Financial Instruments
Derivative financial instruments are used within our overall risk management program to manage certain interest rate and foreign currency risks. By utilizing a derivative instrument to hedge our exposure to LIBOR rate changes, we are exposed to credit risk. Credit risk is the failure of the counterparty to perform under the terms of the derivative contract. To mitigate this risk, hedging instruments are placed with a counterparty that we believe poses minimal credit risk.
We do not use derivative financial instruments for trading purposes.
Derivative financial instruments used in hedging transactions are assessed both at inception and quarterly thereafter to ensure they are effective in offsetting changes in the cash flows of the related underlying exposures. For derivative instruments that are designated and qualify as cash flow hedges, the effective portion of the change in fair value of the derivative instrument is reported as a component of “Other comprehensive income (loss)” and reclassified into earnings in the period during which the hedged transaction affects earnings. Changes in fair value of derivative instruments that do not qualify as effective hedging activities are reported as “Net effect of swaps” in the consolidated statement of operations. Additionally, the “Accumulated other comprehensive income (loss)” related to interest rate swaps that become ineffective is amortized over the remaining life of the interest rate swap, and reported as a component of “Net effect of swaps” in the consolidated statements of operations.
17
Revenue Recognition
Revenues on multi-use products are recognized over the estimated number of uses expected for each type of product and are adjusted periodically during the operating season prior to the ticket or product expiration, which occurs no later than the close of the operating season or December 31 each year. Other revenues are recognized on a daily basis based on actual guest spending at our facilities, or over the park operating season in the case of certain marina revenues and certain sponsorship revenues. Revenues on multi-use products for the next operating season are deferred in the year received and recognized as revenue in the following operating season.
Admission revenues include amounts paid to gain admission into our parks including parking fees. Revenues related to extra-charge attractions, including our premium benefit offerings like our front-of-line products, are included in Accommodations, extra-charge products and other revenue.
Income Taxes
Our legal structure includes both partnerships and corporate subsidiaries. As a publicly traded partnership, we are subject to an entity-level tax (the "PTP tax"). Accordingly, the Partnership itself is not subject to corporate income taxes; rather, the Partnership's tax attributes (except those of the corporate subsidiaries) are included in the tax returns of our partners. Our corporate subsidiaries are subject to entity-level income taxes. Our "Provision for taxes" includes both the PTP tax and the income taxes from the corporate subsidiaries.
Our corporate subsidiaries account for income taxes under the asset and liability method. Accordingly, deferred tax assets and liabilities are recognized for the future book and tax consequences attributable to temporary differences between the financial statement carrying amounts of existing assets and liabilities and their respective tax bases. Deferred tax assets and liabilities are determined using enacted tax rate expected to apply in the year in which those temporary differences are expected to be recovered or settled.
We record a valuation allowance if, based on the weight of available evidence, it is more likely than not that some portion, or all, of a deferred tax asset will not be realized. Through December 31, 2014, we had recorded a $5.7 million valuation allowance related to a $16.8 million deferred tax asset for foreign tax credit carryforwards. The need for this allowance was based on several factors including the ten-year carryforward period allowed for excess foreign tax credits, experience to date of foreign tax credit limitations, and management's long term estimates of domestic and foreign source income.
During 2015, we did not adjust the valuation allowance. As of December 31, 2015, we had recorded a $5.7 million valuation allowance related to a $7.6 million deferred tax asset for foreign tax credit carryforwards.
There is inherent uncertainty in the estimates used to project the amount of foreign tax credit carryforwards that are more likely than not to be realized. It is possible that our future income projections, as well as the economic outlook and related conclusions regarding the valuation allowance could change, which may result in additional valuation allowance being recorded or may result in additional valuation allowance reductions, and which may have a material negative or positive effect on our reported financial position and results of operations in future periods.
18
Results of Operations
2015 vs. 2014
The following table presents key operating and financial information for the years ended December 31, 2015 and 2014 (amounts in thousands, except per capita spending and percentages):
Increase (Decrease) | |||||||||||||||
12/31/15 | 12/31/14 | $ | % | ||||||||||||
Net revenues | $ | 1,235,778 | $ | 1,159,605 | $ | 76,173 | 6.6 | % | |||||||
Operating costs and expenses | 793,943 | 748,151 | 45,792 | 6.1 | % | ||||||||||
Depreciation and amortization | 125,631 | 124,286 | 1,345 | 1.1 | % | ||||||||||
Loss on impairment/retirement of fixed assets | 20,873 | 9,757 | 11,116 | N/M | |||||||||||
Gain on sale of other assets | — | (921 | ) | 921 | N/M | ||||||||||
Operating income | $ | 295,331 | $ | 278,332 | $ | 16,999 | 6.1 | % | |||||||
Other Data: | |||||||||||||||
Adjusted EBITDA (1) | $ | 459,238 | $ | 431,280 | $ | 27,958 | 6.5 | % | |||||||
Adjusted EBITDA margin (2) | 37.2 | % | 37.2 | % | — | — | % | ||||||||
Attendance | 24,448 | 23,305 | 1,143 | 4.9 | % | ||||||||||
Per capita spending | $ | 46.20 | $ | 45.54 | $ | 0.66 | 1.4 | % | |||||||
Out-of-park revenues | $ | 137,698 | $ | 127,156 | $ | 10,542 | 8.3 | % | |||||||
N/M - Not meaningful | |||||||||||||||
(1) for additional information regarding Adjusted EBITDA, including how we define and use Adjusted EBITDA, as well as a reconciliation from net income, see Item 6, "Selected Financial Data," on page 15. | |||||||||||||||
(2) Adjusted EBITDA margin (Adjusted EBITDA divided by net revenues) is not a measurement computed in accordance with generally accepted accounting principles ("GAAP") or a substitute for measures computed in accordance with GAAP and may not be comparable to similarly titled measures of other companies. The Partnership provides Adjusted EBITDA margin because it believes the measure provides a meaningful metric of operating profitability. | |||||||||||||||
Consolidated net revenues totaled $1,235.8 million in 2015, increasing $76.2 million, from $1,159.6 million in 2014. This reflects an increase in attendance and average in-park guest per capita spending and an increase in out-of park revenues compared to the prior year. Attendance for the year was positively impacted by strong season pass visitation, which we believe is driven by our strong capital program. The 1.4%, or $0.66, increase in per capita spending, which represents the amount spent per attendee to gain admission to a park, plus all amounts spent while inside the park gates, was mainly attributable to the continued increases in admissions pricing and growth in our food and beverage programs. The 8.3%, or $10.5 million, increase in out-of-park revenues, which include the sale of hotel rooms, food, merchandise and other complementary activities located outside of the park gates, as well as transaction fees from on-line product sales, was due primarily to improved results at our resort properties, in particular at Hotel Breakers at Cedar Point. The increase in net revenues is net of a $20.1 million unfavorable impact of foreign currency exchange compared to 2014.
Operating costs and expenses for the year increased 6.1%, or $45.8 million, to $793.9 million from $748.2 million for 2014. The increase is the result of a $9.6 million increase in cost of goods sold, a $21.5 million increase in operating expenses, and a $14.6 million increase in selling, general, and administrative expenses ("SG&A"). The $9.6 million increase in cost of goods sold was largely related to increases in attendance levels. Cost of goods sold as a percentage of revenues was comparable for both years. The $21.5 million increase in operating expenses was due to several items. First, we experienced an increase in labor costs due to normal merit increases, market-based and minimum-wage rate increases, and additional operating hours. Second, maintenance expense increased primarily due to increases in ride maintenance and infrastructure improvements, in particular at Cedar Point. Third, operating supplies increased primarily due to increased attendance and operating hours year-over-year. Lastly, self-insurance costs increased due to increases in estimated reserves based on higher attendance volume and wage levels. The $14.6 million increase in SG&A was primarily due to two items. First, we experienced an increase in labor costs due to normal merit increases and incentive compensation. Second, operating supplies increased due primarily to costs associated with special event promotional activities, continued expenditures related to our technology and security initiatives, and merchant fees. The increase in operating costs and expenses is net of a $10.2 million favorable impact of foreign currency exchange compared to 2014.
Depreciation and amortization expense for 2015 increased $1.3 million compared to the prior year. Loss on impairment / retirement of fixed assets for 2015 was $20.9 million, reflecting the impairment of a certain long-lived asset at Cedar Point (as discussed in detail in Note 3 to our Consolidated Financial Statements) and the retirement of assets during the period at several of our properties, as compared to $9.8 million in 2014 which reflected a $2.4 million impairment of assets at Wildwater Kingdom and the retirement of assets during the period at several of our properties. After depreciation, amortization, loss on impairment/retirement of fixed assets, and all other non-cash costs, operating income increased $17.0 million to $295.3 million for 2015 from operating income of $278.3 million for 2014.
19
Interest expense for 2015 decreased by $9.4 million to $86.8 million, from $96.3 million for 2014. The decrease was due to the lower interest rate on the June 2014 notes compared to the July 2010 notes which were outstanding for half of the prior year.
The net effect of our swaps resulted in a non-cash benefit to earnings of $6.9 million for 2015 compared with a $2.1 million non-cash benefit to earnings for 2014. The difference reflects the change in fair market value movements in our de-designated swap portfolio offset by the amortization of amounts in OCI for these swaps. During the year, we also recognized a $81.0 million charge to earnings for unrealized/realized foreign currency losses compared with a $40.9 million charge to earnings for 2014. Both amounts primarily represented foreign currency movements on the U.S.-dollar denominated debt held at our Canadian property.
For 2015, a provision for taxes of $22.2 million was recorded to account for publicly traded partnership ("PTP") taxes and income taxes on our corporate subsidiaries. This compares to a provision for taxes recorded for 2014 of $9.9 million. This increase in tax provision in the current year relates largely to improved operating results and due to the valuation allowance reduction of $1.1 million recorded in 2014. Cash taxes paid in 2015 were $20.0 million compared to $11.2 million in 2014. For 2016, cash taxes to be paid or payable are estimated to range from $50 million to $60 million. The increase in cash taxes relates to continuing strong business performance and the utilization of net operating loss carryforwards during 2015.
After the items above, net income for 2015 totaled $112.2 million, or $1.99 per diluted limited partner unit, compared with net income of $104.2 million, or $1.86 per diluted unit, for 2014.
We believe Adjusted EBITDA is a meaningful measure of our operating results (for additional information regarding Adjusted EBITDA, including how we define and use Adjusted EBITDA, as well as a reconciliation from net income, see page 15). For 2015, Adjusted EBITDA increased to $459.2 million from $431.3 million for 2014. The approximate $28.0 million increase in Adjusted EBITDA is a direct result of higher attendance, higher average guest per capita spending, and stronger out-of-park revenues compared to the prior year. Partially offsetting these revenue increases were increases in operating costs and expenses associated with increased labor, our current year initiatives, and other planned year-over-year cost increases. Over this same period, our Adjusted EBITDA margin (Adjusted EBITDA divided by net revenues) remained flat.
Results of Operations
2014 vs. 2013
The following table presents key operating and financial information for the years ended December 31, 2014 and 2013 (amounts in thousands, except per capita spending and percentages):
Increase (Decrease) | |||||||||||||||
12/31/14 | 12/31/13 | $ | % | ||||||||||||
Net revenues | $ | 1,159,605 | $ | 1,134,572 | $ | 25,033 | 2.2 | % | |||||||
Operating costs and expenses | 748,151 | 716,528 | 31,623 | 4.4 | % | ||||||||||
Depreciation and amortization | 124,286 | 122,487 | 1,799 | 1.5 | % | ||||||||||
Loss on impairment/retirement of fixed assets | 9,757 | 2,539 | 7,218 | N/M | |||||||||||
Gain on sale of other assets | (921 | ) | (8,743 | ) | 7,822 | N/M | |||||||||
Operating income | $ | 278,332 | $ | 301,761 | $ | (23,429 | ) | (7.8 | )% | ||||||
Other Data: | |||||||||||||||
Adjusted EBITDA (1) | $ | 431,280 | $ | 425,430 | $ | 5,850 | 1.4 | % | |||||||
Adjusted EBITDA margin (2) | 37.2 | % | 37.5 | % | — | (0.3 | )% | ||||||||
Attendance | 23,305 | 23,519 | (214 | ) | (0.9 | )% | |||||||||
Per capita spending | $ | 45.54 | $ | 44.15 | $ | 1.39 | 3.1 | % | |||||||
Out-of-park revenues | $ | 127,156 | $ | 124,164 | $ | 2,992 | 2.4 | % | |||||||
N/M - Not meaningful | |||||||||||||||
(1) for additional information regarding Adjusted EBITDA, including how we define and use Adjusted EBITDA, as well as a reconciliation from net income, see Item 6, "Selected Financial Data," on page 15. | |||||||||||||||
(2) Adjusted EBITDA margin (Adjusted EBITDA divided by net revenues) is not a measurement computed in accordance with generally accepted accounting principles ("GAAP") or a substitute for measures computed in accordance with GAAP and may not be comparable to similarly titled measures of other companies. The Partnership provides Adjusted EBITDA margin because it believes the measure provides a meaningful metric of operating profitability. | |||||||||||||||
Consolidated net revenues totaled $1,159.6 million in 2014, increasing $25.0 million, from $1,134.6 million in 2013. The 2.2% increase in revenues reflects a 3.1%, or $1.39, increase in average in-park guest per capita spending compared with 2013, partially offset by less than a 1.0%, or 0.2 million visits, decrease in attendance. The increase in per capita spending was largely the result of enhancements made to the
20
overall guest experience, including improvements in food and beverage programs, resulting in increased spending and capture rates across most categories of our business. The slight decrease in attendance during the year was largely due the sale of a non-core, stand-alone water park in August 2013. Attendance on a comparable-park basis decreased less than 0.5%, or 60,000 visits. This decrease in comparable visits can be partially attributed to unfavorable weather that the parks experienced during the second and third quarters of 2014, offset somewhat by more favorable weather experienced during the fourth quarter of 2014. Out-of-park revenues increased over 2.4%, or $3.0 million. In 2014, Out-of-park revenues included $2.3 million of proceeds from a business interruption insurance claim relating to a water main break at Cedar Point that occurred during the second quarter. Adjusting for these insurance proceeds, out-of-park revenue would have increased less than 1.0% period-over-period. The increase in net revenues is net of a $6.1 million unfavorable impact of foreign currency exchange.
Operating costs and expenses in 2014 increased $31.6 million, or 4.4%, to $748.1 million versus $716.5 million for 2013 and were in line with expectations. The increase in costs and expenses was the result of a $3.4 million increase in cost of goods sold, a $23.7 million increase in operating expenses, and a $4.5 million increase in selling, general and administrative costs ("SG&A"). The $3.4 million increase in cost of goods sold is mainly related to increases in volume. Cost of goods sold as a percentage of revenues was comparable for both years. Operating expenses increased $23.7 million due to several factors. First, costs related to labor increased during the period due to staffing, benefits, hourly wages, and employment litigation matters. Second, show and attraction expenses were higher due to the introduction of new shows and attractions at several of our parks. Third, operating supplies and expenses increased due to consulting and information technology expenses related to infrastructure improvements, transaction based fees, and costs associated with guest experience improvement initiatives. Finally, utility costs increased due to inclement winter weather and rate increases. SG&A increased $4.5 million due to two main factors. First, costs related to labor increased due to staffing, benefits, hourly wages, and incentive compensation. Second, advertising expenses increased due to increased media, production, and local advertising costs. The increase in operating costs and expenses is net of a $4.0 million favorable impact of foreign currency exchange.
Depreciation and amortization expense for 2014 increased 1.5%, or $1.8 million. For 2014, the loss on impairment/retirement of fixed assets was $9.8 million, reflecting the impairment of the assets of the Wildwater Kingdom (as discussed in detail in Note 3 to the Consolidated Financial Statements) and the retirement of assets during the period at several of our properties, as compared to $2.5 million in 2013 for retirement of assets. Additionally, excess land was sold in 2014 for a $0.9 million gain, compared to an $8.7 million gain in 2013 related to the sale of a non-core water park. After depreciation, amortization, loss on impairment / retirement of fixed assets, gain on the sale of other assets, and all other non-cash costs, operating income for the period decreased $23.4 million to $278.3 million for 2014 from operating income of $301.8 million for 2013.
Interest expense for 2014 was $96.3 million, a decrease of $6.8 million compared to 2013. The decrease in interest expense was due to a lower interest rate on our debt, a decrease in non-cash amortization expense resulting from the write-off of loan fees related to our prior credit agreement, and a decrease in revolver interest in the period due to lower borrowings, and was partially offset by the overlap of one month of interest on our July 2010 and June 2014 notes and the impact of a higher balance of our June 2014 notes.
The net effect of our swaps resulted in a non-cash benefit to earnings of $2.1 million for 2014 compared with a $6.9 million non-cash charge to earnings for 2013. The difference reflects a write off of amounts in accumulated other comprehensive income related to de-designated interest rate swaps during 2013. During 2014, we also recognized a $40.9 million net charge to earnings for unrealized/realized foreign currency losses compared with a $28.9 million net charge to earnings in 2013. Both amounts are primarily attributable to foreign currency losses on the U.S.-dollar denominated debt held at our Canadian property. Due to our June 2014 bond financing, loan fees related to the July 2010 notes were written off. Additionally, a "make-whole" premium, as prescribed in the July 2010 Indenture, was paid to redeem the July 2010 notes. Together, these amounts resulted in a charge to earnings totaling $29.3 million in 2014. For 2013, as a result of the March 2013 refinancing, loan fees related to our 2010 and 2011 financings were written off, resulting in a $34.6 million non-cash charge to earnings for the year.
During 2014, a provision for taxes of $9.9 million was recorded to account for publicly traded partnership (“PTP”) taxes and for income taxes related to our corporate subsidiaries. During 2013, a provision for taxes of $20.2 million was recorded. The reduction in provision for taxes relates largely to the impact of currency exchange rates on corporate pre-tax income. Cash taxes paid during 2014 was $11.2 million compared to $14.8 million in 2013.
After the above items, net income for 2014 totaled $104.2 million, or $1.86 per diluted limited partner unit, compared with net income for 2013 of $108.2 million, or $1.94 per diluted unit.
We believe Adjusted EBITDA is a meaningful measure of our operating results. For additional information regarding Adjusted EBITDA, including how we define and use Adjusted EBITDA, as well as a reconciliation from net income, see Note 5 in Item 6, “Selected Financial Data,” on pages 15. For 2014, Adjusted EBITDA increased to $431.3 million compared with $425.4 million for 2013. Over this same period, our Adjusted EBITDA margin (Adjusted EBITDA divided by net revenues) decreased 0.3% to 37.2% from 37.5% for 2013. This decrease is primarily the result of a shift in the mix of earnings from higher margin properties to lower margin properties as well as continued investment as part of our longer term growth initiatives.
21
Financial Condition
We ended 2015 in sound condition with respect to both liquidity and cash flow. The working capital ratio (current assets divided by current liabilities) was 1.0 at both December 31, 2015 and 2014. Receivables and inventories are at normally low seasonal levels and cash and credit facilities are in place to fund current liabilities, capital expenditures, partnership distributions, and pre-opening expenses as required.
Operating Activities
Net cash from operating activities in 2015 increased $5.1 million to $342.2 million from $337.1 million in 2014. The increase in operating cash flows between years was primarily attributable to the increase in the operating results of our parks in 2015 over 2014 and a decrease in interest payments.
Net cash from operating activities in 2014 increased $12.6 million to $337.1 million from $324.5 million in 2013. The increase in operating cash flows between years was primarily attributable to the increase in the operating results of our parks in 2014 over 2013.
Investing Activities
Investing activities consist principally of capital investments we make in our parks and resort properties. During 2015, cash spent on capital expenditures totaled $175.9 million as we continued to reinvest in our properties and expand our capital program. During the year we also purchased a preferred equity investment in a non-public entity for $2.0 million. During 2014, cash spent on capital expenditures totaled $166.7 million. During 2014 we also sold a non-core asset for net proceeds of $1.4 million.
Historically, we have been able to improve our revenues and profitability by continuing to make substantial capital investments in our park and resort facilities. This has enabled us to maintain or increase attendance levels, as well as to generate increases in guest per capita spending and revenues from guest accommodations. For the 2016 operating season, we will be investing approximately $150 million in capital investments across our properties. These capital investments will include introducing a world-record-breaking roller coaster, Valravn, at our flagship park, Cedar Point, a major water park expansion at Carowinds, where we continue to invest, and many other new attractions at all of our parks. We are also looking forward to celebrating the 75th anniversary of Ghost Town at Knott’s Berry Farm. Ghost Town Alive! will be an interactive entertainment experience which immerses guests of all ages in new stories and adventures each day in the familiar town of Calico. In addition, we have partnered with Electronic Arts to introduce two new digital attractions - a new inter-active digital experience at Carowinds based on the popular Plants vs. Zombies on-line gaming platform, and an all-new 4D holographic experience at California’s Great America based on the Mass Effect video game series.
Financing Activities
Net cash utilized for financing activities in 2015 totaled $174.2 million, compared with $155.2 million in 2014. This increase in net cash utilized for financing activities is due to an increase in distributions in 2015.
Net cash utilized for financing activities in 2014 totaled $155.2 million, compared with $178.3 million in 2013. This decrease in net cash utilized for financing activities is due to an increase in borrowings on notes and lower debt issuance costs, partially offset by an increase in distributions in 2014.
Liquidity and Capital Resources
In June of 2014, the Partnership issued $450 million of 5.375% senior unsecured notes ("June 2014 notes"), maturing in 2024, in a private placement. The net proceeds from the offering of the June 2014 notes were used to redeem in full all of the Partnership’s $405 million of 9.125% senior unsecured notes that were scheduled to mature in 2018, to satisfy and discharge the indenture governing the notes that were redeemed and for general corporate purposes.
The Partnership's June 2014 notes pay interest semi-annually in June and December, with the principal due in full on June 1, 2024. The notes may be redeemed, in whole or in part, at any time prior to June 1, 2019 at a price equal to 100% of the principal amount of the notes redeemed plus a “make-whole” premium together with accrued and unpaid interest, if any, to the redemption date. Thereafter, the notes may be redeemed, in whole or in part, at various prices depending on the date redeemed. Prior to June 1, 2017, up to 35% of the notes may be redeemed with the net cash proceeds of certain equity offerings at a price equal to 105.375% together with accrued and unpaid interest.
In March 2013, the Partnership issued $500 million of 5.25% senior unsecured notes ("March 2013 notes"), maturing in 2021, in a private placement.
Concurrently with the March 2013 offering, we entered into a new $885 million agreement (as amended, the "2013 Credit Agreement"), which included a $630 million senior secured term loan facility and a $255 million senior secured revolving credit facility. The terms of the senior secured term loan facility include a maturity date of March 6, 2020 and bear an interest rate at a rate of LIBOR ("London Interbank Borrowing Rate") plus 250 bps with a LIBOR floor of 75 bps. The term loan amortizes at $6.3 million annually and allows interest to be paid on a 30-, 60-, or 90-day basis. The Partnership is currently paying interest on a 30-day basis. The net proceeds from the notes and borrowings under the 2013 Credit Agreement were used to repay in full all amounts outstanding under the previous credit facilities. The facilities provided under the 2013 Credit agreement are collateralized by substantially all of the assets of the Partnership.
22
The Partnership's March 2013 notes pay interest semi-annually in March and September, with the principal due in full on March 15, 2021. The notes may be redeemed, in whole or in part, at any time prior to March 15, 2016 at a price equal to 100% of the principal amount of the notes redeemed plus a “make-whole” premium together with accrued and unpaid interest, if any, to the redemption date. Thereafter, the notes may be redeemed, in whole or in part, at various prices depending on the date redeemed. Prior to March 15, 2016, up to 35% of the notes may be redeemed with the net cash proceeds of certain equity offerings at a price equal to 105.25%, together with accrued and unpaid interest.
Terms of the 2013 Credit Agreement include a revolving credit facility of a combined $255 million. The Canadian portion of the revolving credit facility has a sub-limit of $15 million. U.S. denominated and Canadian denominated loans made under the revolving credit facility bear interest at a rate of LIBOR plus 225 bps (with no LIBOR floor). The revolving credit facility is scheduled to mature in March 2018 and also provides for the issuance of documentary and standby letters of credit. The 2013 Credit Agreement requires the Partnership to pay a commitment fee of 38 bps per annum on the unused portion of the credit facilities.
As of December 31, 2015 and December 31, 2014, we had $608.9 million of variable-rate term debt, $950.0 million of outstanding fixed-rate notes, and no borrowings outstanding under our revolving credit facility. After letters of credit, which totaled $16.3 million at December 31, 2015 and December 31, 2014, we had $238.7 million of available borrowings under our revolving credit facility. The maximum outstanding balances under our revolving credit facility during both 2015 and 2014 were $85.0 million. During the fourth quarter of 2014, $10.0 million of term debt was prepaid, which has resulted in no amortizing amounts being due until the third quarter of 2016.
As of December 31, 2015, we have four interest rate swap agreements that effectively convert $500 million of variable-rate debt to fixed rates. These swaps, which are designated as cash flow hedges, mature on December 31, 2018 and fix LIBOR at a weighted average rate of 2.94%. In January 2016, the Partnership amended each of its four interest rate swap agreements to extend each of the maturities by two years and fix LIBOR at a rate of 2.64%. As of December 31, 2014, in addition to the $500 million of swaps maturing on December 31, 2018, we had $800 million of variable-rate debt to fixed rates swaps which subsequently matured in December 2015 and fixed LIBOR at a weighted average rate of 2.38%. These swaps were de-designated as cash flow hedges. Additional detail regarding our swap arrangements is provided in Note 6 to our Consolidated Financial Statements.
On December 31, 2015, the fair market value of our swap portfolio, which was entirely long-term, was $22.9 million. On December 31, 2014, the fair market value of the current and long-term portions of our swap portfolio were $11.8 million and $14.6 million, respectively. The current and long-term amounts for 2015 and 2014 were recorded in "Current Derivative Liability" and "Derivative Liability," respectively. Additional detail regarding our current and historical swap arrangements is provided in Note 6 to our Consolidated Financial Statements.
The 2013 Credit Agreement requires us to maintain specified financial ratios, which if breached for any reason and not cured, could result in an event of default under the agreement. The most restrictive of these ratios is the Consolidated Leverage Ratio. At the end of the fourth quarter of 2015 and 2014, this ratio was set at maximum of 5.75x and 6.00x consolidated total debt (excluding the revolving debt)-to-consolidated EBITDA, respectively. The ratio decreased by 0.25x at the beginning of the second quarter and will decrease each second quarter until it reaches 5.25x. As of December 31, 2015 and 2014 , we were in compliance with this ratio and all other covenants under the 2013 Credit Agreement. The 2013 Credit Agreement allows restricted payments of up to $60 million annually so long as no default or event of default has occurred and is continuing and so long as the Partnership would be in compliance with certain financial ratios after giving effect to the payments. Additional restricted payments are allowed to be made based on an Excess-Cash-Flow formula, should our pro-forma Consolidated Leverage Ratio be less than or equal to 5.0x.
The indentures governing our notes also include annual restricted payment limitations and additional permitted payment formulas. We can make restricted payments of $60 million annually so long as no default or event of default has occurred and is continuing. We can make additional restricted payments if our pro forma Total Indebtedness-to-Consolidated-Cash-Flow Ratio is less than or equal to 5.00x.
As market conditions warrant, we may from time to time repurchase debt securities issued by us, in the open market, in privately negotiated transactions, by tender offer or otherwise.
In accordance with these debt provisions, on November 5, 2015, we announced the declaration of a distribution of $0.825 per limited partner unit, which was paid on December 15, 2015, and on February 24, 2016 we announced the declaration of a distribution of $0.825 per limited partner unit, payable March 28, 2016.
Existing credit facilities and cash flows from operations are expected to be sufficient to meet working capital needs, debt service, partnership distributions and planned capital expenditures for the foreseeable future.
23
Contractual Obligations
The following table summarizes certain obligations (on an undiscounted basis) at December 31, 2015 (in millions):
Payments Due by Period | |||||||||||||||||||
2021 - | |||||||||||||||||||
Total | 2016 | 2017-2018 | 2019-2020 | Thereafter | |||||||||||||||
Long-term debt (1) | $ | 2,021,218 | $ | 84,593 | $ | 176,214 | $ | 718,848 | $ | 1,041,563 | |||||||||
Capital expenditures (2) | 155,000 | 146,820 | 8,180 | — | — | ||||||||||||||
Lease & other obligations (3) | 152,053 | 21,501 | 16,230 | 12,361 | 101,961 | ||||||||||||||
Total | $ | 2,328,271 | $ | 252,914 | $ | 200,624 | $ | 731,209 | $ | 1,143,524 | |||||||||
(1) | Represents maturities and mandatory prepayments on long-term debt obligations, fixed interest on senior notes, variable interest on term debt assuming current LIBOR interest rates, and the impact of our various derivative contracts. See Note 5 in “Notes to Consolidated Financial Statements” for further information. |
(2) | Represents contractual obligations in place at year-end for the purchase of new rides, facilities, and attractions. Obligations not denominated in U.S. dollars have been converted based on the currency exchange rates as of December 31, 2015. |
(3) | Represents contractual lease and purchase obligations in place at year-end. |
Off-Balance Sheet Arrangements
We had $16.3 million of letters of credit, which are primarily in place to backstop insurance arrangements, outstanding on our revolving credit facility as of December 31, 2015. We have no other significant off-balance sheet financing arrangements.
Quantitative and Qualitative Disclosures about Market Risk
We are exposed to market risks from fluctuations in interest rates and to currency exchange rates on our operations in Canada, and from time to time, on imported rides and equipment. The objective of our financial risk management is to reduce the potential negative impact of interest rate and foreign currency exchange rate fluctuations to acceptable levels. We do not acquire market risk sensitive instruments for trading purposes.
We manage interest rate risk through the use of a combination of fixed-rate long-term debt and interest rate swaps to fix some or all of our variable-rate long-term debt. Translation exposures with regard to our Canadian operations are not hedged.
For derivative instruments that are designated and qualify as cash flow hedges, the effective portion of the change in fair value of the derivative instrument is reported as a component of “Other comprehensive income (loss)” and reclassified into earnings in the period during which the hedged transaction affects earnings. Changes in fair value of derivative instruments that do not qualify as effective hedging activities are reported as “Net effect of swaps” in the consolidated statement of operations. Additionally, the “Other comprehensive income (loss)” related to interest rate swaps that become ineffective is amortized over the remaining life of the interest rate swap and reported as a component of “Net effect of swaps” in the consolidated statement of operations.
After considering the impact of interest rate swap agreements, as of December 31, 2015, most of our outstanding long-term debt represents fixed-rate debt. Assuming an average balance on our revolving credit borrowings of approximately $18 million, a hypothetical 100 bps increase in 30-day LIBOR on our variable-rate debt (not considering the impact of our interest rate swaps) would lead to an increase of approximately $5.8 million in annual cash interest costs.
Assuming a hypothetical 100 bps increase in 30-day LIBOR, the amount of net cash interest paid on our derivative portfolio would decrease by $4.7 million over the next year.
A uniform 10% strengthening of the U.S. dollar relative to the Canadian dollar would result in a $2.6 million decrease in annual operating income.
Impact of Inflation
Substantial increases in costs and expenses could impact our operating results to the extent such increases could not be passed along to our guests. In particular, increases in labor, supplies, taxes, and utility expenses could have an impact on our operating results. The majority of our employees are seasonal and are paid hourly rates which are consistent with federal and state minimum wage laws. Historically, we have been able to pass along cost increases to guests through increases in admission, food, merchandise and other prices, and we believe that we will
24
continue to have the ability to do so over the long term. We believe that the effects of inflation, if any, on our operating results and financial condition have been and will continue to be minor.
Forward Looking Statements
Some of the statements contained in this report (including the “Management's Discussion and Analysis of Financial Condition and Results of Operations” section) that are not historical in nature are forward-looking statements within the meaning of Section 27A of the Securities Act of 1933 and Section 21E of the Securities Exchange Act of 1934, including statements as to our expectations, beliefs and strategies regarding the future. These forward-looking statements may involve risks and uncertainties that are difficult to predict, may be beyond our control and could cause actual results to differ materially from those described in such statements. Although we believe that the expectations reflected in such forward-looking statements are reasonable, we can give no assurance that such expectations will prove to be correct. Important factors, including those listed under Item 1A in this Form 10-K could adversely affect our future financial performance and cause actual results, or our beliefs or strategies, to differ materially from our expectations. We do not undertake any obligation to publicly update or revise any forward-looking statements to reflect future events, information or circumstances that arise after the filing date of this document.
ITEM 7A. QUANTITATIVE AND QUALITATIVE DISCLOSURES ABOUT MARKET RISK.
The information appearing under the subheading “Quantitative and Qualitative Disclosures About Market Risk” under the heading “Management's Discussion and Analysis of Financial Condition and Results of Operations” on page 24 of this Report is incorporated herein by reference.
ITEM 8. FINANCIAL STATEMENTS AND SUPPLEMENTARY DATA.
Quarterly operating results for 2015 and 2014 are presented in the table below (in thousands, except per unit amounts):
Net income | Net income | |||||||||||||||||||
(loss) per | (loss) per | |||||||||||||||||||
Operating income | Net income | limited partner | limited partner | |||||||||||||||||
(Unaudited) | Net revenues | (loss) | (loss) | unit-basic | unit-diluted | |||||||||||||||
2015 | ||||||||||||||||||||
1st Quarter | $ | 46,817 | $ | (69,633 | ) | $ | (83,833 | ) | $ | (1.50 | ) | $ | (1.50 | ) | ||||||
2nd Quarter | 377,408 | 93,027 | 57,583 | 1.03 | 1.02 | |||||||||||||||
3rd Quarter | 644,637 | 277,692 | 164,151 | 2.94 | 2.92 | |||||||||||||||
4th Quarter (1) | 166,916 | (5,755 | ) | (25,679 | ) | (0.46 | ) | (0.46 | ) | |||||||||||
2015 Total | 1,235,778 | 295,331 | 112,222 | 2.01 | 1.99 | |||||||||||||||
2014 | ||||||||||||||||||||
1st Quarter | $ | 40,466 | $ | (71,577 | ) | $ | (83,540 | ) | $ | (1.51 | ) | $ | (1.51 | ) | ||||||
2nd Quarter (2) | 363,014 | 91,847 | 43,902 | 0.79 | 0.79 | |||||||||||||||
3rd Quarter | 595,318 | 252,933 | 161,902 | 2.92 | 2.90 | |||||||||||||||
4th Quarter (3) | 160,807 | 5,129 | (18,049 | ) | (0.33 | ) | (0.33 | ) | ||||||||||||
2014 Total | 1,159,605 | 278,332 | 104,215 | 1.88 | 1.86 | |||||||||||||||
(1) | The fourth quarter of 2015 included a non-cash charge of $8.6 million for the impairment of a long-lived asset at Cedar Point. |
(2) | The second quarter of 2014 included a charge of $29.3 million for the loss on early extinguishment of debt due to the June 2014 refinancing. |
(3) | The fourth quarter of 2014 included a non-cash charge of $2.4 million for the impairment of long-lived assets at Wildwater Kingdom. |
Note: | To assure that our highly seasonal operations will not result in misleading comparisons of interim periods, the Partnership has adopted the following reporting procedures: (a) seasonal operating costs are expensed over the operating season, including some costs incurred prior to the season, which are deferred and amortized over the season, and (b) all other costs are expensed as incurred or ratably over the entire year. |
25
REPORT OF INDEPENDENT REGISTERED PUBLIC ACCOUNTING FIRM
To the Board of Directors and Unitholders of Cedar Fair, L.P.
Sandusky, Ohio
We have audited the accompanying consolidated balance sheets of Cedar Fair, L.P. and subsidiaries (the "Partnership") as of December 31, 2015 and 2014, and the related consolidated statements of operations and comprehensive income, partners' equity, and cash flows for each of the three years in the period ended December 31, 2015. These financial statements are the responsibility of the Partnership's management. Our responsibility is to express an opinion on these financial statements based on our audits.
We conducted our audits in accordance with the standards of the Public Company Accounting Oversight Board (United States). Those standards require that we plan and perform the audit to obtain reasonable assurance about whether the financial statements are free of material misstatement. An audit includes examining, on a test basis, evidence supporting the amounts and disclosures in the financial statements. An audit also includes assessing the accounting principles used and significant estimates made by management, as well as evaluating the overall financial statement presentation. We believe that our audits provide a reasonable basis for our opinion.
In our opinion, such consolidated financial statements present fairly, in all material respects, the financial position of Cedar Fair, L.P. and subsidiaries as of December 31, 2015 and 2014, and the results of their operations and their cash flows for each of the three years in the period ended December 31, 2015, in conformity with accounting principles generally accepted in the United States of America.
We have also audited, in accordance with the standards of the Public Company Accounting Oversight Board (United States), the Partnership's internal control over financial reporting as of December 31, 2015, based on the criteria established in Internal Control - Integrated Framework (2013) issued by the Committee of Sponsoring Organizations of the Treadway Commission and our report dated February 26, 2016 expressed an unqualified opinion on the Partnership's internal control over financial reporting.
/s/ DELOITTE & TOUCHE LLP
Cleveland, Ohio
February 26, 2016
26
CEDAR FAIR, L.P.
CONSOLIDATED BALANCE SHEETS
(In thousands)
12/31/2015 | 12/31/2014 | |||||||
ASSETS | ||||||||
Current Assets: | ||||||||
Cash and cash equivalents | $ | 119,557 | $ | 131,840 | ||||
Receivables | 29,494 | 27,395 | ||||||
Inventories | 25,029 | 25,883 | ||||||
Current deferred tax asset | 12,188 | 9,265 | ||||||
Other current assets | 9,946 | 9,334 | ||||||
196,214 | 203,717 | |||||||
Property and Equipment: | ||||||||
Land | 267,782 | 276,297 | ||||||
Land improvements | 381,191 | 366,863 | ||||||
Buildings | 647,514 | 599,907 | ||||||
Rides and equipment | 1,561,234 | 1,535,705 | ||||||
Construction in progress | 50,962 | 70,431 | ||||||
2,908,683 | 2,849,203 | |||||||
Less accumulated depreciation | (1,393,805 | ) | (1,322,652 | ) | ||||
1,514,878 | 1,526,551 | |||||||
Goodwill | 210,811 | 228,291 | ||||||
Other Intangibles, net | 35,895 | 38,191 | ||||||
Other Assets | 37,109 | 41,569 | ||||||
$ | 1,994,907 | $ | 2,038,319 | |||||
LIABILITIES AND PARTNERS’ EQUITY | ||||||||
Current Liabilities: | ||||||||
Current maturities of long-term debt | $ | 2,475 | $ | — | ||||
Accounts payable | 17,122 | 23,933 | ||||||
Deferred revenue | 69,514 | 61,161 | ||||||
Accrued interest | 9,910 | 9,916 | ||||||
Accrued taxes | 41,937 | 21,800 | ||||||
Accrued salaries, wages and benefits | 26,916 | 34,102 | ||||||
Self-insurance reserves | 23,996 | 23,377 | ||||||
Current derivative liability | — | 11,791 | ||||||
Other accrued liabilities | 6,801 | 12,139 | ||||||
198,671 | 198,219 | |||||||
Deferred Tax Liability | 141,951 | 152,513 | ||||||
Derivative Liability | 22,918 | 14,649 | ||||||
Other Liabilities | 17,983 | 17,871 | ||||||
Long-Term Debt: | ||||||||
Term debt | 606,375 | 608,850 | ||||||
Notes | 950,000 | 950,000 | ||||||
1,556,375 | 1,558,850 | |||||||
Commitments and Contingencies (Note 10) | ||||||||
Partners’ Equity: | ||||||||
Special L.P. interests | 5,290 | 5,290 | ||||||
General partner | — | 1 | ||||||
Limited partners, 56,018, and 55,828 units outstanding at December 31, 2015 and December 31, 2014, respectively | 48,428 | 101,556 | ||||||
Accumulated other comprehensive income (loss) | 3,291 | (10,630 | ) | |||||
57,009 | 96,217 | |||||||
$ | 1,994,907 | $ | 2,038,319 | |||||
The accompanying Notes to Consolidated Financial Statements are an integral part of these statements.
27
CEDAR FAIR, L.P.
CONSOLIDATED STATEMENTS OF OPERATIONS AND COMPREHENSIVE INCOME
(In thousands, except per unit amounts)
For the years ended December 31, | 2015 | 2014 | 2013 | |||||||||
Net revenues: | ||||||||||||
Admissions | $ | 687,442 | $ | 661,455 | $ | 647,007 | ||||||
Food, merchandise and games | 398,019 | 365,528 | 356,105 | |||||||||
Accommodations, extra-charge products and other | 150,317 | 132,622 | 131,460 | |||||||||
1,235,778 | 1,159,605 | 1,134,572 | ||||||||||
Costs and expenses: | ||||||||||||
Cost of food, merchandise and games revenues | 104,827 | 95,208 | 91,772 | |||||||||
Operating expenses | 517,626 | 496,079 | 472,344 | |||||||||
Selling, general and administrative | 171,490 | 156,864 | 152,412 | |||||||||
Depreciation and amortization | 125,631 | 124,286 | 122,487 | |||||||||
Loss on impairment / retirement of fixed assets, net | 20,873 | 9,757 | 2,539 | |||||||||
Gain on sale of other assets | — | (921 | ) | (8,743 | ) | |||||||
940,447 | 881,273 | 832,811 | ||||||||||
Operating income | 295,331 | 278,332 | 301,761 | |||||||||
Interest expense | 86,849 | 96,286 | 103,071 | |||||||||
Net effect of swaps | (6,884 | ) | (2,062 | ) | 6,883 | |||||||
Loss on early debt extinguishment | — | 29,261 | 34,573 | |||||||||
Unrealized/realized foreign currency loss | 81,016 | 40,873 | 28,941 | |||||||||
Interest income | (64 | ) | (126 | ) | (154 | ) | ||||||
Income before taxes | 134,414 | 114,100 | 128,447 | |||||||||
Provision for taxes | 22,192 | 9,885 | 20,243 | |||||||||
Net income | 112,222 | 104,215 | 108,204 | |||||||||
Net income allocated to general partner | 1 | 1 | 1 | |||||||||
Net income allocated to limited partners | $ | 112,221 | $ | 104,214 | $ | 108,203 | ||||||
Net income | $ | 112,222 | $ | 104,215 | $ | 108,204 | ||||||
Other comprehensive income, (net of tax): | ||||||||||||
Cumulative foreign currency translation adjustment | 16,655 | 5,931 | 2,756 | |||||||||
Unrealized income (loss) on cash flow hedging derivatives | (2,734 | ) | (1,553 | ) | 10,736 | |||||||
Other comprehensive income, (net of tax) | 13,921 | 4,378 | 13,492 | |||||||||
Total comprehensive income | $ | 126,143 | $ | 108,593 | $ | 121,696 | ||||||
Basic earnings per limited partner unit: | ||||||||||||
Weighted average limited partner units outstanding | 55,745 | 55,548 | 55,476 | |||||||||
Net income per limited partner unit | $ | 2.01 | $ | 1.88 | $ | 1.95 | ||||||
Diluted earnings per limited partner unit: | ||||||||||||
Weighted average limited partner units outstanding | 56,362 | 55,992 | 55,825 | |||||||||
Net income per limited partner unit | $ | 1.99 | $ | 1.86 | $ | 1.94 | ||||||
The accompanying Notes to Consolidated Financial Statements are an integral part of these statements.
28
CEDAR FAIR, L.P.
CONSOLIDATED STATEMENTS OF CASH FLOWS
(In thousands)
For the years ended December 31, | 2015 | 2014 | 2013 | |||||||||
CASH FLOWS FROM OPERATING ACTIVITIES | ||||||||||||
Net income | $ | 112,222 | $ | 104,215 | $ | 108,204 | ||||||
Adjustments to reconcile net income to net cash from operating activities: | ||||||||||||
Depreciation and amortization | 125,631 | 124,286 | 122,487 | |||||||||
Loss on early debt extinguishment | — | 29,261 | 34,573 | |||||||||
Non-cash foreign currency loss on debt | 81,608 | 39,088 | 27,786 | |||||||||
Other non-cash expenses | 6,530 | 17,943 | 15,693 | |||||||||
Change in operating assets and liabilities: | ||||||||||||
(Increase) decrease in receivables | (2,276 | ) | (6,235 | ) | (6,257 | ) | ||||||
(Increase) decrease in inventories | 607 | 46 | 1,535 | |||||||||
(Increase) decrease in current assets | (1,793 | ) | 1,949 | (317 | ) | |||||||
(Increase) decrease in other assets | 918 | 1,072 | (1,737 | ) | ||||||||
Increase (decrease) in accounts payable | 3,243 | 884 | 174 | |||||||||
Increase (decrease) in deferred revenue | 9,149 | 16,965 | 5,491 | |||||||||
Increase (decrease) in accrued interest | 359 | (12,554 | ) | 8,714 | ||||||||
Increase (decrease) in accrued taxes | 20,965 | 2,319 | 1,690 | |||||||||
Increase (decrease) in accrued salaries and wages | (6,997 | ) | 4,998 | 4,440 | ||||||||
Increase (decrease) in self-insurance reserves | 881 | (133 | ) | (136 | ) | |||||||
Increase (decrease) in other current liabilities | (5,311 | ) | 6,630 | (386 | ) | |||||||
Increase (decrease) in other liabilities | (3,519 | ) | 6,369 | 2,503 | ||||||||
Net cash from operating activities | 342,217 | 337,103 | 324,457 | |||||||||
CASH FLOWS FOR INVESTING ACTIVITIES | ||||||||||||
Capital expenditures | $ | (175,865 | ) | $ | (166,719 | ) | $ | (120,448 | ) | |||
Sale of non-core asset | — | 1,377 | 15,297 | |||||||||
Purchase of preferred equity investment | (2,000 | ) | — | — | ||||||||
Net cash for investing activities | (177,865 | ) | (165,342 | ) | (105,151 | ) | ||||||
CASH FLOWS FOR FINANCING ACTIVITIES | ||||||||||||
Term debt borrowings | — | — | 630,000 | |||||||||
Note borrowings | — | 450,000 | 500,000 | |||||||||
Term debt payments, including early termination penalties | — | (10,000 | ) | (1,142,250 | ) | |||||||
Note payments, including early termination penalties | — | (426,148 | ) | — | ||||||||
Distributions paid to partners | (172,614 | ) | (159,432 | ) | (143,457 | ) | ||||||
Payment of debt issuance costs | — | (9,795 | ) | (23,532 | ) | |||||||
Exercise of limited partnership unit options | — | — | 52 | |||||||||
Tax effect of units involved in treasury unit transactions | (1,589 | ) | 140 | 855 | ||||||||
Net cash for financing activities | (174,203 | ) | (155,235 | ) | (178,332 | ) | ||||||
EFFECT OF EXCHANGE RATE CHANGES ON CASH AND CASH EQUIVALENTS | (2,432 | ) | (2,742 | ) | (1,748 | ) | ||||||
CASH AND CASH EQUIVALENTS | ||||||||||||
Net increase (decrease) for the year | (12,283 | ) | 13,784 | 39,226 | ||||||||
Balance, beginning of year | 131,840 | 118,056 | 78,830 | |||||||||
Balance, end of year | $ | 119,557 | $ | 131,840 | $ | 118,056 | ||||||
SUPPLEMENTAL INFORMATION | ||||||||||||
Cash payments for interest expense | $ | 84,963 | $ | 104,198 | $ | 90,834 | ||||||
Interest capitalized | 3,094 | 2,983 | 1,610 | |||||||||
Cash payments for income taxes, net of refunds | 19,976 | 11,162 | 14,822 | |||||||||
Capital expenditures in accounts payable | 2,357 | 12,262 | 4,099 | |||||||||
The accompanying Notes to Consolidated Financial Statements are an integral part of these statements.
29
CEDAR FAIR, L.P.
CONSOLIDATED STATEMENTS OF PARTNERS’ EQUITY
(In thousands, except per unit amounts)
For the years ended December 31, | 2015 | 2014 | 2013 | ||||||||
Limited Partnership Units Outstanding | |||||||||||
Beginning balance | 55,828 | 55,716 | 55,618 | ||||||||
Limited partnership unit options exercised | 50 | 19 | 6 | ||||||||
Limited partnership unit forfeitures | (1 | ) | (2 | ) | (1 | ) | |||||
Issuance of limited partnership units related to compensation | 141 | 95 | 93 | ||||||||
56,018 | 55,828 | 55,716 | |||||||||
Limited Partners’ Equity | |||||||||||
Beginning balance | $ | 101,556 | $ | 148,847 | $ | 177,660 | |||||
Net income | 112,221 | 104,214 | 108,203 | ||||||||
Partnership distribution declared (2015 - $3.08; 2014 - $2.85; 2013 - $2.58) | (172,614 | ) | (159,430 | ) | (143,457 | ) | |||||
Expense recognized for limited partnership unit options | 580 | 890 | 903 | ||||||||
Cash received for limited partnership unit options exercised | — | — | 52 | ||||||||
Tax effect of units involved in treasury unit transactions | (1,589 | ) | 140 | 855 | |||||||
Issuance of limited partnership units related to compensation | 8,274 | 6,895 | 4,631 | ||||||||
48,428 | 101,556 | 148,847 | |||||||||
General Partner’s Equity | |||||||||||
Beginning balance | 1 | 2 | 1 | ||||||||
Partnership distribution declared | (2 | ) | (2 | ) | — | ||||||
Net income | 1 | 1 | 1 | ||||||||
— | 1 | 2 | |||||||||
Special L.P. Interests | 5,290 | 5,290 | 5,290 | ||||||||
Accumulated Other Comprehensive Income (Loss) | |||||||||||
Cumulative foreign currency translation adjustment: | |||||||||||
Beginning balance | 5,936 | 5 | (2,751 | ) | |||||||
Current year activity, net of tax ($9,050) in 2015, ($3,410) in 2014, ($1,586) in 2013) | 16,655 | 5,931 | 2,756 | ||||||||
22,591 | 5,936 | 5 | |||||||||
Unrealized loss on cash flow hedging derivatives: | |||||||||||
Beginning balance | (16,566 | ) | (15,013 | ) | (25,749 | ) | |||||
Current year activity, net of tax $625 in 2015, $288 in 2014, ($1,745) in 2013) | (2,734 | ) | (1,553 | ) | 10,736 | ||||||
(19,300 | ) | (16,566 | ) | (15,013 | ) | ||||||
3,291 | (10,630 | ) | (15,008 | ) | |||||||
Total Partners’ Equity | $ | 57,009 | $ | 96,217 | $ | 139,131 | |||||
The accompanying Notes to Consolidated Financial Statements are an integral part of these statements.
30
Notes To Consolidated Financial Statements
(1) Partnership Organization:
Cedar Fair, L.P. (together with its affiliated companies, the "Partnership") is a Delaware limited partnership that commenced operations in 1983 when it acquired Cedar Point, Inc., and became a publicly traded partnership in 1987. The Partnership's general partner is Cedar Fair Management, Inc., an Ohio corporation (the “General Partner”), whose shares are held by an Ohio trust. The General Partner owns a 0.001% interest in the Partnership's income, losses and cash distributions, except in defined circumstances, and has full responsibility for management of the Partnership. At December 31, 2015 there were 56,017,824 outstanding limited partnership units listed on The New York Stock Exchange, net of 1,044,159 units held in treasury. At December 31, 2014, there were 55,827,658 outstanding limited partnership units listed, net of 1,234,325 units held in treasury.
The General Partner may, with the approval of a specified percentage of the limited partners, make additional capital contributions to the Partnership, but is only obligated to do so if the liabilities of the Partnership cannot otherwise be paid or there exists a negative balance in its capital account at the time of its withdrawal from the Partnership. The General Partner, in accordance with the terms of the Partnership Agreement, is required to make regular cash distributions on a quarterly basis of all the Partnership's available cash, as defined in the Partnership Agreement. In accordance with the Partnership agreement and restrictions within the Partnership's 2013 Credit Agreement, the General Partner paid $3.08 per limited partner unit in distributions, or approximately $172.6 million in aggregate, in 2015.
(2) Summary of Significant Accounting Policies:
The following policies are used by the Partnership in its preparation of the accompanying consolidated financial statements.
Principles of Consolidation The consolidated financial statements include the accounts of the Partnership and its subsidiaries, all of which are wholly owned. Intercompany transactions and balances are eliminated in consolidation.
Foreign Currency The financial statements of the Partnership's Canadian subsidiary are measured using the Canadian dollar as its functional currency. Assets and liabilities are translated into U.S. dollars at current currency exchange rates, while income and expenses are translated at average monthly currency exchange rates. Translation gains and losses are included as components of accumulated other comprehensive income in partners' equity.
In 2015, the Partnership recognized a $81.0 million charge to earnings for unrealized/realized foreign currency losses, $81.6 million related to U.S.-dollar denominated debt held at its Canadian property. In 2014, the Partnership recognized a $40.9 million charge to earnings for unrealized/realized foreign currency losses, $39.1 million of which represented an unrealized foreign currency loss on the U.S.-dollar denominated debt held at its Canadian property. In 2013, the Partnership recognized a $28.9 million charge to earnings for unrealized/realized foreign currency losses, $27.8 million of which represented an unrealized foreign currency losses on the U.S.-dollar denominated debt held at its Canadian property. All other transaction gains and losses included in the 2015, 2014 and 2013 consolidated statements of operations were not material.
Segment Reporting Each of the Partnership's parks operates autonomously, and management reviews operating results, evaluates performance and makes operating decisions, including the allocation of resources, on a property-by-property basis. In addition to reviewing and evaluating performance of the business at the individual park level, the structure of the Partnership's management incentive compensation systems are centered around the operating results of each park as an integrated operating unit. Therefore, each park represents a separate operating segment of the Partnership's business. Although the Partnership manages its parks with a high degree of autonomy, each park offers and markets a similar collection of products and services to similar customers. In addition, the parks all have similar economic characteristics, in that they all show similar long-term growth trends in key industry metrics such as attendance, guest per capita spending, net revenue, operating costs and operating profit. Therefore, the Partnership operates within the single reportable segment of amusement/water parks with accompanying resort facilities.
Estimates The preparation of financial statements in conformity with generally accepted accounting principles requires management to make estimates and assumptions that affect the reported amounts of assets and liabilities and disclosure of contingent assets and liabilities at the date of the financial statements, and the reported amounts of revenues and expenses during each period. Actual results could differ from those estimates.
Cash and Cash Equivalents The Partnership considers all highly liquid instruments purchased with an original maturity of three months or less to be cash equivalents.
Inventories The Partnership's inventories primarily consist of purchased products, such as merchandise and food, for sale to its customers. Inventories are stated at the lower of cost or market using the first-in, first-out (FIFO) or average cost methods of accounting at the park level.
Property and Equipment Property and equipment are recorded at cost. Expenditures made to maintain such assets in their original operating condition are expensed as incurred, and improvements and upgrades are generally capitalized. Depreciation is computed on a straight-line basis over the estimated useful lives of the assets. Depreciation expense totaled $125.5 million in 2015, $124.3 million in 2014, and $122.4 million in 2013.
31
The estimated useful lives of the assets are as follows:
Land improvements | Approximately | 25 years | ||
Buildings | 25 years | - | 40 years | |
Rides | Approximately | 20 years | ||
Equipment | 3 years | - | 10 years | |
Impairment of Long-Lived Assets Financial Accounting Standards Board (FASB) Accounting Standards Codification (ASC) 360 “Property, Plant, and Equipment” requires that long-lived assets be reviewed for impairment upon the occurrence of events or changes in circumstances that would indicate that the carrying value of the assets may not be recoverable. An impairment loss may be recognized when estimated undiscounted future cash flows expected to result from the use of the asset, including disposition, are less than the carrying value of the asset. The measurement of the impairment loss to be recognized is based on the difference between the fair value and the carrying amounts of the assets. Fair value is generally determined based on a discounted cash flow analysis. In order to determine if an asset has been impaired, assets are grouped and tested at the lowest level for which identifiable, independent cash flows are available.
Goodwill FASB ASC 350 “Intangibles - Goodwill and Other” requires that goodwill be tested for impairment. An impairment charge would be recognized for the amount, if any, by which the carrying amount of goodwill exceeds its implied fair value. The fair value of a reporting unit and the related implied fair value of its respective goodwill are established using a combination of an income (discounted cash flow) approach and market approach. Goodwill is reviewed annually for impairment, or whenever events or changes in circumstances indicate that the carrying value may not be recoverable. All of the Partnership's goodwill is allocated to its reporting units and goodwill impairment tests are performed at the reporting unit level.
The Partnership changed the annual goodwill impairment testing date from the last day of the fourth quarter to the first day of the fourth quarter during 2015. The Partnership believes this voluntary change is preferable because it better aligns our goodwill impairment testing procedures with the completion of our annual financial and strategic planning process and provides us with adequate time to evaluate goodwill for impairment. This change in accounting principle did not delay, accelerate or avoid an impairment loss, nor did the change have a cumulative effect on net income or loss, or partners' equity. The Partnership determined that it would be impracticable to objectively determine projected cash flows and related valuation estimates that would have been used as of each first day of the fourth quarter for each of our prior reporting periods without the use of hindsight. As such, the Partnership applied the change in annual goodwill impairment testing date prospectively beginning September 28, 2015, the first day of the fourth quarter, and concluded there was no impairment of the carrying value of the goodwill as of the testing date.
Other Intangible Assets The Partnership's other intangible assets consist primarily of trade-names and license and franchise agreements. The Partnership assesses the indefinite-lived trade-names for impairment separately from goodwill. After considering the expected use of the trade-names and reviewing any legal, regulatory, contractual, obsolescence, demand, competitive or other economic factors that could limit the useful lives of the trade-names, in accordance with FASB ASC 350, the Partnership determined that the trade-names had indefinite lives. Pursuant to FASB ASC 350, indefinite-lived intangible assets are no longer amortized, but rather are reviewed, along with goodwill, annually for impairment or more frequently if impairment indicators arise. The Partnership's license and franchise agreements are amortized over the life of the agreement, generally ranging from five to twenty years.
Self-Insurance Reserves Reserves are recorded for the estimated amounts of guest and employee claims and expenses incurred each period that are not covered by insurance. Reserves are established for both identified claims and incurred but not reported (IBNR) claims. Such amounts are accrued for when claim amounts become probable and estimable. Reserves for identified claims are based upon the Partnership's own historical claims experience and third-party estimates of settlement costs. Reserves for IBNR claims, which are not material to our consolidated financial statements, are based upon the Partnership's own claims data history. All reserves are periodically reviewed for changes in facts and circumstances and adjustments are made as necessary. At December 31, 2015 and 2014 the accrued reserves totaled $24.0 million and $23.4 million, respectively.
Derivative Financial Instruments The Partnership is exposed to market risks, primarily resulting from changes in interest rates and currency exchange rates. To manage these risks, it may enter into derivative transactions pursuant to its overall financial risk management program. The Partnership does not use derivative financial instruments for trading purposes.
The Partnership accounts for the use of derivative financial instruments according to FASB ASC 815 “Derivatives and Hedging”. For derivative instruments that hedge the exposure of variability in short-term rates, designated as cash flow hedges, the effective portion of the change in fair value of the derivative instrument is reported as a component of “Other comprehensive income (loss)” and reclassified into earnings in the period during which the hedged transaction affects earnings. For the ineffective portion of a derivative, the change in fair value, if any, is reported in “Net effect of swaps” in earnings together with the changes in fair value of derivatives not designated as hedges. Derivative financial instruments used in hedging transactions are assessed both at inception and quarterly thereafter to ensure they are effective in offsetting changes in either the fair value or cash flows of the related underlying exposures.
Revenue Recognition Revenues on multi-use products are recognized over the estimated number of uses expected for each type of product and are adjusted periodically during the operating season prior to the ticket or product expiration, which occurs no later than the close of the operating season or December 31 each year. Other revenues are recognized on a daily basis based on actual guest spending at our facilities, or over the park operating season in the case of certain marina revenues and certain sponsorship revenues. Revenues on multi-use products for the next operating season are deferred in the year received and recognized as revenue in the following operating season.
32
Admission revenues include amounts paid to gain admission into our parks, including parking fees. Revenues related to extra-charge attractions, including our premium benefit offerings like our front-of-line products, are included in Accommodations, extra-charge products and other revenue.
Advertising Costs The Partnership expenses all costs associated with its advertising, promotion and marketing programs over each park's operating season, including certain costs incurred prior to the season that are amortized over the season. Advertising expense totaled $58.7 million in 2015, $58.4 million in 2014 and $57.8 million in 2013. Certain prepaid costs incurred through year-end for the following year's advertising programs are included in other current assets.
Unit-Based Compensation The Partnership accounts for unit-based compensation in accordance with FASB ASC 718 “Compensation - Stock Compensation” which requires measurement of compensation cost for all equity-based awards at fair value on the date of grant and recognition of compensation over the service period for awards expected to vest. The Partnership uses a binomial option-pricing model for all grant date estimations of fair value.
Income Taxes The Partnership's legal entity structure includes both partnerships and corporate subsidiaries. As a publicly traded partnership, the Partnership is subject to an entity-level tax (the "PTP tax"). Accordingly, the Partnership itself is not subject to corporate income taxes; rather, the Partnership's tax attributes (except those of the corporate subsidiaries) are included in the tax returns of its partners. The Partnership's corporate subsidiaries are subject to entity-level income taxes.
Neither the Partnership's financial reporting income, nor the cash distributions to unitholders, can be used as a substitute for the detailed tax calculations that the Partnership must perform annually for its partners. Net income from the Partnership is not treated as “passive income” for federal income tax purposes. As a result, partners subject to the passive activity loss rules are not permitted to offset income from the Partnership with passive losses from other sources.
The Partnership's corporate subsidiaries account for income taxes under the asset and liability method. Accordingly, deferred tax assets and liabilities are recognized for the future book and tax consequences attributable to temporary differences between the financial statement carrying amounts of existing assets and liabilities and their respective tax bases. Deferred tax assets and liabilities are determined using enacted tax rates expected to apply in the year in which those temporary differences are expected to be recovered or settled. The effect on deferred tax assets and liabilities of a change in tax rates is recognized in income at the time of enactment of such change in tax rates. Any interest or penalties due for payment of income taxes are included in the provision for income taxes. The Partnership's total provision for taxes includes PTP taxes owed (see Note 9).
Earnings Per Unit For purposes of calculating the basic and diluted earnings per limited partner unit, no adjustments have been made to the reported amounts of net income. The unit amounts used are as follows:
2015 | 2014 | 2013 | ||||||||||
(In thousands except per unit amounts) | ||||||||||||
Basic weighted average units outstanding | 55,745 | 55,548 | 55,476 | |||||||||
Effect of dilutive units: | ||||||||||||
Deferred units (Note 7) | 23 | 6 | — | |||||||||
Performance units (Note 7) | 72 | 31 | — | |||||||||
Restricted units (Note 7) | 358 | 195 | 103 | |||||||||
Unit options (Note 7) | 141 | 123 | 59 | |||||||||
Phantom units (Note 7) | 23 | 89 | 187 | |||||||||
Diluted weighted average units outstanding | 56,362 | 55,992 | 55,825 | |||||||||
Net income per unit - basic | $ | 2.01 | $ | 1.88 | $ | 1.95 | ||||||
Net income per unit - diluted | $ | 1.99 | $ | 1.86 | $ | 1.94 | ||||||
The effect of out-of-the-money and/or antidilutive unit options for 2015, 2014, and 2013, respectively, had they not been out of the money or antidilutive, would have been immaterial in all periods presented.
Accounting pronouncements
In May 2014, the FASB issued Accounting Standards Update No. 2014-09, Revenue from Contracts with Customers ("ASU 2014-09"). The amendments in ASU 2014-09 provide for a single, principles-based model for revenue recognition that replaces the existing revenue recognition guidance. ASU 2014-09 is effective for annual and interim periods beginning on or after December 15, 2017 and will replace most existing revenue recognition guidance under U.S. GAAP when it becomes effective. It permits the use of either a retrospective or cumulative effect
33
transition method and early adoption is not permitted. The Partnership has not yet selected a transition method and is in the process of evaluating the effect this standard will have on the consolidated financial statements and related disclosures.
In April 2015, the FASB issued Accounting Standards Update No. 2015-03, Simplifying the Presentation of Debt Issuance Costs ("ASU 2015-03"). The amendments in ASU 2015-03 require that debt issuance costs related to a recognized debt liability be presented in the balance sheet as a direct reduction from the carrying value of the corresponding debt liability, consistent with debt discounts. This ASU requires retrospective adoption and will be effective for annual and interim periods beginning on or after December 15, 2015 with early adoption permitted. We do not expect adoption of ASU 2015-03 to have an impact on our consolidated statements of operations or consolidated statements of cash flows. The impact of the adoption of this guidance will result in the reclassification of the unamortized debt issuance costs on the consolidated balance sheets, which were $19.7 million and $24.6 million, at December 31, 2015 and 2014, respectively.
In November 2015, the FASB issued Accounting Standards Update No. 2015-17, Balance Sheet Classification of Deferred Taxes ("ASU 2015-17"). The amendments in ASU 2015-17 require that deferred tax assets and liabilities to be classified as non-current in the Consolidated Balance Sheet. This ASU is effective for fiscal years beginning after December 15, 2016 and for interim periods within those fiscal years, with early adoption permitted. The guidance may be applied either prospectively to all deferred tax liabilities and assets or retrospectively to all periods presented. The impact of the adoption of this guidance will result in the reclassification of the current deferred tax assets to net against the deferred tax liability on the consolidated balance sheets, which would reduce both current deferred tax asset and deferred tax liability by
$12.2 million and $9.3 million, at December 31, 2015 and 2014, respectively.
(3) Long-Lived Assets:
Long-lived assets are reviewed for impairment upon the occurrence of events or changes in circumstances that would indicate that the carrying value of the assets may not be recoverable. In order to determine if an asset has been impaired, assets are grouped and tested at the lowest level for which identifiable, independent cash flows are available. A significant amount of judgment is involved in determining if an indicator of impairment has occurred. Such indicators may include, among others: a significant decline in expected future cash flows; a sustained, significant decline in equity price and market capitalization; a significant adverse change in legal factors or in the business climate; unanticipated competition; and slower growth rates. Any adverse change in these factors could have a significant impact on the recoverability of these assets and could have a material impact on our consolidated financial statements.
The long-lived asset impairment test involves a two-step process. The first step is a comparison of each asset group's carrying value to its estimated undiscounted future cash flows expected to result from the use of the assets, including disposition. Projected future cash flows reflect management's best estimates of economic and market conditions over the projected period, including growth rates in revenues and costs, estimates of future expected changes in operating margins and cash expenditures. Other significant estimates and assumptions include terminal value growth rates. If the carrying value of the asset group is higher than its undiscounted future cash flows, there is an indication that impairment exists and the second step must be performed to measure the amount of impairment loss. The amount of impairment is determined by comparing the implied fair value of the asset group to its carrying value in a manner consistent with the highest and best use of those assets. The Partnership estimates fair value of operating assets using an income (discounted cash flows) approach, which uses an asset group's projection of estimated operating results and cash flows that is discounted using a weighted-average cost of capital reflective of current market conditions. If the implied fair value of the assets is less than their carrying value, an impairment charge is recorded for the difference.
Non-operating assets are evaluated for impairment based on changes in market conditions. When changes in market conditions are observed, impairment is estimated using a market-based approach. If the estimated fair value of the non-operating assets is less than their carrying value, an impairment charge is recorded for the difference.
At the end of the fourth quarter of 2015, the Partnership decided to permanently remove from service a long-lived asset at Cedar Point. Accordingly, the Partnership recognized and recorded an $8.6 million charge for impairment equal to the remaining net book value of this long-lived asset. The amount was recorded in "Loss on impairment / retirement of fixed assets, net" on the consolidated statement of operations and comprehensive income.
At the end of the fourth quarter of 2014, the Partnership concluded based on current operating results and updated forecasts, that a review of the carrying value of operating long-lived assets at Wildwater Kingdom was warranted. After performing its review, the Partnership determined that the park's fixed assets were impaired by $2.4 million. A charge for this amount was recorded in "Loss on impairment / retirement of fixed assets, net" on the consolidated statement of operations and comprehensive income.
(4) Goodwill and Other Intangible Assets:
Goodwill and other indefinite-lived intangible assets, including trade-names, are reviewed for impairment annually, or more frequently if indicators of impairment exist. A significant amount of judgment is involved in determining if an indicator of impairment has occurred. Such indicators may include, among others: a significant decline in expected future cash flows; a sustained, significant decline in equity price and market capitalization; a significant adverse change in legal factors or in the business climate; unanticipated competition; the testing for recoverability of a significant asset group within a reporting unit; and slower growth rates. Any adverse change in these factors could have a significant impact on the recoverability of these assets and could have a material impact on our consolidated financial statements.
34
The goodwill impairment test involves a two-step process. The first step is a comparison of each reporting unit's fair value to its carrying value. The Partnership estimates fair value using both an income (discounted cash flows) and market approach. The income approach uses a reporting unit's projection of estimated operating results and cash flows that is discounted using a weighted-average cost of capital that reflects current market conditions. The projection uses management's best estimates of economic and market conditions over the projected period including growth rates in revenues and costs, estimates of future expected changes in operating margins and cash expenditures. Other significant estimates and assumptions include terminal value growth rates, future estimates of capital expenditures and changes in future working capital requirements. A market approach estimates fair value by applying cash flow multiples to the reporting unit's operating performance. The multiples are derived from comparable publicly traded companies with similar operating and investment characteristics of the reporting units.
If the carrying value of the reporting unit is higher than its fair value, there is an indication that impairment may exist and the second step must be performed to measure the amount of impairment loss. The amount of impairment is determined by comparing the implied fair value of reporting unit goodwill to the carrying value of the goodwill in the same manner as if the reporting unit was being acquired in a business combination. If the implied fair value of goodwill is less than the recorded goodwill, an impairment charge is recorded for the difference.
A relief-from-royalty model is used to determine whether the fair value of trade-names exceed their carrying amounts. The fair value of the trade-names is determined as the present value of fees avoided by owning the respective trade-name.
A summary of changes in the Partnership's carrying value of goodwill is as follows:
Accumulated | ||||||||||||
Goodwill | Impairment | Goodwill | ||||||||||
(gross) | Losses | (net) | ||||||||||
($'s in thousands) | ||||||||||||
Balance at December 31, 2013 | $ | 317,957 | $ | (79,868 | ) | $ | 238,089 | |||||
Foreign currency exchange translation | (9,798 | ) | — | (9,798 | ) | |||||||
Balance at December 31, 2014 | 308,159 | (79,868 | ) | 228,291 | ||||||||
Foreign currency exchange translation | (17,480 | ) | — | (17,480 | ) | |||||||
Balance at December 31, 2015 | $ | 290,679 | $ | (79,868 | ) | $ | 210,811 | |||||
The Partnership's other intangible assets consisted of the following at December 31, 2015 and 2014:
Weighted | |||||||||||||||
Average | Gross | Net | |||||||||||||
Amortization | Carrying | Accumulated | Carrying | ||||||||||||
Period | Amount | Amortization | Value | ||||||||||||
($'s in thousands) | |||||||||||||||
December 31, 2015 | |||||||||||||||
Other intangible assets: | |||||||||||||||
Trade names | — | $ | 35,208 | $ | — | $ | 35,208 | ||||||||
License / franchise agreements | 8.4 years | 1,067 | 380 | 687 | |||||||||||
Total other intangible assets | 8.4 years | $ | 36,275 | $ | 380 | $ | 35,895 | ||||||||
December 31, 2014 | |||||||||||||||
Other intangible assets: | |||||||||||||||
Trade names | — | $ | 37,683 | $ | — | $ | 37,683 | ||||||||
License / franchise agreements | 13.5 years | 818 | 310 | 508 | |||||||||||
Total other intangible assets | 13.5 years | $ | 38,501 | $ | 310 | $ | 38,191 | ||||||||
Amortization expense of other intangible assets for 2015, 2014, and 2013 was immaterial and is expected to be immaterial going forward.
35
(5) Long-Term Debt:
Long-term debt at December 31, 2015 and 2014:
($'s in thousands) | 2015 | 2014 | ||||||
Revolving credit facility (due 2018) | $ | — | $ | — | ||||
Term debt (1) | ||||||||
March 2013 U.S. term loan averaging 3.25% at 2013 (due 2013-2020) | 608,850 | 608,850 | ||||||
Notes | ||||||||
June 2014 U.S. fixed rate note at 5.375% (due 2024) | 450,000 | 450,000 | ||||||
March 2013 U.S. fixed rate note at 5.25% (due 2021) | 500,000 | 500,000 | ||||||
1,558,850 | 1,558,850 | |||||||
Less: current portion | 2,475 | — | ||||||
$ | 1,556,375 | $ | 1,558,850 | |||||
(1) | These average interest rates do not reflect the effect of interest rate swap agreements entered into on variable-rate term debt (see Note 6). |
In March 2013, the Partnership issued $500 million of 5.25% senior unsecured notes, maturing in 2021. Concurrently with this offering, the Partnership entered into a new $885 million credit agreement (as amended, the "2013 Credit Agreement"), which included a $630 million senior secured term loan facility and a $255 million senior secured revolving credit facility. The Partnership has historically used LIBOR as its rate for borrowings. The terms of the senior secured term loan facility include a maturity date of March 6, 2020 and an interest rate of LIBOR plus 250 bps with a LIBOR floor of 75 bps. The term loan amortizes at $6.3 million annually. During the fourth quarter of 2014, $10 million of term debt was prepaid, resulting in no amortizing amounts due until the third quarter of 2016. The net proceeds from the notes issued in March 2013 and borrowings under the 2013 Credit Agreement were used to repay in full all amounts outstanding under the previous credit facilities. The facilities provided under the 2013 Credit Agreement are collateralized by substantially all of the assets of the Partnership.
In June of 2014, the Partnership issued $450 million of 5.375% senior unsecured notes ("June 2014 notes"), maturing in 2024. The net proceeds from the offering of the June 2014 notes were used to redeem in full all of the Partnership’s $405 million of 9.125% senior unsecured notes that were scheduled to mature in 2018 (and which included $5.6 million of Original Issue Discount ("OID") to yield 9.375%), to satisfy and discharge the indenture governing the notes that were redeemed and for general corporate purposes.
Cedar Fair, L.P., Canada’s Wonderland Company ("Cedar Canada"), and Magnum Management Corporation ("Magnum") are the co-issuers of the notes and co-borrowers of the senior secured credit facilities. In December 2014, the Partnership amended its credit agreement in order to add Millennium Operations, LLC, a newly converted wholly-owned limited liability company, as a co-borrower in connection with the Partnership's on-going long term tax planning efforts. The amendment was effective beginning on January 1, 2015. Both the notes and senior secured credit facilities have been fully and unconditionally guaranteed, on a joint and several basis, by each 100% owned subsidiary of Cedar Fair (other than Cedar Canada and Magnum). There are no non-guarantor subsidiaries.
Revolving Credit Loans Terms of the 2013 Credit Agreement include a combined $255 million revolving credit facility. Under the agreement, the Canadian portion of the revolving credit facility has a sub-limit of $15 million. U.S. denominated and Canadian denominated loans made under the revolving credit facility bear interest at a rate of LIBOR plus 225 basis points (bps). The revolving credit facility, which matures in March 2018, also provides for the issuance of documentary and standby letters of credit. As of December 31, 2015, no borrowings under the revolving credit facility were outstanding and standby letters of credit totaled $16.3 million. After letters of credit, the Partnership had $238.7 million of available borrowings under its revolving credit facility as of December 31, 2015. The maximum outstanding balance during 2015 was $85.0 million under the revolving credit facility. The 2013 Credit Agreement requires the Partnership to pay a commitment fee of 38 bps per annum on the unused portion of the credit facilities.
Term Debt The credit facilities provided under the 2013 Credit Agreement include a $630 million U.S. term loan maturing in March 2020. As of December 31, 2015, the U.S. term loan bore interest at a rate of LIBOR plus 250 bps, with a LIBOR floor of 75 bps.
At December 31, 2015, the scheduled annual maturities of term debt were as follows ($'s in thousands):
2016 | 2017 | 2018 | 2019 | 2020 | 2021 & Beyond | Total | |||||||||||||||||||||
U.S. Term loan maturing in 2020 | $ | 2,475 | $ | 6,300 | $ | 6,300 | $ | 6,300 | $ | 587,475 | $ | — | $ | 608,850 | |||||||||||||
The Partnership may prepay some or all of its term debt maturing in 2020 without premium or penalty at any time.
Notes The notes issued by the Partnership in March 2013 pay interest semi-annually in March and September, with the principal due in full on March 15, 2021. The notes may be redeemed, in whole or in part, at any time prior to March 15, 2016 at a price equal to 100% of the principal
36
amount of the notes redeemed plus a “make-whole” premium together with accrued and unpaid interest, if any, to the redemption date. Thereafter, the notes may be redeemed, in whole or in part, at various prices depending on the date redeemed. Prior to March 15, 2016, up to 35% of the notes may be redeemed with the net cash proceeds of certain equity offerings at a price equal to 105.25%, together with accrued and unpaid interest.
The notes issued by the Partnership in June 2014 pay interest semi-annually in June and December, with the principal due in full on June 1, 2024. The notes may be redeemed, in whole or in part, at any time prior to June 1, 2019 at a price equal to 100% of the principal amount of the notes redeemed plus a “make-whole” premium together with accrued and unpaid interest, if any, to the redemption date. Thereafter, the notes may be redeemed, in whole or in part, at various prices depending on the date redeemed. Prior to June 1, 2017, up to 35% of the notes may be redeemed with the net cash proceeds of certain equity offerings at a price equal to 105.375% together with accrued and unpaid interest.
As market conditions warrant, the Partnership may from time to time repurchase debt securities issued by the Partnership, in privately negotiated or open market transactions, by tender offer, exchange offer or otherwise.
Covenants The 2013 Credit Agreement requires us to maintain specified financial ratios, which if breached for any reason and not cured, could result in an event of default under the agreement. The most restrictive of these ratios is the Consolidated Leverage Ratio. At the end of the fourth quarter of 2015 and 2014, this ratio was set at a maximum of 5.75x and 6.00x consolidated total debt (excluding the revolving debt)-to-consolidated EBITDA, respectively. The ratio decreased by 0.25x at the beginning of the second quarter and will decrease each second quarter until it reaches 5.25x. As of December 31, 2015 and 2014 , we were in compliance with this ratio and all other covenants under the 2013 Credit Agreement. The 2013 Credit Agreement allows restricted payments of up to $60 million annually so long as no default or event of default has occurred and is continuing and so long as the Partnership would be in compliance with certain financial ratios after giving effect to the payments. Additional restricted payments are allowed to be made based on an Excess-Cash-Flow formula, should our pro-forma Consolidated Leverage Ratio be less than or equal to 5.00x.
The indentures governing our notes also include annual restricted payment limitations and additional permitted payment formulas. We can make restricted payments of $60 million annually so long as no default or event of default has occurred and is continuing. We can make additional restricted payments if our pro forma Total Indebtedness-to-Consolidated-Cash-Flow Ratio is less than or equal to 5.00x.
(6) Derivative Financial Instruments:
Derivative financial instruments are used within the Partnership’s overall risk management program to manage certain interest rate and foreign currency risks. By utilizing a derivative instrument to hedge our exposure to LIBOR rate changes, the Partnership is exposed to counterparty credit risk. Counterparty credit risk is the failure of the counterparty to perform under the terms of the derivative contract. To mitigate this risk, hedging instruments are placed with a counterparty that the Partnership believes poses minimal credit risk. The Partnership does not use derivative financial instruments for trading purposes.
As of December 31, 2015, the Partnership has four interest rate swap agreements that effectively convert $500 million of variable-rate debt to fixed rates. These swaps, which are designated as cash flow hedges, mature on December 31, 2018 and fix LIBOR at a weighted average rate of 2.94%. As of December 31, 2014, in addition to the $500 million of swaps maturing on December 31, 2018, the Partnership had $800 million of variable-rate debt to fixed rates swaps which subsequently matured in December 2015 and fixed LIBOR at a weighted average rate of 2.38%. These swaps were de-designated as cash flow hedges.
The fair market value of the Partnership's swap portfolio was a liability of $22.9 million and $26.4 million, at December 31, 2015 and 2014, respectively, and was recorded on the consolidated balance sheet as listed below.
($'s in thousands): | Consolidated Balance Sheet Location | Fair Value as of | Fair Value as of | |||||||
December 31, 2015 | December 31, 2014 | |||||||||
Derivatives designated as hedging instruments: | ||||||||||
Interest rate swaps | Derivative Liability | $ | (22,918 | ) | $ | (14,649 | ) | |||
Total derivatives designated as hedging instruments: | (22,918 | ) | (14,649 | ) | ||||||
Derivatives not designated as hedging instruments: | ||||||||||
Interest rate swaps | Current Derivative Liability | — | (11,791 | ) | ||||||
Total derivatives not designated as hedging instruments: | — | (11,791 | ) | |||||||
Net derivative liability | $ | (22,918 | ) | $ | (26,440 | ) | ||||
37
Derivatives Designated as Hedging Instruments
Changes in fair value of highly effective hedges are recorded as a component of accumulated other comprehensive income in the consolidated balance sheets. Any ineffectiveness is recognized immediately in income. Amounts recorded as a component of accumulated other comprehensive loss are reclassified into earnings in the same period the forecasted transactions affect earnings. In January 2016, the Partnership amended each of its four interest rate swap agreements to extend each of the maturities by two years and fix LIBOR at a rate of 2.64%. As a result of the amendment, the existing interest rate swap agreements were de-designated and the amounts recorded in AOCI will be amortized into earnings through the original December 2018 maturity. The amended interest rate swap agreements were not designated as hedging instruments. There were no other changes to the terms of the agreements beyond those disclosed.
Derivatives Not Designated as Hedging Instruments
Certain interest rate swap contracts were deemed ineffective in prior years and no longer qualified for hedge accounting. As a result of discontinued hedge accounting, the instruments are prospectively adjusted to fair value each reporting period through "Net effect of swaps" on the consolidated statements of operations and comprehensive income. The amounts that were previously recorded as a component of accumulated other comprehensive income prior to the de-designation are reclassified to earnings and a corresponding realized gain or loss was recognized when the forecasted cash flow occurred. As of December 31, 2015 we had no amounts that were forecasted to be reclassified into earnings in the next twelve months for de-designated derivatives.
Effects of Derivative Instruments on Income and Other Comprehensive Income (Loss):
($'s in thousands): | Amount of (Loss) recognized in OCI on Derivatives (Effective Portion) | Amount and Location of (Loss) Reclassified from Accumulated OCI into Income (Effective Portion) | Amount and Location of Gain Recognized in Income on Derivatives | |||||||||||||||||||||||||
Designated Derivatives | Year ended 12/31/15 | Year ended 12/31/14 | Designated Derivatives | Year ended 12/31/15 | Year ended 12/31/14 | Derivatives Not Designated | Year ended 12/31/15 | Year ended 12/31/14 | ||||||||||||||||||||
Interest rate swaps | $ | (8,269 | ) | $ | (10,735 | ) | Interest Expense | $ | (517 | ) | $ | — | Net effect of swaps | $ | 11,791 | $ | 10,958 | |||||||||||
For 2015, the Partnership recognized $11.8 million in income for the gain on the derivatives not designated as cash flow hedges as noted in the table above, $4.9 million of expense representing the amortization of amounts in AOCI for the swaps. The net effect of these amounts resulted in a benefit to earnings for the year of $6.9 million recorded in “Net effect of swaps.”
For 2014, the Partnership recognized $11.0 million of gain in income on the ineffective portion of both designated and not designated derivatives as noted in the table above, $7.9 million of expense representing the amortization of amounts in AOCI for the swaps and $1.0 million of expense related to the write off of OCI balances on our swaps. The net effect of these amounts resulted in a benefit to earnings for the year of $2.1 million recorded in “Net effect of swaps.”
(7) Partners' Equity:
Special L.P. Interests In accordance with the Partnership Agreement, certain partners were allocated $5.3 million of 1987 and 1988 taxable income (without any related cash distributions) for which they received Special L.P. Interests. The Special L.P. Interests do not participate in cash distributions and have no voting rights. However, the holders of Special L.P. Interests will receive in the aggregate $5.3 million upon liquidation of the Partnership.
Equity-Based Incentive Plan The 2008 Omnibus Incentive Plan was approved by the Partnership's unitholders in May of 2008 allowing the award of up to 2.5 million unit options and other forms of equity as determined by the Compensation Committee of the Board of Directors as an element of compensation to senior management and other key employees. The 2008 Omnibus Plan provides an opportunity for officers, directors, and eligible persons to acquire an interest in the growth and performance of our units and provides employees annual and long-term incentive awards as determined by the Board of Directors. Under the 2008 Omnibus Plan, the Compensation Committee of the Board of Directors may grant unit options, unit appreciation rights, restricted units, performance awards, other unit awards, cash incentive awards and long-term incentive awards.
Awards Payable in Cash or Equity
Phantom Units
During 2015, none of these "phantom units" were awarded. Outstanding "phantom unit" awards generally vest over an approximate four-year period and can be settled with cash, limited partnership units, or a combination of both, as determined by the Compensation Committee. The effect of these outstanding "phantom unit” awards has been included in the diluted earnings per unit calculation, as a portion of the awards are expected to be paid in limited partnership units. Approximately $0.8 million, $1.7 million and $5.0 million in compensation expense related to liability “phantom unit” awards was recognized in 2015, 2014 and 2013, respectively. These amounts are included in “Selling, General and Administrative Expense” in the accompanying Consolidated Statements of Operations and Comprehensive Income.
At December 31, 2015, the Partnership had no “phantom units” outstanding. At December 31, 2014, the aggregate market value of the accrued “phantom units" totaled $3.9 million and was reflected in "Accrued salaries, wages and benefits" on the Balance Sheet.
38
Performance Units
During 2015, none of these "performance units” were awarded. The number of "performance units” issuable under these awards are contingently based upon certain performance targets over a three-year period and these awards can be paid with cash, limited partnership units, or a combination of both as determined by the Compensation Committee, after the end of the performance period. The effect of these outstanding "performance unit” awards for which the performance condition has been met has been included in the diluted earnings per unit calculation, as a portion of the awards are expected to be settled in limited partnership units. The effect of these outstanding "performance unit” awards for which the performance condition has not been met has been excluded from the diluted earnings per unit calculation. Approximately $8.0 million, $5.3 million and $3.6 million in 2015, 2014 and 2013, respectively, were recorded in compensation expense related to these types of “performance units” and are included in “Selling, General and Administrative Expense” in the accompanying Consolidated Statements of Operations and Comprehensive Income.
At December 31, 2015, the Partnership had 276,656 of these types of "performance units” outstanding, 228,394 of which have been accrued for as a liability, at the December 31, 2015 closing price of $55.84 per unit. The estimated aggregate market value of "performance units” contingently issuable under these types of awards at year-end has been reflected on the Balance Sheet, with the current portion being recorded in "Accrued salaries, wages and benefits" and the long-term portion in “Other Liabilities.” At December 31, 2015, the current and long-term portions were $7.4 million and $5.4 million, respectively. At December 31, 2014, the current and long-term portions were $5.2 million and $3.6 million, respectively. At December 31, 2015, unamortized compensation related to unvested "performance unit” awards of this type totaled approximately $2.7 million, which is expected to be amortized over a weighted average period of 1.0 years. The Partnership expects to settle 132,000 of these outstanding "performance units" upon vesting during 2016.
Deferred Units
During 2015, 12,685 "deferred units" were awarded at a grant price of $47.30. Compensation expense related to "deferred units" vests ratably over a 1-year period and the settlement of these units is deferred until the individual's service to the Partnership ends. The "deferred units" accumulate distribution-equivalents once fully vested, which will be paid when the restriction ends. The effect of outstanding "deferred unit” awards has been included in the diluted earnings per unit calculation, as a portion of the awards are expected to be settled in limited partnership units. Approximately $0.8 million, $0.5 million, and $0.0 million in 2015, 2014, and 2013, respectively, were recorded in compensation expense related to "deferred units" and are included in "Selling, General, and Administrative Expense" in the accompanying Consolidated Statement of Operations and Comprehensive Income.
At December 31, 2015, the Partnership had 22,810 "deferred units” outstanding and vested, at the December 31, 2015 closing price of $55.84 per unit. The estimated aggregate market value of the "deferred units” at year-end has been reflected as a liability on the Balance Sheet, with the current portion being recorded in "Other accrued liabilities" and the long-term portion in “Other Liabilities.” At December 31, 2015 and 2014, the market value of the current and long-term portions totaled $1.3 million and $0.5 million, respectively. At December 31, 2015, there was no unamortized expense related to unvested "deferred unit” awards.
Awards Payable in Equity
Performance Units
During 2015, 189,929 of these "performance units” were awarded at a weighted-average grant price of $56.41 per unit. The number of "performance units” issuable under these awards are contingently based upon certain performance targets over the vesting period. The three-year vesting for the annual performance awards and the related forfeitable distribution equivalents, generally are paid out in the first quarter following the performance period in limited partnership units. The 2014 "performance units" payable in equity were retention grant units that would be paid out in limited partnership units in December of the two years following a three-year performance period and the forfeitable distribution equivalents would be paid in cash at that same time. The effect of these types of outstanding "performance unit” awards for which the performance conditions have been met, have been included in the diluted earnings per unit calculation. The effect of these outstanding "performance unit” awards which the performance conditions have not been meet, have been excluded from the diluted earnings per unit calculation. Approximately $3.7 million, $1.4 million, and $0.0 million, in 2015, 2014, and 2013, respectively, were recorded in compensation expense related to “performance units” under this award and are included in “Selling, General and Administrative Expense” in the accompanying Consolidated Statements of Operations and Comprehensive Income.
At December 31, 2015, the Partnership had 313,650 of these "performance units” outstanding, 93,854 of which have been accrued for within equity. At December 31, 2015, unamortized compensation related to these unvested "performance unit” awards totaled approximately $11.9 million, which is expected to be amortized over a weighted average period of 2.7 years. The Partnership does not expect to settle any of these outstanding "performance units" during 2016.
Restricted Units
During 2015, 130,087 "restricted units" were awarded at a weighted-average grant price of $56.43. Compensation expense related to restricted units vests ratably over a three-year period and the restrictions on these units lapse upon vesting. During the time of restriction, the units accumulate forfeitable distribution-equivalents, which, when the units are fully vested, will be paid in the form accrued. Approximately $4.1 million, $3.7 million, and $2.6 million in 2015, 2014, and 2013, respectively, were recorded in compensation expense related to "restricted units" and are included in "Selling, General, and Administrative Expense" in the accompanying Consolidated Statement of Operations and Comprehensive Income. As of December 31, 2015, the amount of forfeitable distribution equivalents accrued and recorded on the Balance Sheet in "Other Liabilities" was approximately $0.8 million.
39
At December 31, 2015, the Partnership had 193,587 "restricted units" outstanding, 72,032 of which have been accrued for within equity. The intrinsic value of "restricted units" for which expense was accrued in 2015 was approximately $0.7 million. At December 31, 2015, unamortized compensation expense related to unvested "restricted unit" awards totaled approximately, $6.9 million, which is expected to be amortized over a weighted average period of 2.3 years. The Partnership expects to settle 40,028 of these outstanding "restricted units" upon vesting during 2016.
Unit Options
The Partnership's "unit options" are issued with an exercise price no less than the market closing price of the Partnership's units on the day before the date of grant. Outstanding "unit options" vest ratably over a three-year period and have a maximum term of ten years. As of December 31, 2015, the Partnership had 506,990 fixed-price "unit options" outstanding under the 2008 Omnibus Incentive Plan.
None of these "unit options" were granted during 2015 and 2014. During 2013, 413,248 unit options were granted at a fair value of $3.47. The significant assumptions used in the Black Scholes model to determine the fair value of these "unit options" include the "unit option" exercise price equal to the grant price, the "unit options" have a maximum term of ten years, the expected volatility is 30.1%, the assumed risk-free interest rate is 1.88% and units received an annual distribution of $2.50 per unit at the time of grant. Non-cash compensation expense relating to unit options in 2015, 2014, and 2013 totaled $0.6 million, $0.9 million, and $0.9 million, respectively.
A summary of "unit option" activity in 2015 and 2014 is presented below:
2015 | 2014 | |||||||||||||
Weighted Average | Weighted Average | |||||||||||||
Unit Options | Exercise Price | Unit Options | Exercise Price | |||||||||||
Outstanding, beginning of year | 622,316 | $ | 34.03 | 684,822 | $ | 33.97 | ||||||||
Exercised | (109,575 | ) | 31.79 | (49,656 | ) | 32.93 | ||||||||
Forfeited | (5,751 | ) | 35.58 | (12,850 | ) | 34.96 | ||||||||
Outstanding, end of year | 506,990 | $ | 34.50 | 622,316 | $ | 34.03 | ||||||||
Options exercisable, end of year | 478,688 | $ | 34.36 | 476,043 | $ | 33.45 | ||||||||
Cash received from "unit option" exercises totaled approximately $0 in 2015, $0 in 2014 and $52,000 in 2013.
The following table summarizes information about vested "unit options" outstanding at December 31, 2015:
Vested Options Outstanding | ||||||||||||||||||
Type | Range of Exercise Prices | Unit Options | Weighted Average Remaining Contractual Life | Weighted Average Exercise Price | ||||||||||||||
Outstanding at year-end | $ | 29.53 | — | $ | 36.95 | 478,688 | 6.8 years | $ | 34.36 | |||||||||
Aggregate intrinsic value ($'s in thousands) | $ | 10,284 | ||||||||||||||||
A summary of the status of the Partnership's nonvested "unit options" at December 31, 2015 is presented below:
Unit Options | Weighted Average Exercise Price | ||||||
Nonvested, beginning of year | 146,273 | $ | 35.92 | ||||
Vested | (112,220 | ) | 35.67 | ||||
Forfeited | (5,751 | ) | $ | 35.58 | |||
Nonvested, end of year | 28,302 | $ | 36.95 | ||||
The total intrinsic value of "unit options" exercised during the years ended December 31, 2015, 2014 and 2013 were $3.0 million, $1.0 million, and $0.2 million, respectively.
The Partnership had 28,302 unvested "unit options" at December 31, 2015. In addition, the Partnership had $0.1 million of unamortized compensation expense related to unvested "unit options" which is expected to be amortized over a weighted average period of 0.3 years.
The Partnership has a policy of issuing limited partnership units from treasury to satisfy "unit option" exercises and expects its treasury unit balance to be sufficient for 2016, based on estimates of "unit option" exercises for that period.
40
(8) Retirement Plans:
The Partnership has trusteed, noncontributory retirement plans for the majority of its full-time employees. Contributions are discretionary and amounts accrued were approximately $4.3 million in 2015, $4.3 million in 2014 and $4.4 million in 2013. Additionally, the Partnership has a trusteed, contributory retirement plan for the majority of its full-time employees. This plan permits employees to contribute specified percentages of their salary, matched up to a limit by the Partnership. Matching contributions, net of forfeitures, approximated $2.3 million in 2015, $2.1 million in 2014 and $1.9 million in 2013.
In addition, 228 employees are covered by union-sponsored, multi-employer pension plans for which approximately $1.5 million, $1.5 million and $1.3 million were contributed for the years ended December 31, 2015, 2014, and 2013, respectively. The Partnership has no plans to withdraw from any of the multi-employer plans. The Partnership believes that the liability resulting from any such withdrawal, as defined by the Multi-employer Pension Plan Amendments Act of 1980, would not be material.
(9) Income and Partnership Taxes:
Federal and state tax legislation in 1997 provided a permanent income tax exemption to existing publicly traded partnerships (PTP), such as Cedar Fair, L.P., with a PTP tax levied on partnership gross income (net revenues less cost of food, merchandise and games) beginning in 1998. In addition, income taxes are recognized for the amount of taxes payable by the Partnership's corporate subsidiaries for the current year and for the impact of deferred tax assets and liabilities, which represent future tax consequences of events that have been recognized differently in the financial statements than for tax purposes. As such, the Partnership's "Provision for taxes" includes amounts for both the PTP tax and for income taxes on the Partnership's corporate subsidiaries.
The Partnership's 2015 tax provision totals $22.2 million, which consists of an $11.7 million provision for the PTP tax and a $10.5 million provision for income taxes. This compares to the Partnership's 2014 tax provision of $9.9 million, which consisted of a $9.6 million provision for the PTP tax and a $0.3 million provision for income taxes, and the 2013 tax provision of $20.2 million, which consisted of a $9.6 million provision for the PTP tax and a $10.6 million provision for income taxes. The calculation of the provision for taxes involves significant estimates and assumptions and actual results could differ from those estimates.
Significant components of income (loss) before taxes are as follows:
($'s in thousands) | 2015 | 2014 | 2013 | |||||||||
Domestic | $ | 209,268 | $ | 186,389 | $ | 159,256 | ||||||
Foreign | (74,854 | ) | (72,289 | ) | (30,809 | ) | ||||||
$ | 134,414 | $ | 114,100 | $ | 128,447 | |||||||
The provision (benefit) for income taxes is comprised of the following:
($'s in thousands) | 2015 | 2014 | 2013 | |||||||||
Income taxes: | ||||||||||||
Current federal | $ | 22,232 | $ | 4,513 | $ | 5,398 | ||||||
Current state and local | 3,767 | 1,413 | 1,436 | |||||||||
Current foreign | 530 | (2,692 | ) | 412 | ||||||||
Total current | 26,529 | 3,234 | 7,246 | |||||||||
Deferred federal, state and local | 4,842 | 9,239 | 9,989 | |||||||||
Deferred foreign | (20,898 | ) | (12,200 | ) | (6,641 | ) | ||||||
Total deferred | (16,056 | ) | (2,961 | ) | 3,348 | |||||||
$ | 10,473 | $ | 273 | $ | 10,594 | |||||||
The provision (benefit) for income taxes for the Partnership's corporate subsidiaries differs from the amount computed by applying the U.S. federal statutory income tax rate of 35% to the Partnership's income (loss) before taxes.
41
The sources and tax effects of the differences are as follows:
($'s in thousands) | 2015 | 2014 | 2013 | |||||||||
Income tax provision based on the U.S. federal statutory tax rate | $ | 47,045 | $ | 39,935 | $ | 44,956 | ||||||
Partnership income not includible in corporate income | (39,279 | ) | (39,922 | ) | (31,574 | ) | ||||||
State and local taxes, net of federal income tax benefit | 3,504 | 1,786 | 2,459 | |||||||||
Valuation allowance | — | (1,112 | ) | (4,460 | ) | |||||||
Tax credits | (1,253 | ) | (997 | ) | (1,303 | ) | ||||||
Nondeductible expenses and other | 456 | 583 | 516 | |||||||||
$ | 10,473 | $ | 273 | $ | 10,594 | |||||||
Deferred income taxes reflect the net tax effects of temporary differences between the carrying amounts of assets and liabilities for financial reporting purposes and the amounts used for income tax purposes.
Significant components of deferred tax assets and liabilities as of December 31, 2015 and 2014 are as follows:
($'s in thousands) | 2015 | 2014 | ||||||
Deferred tax assets: | ||||||||
Options and deferred compensation | $ | 13,957 | $ | 12,476 | ||||
Accrued expenses | 6,775 | 7,380 | ||||||
Foreign tax credits | 7,603 | 16,844 | ||||||
Tax attribute carryforwards | 3,767 | 7,906 | ||||||
Derivatives | 3,619 | 3,044 | ||||||
Foreign currency | 19,182 | 2,645 | ||||||
Deferred revenue | 4,648 | 4,841 | ||||||
Other | — | 483 | ||||||
Deferred tax assets | 59,551 | 55,619 | ||||||
Valuation allowance | (5,680 | ) | (5,680 | ) | ||||
Net deferred tax assets | 53,871 | 49,939 | ||||||
Deferred tax liabilities: | ||||||||
Property | (171,316 | ) | (182,434 | ) | ||||
Intangibles | (12,318 | ) | (10,753 | ) | ||||
Deferred tax liabilities | (183,634 | ) | (193,187 | ) | ||||
Net deferred tax liability | $ | (129,763 | ) | $ | (143,248 | ) | ||
The Partnership records a valuation allowance if, based on the weight of available evidence, it is more likely than not that some portion, or all, of a deferred tax asset will not be realized. Through December 31, 2014, the Partnership had recorded an $5.7 million valuation allowance related to a $16.8 million deferred tax asset for foreign tax credit carryforwards. The need for this allowance was based on several factors including the ten-year carryforward period allowed for excess foreign tax credits, experience to date of foreign tax credit limitations, and management's long term estimates of domestic and foreign source income.
During 2015, the Partnership did not adjust the valuation allowance. The valuation allowance was reduced by $1.1 million and $4.5 million for the years ended December 31, 2014 and 2013, respectively. Further, the Partnership believes based on its update of long term estimates of domestic and foreign source income that no additional adjustments to the valuation allowance are warranted. As of December 31, 2015, the Partnership had a $7.6 million deferred tax asset for foreign tax credit carryforwards and a related $5.7 million valuation allowance.
Additionally, as of December 31, 2015, the Partnership had $3.8 million of tax attribute carryforwards consisting of alternative minimum tax credits ($1.2 million) and the tax effect of state net operating loss carryforwards ($2.6 million). Alternative minimum tax credits do not expire. Unused state net operating loss carryforwards will expire from 2018 to 2028. The Partnership expects to fully realize these tax attribute carryforwards. As such, no valuation allowance has been recorded relating to these tax attribute carryforwards.
42
The net current and non-current components of deferred taxes recognized as of December 31, 2015 and 2014 in the consolidated balance sheets are as follows:
($'s in thousands) | 2015 | 2014 | ||||||
Net current deferred tax asset | $ | 12,188 | $ | 9,265 | ||||
Net non-current deferred tax liability | (141,951 | ) | (152,513 | ) | ||||
Net deferred tax liability | $ | (129,763 | ) | $ | (143,248 | ) | ||
The Partnership has recorded a deferred tax liability of $12.7 million and $4.3 million as of December 31, 2015 and 2014, respectively, to account for the tax effect of derivatives and foreign currency translation adjustments included in Other Comprehensive Income.
The Partnership has unrecognized income tax benefits as of December 31, 2015. The following is a reconciliation of beginning and ending unrecognized tax benefits:
($'s in thousands) | ||||
Balance at December 31, 2013 | $ | 1,100 | ||
Increase from 2014 tax positions | — | |||
Increase from 2013 tax positions | 100 | |||
Decrease from settlements with taxing authority | — | |||
Decrease from expiration of statute of limitations | — | |||
Balance at December 31, 2014 | 1,200 | |||
Increase from 2015 tax positions | — | |||
Increase from 2014 tax positions | 200 | |||
Decrease from settlements with taxing authority | — | |||
Decrease from expiration of statute of limitations | (300 | ) | ||
Balance at December 31, 2015 | $ | 1,100 | ||
At December 31, 2015 a total of $1.1 million of unrecognized tax benefits was recorded for state and local income tax positions. There were $1.2 million of unrecognized tax positions during 2014 and $1.1 million unrecognized tax positions during 2013. If recognized, the tax benefits would decrease the Partnership taxes by $1.1 million.
The Partnership recognizes accrued interest and penalties related to unrecognized tax benefits as income tax expense. Related to the unrecognized tax benefits noted, the Partnership accrued interest of $0.4 million and penalties of $0.2 million during 2015. The Partnership does not anticipate a significant change to the amount of unrecognized tax benefits over the next 12 months.
The Partnership and its corporate subsidiaries are subject to taxation in the U.S., Canada and various state and local jurisdictions. The tax returns of the Partnership are subject to examination by state and federal tax authorities. With few exceptions, the Partnership and its corporate subsidiaries are no longer subject to examination by the major taxing authorities for tax years before 2011.
43
(10) Operating Lease Commitments and Contingencies:
Operating Lease Commitments
The Partnership has commitments under various operating leases at its parks. Minimum lease payments under non-cancelable operating leases as of December 31, 2015 are as follows ($'s in thousands):
2016 | $ | 9,207 | |
2017 | 8,675 | ||
2018 | 7,555 | ||
2019 | 6,568 | ||
2020 | 5,793 | ||
Thereafter | 101,961 | ||
$ | 139,759 | ||
The amount due after 2020 includes the land lease at California's Great America which is renewable in 2039. Lease expense, which includes short-term rentals for equipment and machinery, for 2015, 2014 and 2013 totaled $14.5 million, $12.7 million and $12.7 million, respectively.
Contingencies
The Partnership is also a party to a number of lawsuits arising in the normal course of business. In the opinion of management, none of these matters are expected to have a material effect in the aggregate on the Partnership's financial statements.
(11) Fair Value Measurements:
The FASB's ASC 820 "Fair Value Measurement" emphasizes that fair value is a market-based measurement that should be determined based on assumptions (inputs) that market participants would use in pricing an asset or liability. Inputs may be observable or unobservable, and valuation techniques used to measure fair value should maximize the use of relevant observable inputs and minimize the use of unobservable inputs. Accordingly, the FASB’s ASC 820 establishes a hierarchal disclosure framework that ranks the quality and reliability of information used to determine fair values. The hierarchy is associated with the level of pricing observability utilized in measuring fair value and defines three levels of inputs to the fair value measurement process—quoted prices are the most reliable valuation inputs, whereas model values that include inputs based on unobservable data are the least reliable. Each fair value measurement must be assigned to a level corresponding to the lowest level input that is significant to the fair value measurement in its entirety.
The three broad levels of inputs defined by the fair value hierarchy are as follows:
• | Level 1 – inputs to the valuation methodology are quoted prices (unadjusted) for identical assets or liabilities in active markets. |
• | Level 2 – inputs to the valuation methodology include quoted prices for similar assets and liabilities in active markets, and inputs that are observable for the asset or liability, either directly or indirectly, for substantially the full term of the financial instrument. |
• | Level 3 – inputs to the valuation methodology are unobservable and significant to the fair value measurement. |
The table below presents the balances of assets and liabilities measured at fair value as of December 31, 2015 and December 31, 2014 on a recurring basis as well as the fair values of other financial instruments:
(In thousands) | Fair Value | December 31, 2015 | December 31, 2014 | ||||||||||||||
Balance Sheet Location | Hierarchy Level | Carrying Value | Fair Value | Carrying Value | Fair Value | ||||||||||||
Financial assets (liabilities) measured on a recurring basis: | |||||||||||||||||
Interest rate swap agreements not designated as cash flow hedges | Current derivative liability | Level 2 | $ | — | $ | — | $ | (11,791 | ) | $ | (11,791 | ) | |||||
Interest rate swap agreements designated as cash flow hedges | Derivative Liability | Level 2 | (22,918 | ) | (22,918 | ) | (14,649 | ) | (14,649 | ) | |||||||
Other financial assets (liabilities): | — | — | — | — | |||||||||||||
Term debt | Long-Term Debt | Level 2 | (606,375 | ) | (604,859 | ) | (608,850 | ) | (605,806 | ) | |||||||
March 2013 notes | Long-Term Debt | Level 1 | (500,000 | ) | (507,500 | ) | (500,000 | ) | (501,250 | ) | |||||||
June 2014 notes | Long-Term Debt | (1) | (450,000 | ) | (453,375 | ) | (450,000 | ) | (451,125 | ) | |||||||
(1) | The June 2014 notes were based on Level 1 inputs as of December 31, 2015 and Level 2 inputs as of December 31, 2014. |
44
Fair values of the interest rate swap agreements are determined using significant inputs, including the LIBOR forward curves, which are considered Level 2 observable market inputs. In addition, the Partnership considered the effect of its credit and non-performance risk on the fair values provided, and recognized an adjustment decreasing the net derivative liability by approximately $0.6 million as of December 31, 2015 and $0.8 million as of December 31, 2014.
At the end of the fourth quarter of 2015, the Partnership concluded based on guest usage and updated capital planning for the coming years, that a certain long-lived asset at Cedar Point would be taken out of service. After performing a review of this asset, the Partnership determined that the asset was impaired. Based on Level 3 unobservable valuation assumptions and other market inputs, the asset was marked to a fair value of $0, resulting in an impairment charge of $8.6 million for this asset during the quarter. This amount was recorded in "Loss on impairment / retirement of fixed assets, net" on the consolidated statement of operations and comprehensive income.
At the end of the fourth quarter of 2014, the Partnership concluded based on 2014 operating results and updated forecasts for the coming years, that a review of the carrying value of operating long-lived assets at Wildwater Kingdom was warranted. After performing its review, the Partnership determined that the park's fixed assets were impaired. Based on Level 3 unobservable valuation assumptions and other market inputs, the assets were marked to a fair value of $17.1 million, resulting in an impairment charge of $2.4 million for operating assets during the quarter. This amount was recorded in "Loss on impairment / retirement of fixed assets, net" on the consolidated statement of operations and comprehensive income.
The carrying value of cash and cash equivalents, revolver, accounts receivable, current portion of term debt, accounts payable, and accrued liabilities approximates fair value because of the short maturity of these instruments. A relief-from-royalty model is used to determine whether the fair value of trade-names exceeds their carrying amount. The fair value of the trade-names is determined as the present value of fees avoided by owning the respective trade-name.
45
(12) Changes in Accumulated Other Comprehensive Income ("AOCI"):
The following tables reflect the changes in AOCI related to limited partners' equity for the twelve-month period ended December 31, 2015:
Changes in Accumulated Other Comprehensive Income by Component (1) | |||||||||||||
($'s in thousands) | |||||||||||||
Unrealized income | Foreign currency | ||||||||||||
on cash flow hedges | translation adjustment | Total | |||||||||||
Balance at December 31, 2014 | $ | (16,566 | ) | $ | 5,936 | $ | (10,630 | ) | |||||
Other comprehensive income (loss) before reclassifications, net of tax $1,258 and $(9,050) | (7,008 | ) | 16,655 | 9,647 | |||||||||
Amounts reclassified from accumulated other comprehensive income, net of tax ($633) (2) | 4,274 | — | 4,274 | ||||||||||
Net current-period other comprehensive income (loss) | (2,734 | ) | 16,655 | 13,921 | |||||||||
December 31, 2015 | $ | (19,300 | ) | $ | 22,591 | $ | 3,291 | ||||||
(1) All amounts are net of tax. Amounts in parentheses indicate debits.
(2) See Reclassifications Out of Accumulated Other Comprehensive Income table below for reclassification details.
Changes in Accumulated Other Comprehensive Income by Component (1) | ||||||||||
($'s in thousands) | ||||||||||
Unrealized income | Foreign currency | |||||||||
on cash flow hedges | translation adjustment | Total | ||||||||
Balance at December 31, 2013 | (15,013 | ) | 5 | (15,008 | ) | |||||
Other comprehensive income (loss) before reclassifications, net of tax $1,630 and $(3,410) | (9,105 | ) | 5,931 | (3,174 | ) | |||||
Amounts reclassified from accumulated other comprehensive income, net of tax ($1,341) (2) | 7,552 | — | 7,552 | |||||||
Net current-period other comprehensive income (loss) | (1,553 | ) | 5,931 | 4,378 | ||||||
December 31, 2014 | (16,566 | ) | 5,936 | (10,630 | ) | |||||
(1) All amounts are net of tax. Amounts in parentheses indicate debits.
(2) See Reclassifications Out of Accumulated Other Comprehensive Income table below for reclassification details.
Reclassifications Out of Accumulated Other Comprehensive Income (1) | ||||||||||||
($' in thousands) | ||||||||||||
Details about Accumulated Other Comprehensive Income Components | Amount Reclassified from Accumulated Other Comprehensive Income | Amount Reclassified from Accumulated Other Comprehensive Income | Affected Line Item in the Statement Where Net Income is Presented | |||||||||
Gains and losses on cash flow hedges | 12 Months ended 12/31/15 | 12 Months ended 12/31/14 | ||||||||||
Interest rate swaps | $ | 4,907 | $ | 8,893 | Net effect of swaps | |||||||
$ | 4,907 | $ | 8,893 | Total before tax | ||||||||
(633 | ) | (1,341 | ) | Provision (benefit) for taxes | ||||||||
$ | 4,274 | $ | 7,552 | Net of tax | ||||||||
(1) Amounts in parentheses indicate gains.
46
(13) Consolidating Financial Information of Guarantors and Issuers:
Cedar Fair, L.P., Canada's Wonderland Company ("Cedar Canada"), and Magnum Management Corporation ("Magnum") are the co-issuers of the Partnership's 5.375% and 5.25% notes (see Note 5). The notes have been fully and unconditionally guaranteed, on a joint and several basis, by each 100% owned subsidiary of Cedar Fair (other than Cedar Canada and Magnum) that guarantees the Partnership's senior secured credit facilities. There are no non-guarantor subsidiaries.
The following consolidating schedules present condensed financial information for Cedar Fair, L.P., Cedar Canada, and Magnum, the co-issuers, and each 100% owned subsidiary of Cedar Fair (other than Cedar Canada and Magnum), the guarantors (on a combined basis), as of December 31, 2015 and December 31, 2014 and for the years ended December 31, 2015, December 31, 2014, and December 31, 2013. In lieu of providing separate audited financial statements for the guarantor subsidiaries, the accompanying condensed consolidating financial statements have been included.
47
CEDAR FAIR, L.P.
CONDENSED CONSOLIDATING BALANCE SHEET
DECEMBER 31, 2015
(In thousands)
Cedar Fair L.P. (Parent) | Co-Issuer Subsidiary (Magnum) | Co-Issuer Subsidiary (Cedar Canada) | Guarantor Subsidiaries | Eliminations | Total | |||||||||||||||||||
ASSETS | ||||||||||||||||||||||||
Current Assets: | ||||||||||||||||||||||||
Cash and cash equivalents | $ | 77,007 | $ | — | $ | 39,106 | $ | 3,444 | $ | — | $ | 119,557 | ||||||||||||
Receivables | — | 1,292 | 27,788 | 547,361 | (546,947 | ) | 29,494 | |||||||||||||||||
Inventories | — | 121 | 1,222 | 23,686 | — | 25,029 | ||||||||||||||||||
Current deferred tax asset | — | 7,953 | 643 | 3,592 | — | 12,188 | ||||||||||||||||||
Other current assets | 188 | 1,261 | 1,332 | 8,781 | (1,616 | ) | 9,946 | |||||||||||||||||
77,195 | 10,627 | 70,091 | 586,864 | (548,563 | ) | 196,214 | ||||||||||||||||||
Property and Equipment, net | — | 5,593 | 176,390 | 1,332,895 | — | 1,514,878 | ||||||||||||||||||
Investment in Park | 724,592 | 911,912 | 179,530 | 27,864 | (1,843,898 | ) | — | |||||||||||||||||
Goodwill | 674 | — | 90,531 | 119,606 | — | 210,811 | ||||||||||||||||||
Other Intangibles, net | — | — | 12,832 | 23,063 | — | 35,895 | ||||||||||||||||||
Deferred Tax Asset | — | 6,127 | — | — | (6,127 | ) | — | |||||||||||||||||
Other Assets | 4,590 | 19,619 | 6,214 | 6,686 | — | 37,109 | ||||||||||||||||||
$ | 807,051 | $ | 953,878 | $ | 535,588 | $ | 2,096,978 | $ | (2,398,588 | ) | $ | 1,994,907 | ||||||||||||
LIABILITIES AND PARTNERS’ EQUITY | ||||||||||||||||||||||||
Current Liabilities: | ||||||||||||||||||||||||
Current maturities of long-term debt | $ | — | $ | 1,008 | $ | 57 | $ | 1,410 | $ | — | $ | 2,475 | ||||||||||||
Accounts payable | 434,726 | 115,135 | 810 | 13,398 | (546,947 | ) | 17,122 | |||||||||||||||||
Deferred revenue | — | 85 | 4,397 | 65,032 | — | 69,514 | ||||||||||||||||||
Accrued interest | 4,602 | 3,221 | 2,056 | 31 | — | 9,910 | ||||||||||||||||||
Accrued taxes | 1,066 | — | — | 42,487 | (1,616 | ) | 41,937 | |||||||||||||||||
Accrued salaries, wages and benefits | — | 22,166 | 1,026 | 3,724 | — | 26,916 | ||||||||||||||||||
Self-insurance reserves | — | 7,437 | 1,400 | 15,159 | 23,996 | |||||||||||||||||||
Other accrued liabilities | 1,355 | 1,531 | 167 | 3,748 | — | 6,801 | ||||||||||||||||||
441,749 | 150,583 | 9,913 | 144,989 | (548,563 | ) | 198,671 | ||||||||||||||||||
Deferred Tax Liability | — | — | 22,622 | 125,456 | (6,127 | ) | 141,951 | |||||||||||||||||
Derivative Liability | 13,396 | 9,522 | — | — | — | 22,918 | ||||||||||||||||||
Other Liabilities | — | 6,705 | — | 11,278 | — | 17,983 | ||||||||||||||||||
Long-Term Debt: | ||||||||||||||||||||||||
Term debt | — | 246,882 | 13,934 | 345,559 | — | 606,375 | ||||||||||||||||||
Notes | 294,897 | 205,103 | 450,000 | — | — | 950,000 | ||||||||||||||||||
294,897 | 451,985 | 463,934 | 345,559 | — | 1,556,375 | |||||||||||||||||||
Equity | 57,009 | 335,083 | 39,119 | 1,469,696 | (1,843,898 | ) | 57,009 | |||||||||||||||||
$ | 807,051 | $ | 953,878 | $ | 535,588 | $ | 2,096,978 | $ | (2,398,588 | ) | $ | 1,994,907 | ||||||||||||
48
CEDAR FAIR, L.P.
CONDENSED CONSOLIDATING BALANCE SHEET
DECEMBER 31, 2014
(In thousands)
Cedar Fair L.P. (Parent) | Co-Issuer Subsidiary (Magnum) | Co-Issuer Subsidiary (Cedar Canada) | Guarantor Subsidiaries | Eliminations | Total | |||||||||||||||||||
ASSETS | ||||||||||||||||||||||||
Current Assets: | ||||||||||||||||||||||||
Cash and cash equivalents | $ | 80,000 | $ | 382 | $ | 45,519 | $ | 5,939 | $ | — | $ | 131,840 | ||||||||||||
Receivables | 8 | 143,931 | 85,838 | 634,112 | (836,494 | ) | 27,395 | |||||||||||||||||
Inventories | — | 2,074 | 1,594 | 22,215 | — | 25,883 | ||||||||||||||||||
Current deferred tax asset | — | 4,547 | 674 | 4,044 | — | 9,265 | ||||||||||||||||||
Other current assets | 680 | 2,079 | 23,818 | 5,905 | (23,148 | ) | 9,334 | |||||||||||||||||
80,688 | 153,013 | 157,443 | 672,215 | (859,642 | ) | 203,717 | ||||||||||||||||||
Property and Equipment, net | 470,851 | 5,630 | 218,260 | 831,810 | — | 1,526,551 | ||||||||||||||||||
Investment in Park | 544,340 | 812,549 | 163,904 | 43,659 | (1,564,452 | ) | — | |||||||||||||||||
Goodwill | 9,061 | — | 108,012 | 111,218 | — | 228,291 | ||||||||||||||||||
Other Intangibles, net | — | — | 15,312 | 22,879 | — | 38,191 | ||||||||||||||||||
Deferred Tax Asset | — | 24,827 | — | — | (24,827 | ) | — | |||||||||||||||||
Other Assets | 10,615 | 20,874 | 8,034 | 2,046 | — | 41,569 | ||||||||||||||||||
$ | 1,115,555 | $ | 1,016,893 | $ | 670,965 | $ | 1,683,827 | $ | (2,448,921 | ) | $ | 2,038,319 | ||||||||||||
LIABILITIES AND PARTNERS’ EQUITY | ||||||||||||||||||||||||
Current Liabilities: | ||||||||||||||||||||||||
Accounts payable | $ | 352,518 | $ | 203,895 | $ | 32,691 | $ | 271,323 | $ | (836,494 | ) | $ | 23,933 | |||||||||||
Deferred revenue | — | 60 | 4,592 | 56,509 | — | 61,161 | ||||||||||||||||||
Accrued interest | 4,637 | 3,223 | 2,056 | — | — | 9,916 | ||||||||||||||||||
Accrued taxes | 4,309 | — | — | 40,639 | (23,148 | ) | 21,800 | |||||||||||||||||
Accrued salaries, wages and benefits | — | 25,851 | 1,103 | 7,148 | — | 34,102 | ||||||||||||||||||
Self-insurance reserves | — | 5,386 | 1,565 | 16,426 | — | 23,377 | ||||||||||||||||||
Current derivative liability | 7,062 | 4,729 | — | — | — | 11,791 | ||||||||||||||||||
Other accrued liabilities | 508 | 8,134 | 122 | 3,375 | — | 12,139 | ||||||||||||||||||
369,034 | 251,278 | 42,129 | 395,420 | (859,642 | ) | 198,219 | ||||||||||||||||||
Deferred Tax Liability | — | — | 49,695 | 127,645 | (24,827 | ) | 152,513 | |||||||||||||||||
Derivative Liability | 8,438 | 6,211 | — | — | — | 14,649 | ||||||||||||||||||
Other Liabilities | — | 6,105 | — | 11,766 | — | 17,871 | ||||||||||||||||||
Long-Term Debt: | ||||||||||||||||||||||||
Term debt | 346,969 | 247,890 | 13,991 | — | — | 608,850 | ||||||||||||||||||
Notes | 294,897 | 205,103 | 450,000 | — | — | 950,000 | ||||||||||||||||||
641,866 | 452,993 | 463,991 | — | — | 1,558,850 | |||||||||||||||||||
Equity | 96,217 | 300,306 | 115,150 | 1,148,996 | (1,564,452 | ) | 96,217 | |||||||||||||||||
$ | 1,115,555 | $ | 1,016,893 | $ | 670,965 | $ | 1,683,827 | $ | (2,448,921 | ) | $ | 2,038,319 | ||||||||||||
49
CEDAR FAIR, L.P.
CONDENSED CONSOLIDATING STATEMENT OF OPERATIONS AND COMPREHENSIVE INCOME
For the Year Ended December 31, 2015
(In thousands)
Cedar Fair L.P. (Parent) | Co-Issuer Subsidiary (Magnum) | Co-Issuer Subsidiary (Cedar Canada) | Guarantor Subsidiaries | Eliminations | Total | |||||||||||||||||||
Net revenues | $ | 145,571 | $ | 240,817 | $ | 112,217 | $ | 1,118,384 | $ | (381,211 | ) | $ | 1,235,778 | |||||||||||
Costs and expenses: | ||||||||||||||||||||||||
Cost of food, merchandise and games revenues | — | 372 | 8,878 | 95,577 | — | 104,827 | ||||||||||||||||||
Operating expenses | 1,063 | 179,139 | 42,814 | 675,821 | (381,211 | ) | 517,626 | |||||||||||||||||
Selling, general and administrative | 3,081 | 55,551 | 10,358 | 102,500 | — | 171,490 | ||||||||||||||||||
Depreciation and amortization | — | 37 | 14,326 | 111,268 | — | 125,631 | ||||||||||||||||||
Loss on impairment / retirement of fixed assets, net | — | — | 417 | 20,456 | — | 20,873 | ||||||||||||||||||
4,144 | 235,099 | 76,793 | 1,005,622 | (381,211 | ) | 940,447 | ||||||||||||||||||
Operating income | 141,427 | 5,718 | 35,424 | 112,762 | — | 295,331 | ||||||||||||||||||
Interest expense, net | 34,204 | 28,210 | 25,381 | (1,010 | ) | 86,785 | ||||||||||||||||||
Net effect of swaps | (3,820 | ) | (3,064 | ) | — | — | (6,884 | ) | ||||||||||||||||
Unrealized / realized foreign currency loss | — | — | 81,016 | — | 81,016 | |||||||||||||||||||
Other (income) expense | 750 | (18,649 | ) | 3,883 | 14,016 | — | ||||||||||||||||||
(Income) loss from investment in affiliates | (13,523 | ) | (15,141 | ) | (20,100 | ) | 27,480 | 21,284 | — | |||||||||||||||
Income (loss) before taxes | 123,816 | 14,362 | (54,756 | ) | 72,276 | (21,284 | ) | 134,414 | ||||||||||||||||
Provision (benefit) for taxes | 11,594 | 840 | (27,274 | ) | 37,032 | — | 22,192 | |||||||||||||||||
Net income (loss) | $ | 112,222 | $ | 13,522 | $ | (27,482 | ) | $ | 35,244 | $ | (21,284 | ) | $ | 112,222 | ||||||||||
Other comprehensive income (loss), (net of tax): | ||||||||||||||||||||||||
Cumulative foreign currency translation adjustment | 16,655 | — | 16,655 | — | (16,655 | ) | 16,655 | |||||||||||||||||
Unrealized loss on cash flow hedging derivatives | (2,734 | ) | (1,021 | ) | — | — | 1,021 | (2,734 | ) | |||||||||||||||
Other comprehensive income (loss), (net of tax) | 13,921 | (1,021 | ) | 16,655 | — | (15,634 | ) | 13,921 | ||||||||||||||||
Total comprehensive income (loss) | $ | 126,143 | $ | 12,501 | $ | (10,827 | ) | $ | 35,244 | $ | (36,918 | ) | $ | 126,143 | ||||||||||
50
CEDAR FAIR, L.P.
CONDENSED CONSOLIDATING STATEMENT OF OPERATIONS AND COMPREHENSIVE INCOME
For the Year Ended December 31, 2014
(In thousands)
Cedar Fair L.P. (Parent) | Co-Issuer Subsidiary (Magnum) | Co-Issuer Subsidiary (Cedar Canada) | Guarantor Subsidiaries | Eliminations | Total | |||||||||||||||||||
Net revenues | $ | 159,454 | $ | 295,252 | $ | 121,249 | $ | 1,034,056 | $ | (450,406 | ) | $ | 1,159,605 | |||||||||||
Costs and expenses: | ||||||||||||||||||||||||
Cost of food, merchandise and games revenues | — | 273 | 8,985 | 85,950 | — | 95,208 | ||||||||||||||||||
Operating expenses | 5,371 | 195,899 | 47,013 | 698,202 | (450,406 | ) | 496,079 | |||||||||||||||||
Selling, general and administrative | 5,791 | 102,021 | 11,318 | 37,734 | — | 156,864 | ||||||||||||||||||
Depreciation and amortization | 38,341 | 294 | 16,910 | 68,741 | — | 124,286 | ||||||||||||||||||
Loss on impairment / retirement of fixed assets, net | 2,621 | 2,463 | 2,445 | 2,228 | — | 9,757 | ||||||||||||||||||
Gain on sale of other assets | — | — | — | (921 | ) | — | (921 | ) | ||||||||||||||||
52,124 | 300,950 | 86,671 | 891,934 | (450,406 | ) | 881,273 | ||||||||||||||||||
Operating income (loss) | 107,330 | (5,698 | ) | 34,578 | 142,122 | — | 278,332 | |||||||||||||||||
Interest expense, net | 42,440 | 28,718 | 34,249 | (9,247 | ) | — | 96,160 | |||||||||||||||||
Net effect of swaps | (1,595 | ) | (467 | ) | — | — | — | (2,062 | ) | |||||||||||||||
Loss on early debt extinguishment | — | — | 29,261 | — | — | 29,261 | ||||||||||||||||||
Unrealized / realized foreign currency loss | — | — | 40,873 | — | — | 40,873 | ||||||||||||||||||
Other (income) expense | 750 | (12,920 | ) | 2,482 | 9,688 | — | — | |||||||||||||||||
(Income) loss from investment in affiliates | (48,622 | ) | (12,899 | ) | (21,236 | ) | 25,658 | 57,099 | — | |||||||||||||||
Income (loss) before taxes | 114,357 | (8,130 | ) | (51,051 | ) | 116,023 | (57,099 | ) | 114,100 | |||||||||||||||
Provision (benefit) for taxes | 10,142 | (8,473 | ) | (25,396 | ) | 33,612 | — | 9,885 | ||||||||||||||||
Net income (loss) | $ | 104,215 | $ | 343 | $ | (25,655 | ) | $ | 82,411 | $ | (57,099 | ) | $ | 104,215 | ||||||||||
Other comprehensive income (loss), (net of tax): | ||||||||||||||||||||||||
Cumulative foreign currency translation adjustment | 5,931 | — | 5,931 | — | (5,931 | ) | 5,931 | |||||||||||||||||
Unrealized loss on cash flow hedging derivatives | (1,553 | ) | (66 | ) | — | — | 66 | (1,553 | ) | |||||||||||||||
Other comprehensive income (loss), (net of tax) | 4,378 | (66 | ) | 5,931 | — | (5,865 | ) | 4,378 | ||||||||||||||||
Total comprehensive income (loss) | $ | 108,593 | $ | 277 | $ | (19,724 | ) | $ | 82,411 | $ | (62,964 | ) | $ | 108,593 | ||||||||||
51
CEDAR FAIR, L.P.
CONDENSED CONSOLIDATING STATEMENT OF OPERATIONS AND COMPREHENSIVE INCOME
For the Year Ended December 31, 2013
(In thousands)
Cedar Fair L.P. (Parent) | Co-Issuer Subsidiary (Magnum) | Co-Issuer Subsidiary (Cedar Canada) | Guarantor Subsidiaries | Eliminations | Total | |||||||||||||||||||
Net revenues | $ | 152,469 | $ | 296,077 | $ | 127,692 | $ | 1,006,469 | $ | (448,135 | ) | $ | 1,134,572 | |||||||||||
Costs and expenses: | ||||||||||||||||||||||||
Cost of food, merchandise and games revenues | — | — | 9,322 | 82,450 | — | 91,772 | ||||||||||||||||||
Operating expenses | 6,003 | 183,604 | 47,770 | 683,102 | (448,135 | ) | 472,344 | |||||||||||||||||
Selling, general and administrative | 5,717 | 100,825 | 10,984 | 34,886 | — | 152,412 | ||||||||||||||||||
Depreciation and amortization | 36,807 | 37 | 17,333 | 68,310 | — | 122,487 | ||||||||||||||||||
Loss on impairment / retirement of fixed assets, net | 424 | — | 479 | 1,636 | — | 2,539 | ||||||||||||||||||
Gain on sale of other assets | — | — | — | (8,743 | ) | — | (8,743 | ) | ||||||||||||||||
48,951 | 284,466 | 85,888 | 861,641 | (448,135 | ) | 832,811 | ||||||||||||||||||
Operating income | 103,518 | 11,611 | 41,804 | 144,828 | — | 301,761 | ||||||||||||||||||
Interest expense, net | 42,630 | 28,875 | 39,376 | (7,964 | ) | — | 102,917 | |||||||||||||||||
Net effect of swaps | 4,190 | 2,693 | — | — | — | 6,883 | ||||||||||||||||||
Loss on early debt extinguishment | 21,175 | 12,781 | 617 | — | — | 34,573 | ||||||||||||||||||
Unrealized / realized foreign currency loss | — | — | 28,941 | — | — | 28,941 | ||||||||||||||||||
Other (income) expense | 750 | (11,257 | ) | 3,679 | 6,828 | — | — | |||||||||||||||||
(Income) loss from investment in affiliates | (83,557 | ) | (37,520 | ) | (17,438 | ) | 2,477 | 136,038 | — | |||||||||||||||
Income (loss) before taxes | 118,330 | 16,039 | (13,371 | ) | 143,487 | (136,038 | ) | 128,447 | ||||||||||||||||
Provision (benefit) for taxes | 10,126 | (12,133 | ) | (10,856 | ) | 33,106 | — | 20,243 | ||||||||||||||||
Net income (loss) | $ | 108,204 | $ | 28,172 | $ | (2,515 | ) | $ | 110,381 | $ | (136,038 | ) | $ | 108,204 | ||||||||||
Other comprehensive income, (net of tax): | ||||||||||||||||||||||||
Cumulative foreign currency translation adjustment | 2,756 | — | 2,756 | — | (2,756 | ) | 2,756 | |||||||||||||||||
Unrealized income on cash flow hedging derivatives | 10,736 | 2,848 | — | — | (2,848 | ) | 10,736 | |||||||||||||||||
Other comprehensive income, (net of tax) | 13,492 | 2,848 | 2,756 | — | (5,604 | ) | 13,492 | |||||||||||||||||
Total comprehensive income | $ | 121,696 | $ | 31,020 | $ | 241 | $ | 110,381 | $ | (141,642 | ) | $ | 121,696 | |||||||||||
52
CEDAR FAIR, L.P.
CONDENSED CONSOLIDATING STATEMENT OF CASH FLOWS
For the Year Ended December 31, 2015
(In thousands)
Cedar Fair L.P. (Parent) | Co-Issuer Subsidiary (Magnum) | Co-Issuer Subsidiary (Cedar Canada) | Guarantor Subsidiaries | Eliminations | Total | |||||||||||||||||||
NET CASH FROM (FOR) OPERATING ACTIVITIES | $ | 89,637 | $ | (4,853 | ) | $ | 38,579 | $ | 221,001 | $ | (2,147 | ) | $ | 342,217 | ||||||||||
CASH FLOWS FROM (FOR) INVESTING ACTIVITIES | ||||||||||||||||||||||||
Intercompany receivables (payments) receipts | — | — | (3,252 | ) | (55,294 | ) | 58,546 | — | ||||||||||||||||
Purchase of preferred equity investment | — | (2,000 | ) | — | — | — | (2,000 | ) | ||||||||||||||||
Capital expenditures | — | — | (7,663 | ) | (168,202 | ) | — | (175,865 | ) | |||||||||||||||
Net cash for investing activities | — | (2,000 | ) | (10,915 | ) | (223,496 | ) | 58,546 | (177,865 | ) | ||||||||||||||
CASH FLOWS FROM (FOR) FINANCING ACTIVITIES | ||||||||||||||||||||||||
Intercompany payables (payments) receipts | 82,131 | 8,060 | (31,645 | ) | — | (58,546 | ) | — | ||||||||||||||||
Distributions (paid) received | (174,761 | ) | — | — | — | 2,147 | (172,614 | ) | ||||||||||||||||
Tax effect of units involved in treasury unit transactions | — | (1,589 | ) | — | — | — | (1,589 | ) | ||||||||||||||||
Net cash from (for) financing activities | (92,630 | ) | 6,471 | (31,645 | ) | — | (56,399 | ) | (174,203 | ) | ||||||||||||||
EFFECT OF EXCHANGE RATE CHANGES ON CASH AND CASH EQUIVALENTS | — | — | (2,432 | ) | — | — | (2,432 | ) | ||||||||||||||||
CASH AND CASH EQUIVALENTS | ||||||||||||||||||||||||
Net decrease for the year | (2,993 | ) | (382 | ) | (6,413 | ) | (2,495 | ) | — | (12,283 | ) | |||||||||||||
Balance, beginning of year | 80,000 | 382 | 45,519 | 5,939 | — | 131,840 | ||||||||||||||||||
Balance, end of year | $ | 77,007 | $ | — | $ | 39,106 | $ | 3,444 | $ | — | $ | 119,557 | ||||||||||||
53
CEDAR FAIR, L.P.
CONDENSED CONSOLIDATING STATEMENT OF CASH FLOWS
For the Year Ended December 31, 2014
(In thousands)
Cedar Fair L.P. (Parent) | Co-Issuer Subsidiary (Magnum) | Co-Issuer Subsidiary (Cedar Canada) | Guarantor Subsidiaries | Eliminations | Total | |||||||||||||||||||
NET CASH FROM (FOR) OPERATING ACTIVITIES | $ | 138,669 | $ | 12,384 | $ | 9,772 | $ | 180,251 | $ | (3,973 | ) | $ | 337,103 | |||||||||||
CASH FLOWS FROM (FOR) INVESTING ACTIVITIES | ||||||||||||||||||||||||
Intercompany receivables (payments) receipts | — | 13,794 | — | (79,456 | ) | 65,662 | — | |||||||||||||||||
Sale of other assets | — | — | — | 1,377 | — | 1,377 | ||||||||||||||||||
(Purchase) sale of subsidiary interest | (12,024 | ) | 12,024 | — | — | — | — | |||||||||||||||||
Capital expenditures | (64,837 | ) | (270 | ) | (16,072 | ) | (85,540 | ) | — | (166,719 | ) | |||||||||||||
Net cash from (for) investing activities | (76,861 | ) | 25,548 | (16,072 | ) | (163,619 | ) | 65,662 | (165,342 | ) | ||||||||||||||
CASH FLOWS FROM (FOR) FINANCING ACTIVITIES | ||||||||||||||||||||||||
Note borrowings | — | — | 450,000 | — | — | 450,000 | ||||||||||||||||||
Note payments, including early termination penalties | — | — | (426,148 | ) | — | — | (426,148 | ) | ||||||||||||||||
Term debt payments, including early termination penalties | (5,698 | ) | (4,072 | ) | (230 | ) | — | — | (10,000 | ) | ||||||||||||||
Intercompany payables (payments) receipts | 110,763 | (37,762 | ) | 5,159 | (14,030 | ) | (64,130 | ) | — | |||||||||||||||
Distributions (paid) received | (161,873 | ) | — | — | — | 2,441 | (159,432 | ) | ||||||||||||||||
Payment of debt issuance costs | — | — | (9,795 | ) | — | — | (9,795 | ) | ||||||||||||||||
Tax effect of units involved in treasury unit transactions | — | 140 | — | — | — | 140 | ||||||||||||||||||
Net cash from (for) financing activities | (56,808 | ) | (41,694 | ) | 18,986 | (14,030 | ) | (61,689 | ) | (155,235 | ) | |||||||||||||
EFFECT OF EXCHANGE RATE CHANGES ON CASH AND CASH EQUIVALENTS | — | — | (2,742 | ) | — | — | (2,742 | ) | ||||||||||||||||
CASH AND CASH EQUIVALENTS | ||||||||||||||||||||||||
Net increase (decrease) for the year | 5,000 | (3,762 | ) | 9,944 | 2,602 | — | 13,784 | |||||||||||||||||
Balance, beginning of year | 75,000 | 4,144 | 35,575 | 3,337 | — | 118,056 | ||||||||||||||||||
Balance, end of year | $ | 80,000 | $ | 382 | $ | 45,519 | $ | 5,939 | $ | — | $ | 131,840 | ||||||||||||
54
CEDAR FAIR, L.P.
CONDENSED CONSOLIDATING STATEMENT OF CASH FLOWS
For the Year Ended December 31, 2013
(In thousands)
Cedar Fair L.P. (Parent) | Co-Issuer Subsidiary (Magnum) | Co-Issuer Subsidiary (Cedar Canada) | Guarantor Subsidiaries | Eliminations | Total | |||||||||||||||||||
NET CASH FROM (FOR) OPERATING ACTIVITIES | $ | 162,450 | $ | 22,696 | $ | 13,963 | $ | 138,521 | $ | (13,173 | ) | $ | 324,457 | |||||||||||
CASH FLOWS FROM (FOR) INVESTING ACTIVITIES | ||||||||||||||||||||||||
Intercompany receivables (payments) receipts | — | 44,023 | — | (55,136 | ) | 11,113 | — | |||||||||||||||||
Sale of other assets | — | — | — | 15,297 | — | 15,297 | ||||||||||||||||||
Capital expenditures | (56,254 | ) | — | (9,723 | ) | (54,471 | ) | — | (120,448 | ) | ||||||||||||||
Net cash from (for) investing activities | (56,254 | ) | 44,023 | (9,723 | ) | (94,310 | ) | 11,113 | (105,151 | ) | ||||||||||||||
CASH FLOWS FROM (FOR) FINANCING ACTIVITIES | ||||||||||||||||||||||||
Term debt borrowings | 359,022 | 256,500 | 14,478 | — | — | 630,000 | ||||||||||||||||||
Note borrowings | 294,897 | 205,103 | — | — | — | 500,000 | ||||||||||||||||||
Intercompany payables (payments) receipts | 112,553 | (54,236 | ) | (3,117 | ) | (44,087 | ) | (11,113 | ) | — | ||||||||||||||
Term debt payments, including early termination penalties | (661,180 | ) | (466,336 | ) | (14,734 | ) | — | — | (1,142,250 | ) | ||||||||||||||
Distributions (paid) received | (146,953 | ) | 3,496 | (13,173 | ) | — | 13,173 | (143,457 | ) | |||||||||||||||
Payment of debt issuance costs | (14,535 | ) | (8,453 | ) | (544 | ) | — | — | (23,532 | ) | ||||||||||||||
Exercise of limited partnership unit options | — | 52 | — | — | — | 52 | ||||||||||||||||||
Tax effect of units involved in treasury unit transactions | — | 855 | — | — | — | 855 | ||||||||||||||||||
Net cash from (for) financing activities | (56,196 | ) | (63,019 | ) | (17,090 | ) | (44,087 | ) | 2,060 | (178,332 | ) | |||||||||||||
EFFECT OF EXCHANGE RATE CHANGES ON CASH AND CASH EQUIVALENTS | — | — | (1,748 | ) | — | — | (1,748 | ) | ||||||||||||||||
CASH AND CASH EQUIVALENTS | ||||||||||||||||||||||||
Net increase (decrease) for the year | 50,000 | 3,700 | (14,598 | ) | 124 | — | 39,226 | |||||||||||||||||
Balance, beginning of year | 25,000 | 444 | 50,173 | 3,213 | — | 78,830 | ||||||||||||||||||
Balance, end of year | $ | 75,000 | $ | 4,144 | $ | 35,575 | $ | 3,337 | $ | — | $ | 118,056 | ||||||||||||
55
ITEM 9. CHANGES IN AND DISAGREEMENTS WITH ACCOUNTANTS ON ACCOUNTING
AND FINANCIAL DISCLOSURE.
None.
ITEM 9A. CONTROLS AND PROCEDURES.
Disclosure Controls and Procedures
The Partnership maintains a system of controls and procedures designed to ensure that information required to be disclosed by the Partnership in its reports under the Securities Exchange Act of 1934, as amended, is recorded, processed, summarized and reported within the time periods specified by the Commission and that such information is accumulated and communicated to the Partnership's management, including the Chief Executive Officer and the Chief Financial Officer, as appropriate, to allow timely decisions regarding required disclosure. As of December 31, 2015, the Partnership's management, with the participation of the Partnership's Chief Executive Officer and Chief Financial Officer, has evaluated the effectiveness of the Partnership's disclosure controls and procedures. Based upon that evaluation, the Chief Executive Officer and Chief Financial Officer concluded that the Partnership's disclosure controls and procedures were effective as of December 31, 2015.
Management's Report on Internal Control over Financial Reporting
The Partnership's management is responsible for establishing and maintaining adequate internal control over financial reporting, as defined in Rules 13a-15(f) and 15d-15(f) under the Exchange Act. The Partnership's internal control over financial reporting is a process designed to provide reasonable assurance regarding the reliability of financial reporting and the preparation of financial statements for external purposes in accordance with generally accepted accounting principles. Management, with the participation of the Partnership's Chief Executive Officer and Chief Financial Officer, assessed the effectiveness of the Partnership's internal control over financial reporting as of December 31, 2015. In making this assessment, it used the criteria described in “Internal Control - Integrated Framework” (2013) issued by the Committee of Sponsoring Organizations (COSO) of the Treadway Commission. As a result of its assessment, management concluded that, as of December 31, 2015, the Partnership's internal control over financial reporting was effective. Deloitte & Touche LLP, the independent registered public accounting firm that audited the financial statements included in this Form 10-K, has issued an attestation report on the Partnership's internal control over financial reporting.
Changes in Internal Control over Financial Reporting
There were no changes in the Partnership's internal control over financial reporting that occurred during the fourth quarter of 2015 that have materially affected, or are reasonably likely to materially affect, the Partnership's internal control over financial reporting.
56
REPORT OF INDEPENDENT REGISTERED PUBLIC ACCOUNTING FIRM
To the Board of Directors and Unitholders of Cedar Fair, L.P.
Sandusky, Ohio
We have audited the internal control over financial reporting of Cedar Fair, L.P. and subsidiaries (the "Partnership") as of December 31, 2015, based on criteria established in Internal Control - Integrated Framework (2013) issued by the Committee of Sponsoring Organizations of the Treadway Commission. The Partnership's management is responsible for maintaining effective internal control over financial reporting and for its assessment of the effectiveness of internal control over financial reporting, included in the accompanying Management's Report on Internal Control Over Financial Reporting. Our responsibility is to express an opinion on the Partnership's internal control over financial reporting based on our audit.
We conducted our audit in accordance with the standards of the Public Company Accounting Oversight Board (United States). Those standards require that we plan and perform the audit to obtain reasonable assurance about whether effective internal control over financial reporting was maintained in all material respects. Our audit included obtaining an understanding of internal control over financial reporting, assessing the risk that a material weakness exists, testing and evaluating the design and operating effectiveness of internal control based on the assessed risk, and performing such other procedures as we considered necessary in the circumstances. We believe that our audit provides a reasonable basis for our opinion.
A company's internal control over financial reporting is a process designed by, or under the supervision of, the company's principal executive and principal financial officers, or persons performing similar functions, and effected by the company's board of directors, management, and other personnel to provide reasonable assurance regarding the reliability of financial reporting and the preparation of financial statements for external purposes in accordance with generally accepted accounting principles. A company's internal control over financial reporting includes those policies and procedures that (1) pertain to the maintenance of records that, in reasonable detail, accurately and fairly reflect the transactions and dispositions of the assets of the company; (2) provide reasonable assurance that transactions are recorded as necessary to permit preparation of financial statements in accordance with generally accepted accounting principles, and that receipts and expenditures of the company are being made only in accordance with authorizations of management and directors of the company; and (3) provide reasonable assurance regarding prevention or timely detection of unauthorized acquisition, use, or disposition of the company's assets that could have a material effect on the financial statements.
Because of the inherent limitations of internal control over financial reporting, including the possibility of collusion or improper management override of controls, material misstatements due to error or fraud may not be prevented or detected on a timely basis. Also, projections of any evaluation of the effectiveness of the internal control over financial reporting to future periods are subject to the risk that the controls may become inadequate because of changes in conditions, or that the degree of compliance with the policies or procedures may deteriorate.
In our opinion, the Partnership maintained, in all material respects, effective internal control over financial reporting as of December 31, 2015, based on the criteria established in Internal Control - Integrated Framework (2013) issued by the Committee of Sponsoring Organizations of the Treadway Commission.
We have also audited, in accordance with the standards of the Public Company Accounting Oversight Board (United States), the consolidated financial statements as of and for the year ended December 31, 2015 of the Partnership and our report dated February 26, 2016 expressed an unqualified opinion on those financial statements.
/s/ DELOITTE & TOUCHE LLP
Cleveland, Ohio
February 26, 2016
57
ITEM 9B. OTHER INFORMATION.
None.
PART III
ITEM 10. DIRECTORS, EXECUTIVE OFFICERS AND CORPORATE GOVERNANCE.
Cedar Fair Management, Inc., an Ohio corporation owned by an Ohio trust, is the General Partner of the Partnership and has full responsibility for the management of the Partnership. For additional information, attention is directed to Note 1 in “Notes to Consolidated Financial Statements” on page 31 of this Report.
A. Identification of Directors:
The information required by this item is incorporated by reference to the material in our Proxy Statement to be used in connection with the annual meeting of limited partner unitholders to be held in June 2016 (the “Proxy Statement”) under the captions “Proposal One. Election of Directors,” “Board Committees” and “Section 16(a) Beneficial Ownership Reporting Compliance.”
B. Identification of Executive Officers:
Information regarding executive officers of the Partnership is included in this Annual Report on Form 10-K under the caption “Supplemental Item. Executive Officers of Cedar Fair” in Item 1 of Part I and is incorporated herein by reference.
C. Code of Ethics and Certifications:
In accordance with Section 406 of the Sarbanes-Oxley Act of 2002 and Item 406 of Regulation S-K, the Partnership has adopted a Code of Conduct and Ethics (the “Code”), which applies to all directors, officers and employees of the Partnership, including the Chief Executive Officer, Chief Financial Officer and Chief Accounting Officer. A copy of the Code is available on the Internet at the Investor Relations section of our web site (www.cedarfair.com).
The Partnership submitted an unqualified Section 303A.12(a) Chief Executive Officer certification to the New York Stock Exchange on June 30, 2015, stating that the Partnership was in compliance with the NYSE's Corporate Governance Listing Standards. The Chief Executive Officer and Chief Financial Officer certifications under Section 302 of the Sarbanes-Oxley Act are included as exhibits to this Form 10-K.
ITEM 11. EXECUTIVE COMPENSATION.
The information required by this item is incorporated by reference to the material in our Proxy Statement under the captions “Executive Compensation,” “Compensation Committee Interlocks and Insider Participation,” and “Compensation Committee Report.”
ITEM 12. SECURITY OWNERSHIP OF CERTAIN BENEFICIAL OWNERS AND MANAGEMENT AND RELATED UNITHOLDER MATTERS.
The information required by this item is incorporated by reference to the material in our Proxy Statement under the caption “Security Ownership of Certain Beneficial Owners and Management.”
58
EQUITY COMPENSATION PLAN INFORMATION
The following table sets forth information concerning units authorized or available for issuance under our equity compensation plan as of December 31, 2015.
Plan Category | Number of units to be issued upon exercise of outstanding options, warrants and rights (a) | Weighted-average exercise price of outstanding options, warrants and rights (b) (1) | Number of units remaining available for future issuance under equity compensation plans (excluding units reflected in column (a)) (c) | |||||||
Equity compensation plans approved by unitholders | 1,224,720 | $ | 34.50 | 247,892 | ||||||
Equity compensation plans not approved by unitholders | — | — | — | |||||||
Total | 1,224,720 | $ | 34.50 | 247,892 | ||||||
(1) The weighted average price in column (b) represents the weighted average price of 506,990 unit options outstanding.
Attention is directed to Note 7 in “Notes to Consolidated Financial Statements” for additional information regarding the Partnership's equity incentive plan.
ITEM 13. CERTAIN RELATIONSHIPS AND RELATED TRANSACTIONS, AND DIRECTOR INDEPENDENCE.
The information required by this item is incorporated by reference to the material in our Proxy Statement under the captions “Certain Relationships and Related Transactions,” “Board of Directors,” and “Board Committees.”
ITEM 14. PRINCIPAL ACCOUNTING FEES AND SERVICES.
The information required by this item is incorporated by reference to the material in our Proxy Statement under the caption “Independent Registered Public Accounting Firm Services and Fees.”
PART IV
ITEM 15. EXHIBITS, FINANCIAL STATEMENT SCHEDULES.
A. 1. Financial Statements
The following consolidated financial statements of the Registrant, the notes thereto and the related Report of Independent Registered Public Accounting Firm are filed under Item 8 of this Report:
Page | |||
(i) | Report of Independent Registered Public Accounting Firm. | 26 | |
(ii) | Consolidated Balance Sheets - December 31, 2015 and 2014. | 27 | |
(iii) | Consolidated Statements of Operations and Comprehensive Income - Years ended December 31, 2015, 2014, and 2013. | 28 | |
(iv) | Consolidated Statements of Cash Flows - Years ended December 31, 2015, 2014, and 2013. | 29 | |
(v) | Consolidated Statements of Partners' Equity - Years ended December 31, 2015, 2014, and 2013. | 30 | |
(vi) | Notes to Consolidated Financial Statements - December 31, 2015, 2014, and 2013. | 31 | |
A. 2. Financial Statement Schedules
All Schedules are omitted, as the information is not required or is otherwise furnished.
59
A. 3. Exhibits
The exhibits listed below are incorporated herein by reference to prior SEC filings by Registrant or are included as exhibits in this Form 10-K.
Exhibit Number | Description | |
2.1 | Agreement and Plan of Merger, by and among Siddur Holdings, Ltd., Siddur Merger Sub, LLC, Cedar Fair Management, Inc. and Cedar Fair, L.P., dated as of December 16, 2009. Incorporated herein by reference to Exhibit 2.1 to the Registrant's Form 8-K (File No. 001-09444) filed on December 17, 2009. | |
2.2 | Termination and Settlement Agreement among Cedar Fair, L.P. and its affiliates, and the Apollo Parties thereto, dated April 5, 2010. Incorporated herein by reference to Exhibit 2.1 to the Registrant's Form 8-K (File No. 001-09444) filed on April 6, 2010. | |
3.1 | Cedar Fair, L.P. Certificate of Limited Partnership. Incorporated herein by reference to Exhibit 3.6 to the Registration Statement on Form S-4 (File No. 333-172773) filed on March 11, 2011. | |
3.2 | Sixth Amended and Restated Agreement of Limited Partnership of Cedar Fair, L.P. Incorporated herein by reference to Exhibit 3.1 to the Registrant's Form 10-Q (File No. 001-09444) filed November 4, 2011. | |
3.3 | Regulations of Cedar Fair Management Inc. Incorporated herein by reference to Exhibit 3.2 to the Registrant's Form 10-Q filed November 4, 2011. | |
4.1 | Indenture, by and among Cedar Fair, L.P., Canada's Wonderland Company, and Magnum Management Corporation, as issuers, the guarantors named therein, and The Bank of New York Mellon, as trustee, dated as of March 6, 2013 (including form of 5.25% Senior Note due 2021). Incorporated herein by reference to Exhibit 4.1 to the Registrant's Form 8-K filed on March 8, 2013. | |
4.2 | Registration Rights Agreement, among Cedar Fair, L.P., Canada's Wonderland Company, and Magnum Management Corporation, as issuers, the guarantors named therein, and J.P. Morgan Securities Inc., as representative of the initial purchasers named therein, dated March 6, 2013. Incorporated herein by reference to Exhibit 4.3 to the Registrant's Form 8-K filed on March 8, 2013. | |
4.3 | Indenture, dated as of June 3, 2014, by and among Cedar Fair, L.P., Canada’s Wonderland Company and Magnum Management Corporation, as issuers, the guarantors named therein and The Bank of New York Mellon, as trustee (including Form of 5.375% Senior Note due 2024). Incorporated herein by reference to Exhibit 4.1 to the Registrant’s Form 8-K filed on June 3, 2014. | |
4.4 | Registration Rights Agreement, dated June 3, 2014, by and among Cedar Fair, L.P., Canada’s Wonderland Company and Magnum Management Corporation, as issuers, the guarantors named therein and J.P. Morgan Securities LLC, on behalf of itself and as representative of the initial purchasers named therein. Incorporated herein by reference to Exhibit 4.3 to the Registrant’s Form 8-K filed on June 3, 2014. | |
10.1 | Cedar Fair, L.P. Amended and Restated Executive Severance Plan dated July 18, 2007. Incorporated herein by reference to Exhibit 10.1 to the Registrant's Quarterly Report on Form 10-Q (File No. 001-09444) filed on August 3, 2007. (+) | |
10.2 | Cedar Fair, L.P. Amended and Restated Supplemental Retirement Program dated July 18, 2007. Incorporated herein by reference to Exhibit 10.5 to the Registrant's Quarterly Report on Form 10-Q (File No. 001-09444) filed on August 3, 2007. (+) | |
10.3 | Cedar Fair, L.P. 2008 Supplemental Retirement Program dated February 4, 2008. Incorporated herein by reference to Exhibit 10.5 to the Registrant's Annual Report on Form 10-K (File No. 001-09444) filed on February 29, 2008. (+) | |
10.4 | Cedar Fair, L.P. 2008 Omnibus Incentive Plan dated as of May 15, 2008. Incorporated herein by reference to Exhibit 10.1 to the Registrant's Form 8-K (File No. 001-09444) filed on May 20, 2008. (+) | |
10.5 | Cedar Fair, L.P. 2008 Omnibus Incentive Plan Long-Term Incentive Award Agreement. Incorporated herein by reference to Exhibit 10.13 to the Registrant's Form 10-K (File No. 001-09444) filed on March 2, 2009. (+) | |
10.6 | Cedar Fair, L.P. 2008 Omnibus Incentive Plan 2008-2011 Performance Award Agreement. Incorporated herein by reference to Exhibit 10.13 to the Registrant's Form 10-K (File No. 001-09444) filed on March 2, 2009. (+) | |
10.7 | Cedar Fair, L.P. 2008 Omnibus Incentive Plan Form of Restricted Phantom Unit Award Agreement. Incorporated herein by reference to Exhibit 10 to the Registrant's Form 10-Q (File No. 001-09444) filed on May 8, 2009 (+) | |
10.8 | Form of Indemnification Agreement. Incorporated herein by reference to Exhibit 10.1 to the Registrant's Form 8-K filed November 1, 2011. (+) | |
10.9 | 2008 Omnibus Incentive Plan Form of Restricted Unit Award Agreement. Incorporated herein by reference to Exhibit 10.1 to the Registrant's Form 8-K filed March 28, 2012. (+) | |
10.10 | 2008 Omnibus Incentive Plan Form of Option Award Agreement. Incorporated herein by reference to Exhibit 10.2 to the Registrant's Form 8-K filed March 28, 2012. (+) | |
10.11 | 2008 Omnibus Incentive Plan Form of Performance Award Agreement. Incorporated herein by reference to Exhibit 10.3 to the Registrant's Form 8-K filed March 28, 2012. (+) | |
60
Exhibit Number | Description | |
10.12 | Credit Agreement, among Cedar Fair, L.P., Magnum Management Corporation and Canada's Wonderland Company as borrowers, the several lenders from time to time party thereto, JPMorgan Chase Bank, N.A. as administrative agent and collateral agent and the other parties thereto, dated March 6, 2013. Incorporated herein by reference to Exhibit 10.1 to the Registrant's Form 8-K filed on March 8, 2013. | |
10.13 | Amendment No. 1, dated September 30, 2013, to Credit Agreement, among Cedar Fair, L.P., Magnum Management Corporation and Canada's Wonderland Company as borrowers, the several lenders from time to time party thereto, JPMorgan Chase Bank, N.A. as administrative agent and collateral agent and the other parties thereto. Incorporated herein by reference to Exhibit 10.1 to the Registrant's Form 10-Q filed on November 7, 2013. | |
10.14 | Amended and Restated Employment Agreement by and among Cedar Fair, L.P., Cedar Fair Management, Inc., Magnum Management Corporation and Matthew A. Ouimet, dated October 21, 2013. Incorporated herein by reference to Exhibit 10.1 to the Registrant's Form 8-K filed October 21, 2013. (+) | |
10.15 | Cedar Fair, L.P. 2008 Omnibus Incentive Plan Performance Award Agreement, dated March 31, 2014, by and between Magnum Management Corporation and Matthew A. Ouimet. Incorporated herein by reference to Exhibit 10.1 to the Registrant's Form 8-K filed on April 4, 2014. (+) | |
10.16 | Cedar Fair, L.P. 2008 Omnibus Incentive Plan Form of Restricted Unit Award Agreement. Incorporated herein by reference to Exhibit 10.2 to the Registrant’s Form 10-Q filed on May 9, 2014. (+) | |
10.17 | Cedar Fair, L.P. 2008 Omnibus Incentive Plan Form of Deferred Unit Award Agreement. Incorporated herein by reference to Exhibit 10.3 to the Registrant’s Form 10-Q filed on May 9, 2014. (+) | |
10.18 | Amendment No. 2, dated December 18, 2014, to Credit Agreement, among Cedar Fair, L.P., Magnum Management Corporation and Canada’s Wonderland Company as borrowers, the several lenders from time to time party thereto, JPMorgan Chase Bank, N.A. as administrative agent and collateral agent and the other parties thereto. | |
10.19 | Section 16 Officer Standard Form of Employment Contract (non-CEO) (December 2014). Incorporated herein by reference to Exhibit 10.31 to teh Registrant's Form 10-K filed on February 26, 2015. (+) | |
10.20 | Cedar, L.P. 2008 Omnibus Incentive Plan Form of Performance Unit Award Agreement. Incorporated herein by reference to Exhibit 10.1 to the Registrant's Form 10-Q filed on May 1, 2015. (+) | |
10.21 | Cedar Fair, L.P. 2008 Omnibus Incentive Plan Form of Deferred Unit Award Agreement (2016 Version). (+) | |
12.1 | Computation of Ratio of Earnings to Fixed Charges | |
21 | Subsidiaries of Cedar Fair, L.P. | |
23 | Consent of Independent Registered Public Accounting Firm | |
31.1 | Certification of Chief Executive Officer pursuant to Section 302 of the Sarbanes-Oxley Act of 2002. | |
31.2 | Certification of Chief Financial Officer pursuant to Section 302 of the Sarbanes-Oxley Act of 2002. | |
32 | Certifications of Chief Executive Officer and Chief Financial Officer pursuant to 18 U.S.C. Section 1350, as adopted pursuant to Section 906 of the Sarbanes-Oxley Act of 2002. | |
101 | The following materials from the Partnership's Annual Report on Form 10-K for the year ended December 31, 2015 formatted in Extensible Business Reporting Language (XBRL): (i) the Consolidated Statements of Operations and Comprehensive Income, (ii) the Consolidated Balance Sheets, (iii) the Consolidated Statements of Cash Flows, (iv) the Consolidated Statements of Partners' Equity, and (v) related notes. | |
(+) Management contract or compensatory plan or arrangement.
61
SIGNATURES
Pursuant to the requirements of Section 13 or 15(d) of the Securities Exchange Act of 1934, the registrant has duly caused this report to be signed on its behalf by the undersigned, thereunto duly authorized.
CEDAR FAIR, L.P.
(Registrant)
DATED: February 26, 2016 By: Cedar Fair Management, Inc.
General Partner
/S/ Matthew A. Ouimet |
Matthew A. Ouimet |
President and Chief Executive Officer |
Pursuant to the requirements of the Securities Exchange Act of 1934, this report has been signed below by the following persons on behalf of the registrant and in the capacities and on the dates indicated.
Signature | Title | Date | ||
/S/ | Matthew A. Ouimet | President and Chief Executive Officer | February 26, 2016 | |
Matthew A. Ouimet | Director | |||
/S/ | Brian C. Witherow | Executive Vice President and Chief Financial Officer | February 26, 2016 | |
Brian C. Witherow | (Principal Financial Officer) | |||
/S/ | David R. Hoffman | Senior Vice President and Chief Accounting Officer | February 26, 2016 | |
David R. Hoffman | (Principal Accounting Officer) | |||
/S/ | Eric L. Affeldt | Chairman | February 26, 2016 | |
Eric L. Affeldt | ||||
/S/ | Gina D. France | Director | February 26, 2016 | |
Gina D. France | ||||
/S/ | Daniel J. Hanrahan | Director | February 26, 2016 | |
Daniel J. Hanrahan | ||||
/S/ | Tom Klein | Director | February 26, 2016 | |
Tom Klein | ||||
/S/ | D. Scott Olivet | Director | February 26, 2016 | |
D. Scott Olivet | ||||
/S/ | John M. Scott III | Director | February 26, 2016 | |
John M. Scott III | ||||
/S/ | Lauri M. Shanahan | Director | February 26, 2016 | |
Lauri M. Shanahan | ||||
/S/ | Debra Smithart-Oglesby | Director | February 26, 2016 | |
Debra Smithart-Oglesby | ||||
62
EXHIBIT INDEX
Exhibit Number | Description | Page | |
2.1 | Agreement and Plan of Merger, by and among Siddur Holdings, Ltd., Siddur Merger Sub, LLC, Cedar Fair Management, Inc. and Cedar Fair, L.P., dated as of December 16, 2009. Incorporated herein by reference to Exhibit 2.1 to the Registrant's Form 8-K (File No. 001-09444) filed on December 17, 2009. | * | |
2.2 | Termination and Settlement Agreement among Cedar Fair, L.P. and its affiliates, and the Apollo Parties thereto, dated April 5, 2010. Incorporated herein by reference to Exhibit 2.1 to the Registrant's Form 8-K (File No. 001-09444) filed on April 6, 2010. | * | |
3.1 | Cedar Fair, L.P. Certificate of Limited Partnership. Incorporated herein by reference to Exhibit 3.6 to the Registration Statement on Form S-4 (File No. 333-172773) filed on March 11, 2011. | * | |
3.2 | Sixth Amended and Restated Agreement of Limited Partnership of Cedar Fair, L.P. Incorporated herein by reference to Exhibit 3.1 to the Registrant's Form 10-Q (File No. 001-09444) filed November 4, 2011. | * | |
3.3 | Regulations of Cedar Fair Management Inc. Incorporated herein by reference to Exhibit 3.2 to the Registrant's Form 10-Q filed November 4, 2011. | * | |
4.1 | Indenture, by and among Cedar Fair, L.P., Canada's Wonderland Company, and Magnum Management Corporation, as issuers, the guarantors named therein, and The Bank of New York Mellon, as trustee, dated as of March 6, 2013 (including form of 5.25% Senior Note due 2021). Incorporated herein by reference to Exhibit 4.1 to the Registrant's Form 8-K filed on March 8, 2013. | * | |
4.2 | Registration Rights Agreement, among Cedar Fair, L.P., Canada's Wonderland Company, and Magnum Management Corporation, as issuers, the guarantors named therein, and J.P. Morgan Securities Inc., as representative of the initial purchasers named therein, dated March 6, 2013. Incorporated herein by reference to Exhibit 4.3 to the Registrant's Form 8-K filed on March 8, 2013. | * | |
4.3 | Indenture, dated as of June 3, 2014, by and among Cedar Fair, L.P., Canada’s Wonderland Company and Magnum Management Corporation, as issuers, the guarantors named therein and The Bank of New York Mellon, as trustee (including Form of 5.375% Senior Note due 2024). Incorporated herein by reference to Exhibit 4.1 to the Registrant’s Form 8-K filed on June 3, 2014. | * | |
4.4 | Registration Rights Agreement, dated June 3, 2014, by and among Cedar Fair, L.P., Canada’s Wonderland Company and Magnum Management Corporation, as issuers, the guarantors named therein and J.P. Morgan Securities LLC, on behalf of itself and as representative of the initial purchasers named therein. Incorporated herein by reference to Exhibit 4.3 to the Registrant’s Form 8-K filed on June 3, 2014. | * | |
10.1 | Cedar Fair, L.P. Amended and Restated Executive Severance Plan dated July 18, 2007. Incorporated herein by reference to Exhibit 10.1 to the Registrant's Quarterly Report on Form 10-Q (File No. 001-09444) filed on August 3, 2007. (+) | * | |
10.2 | Cedar Fair, L.P. Amended and Restated Supplemental Retirement Program dated July 18, 2007. Incorporated herein by reference to Exhibit 10.5 to the Registrant's Quarterly Report on Form 10-Q (File No. 001-09444) filed on August 3, 2007. (+) | * | |
10.3 | Cedar Fair, L.P. 2008 Supplemental Retirement Program dated February 4, 2008. Incorporated herein by reference to Exhibit 10.5 to the Registrant's Annual Report on Form 10-K (File No. 001-09444) filed on February 29, 2008. (+) | * | |
10.4 | Cedar Fair, L.P. 2008 Omnibus Incentive Plan dated as of May 15, 2008. Incorporated herein by reference to Exhibit 10.1 to the Registrant's Form 8-K (File No. 001-09444) filed on May 20, 2008. (+) | * | |
10.5 | Cedar Fair, L.P. 2008 Omnibus Incentive Plan Long-Term Incentive Award Agreement. Incorporated herein by reference to Exhibit 10.13 to the Registrant's Form 10-K (File No. 001-09444) filed on March 2, 2009. (+) | * | |
10.6 | Cedar Fair, L.P. 2008 Omnibus Incentive Plan 2008-2011 Performance Award Agreement. Incorporated herein by reference to Exhibit 10.13 to the Registrant's Form 10-K (File No. 001-09444) filed on March 2, 2009. (+) | * | |
10.7 | Cedar Fair, L.P. 2008 Omnibus Incentive Plan Form of Restricted Phantom Unit Award Agreement. Incorporated herein by reference to Exhibit 10 to the Registrant's Form 10-Q (File No. 001-09444) filed on May 8, 2009 (+) | * | |
10.8 | Form of Indemnification Agreement. Incorporated herein by reference to Exhibit 10.1 to the Registrant's Form 8-K filed November 1, 2011. (+) | * | |
10.9 | 2008 Omnibus Incentive Plan Form of Restricted Unit Award Agreement. Incorporated herein by reference to Exhibit 10.1 to the Registrant's Form 8-K filed March 28, 2012. (+) | * | |
10.10 | 2008 Omnibus Incentive Plan Form of Option Award Agreement. Incorporated herein by reference to Exhibit 10.2 to the Registrant's Form 8-K filed March 28, 2012. (+) | * | |
10.11 | 2008 Omnibus Incentive Plan Form of Performance Award Agreement. Incorporated herein by reference to Exhibit 10.3 to the Registrant's Form 8-K filed March 28, 2012. (+) | * | |
63
EXHIBIT INDEX (continued)
Exhibit Number | Description | Page | |
10.12 | Credit Agreement, among Cedar Fair, L.P., Magnum Management Corporation and Canada's Wonderland Company as borrowers, the several lenders from time to time party thereto, JPMorgan Chase Bank, N.A. as administrative agent and collateral agent and the other parties thereto, dated March 6, 2013. Incorporated herein by reference to Exhibit 10.1 to the Registrant's Form 8-K filed on March 8, 2013. | * | |
10.13 | Amendment No. 1, dated September 30, 2013, to Credit Agreement, among Cedar Fair, L.P., Magnum Management Corporation and Canada's Wonderland Company as borrowers, the several lenders from time to time party thereto, JPMorgan Chase Bank, N.A. as administrative agent and collateral agent and the other parties thereto. Incorporated herein by reference to Exhibit 10.1 to the Registrant's Form 10-Q filed on November 7, 2013. | * | |
10.14 | Amended and Restated Employment Agreement by and among Cedar Fair, L.P., Cedar Fair Management, Inc., Magnum Management Corporation and Matthew A. Ouimet, dated October 21, 2013. Incorporated herein by reference to Exhibit 10.1 to the Registrant's Form 8-K filed October 21, 2013. (+) | * | |
10.15 | Cedar Fair, L.P. 2008 Omnibus Incentive Plan Performance Award Agreement, dated March 31, 2014, by and between Magnum Management Corporation and Matthew A. Ouimet. Incorporated herein by reference to Exhibit 10.1 to the Registrant's Form 8-K filed on April 4, 2014. (+) | * | |
10.16 | Cedar Fair, L.P. 2008 Omnibus Incentive Plan Form of Restricted Unit Award Agreement. Incorporated herein by reference to Exhibit 10.2 to the Registrant’s Form 10-Q filed on May 9, 2014. (+) | * | |
10.17 | Cedar Fair, L.P. 2008 Omnibus Incentive Plan Form of Deferred Unit Award Agreement. Incorporated herein by reference to Exhibit 10.3 to the Registrant’s Form 10-Q filed on May 9, 2014. (+) | * | |
10.18 | Amendment No. 2, dated December 18, 2014, to Credit Agreement, among Cedar Fair, L.P., Magnum Management Corporation and Canada’s Wonderland Company as borrowers, the several lenders from time to time party thereto, JPMorgan Chase Bank, N.A. as administrative agent and collateral agent and the other parties thereto. | 65 | |
10.19 | Section 16 Officer Standard Form of Employment Contract (non-CEO) (December 2014). Incorporated herein by reference to Exhibit 10.31 to teh Registrant's Form 10-K filed on February 26, 2015. (+) | * | |
10.20 | Cedar, L.P. 2008 Omnibus Incentive Plan Form of Performance Unit Award Agreement. Incorporated herein by reference to Exhibit 10.1 to the Registrant's Form 10-Q filed on May 1, 2015. (+) | * | |
10.21 | Cedar Fair, L.P. 2008 Omnibus Incentive Plan Form of Deferred Unit Award Agreement (2016 Version). (+) | 77 | |
12.1 | Computation of Ratio of Earnings to Fixed Charges | 79 | |
21 | Subsidiaries of Cedar Fair, L.P. | 80 | |
23 | Consent of Independent Registered Public Accounting Firm | 81 | |
31.1 | Certification of Chief Executive Officer pursuant to Section 302 of the Sarbanes-Oxley Act of 2002. | 82 | |
31.2 | Certification of Chief Financial Officer pursuant to Section 302 of the Sarbanes-Oxley Act of 2002. | 83 | |
32 | Certifications of Chief Executive Officer and Chief Financial Officer pursuant to 18 U.S.C. Section 1350, as adopted pursuant to Section 906 of the Sarbanes-Oxley Act of 2002. | 84 | |
101 | The following materials from the Partnership's Annual Report on Form 10-K for the year ended December 31, 2015 formatted in Extensible Business Reporting Language (XBRL): (i) the Consolidated Statements of Operations and Comprehensive Income, (ii) the Consolidated Balance Sheets, (iii) the Consolidated Statements of Cash Flows, (iv) the Consolidated Statements of Partners' Equity, and (v) related notes. | * | |
(+) Management contract or compensatory plan or arrangement.
64