Attached files
| file | filename |
|---|---|
| 8-K - FORM 8-K - US BANCORP \DE\ | d283538d8k.htm |
| EX-99.1 - PRESS RELEASE - US BANCORP \DE\ | d283538dex991.htm |
 U.S.
Bancorp 4Q11 Earnings
Conference Call
U.S. Bancorp
4Q11 Earnings
Conference Call
January 18, 2012
Richard K. Davis
Chairman, President and CEO
Andy Cecere
Vice Chairman and CFO |
 2
Forward-looking Statements and Additional Information
The
following
information
appears
in
accordance
with
the
Private
Securities
Litigation
Reform
Act
of
1995:
This presentation contains forward-looking statements about U.S. Bancorp.
Statements that are not historical or current facts, including statements
about beliefs and expectations, are forward-looking statements and are based on
the information available to, and assumptions and estimates made
by,
management
as
of
the
date
made.
These
forward-looking
statements
cover,
among
other
things,
anticipated
future
revenue
and
expenses
and
the
future
plans
and
prospects
of
U.S.
Bancorp.
Forward-looking
statements
involve
inherent
risks
and
uncertainties,
and
important
factors could cause actual results to differ materially from those
anticipated. Global and domestic economies could fail to recover from the recent
economic downturn or could experience another severe contraction, which could
adversely affect U.S. Bancorp’s revenues and the values of its assets
and liabilities. Global financial markets could experience a recurrence of significant turbulence, which could reduce the availability of
funding to certain financial institutions and lead to a tightening of credit, a
reduction of business activity, and increased market volatility. Continued
stress
in
the
commercial
real
estate
markets,
as
well
as
a
delay
or
failure
of
recovery
in
the
residential
real
estate
markets,
could
cause
additional
credit losses and deterioration in asset values. In addition, U.S.
Bancorp’s business and financial performance is likely to be negatively impacted
by effects of recently enacted and future legislation and regulation. U.S.
Bancorp’s results could also be adversely affected by continued
deterioration
in
general
business
and
economic
conditions;
changes
in
interest
rates;
deterioration
in
the
credit
quality
of
its
loan
portfolios
or
in
the
value of the collateral securing those loans; deterioration in the value of
securities held in its investment securities portfolio; legal and regulatory
developments; increased competition from both banks and non-banks; changes in
customer behavior and preferences; effects of mergers and acquisitions and
related integration; effects of critical accounting policies and judgments; and management’s ability to effectively manage credit
risk, residual value risk, market risk, operational risk, interest rate risk and
liquidity risk. For discussion of these and other risks that may cause actual
results to differ from expectations, refer to U.S. Bancorp’s Annual Report on
Form 10-K for the year ended December 31, 2010, on file with the Securities and
Exchange Commission, including the sections entitled “Risk
Factors”
and “Corporate Risk Profile”
contained in Exhibit 13, and all subsequent filings with the Securities and
Exchange Commission under Sections 13(a), 13(c), 14 or 15(d) of the
Securities Exchange Act of 1934. Forward-looking statements speak only as of the date they are made,
and U.S. Bancorp undertakes no obligation to update them in light of new
information or future events. This
presentation
includes
non-GAAP
financial
measures
to
describe
U.S.
Bancorp’s
performance.
The
reconciliations
of
those
measures
to
GAAP
measures
are
provided
within
or
in
the
appendix
of
the
presentation.
These
disclosures
should
not
be
viewed
as
a
substitute
for
operating
results
determined in accordance with GAAP, nor are they necessarily comparable to
non-GAAP performance measures that may be presented by other
companies. |
 3
4Q11 Earnings
Conference Call
4Q11 Highlights
Net income of $1.4 billion; $0.69 per diluted common share
Results included two notable items; net, items added $0.05 per diluted common
share •
$263 million merchant settlement gain
•
$130 million expense accrual related to mortgage servicing matters
Record
total
net
revenue
of
$5.1
billion,
up
8.1%
vs.
4Q10
(4.7%
excluding
notable
items)
•
Net interest income growth of 7.0% vs. 4Q10
•
Noninterest income growth of 9.4% vs. 4Q10
Average loan growth of 5.9% (5.5% excluding acquisitions) vs. 4Q10 and average loan
growth of 2.4% vs. 3Q11
Strong average deposit growth of 17.3% (11.7% excluding acquisitions) vs. 4Q10 and
average deposit growth of 3.7% vs. 3Q11
Net charge-offs declined 7.0% vs. 3Q11 and nonperforming assets (excluding
covered assets) declined 15.2% vs. 3Q11
Capital generation continues to strengthen capital position
•
Tier
1
common
equity
ratio
of
8.6%
(8.2%
under
anticipated
Basel
III
guidelines)
•
Tier 1 capital ratio of 10.8%
•
Repurchased 6 million shares of common stock during 4Q11
|
 4
4Q11 Earnings
Conference Call
2011 Full Year Highlights
Record net income of $4.9 billion; $2.46 per diluted common share
Record total net revenue of $19.1 billion, up 5.3% vs. 2010
•
Net interest income growth of 5.7% vs. 2010
•
Noninterest income growth of 4.8% vs. 2010
Average loan growth of 4.4% (3.9% excluding acquisitions) vs. 2010
Strong average deposit growth of 15.4% (10.6% excluding
acquisitions) vs. 2010
Net charge-offs declined 32.0% vs. 2010 and nonperforming assets
(excluding covered assets) declined 23.2% vs. 2010
Capital generation continues to strengthen capital position
•
Tier 1 common equity ratio of 8.6% vs. 7.8% in 2010
•
Repurchased 22 million shares of common stock during 2010
|
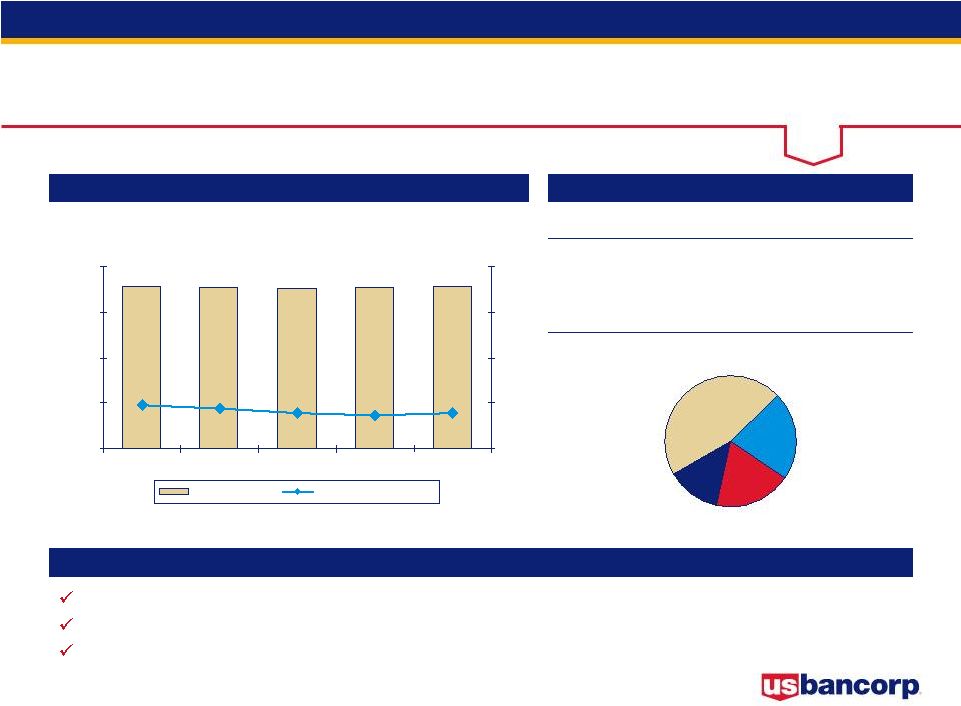
 5
4Q11 Earnings
Conference Call
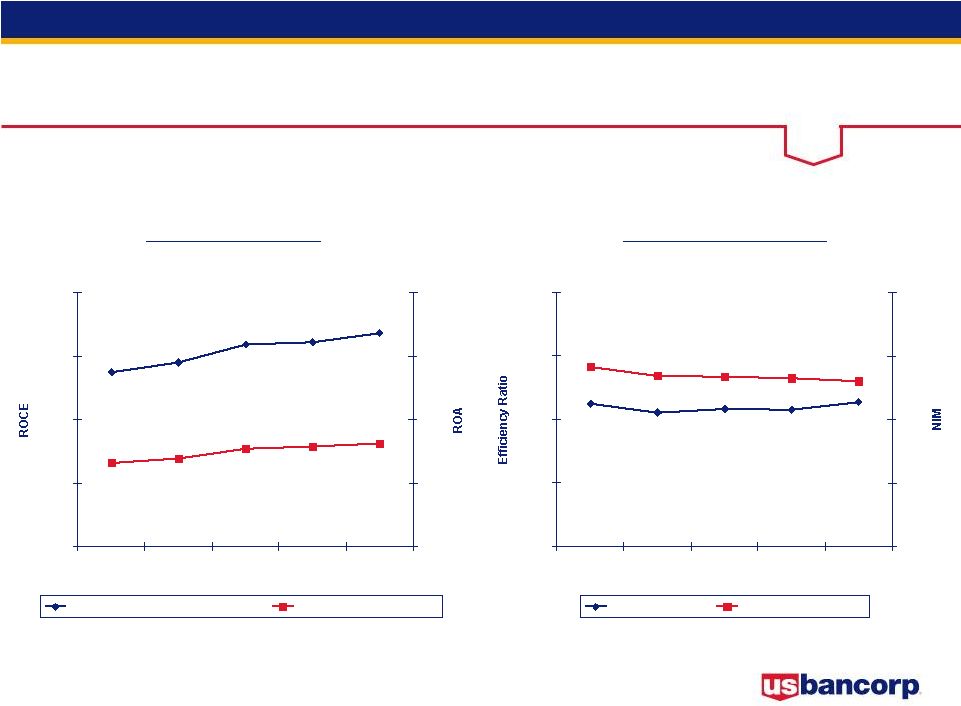
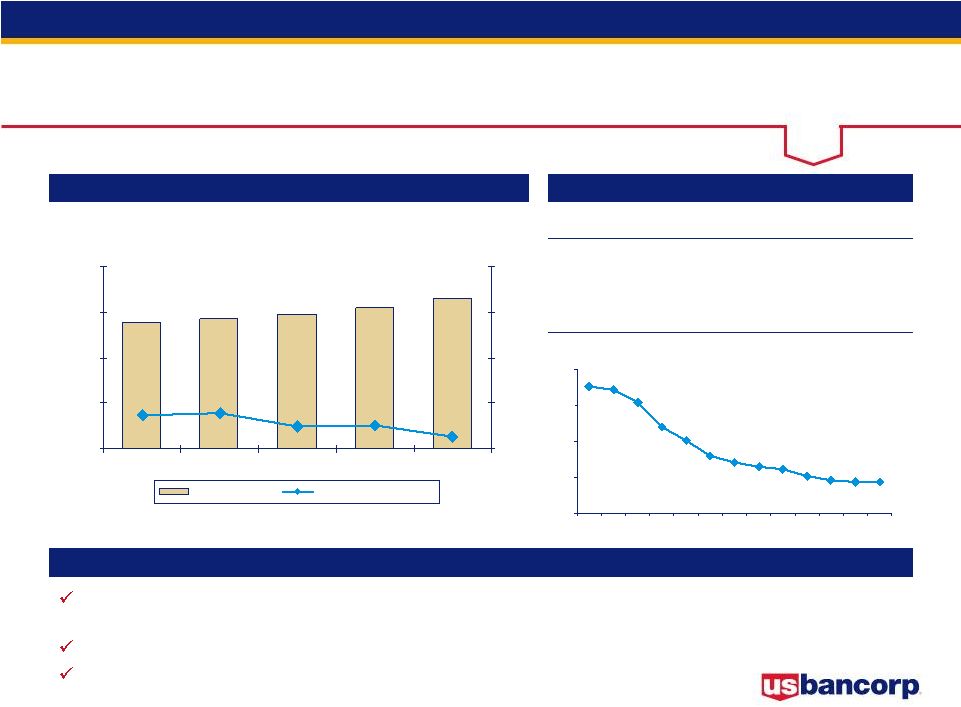
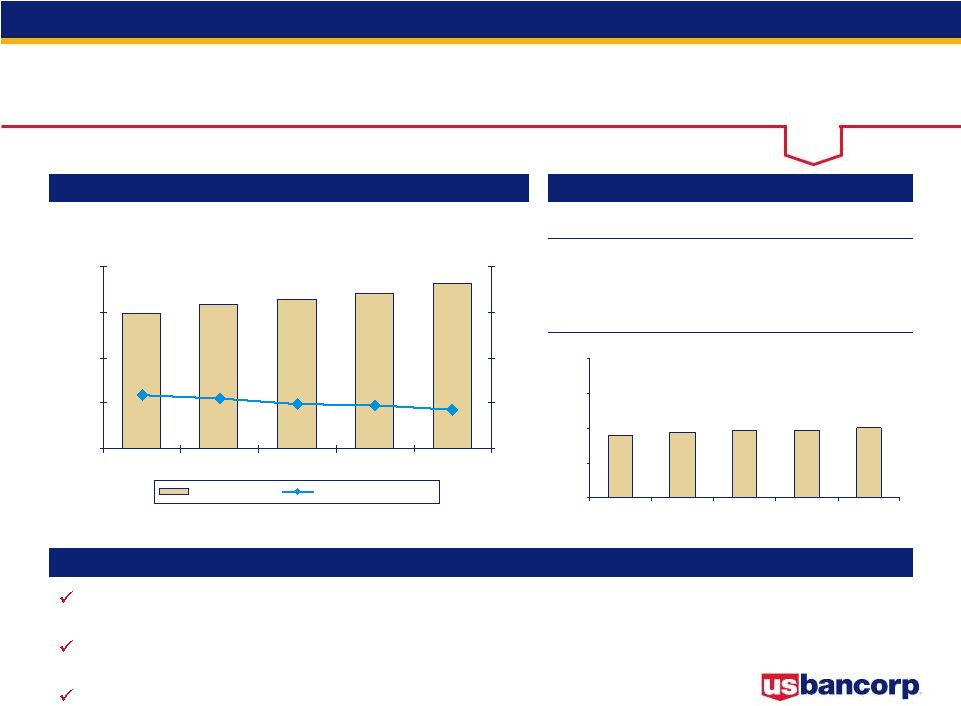
Performance Ratios
16.8%
16.1%
15.9%
14.5%
13.7%
1.62%
1.57%
1.54%
1.38%
1.31%
0%
5%
10%
15%
20%
4Q10
1Q11
2Q11
3Q11
4Q11
0%
1%
2%
3%
4%
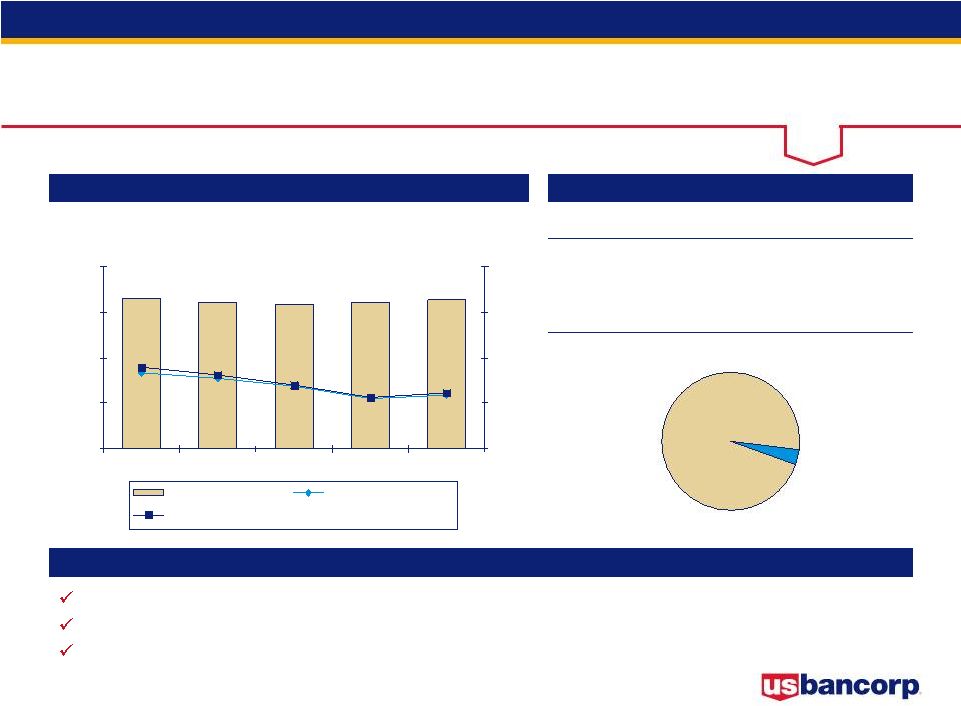
52.7%
51.5%
51.6%
51.1%
52.5%
3.60%
3.65%
3.67%
3.69%
3.83%
30%
40%
50%
60%
70%
4Q10
1Q11
2Q11
3Q11
4Q11
1%
2%
3%
4%
5%
ROCE and ROA
Efficiency Ratio and
Net Interest Margin
Return on Avg Common Equity
Return on Avg Assets
Efficiency Ratio
Net Interest Margin
Efficiency ratio computed as noninterest expense divided by the sum of net interest
income on a taxable-equivalent basis
and
noninterest
income
excluding
securities
gains
(losses)
net |
 6
4Q11 Earnings
Conference Call
4Q11
3Q11
2Q11
1Q11
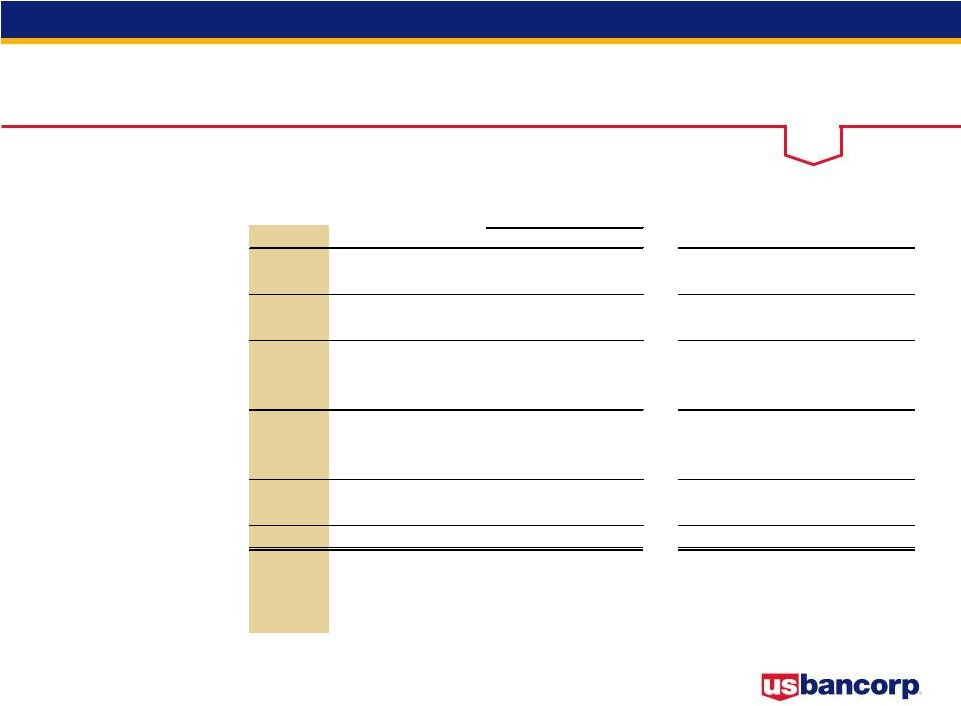
4Q10
Shareholders' equity
34.0
$
33.2
$
32.5
$
30.5
$
29.5
$
Tier 1 capital
29.2
28.1
27.8
26.8
25.9
Total risk-based capital
36.1
35.4
35.1
34.2
33.0
Tier 1 common equity ratio
8.6%
8.5%
8.4%
8.2%
7.8%
Tier 1 capital ratio
10.8%
10.8%
11.0%
10.8%
10.5%
Total risk-based capital ratio
13.3%
13.5%
13.9%
13.8%
13.3%
Leverage ratio
9.1%
9.0%
9.2%
9.0%
9.1%
Tangible common equity ratio
6.6%
6.6%
6.5%
6.3%
6.0%
Tangible common equity as a
percent of risk-weighted assets
8.1%
8.1%
8.0%
7.6%
7.2%
Tier 1 common equity ratio
8.2%
8.2%
8.1%
7.7%
7.3%
using anticipated Basel III definition
Capital Position
$ in billions |
 7
4Q11 Earnings
Conference Call
150
170
190
210
230
4Q10
1Q11
2Q11
3Q11
4Q11
Loans
Deposits
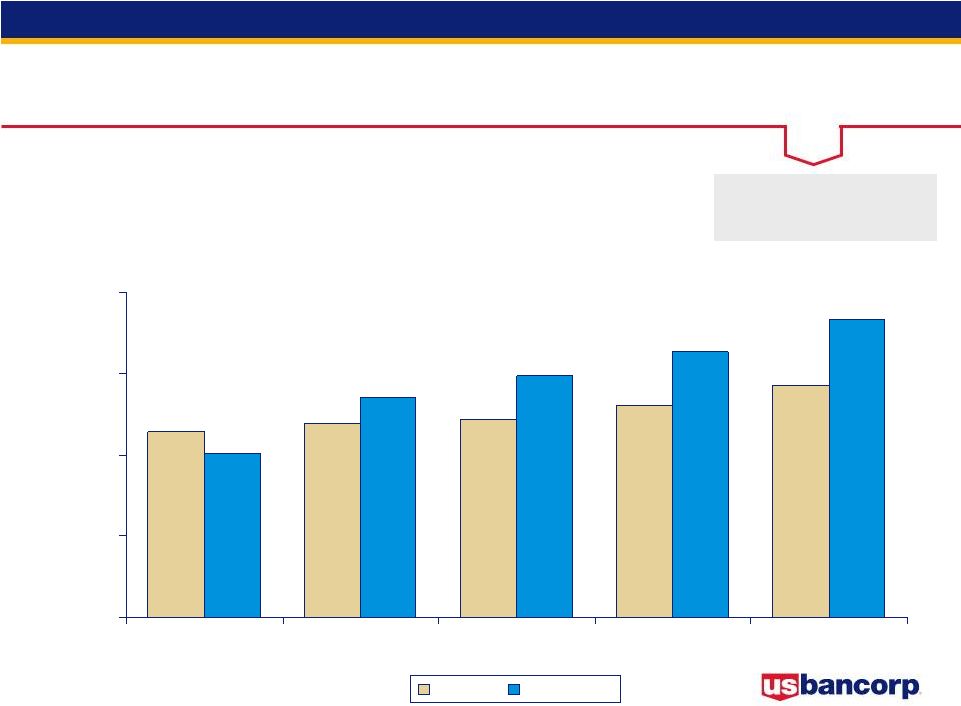
Loan and Deposit Growth
Average Balances
Year-Over-Year Growth
4Q11 Acquisition Adjusted
Loan Growth = 5.5%
Deposit Growth = 11.7%
2.4%
$197.6
4.0%
$198.8
5.0%
$202.2
5.9%
$207.0
2.0%
$195.5
11.9%
$204.3
14.2%
$209.4
17.9%
$215.4
17.3%
$223.3
5.2%
$190.3
$ in billions |
 8
4Q11 Earnings
Conference Call
Taxable-equivalent basis
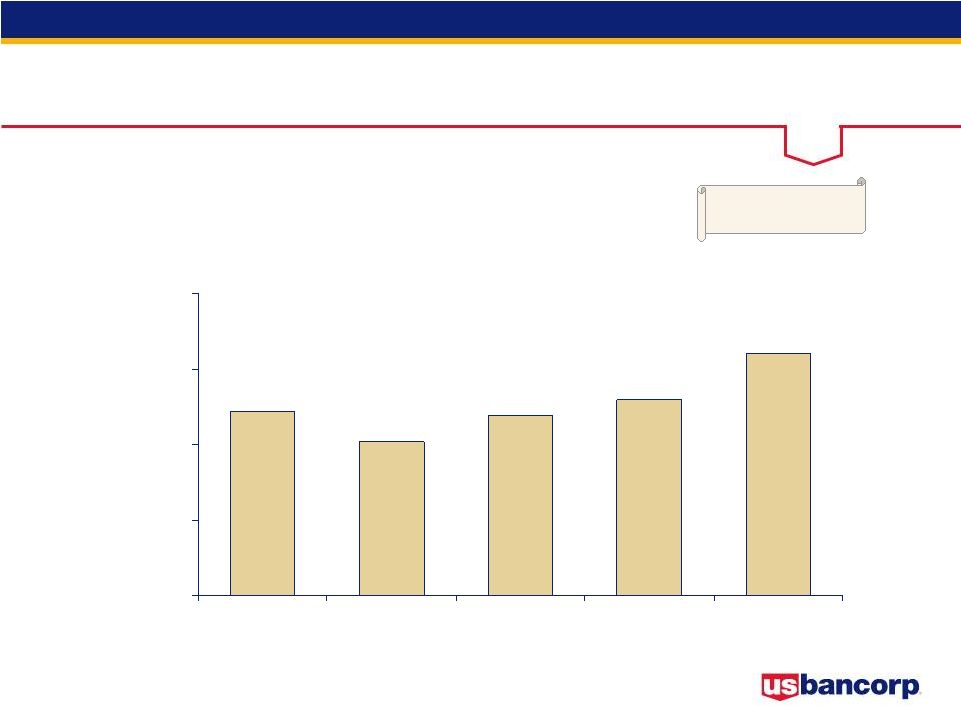
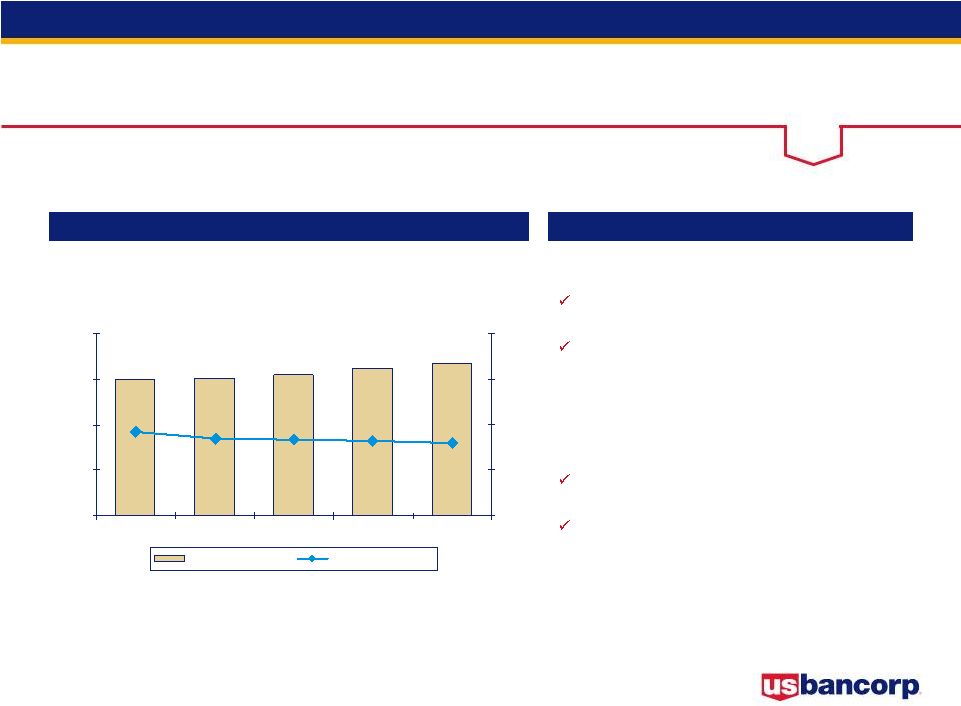
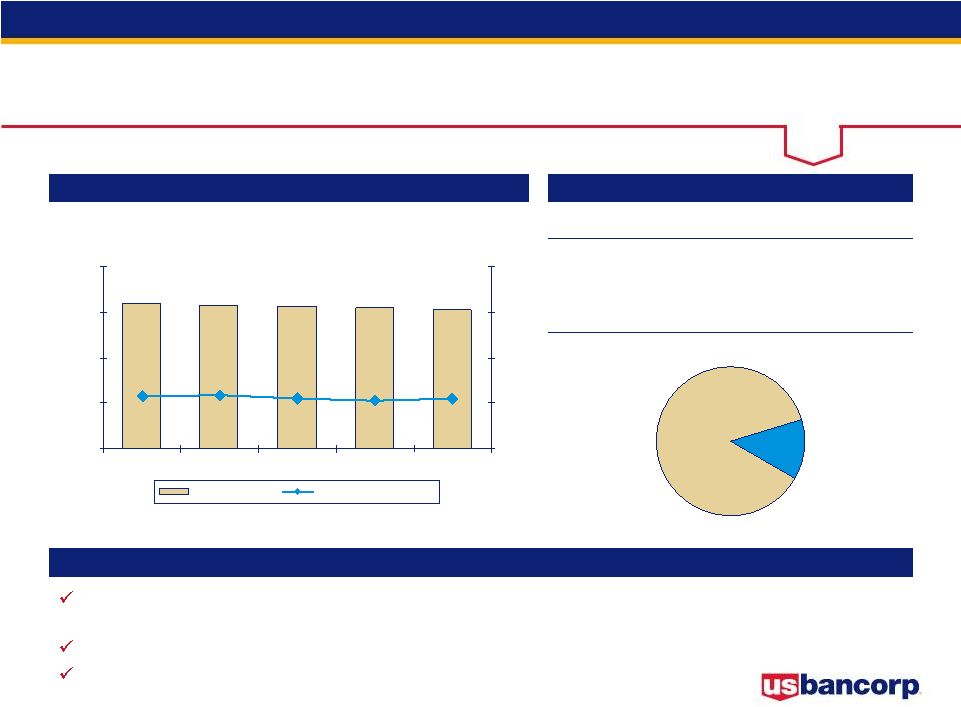
Revenue Growth
Year-Over-Year Growth
7.9%
4.6%
3.8%
4.5%
8.1%
$ in millions
4,721
4,519
4,690
4,795
5,104
3,500
4,000
4,500
5,000
5,500
4Q10
1Q11
2Q11
3Q11
4Q11
USB Record
Revenue 4Q11 |
 9
4Q11 Earnings
Conference Call
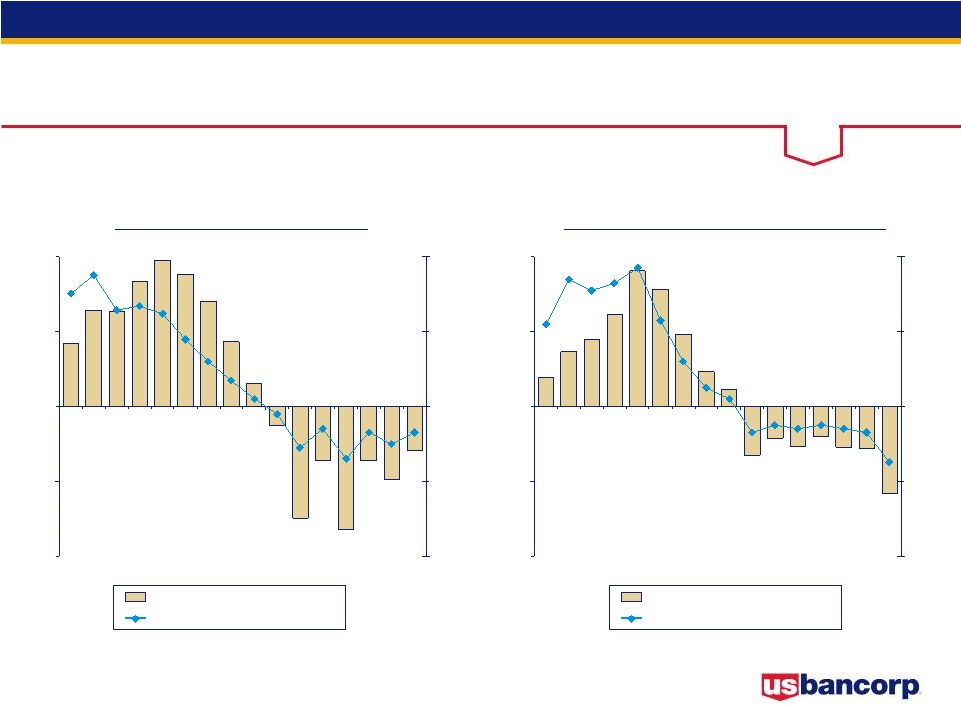
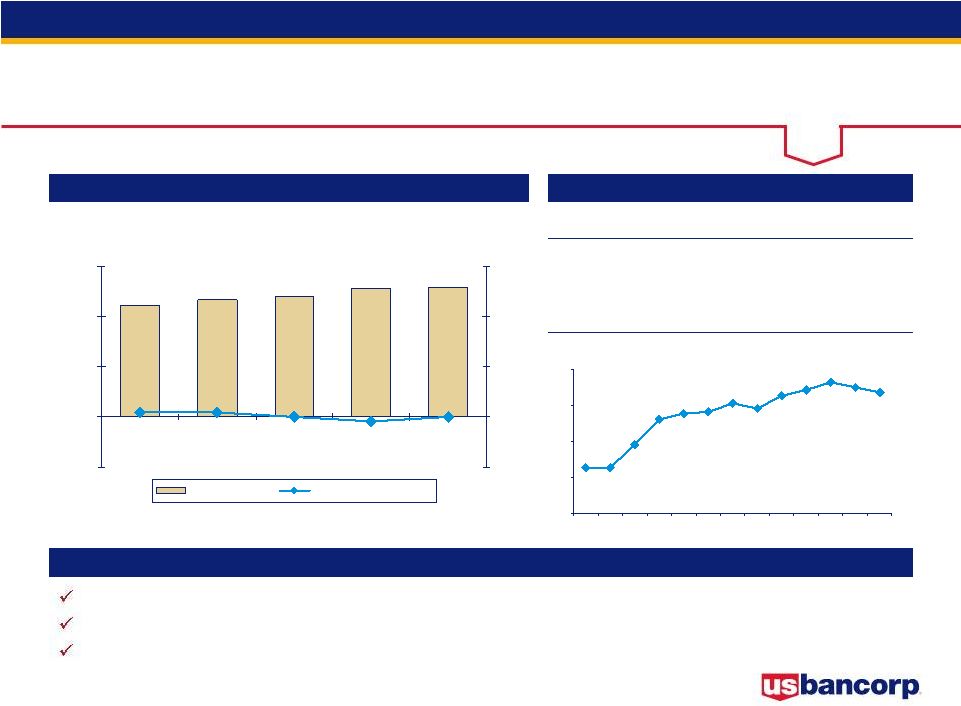
Credit Quality
-15%
-7%
-6%
22%
34%
31%
33%
37%
23%
12%
5%
2%
-7%
-5%
-6%
-5%
-800
-400
0
400
800
1Q08
2Q08
3Q08
4Q08
1Q09
2Q09
3Q09
4Q09
1Q10
2Q10
3Q10
4Q10
1Q11
2Q11
3Q11
4Q11
-40%
-20%
0%
20%
40%
-7%
-10%
-7%
-14%
-6%
-11%
-2%
2%
7%
12%
18%
25%
27%
26%
35%
30%
-160
-80
0
80
160
1Q08
2Q08
3Q08
4Q08
1Q09
2Q09
3Q09
4Q09
1Q10
2Q10
3Q10
4Q10
1Q11
2Q11
3Q11
4Q11
-40%
-20%
0%
20%
40%
$ in millions, linked quarter change
* Excluding Covered Assets (assets subject to loss sharing agreements with FDIC),
1Q11 change in NPAs excludes FCB acquisition ($287 million) Change in Net
Charge-offs Change in Nonperforming Assets*
NCO $ Change (Left Scale)
NCO % Change (Right Scale)
NPA $ Change (Left Scale)
NPA % Change (Right Scale)
103
68
(21)
25
69
112
141
156
134
102
155
290
91
184
386
626
727
489
357
(261)
(119)
(171)
(58)
(212)
(132)
(159)
(78)
(217)
(58)
(226)
(47)
(462) |
 10
4Q11 Earnings
Conference Call
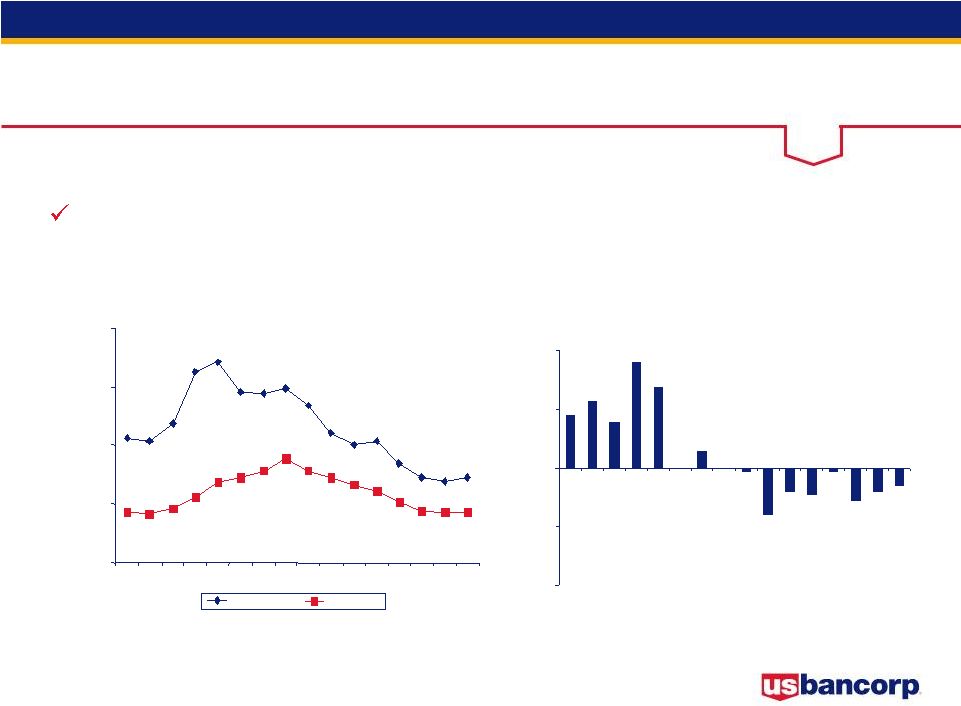
Credit Quality -
Outlook
The Company expects the level of Net Charge-offs to trend modestly
lower and Nonperforming Assets to trend lower during 1Q12
-8%
-9%
-1%
-11%
-8%
-6%
18%
23%
16%
36%
28%
0%
6%
0%
-1%
-16%
-40.0%
-20.0%
0.0%
20.0%
40.0%
1Q08
2Q08
3Q08
4Q08
1Q09
2Q09
3Q09
4Q09
1Q10
2Q10
3Q10
4Q10
1Q11
2Q11
3Q11
4Q11
Delinquencies*
Changes in Criticized Assets*
* Excluding Covered Assets (assets subject to loss sharing agreements with
FDIC) 1Q11 change in criticized assets excludes FCB acquisition
0.73%
0.69%
1.06%1.04%
1.18%
1.62%
1.70%
1.45%
1.44%
1.48%
1.34%
1.11%
1.00%
1.04%
0.84%
0.72%
0.43%
0.43%
0.43%
0.41%
0.46%
0.56%
0.68%
0.72%
0.78%
0.88%
0.78%
0.72%
0.66%
0.61%
0.52%
0.44%
0.0%
0.5%
1.0%
1.5%
2.0%
1Q08
2Q08
3Q08
4Q08
1Q09
2Q09
3Q09
4Q09
1Q10
2Q10
3Q10
4Q10
1Q11
2Q11
3Q11
4Q11
30 to 89 days
90+ days |
 11
4Q11 Earnings
Conference Call
FY
FY
4Q11
3Q11
4Q10
vs 3Q11
vs 4Q10
2011
2010
% B/(W)
Net Interest Income
2,673
$
2,624
$
2,499
$
1.9
7.0
10,348
$
9,788
$
5.7
Noninterest Income
2,431
2,171
2,222
12.0
9.4
8,760
8,360
4.8
Total Revenue
5,104
4,795
4,721
6.4
8.1
19,108
18,148
5.3
Noninterest Expense
2,696
2,476
2,485
(8.9)
(8.5)
9,911
9,383
(5.6)
Operating Income
2,408
2,319
2,236
3.8
7.7
9,197
8,765
4.9
Net Charge-offs
622
669
937
7.0
33.6
2,843
4,181
32.0
Excess Provision
(125)
(150)
(25)
--
--
(500)
175
--
Income before Taxes
1,911
1,800
1,324
6.2
44.3
6,854
4,409
55.5
Applicable Income Taxes
583
548
368
(6.4)
(58.4)
2,066
1,144
(80.6)
Noncontrolling Interests
22
21
18
4.8
22.2
84
52
61.5
Net Income
1,350
1,273
974
6.0
38.6
4,872
3,317
46.9
Preferred Dividends/Other
36
36
23
-
(56.5)
151
(15)
--
NI to Common
1,314
$
1,237
$
951
$
6.2
38.2
4,721
$
3,332
$
41.7
Diluted EPS
0.69
$
0.64
$
0.49
$
7.8
40.8
2.46
$
1.73
$
42.2
Average Diluted Shares
1,911
1,922
1,922
0.6
0.6
1,923
1,921
(0.1)
% B/(W)
Earnings Summary
$ in millions, except per-share data
Taxable-equivalent basis |
 12
4Q11 Earnings
Conference Call
4Q11 Results -
Key Drivers
vs. 4Q10
Net Revenue growth of 8.1% (4.7% excluding notable items)
•
Net
interest
income
growth
of
7.0%;
net
interest
margin
of
3.60%
vs.
3.83%
•
Noninterest income growth of 9.4% (2.1% excluding notable items)
Noninterest expense growth of 8.5% (3.3% excluding notable items)
Provision for credit losses lower by $415 million
•
Net charge-offs lower by $315 million
•
Provision lower than NCOs by $125 million vs. provision lower than NCOs by $25
million in 4Q10 vs. 3Q11
Net Revenue growth of 6.4% (1.0% excluding notable items)
•
Net
interest
income
growth
of
1.9%;
net
interest
margin
of
3.60%
vs.
3.65%
•
Noninterest income growth of 12.0% (-0.1% excluding notable items)
Noninterest expense growth of 8.9% (3.6% excluding notable items)
Provision for credit losses lower by $22 million
•
Net charge-offs lower by $47 million
•
Provision lower than NCOs by $125 million vs. provision lower than NCOs by $150
million in 3Q11 |
 13
4Q11 Earnings
Conference Call
FY
FY
4Q11
3Q11
4Q10
2011
2010
Revenue Items
Securities gains (losses), net
(9)
$
(9)
$
(14)
$
(31)
$
(78)
$
Merchant processing agreement settlement
263
-
-
263
-
Gain related to FCB acquisition
-
-
-
46
-
Nuveen transaction
-
-
103
-
103
Expense Items
Mortgage servicing matters
130
-
-
130
-
ITS transaction debt extinguishment and expense
-
-
-
-
18
Incremental Provision
(125)
(150)
(25)
(500)
175
ITS transaction equity impact (net of tax)*
-
-
-
-
118
Notable Items
$ in millions
* Not a component of net income, but does impact net income applicable to U.S.
Bancorp common shareholders and earnings per diluted common share
|
 14
4Q11 Earnings
Conference Call
Net Interest Income
2,499
2,507
2,544
2,624
2,673
3.83%
3.69%
3.67%
3.65%
3.60%
1,000
1,500
2,000
2,500
3,000
4Q10
1Q11
2Q11
3Q11
4Q11
2.0%
3.0%
4.0%
5.0%
6.0%
Net Interest Income
Net Interest Margin
Net Interest Income
Key Points
$ in millions
Taxable-equivalent basis
vs. 4Q10
Average earning assets grew by $35.3 billion,
or 13.6% (13.1% excluding acquisitions)
Net interest margin lower by 23 bp (3.60% vs.
3.83%) driven by:
•
Higher balances in lower yielding investment
securities
•
Higher cash position at the Federal Reserve
vs. 3Q11
Average earning assets grew by $8.8 billion,
or 3.1%
Net interest margin lower by 5 bp (3.60% vs.
3.65%) driven by:
•
Higher balances in lower yielding investment
securities
Year-Over-Year Growth
5.9%
4.3%
5.6%
5.9%
7.0% |
 15
4Q11 Earnings
Conference Call
Covered
Commercial
CRE
Res Mtg
Retail
Credit Card
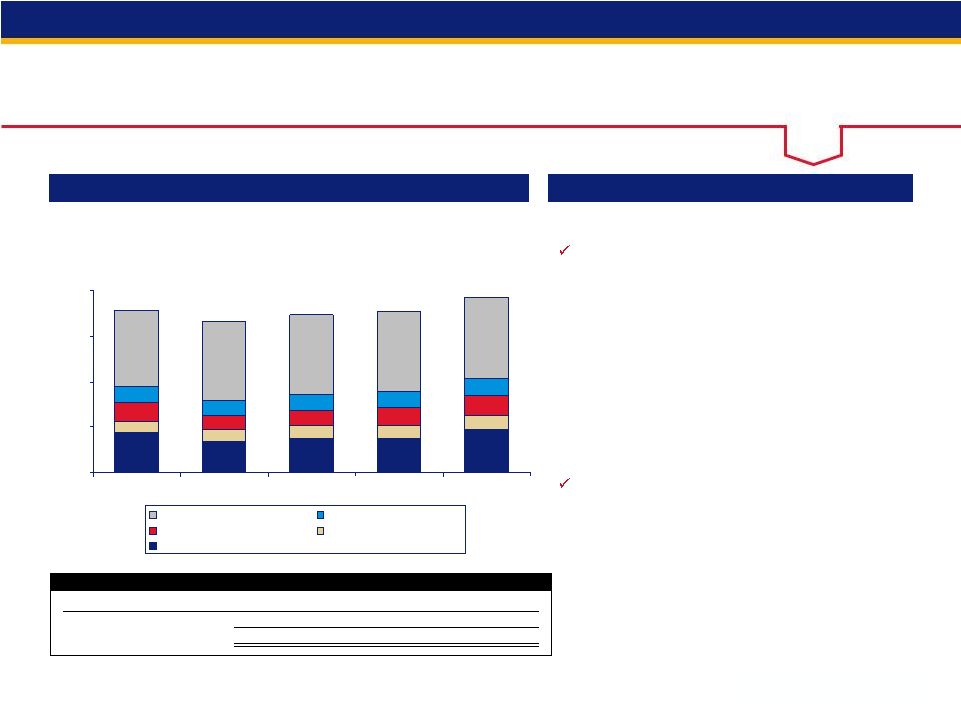
Average Loans
15.8%
11.9%
8.0%
3.0%
(4.5%)
3.5%
4.0%
3.9%
3.0%
1.6%
22.2%
22.0%
22.0%
20.3%
15.8%
(0.8%)
(2.7%)
(2.7%)
(1.5%)
0.0%
(0.5%)
1.1%
1.9%
1.9%
3.1%
0
60
120
180
240
4Q10
1Q11
2Q11
3Q11
4Q11
Average Loans
Key Points
$ in billions
Year-Over-Year Growth
2.0%
2.4%
4.0%
5.0%
5.9%
$202.2
$207.0
$195.5
$197.6
$198.8
Retail
Res Mtg
Covered
CRE
Commercial
vs. 4Q10
Average total loans grew by $11.5 billion, or
5.9% (5.5% excluding acquisitions)
Average total loans, excluding covered loans,
were higher by 8.5%
Average commercial loans increased $7.6 billion,
or 15.8% (15.6% excluding acquisitions)
vs. 3Q11
Average total loans grew by $4.8 billion, or 2.4%
Average total loans, excluding covered loans,
were higher by 3.0%
Average commercial loans grew by $2.9 billion,
or 5.6%
Credit Card |
 16
4Q11 Earnings
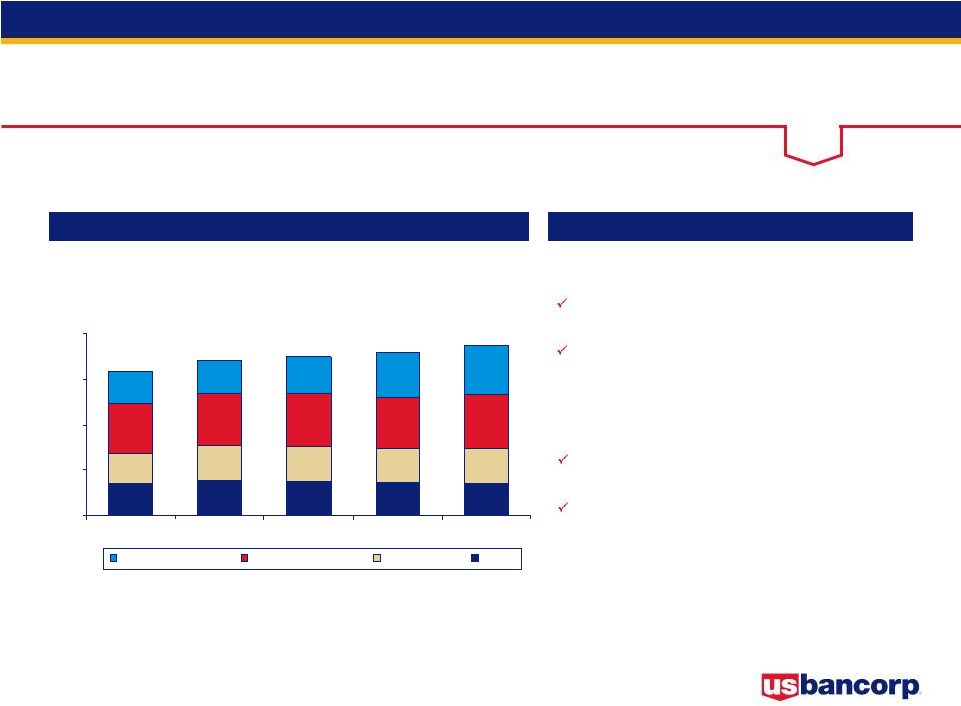
Conference Call
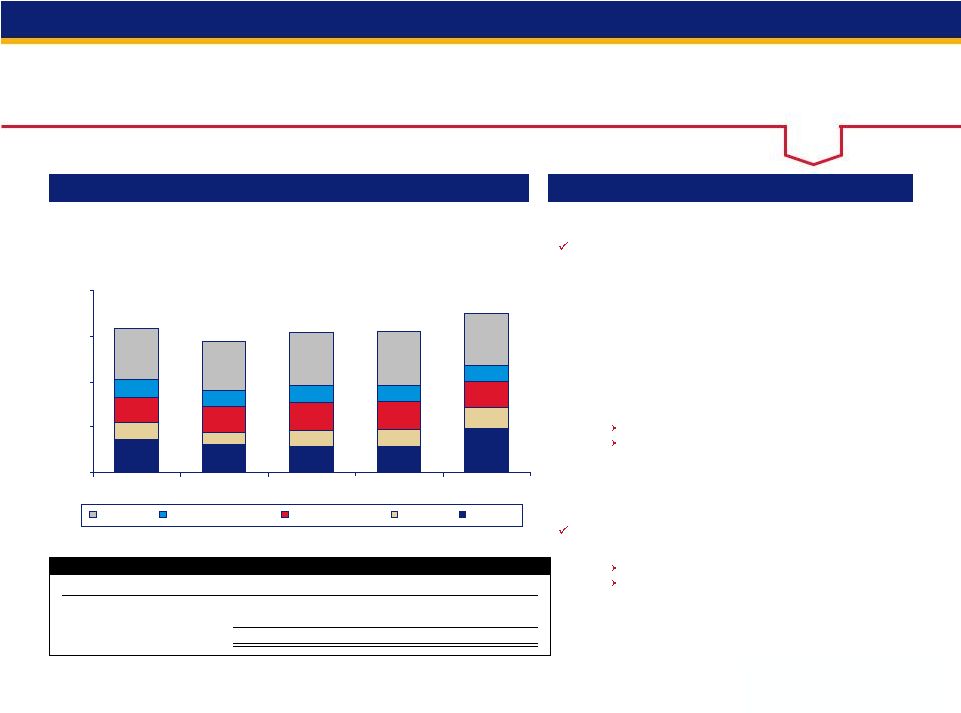
Average Deposits
0.3%
1.0%
5.1%
1.9%
(7.4%)
14.2%
17.4%
11.8%
11.6%
2.9%
10.1%
11.0%
17.3%
17.2%
17.5%
48.2%
47.5%
22.1%
16.3%
4.8%
0
60
120
180
240
4Q10
1Q11
2Q11
3Q11
4Q11
Average Deposits
Key Points
$ in billions
Year-Over-Year Growth
5.2%
11.9%
14.2%
17.9%
17.3%
$215.4
$223.3
$190.3
$204.3
$209.4
Noninterest
-bearing
Checking
& Savings
Time
Money
Market
vs. 4Q10
Average total deposits increased by $33.0
billion, or 17.3% (11.7% excluding acquisitions)
Average low cost deposits (NIB, interest
checking, money market and savings),
increased by $32.9 billion, or 22.2% (16.1%
excluding acquisitions)
vs. 3Q11
Average total deposits increased by $7.9
billion, or 3.7%
Average low cost deposits increased by $9.5
billion, or 5.5%
Time
Money Market
Checking & Savings
Noninterest-bearing |
 17
4Q11 Earnings
Conference Call
32.8%
21.2%
8.4%
(13.1%)
(1.1%)
0
700
1400
2100
2800
4Q10
1Q11
2Q11
3Q11
4Q11
4Q10
1Q11
2Q11
3Q11
4Q11
Valuation losses
(14)
$
(5)
$
(8)
$
(9)
$
(9)
$
Other non-operating gains
103
46
-
-
263
Total
89
$
41
$
(8)
$
(9)
$
254
$
Notable Noninterest Income Items
All Other
Mortgage
Service Charges
Trust and Inv Mgmt
Payments
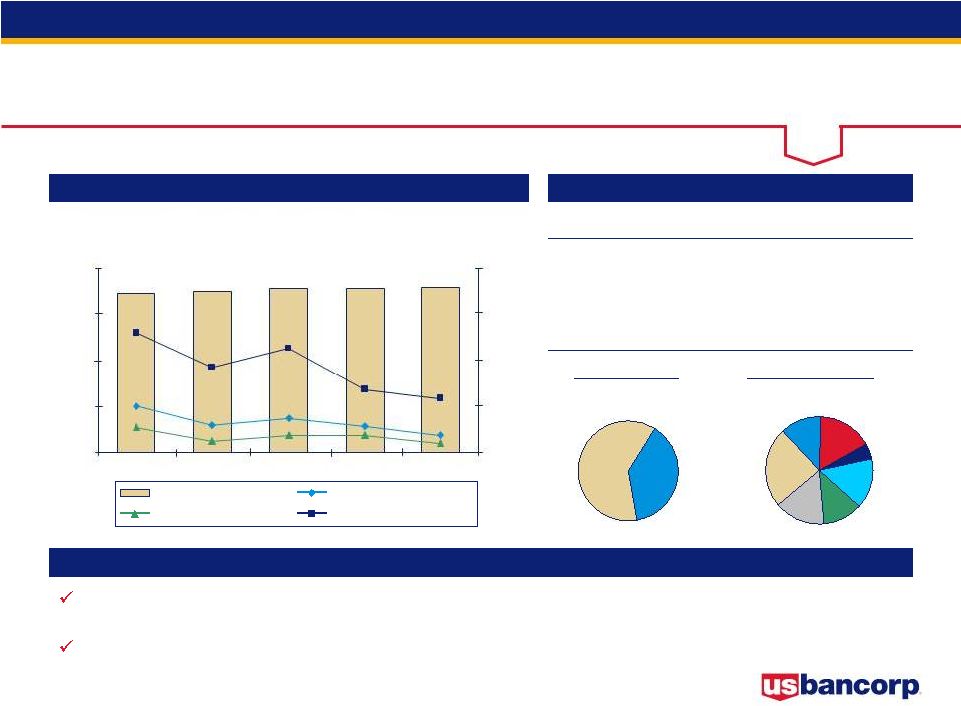
Noninterest Income
Noninterest Income
Key Points
$ in millions
Year-Over-Year Growth
10.2%
4.9%
1.7%
2.9%
9.4%
$2,146
$2,431
$2,171
$2,222
$2,012
Trust and
Inv Mgmt
Service
Charges
All Other
Mortgage
Payments
Payments = credit and debit card revenue, corporate payment products revenue and
merchant processing services; Service charges = deposit service charges,
treasury management fees and ATM processing services vs. 4Q10
Noninterest income grew by $209 million, or 9.4%, driven by:
•
Deposit service charges (18.8% growth)
•
Merchant processing services (17.0% growth)
•
Commercial products revenue (5.8% growth)
•
Lower credit and debit card revenue (21.2% decline) due to
the impact of legislative changes to debit interchange fees
•
Lower trust and investment mgmt fees (13.1% decline)
primarily due to the sale of the long-term asset mgmt
business (4Q10) and money market account fee waivers
•
Mortgage banking revenue increase of $53 million
$43 million increase in origination and sales revenue
Unfavorable net change in MSR valuation and related hedging
(hedge $33 4Q11 vs. $41 4Q10)
•
Merchant settlement gain ($263 million) partially offset by
Nuveen gain ($103 million 4Q10)
vs. 3Q11
Noninterest income grew by $260 million, or 12.0%, driven by:
•
Mortgage banking revenue increase of $58 million
$58 million increase in origination and sales revenue
Favorable net change in MSR valuation and related hedging
(hedge $33 4Q11 vs. $7 3Q11)
•
Merchant processing services (11.8% growth)
•
Lower credit and debit card revenue (20.1% decline)
•
Lower corporate payment products revenue (15.8%
decline) and deposit service charges (6.6% decline), both
primarily due to seasonality and lower transaction volumes
•
Merchant settlement gain ($263 million) |
 18
4Q11 Earnings
Conference Call
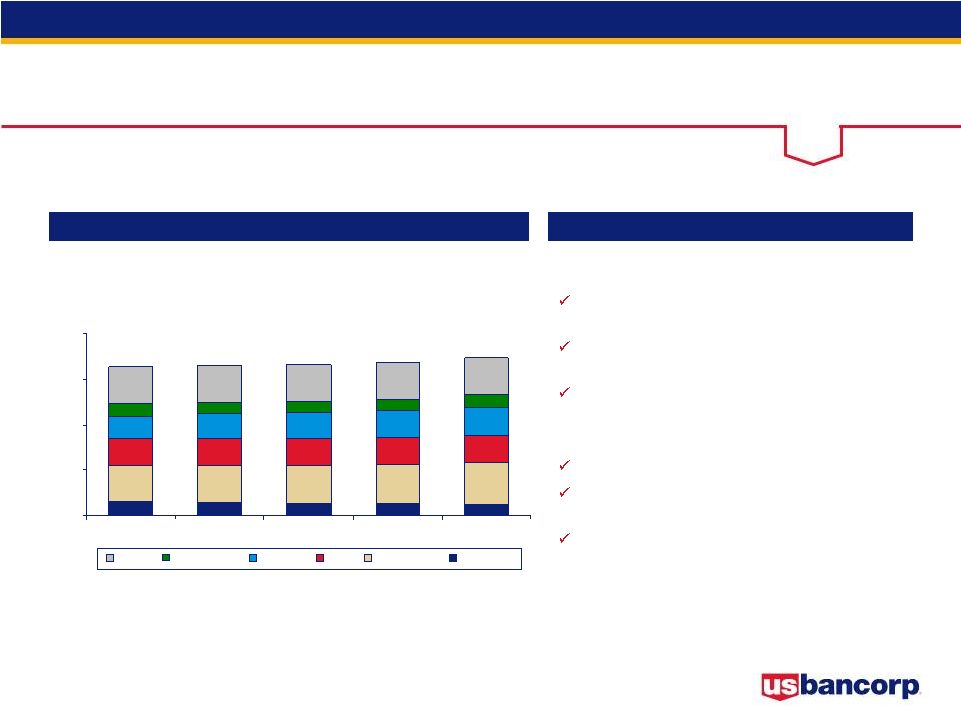
Noninterest Expense
10.3%
4.3%
13.9%
5.1%
7.6%
0
700
1400
2100
2800
4Q10
1Q11
2Q11
3Q11
4Q11
Noninterest Expense
Key Points
$ in millions
Year-Over-Year Growth
11.5%
8.3%
2.0%
3.8%
8.5%
$2,425
$2,476
$2,696
$2,485
$2,314
Occupancy
and Equipment
Prof Services,
Marketing
and PPS
All Other
Tech and Comm
Compensation
and Benefits
vs. 4Q10
Noninterest expense was higher by $211 million,
or 8.5%, driven by:
•
Increased compensation (5.8%) and employee
benefits (18.1%)
•
Increase in net occupancy and equipment (5.1%) related
to business expansion and technology initiatives
•
Increase in professional services (35.1%) due to
mortgage servicing-related projects
•
Other expense higher primarily due to an accrual for
mortgage servicing matters ($130 million), partially
offset by lower costs related to insurance and litigation
vs. 3Q11
Noninterest expense was higher by $220 million,
or 8.9%, driven by:
•
Higher compensation (3.5%) principally due to additions
to staff and higher incentives
•
Increase in professional services (31.0%) due to
mortgage servicing-related projects and seasonally
higher expenses and increase in marketing and
business development expenses (9.8%) due to an
increase in the contribution to the Company’s charitable
foundation
•
Other expense higher principally due to an accrual for
mortgage servicing matters
All Other
Tech and Communications
Prof Svcs, Marketing and PPS
Occupancy and Equipment
Compensation and Benefits
4Q10
1Q11
2Q11
3Q11
4Q11
Mortgage servicing matters
-
$
-
$
-
$
-
$
130
$
Total
-
$
-
$
-
$
-
$
130
$
Notable Noninterest Expense Items |
 19
4Q11 Earnings
Conference Call
Mortgage Repurchase
Mortgages Repurchased and Make-whole Payments
Mortgage Representation and Warranties Reserve
$ in millions
4Q11
3Q11
2Q11
1Q11
4Q10
Beginning Reserve
$162
$173
$181
$180
$147
Net Realized Losses
(31)
(31)
(43)
(32)
(27)
Additions to Reserve
29
20
35
33
60
Ending Reserve
$160
$162
$173
$181
$180
Mortgages
repurchased
and make-whole
payments
$61
$57
$72
$90
$69
Repurchase activity lower than
peers due to:
•
Conservative credit and
underwriting culture
•
Disciplined origination process -
primarily conforming loans
(
95% sold to GSEs)
Do not participate in private
placement securitization market
Outstanding repurchase and
make-whole requests balance
= $105 million
Repurchase requests expected to
remain relatively stable over next
few quarters |
 20
4Q11 Earnings
Conference Call
Positioned to Win |
 21
4Q11 Earnings
Conference Call
Appendix |
 22
4Q11 Earnings
Conference Call
Credit Quality
-
Commercial Loans
41,700
42,683
44,135
46,484
49,437
1.11%
1.19%
0.75%
0.77%
0.41%
0
15,000
30,000
45,000
60,000
4Q10
1Q11
2Q11
3Q11
4Q11
0.0%
1.5%
3.0%
4.5%
6.0%
Average Loans
Net Charge-offs Ratio
Average Loans and Net Charge-offs Ratios
Key Statistics
Comments
Nonperforming loans continued to improve year-over-year and on a linked
quarter basis while delinquencies have remained stable
year-over-year Net charge-offs improved significantly from the
prior quarter Loan balances and commitments showed strong growth;
utilization rates remain historically low
4Q10
3Q11
4Q11
Average Loans
41,700
46,484
49,437
30-89 Delinquencies
0.57%
0.34%
0.48%
90+ Delinquencies
0.15%
0.09%
0.09%
Nonperforming Loans
1.23%
0.71%
0.55%
20%
25%
30%
35%
40%
4Q08
1Q09
2Q09
3Q09
4Q09
1Q10
2Q10
3Q10
4Q10
1Q11
2Q11
3Q11
4Q11
Revolving Line Utilization Trend
$ in millions |
 23
4Q11 Earnings
Conference Call
Credit Quality
-
Commercial Leases
6,012
6,030
5,919
5,860
5,834
1.12%
0.94%
0.88%
0.61%
1.43%
0
2,000
4,000
6,000
8,000
4Q10
1Q11
2Q11
3Q11
4Q11
0.0%
1.5%
3.0%
4.5%
6.0%
Average Loans
Net Charge-offs Ratio
Average Loans and Net Charge-offs Ratios
Key Statistics
Comments
Net charge-offs increased this quarter primarily due to a single transaction,
but overall credit quality continued to improve as nonperforming loans
declined on a linked quarter and year-over- year basis
4Q10
3Q11
4Q11
Average Loans
6,012
5,860
5,834
30-89 Delinquencies
1.34%
0.93%
0.96%
90+ Delinquencies
0.02%
0.02%
0.00%
Nonperforming Loans
1.27%
0.68%
0.54%
$ in millions
Equipment
Finance
$2,385
Small Ticket
$3,449 |
 24
4Q11 Earnings
Conference Call
Credit Quality
-
Commercial Real Estate
Average Loans and Net Charge-offs Ratios
Key Statistics
Comments
Net charge-offs and nonperforming loans decreased on a linked quarter and on a
year-over-year basis
Delinquencies in all categories decreased on a linked quarter basis
4Q10
3Q11
4Q11
Average Loans
34,577
35,569
35,802
30-89 Delinquencies
1.20%
0.44%
0.38%
90+ Delinquencies
0.00%
0.08%
0.04%
Nonperforming Loans
3.73%
3.43%
2.51%
Performing TDRs*
15
459
537
$ in millions
Multi-family
$1,540
Other
$981
Office
$756
A&D
Construction
$958
Retail
$814
Condo
Construction
$301
Residential
Construction
$1,049
Investor
$18,120
Owner
Occupied
$11,283
CRE Mortgage
CRE Construction
Average Loans
Net Charge-offs Ratio
NCO Ratio -
Comm Mtg
NCO Ratio -
Construction
* TDR = troubled debt restructuring, 3Q11 increase principally due to the impact of
new accounting guidance adopted in that quarter (FASB Accounting Standards
Update No. 2011-02) 34,577
35,179
35,499
35,569
35,802
2.51%
1.44%
1.85%
1.39%
0.93%
0.50%
0.93%
0.90%
0.59%
1.33%
2.91%
3.43%
5.67%
4.61%
6.54%
4Q10
1Q11
2Q11
3Q11
4Q11
0.0%
2.5%
5.0%
7.5%
10.0%
0
10,000
20,000
30,000
40,000 |
 25
4Q11 Earnings
Conference Call
2,002
1,938
1,939
1,890
1,804
0
1,000
2,000
3,000
4,000
4Q10
1Q11
2Q11
3Q11
4Q11
Credit Quality
-
Residential Mortgage
29,659
31,777
32,734
34,026
36,256
1.75%
1.65%
1.46%
1.42%
1.30%
0
10,000
20,000
30,000
40,000
4Q10
1Q11
2Q11
3Q11
4Q11
0.0%
1.5%
3.0%
4.5%
6.0%
Average Loans
Net Charge-offs Ratio
Average Loans and Net Charge-offs Ratios
Key Statistics
Comments
Strong growth in high quality originations (weighted average FICO 761, weighted
average LTV 67%) as average loans increased 6.6% over 3Q11, driven by demand
for refinancing Continued to help home owners by successfully modifying 3,618
loans (owned and serviced) in 4Q11, representing $619 million in
balances Nonperforming loans and delinquencies continue to improve
4Q10
3Q11
4Q11
Average Loans
29,659
34,026
36,256
30-89 Delinquencies
1.48%
1.09%
1.09%
90+ Delinquencies
1.63%
1.03%
0.98%
Nonperforming Loans
2.07%
1.85%
1.75%
Residential Mortgage
Performing TDRs
$ in millions
* Excludes GNMA loans, whose repayments are insured by the Federal Housing
Administration or guaranteed by the Department of Veteran Affairs ($1,265
million 4Q11) * |
 26
4Q11 Earnings
Conference Call
4Q10
3Q11
4Q11
Average Loans
16,403
16,057
16,271
30-89 Delinquencies
1.60%
1.38%
1.37%
90+ Delinquencies
1.86%
1.28%
1.36%
Nonperforming Loans
1.36%
1.53%
1.29%
Credit Quality -
Credit Card
16,403
16,124
15,884
16,057
16,271
6.65%
6.21%
5.45%
4.40%
4.71%
4.88%
4.54%
5.62%
6.45%
7.21%
0
5,000
10,000
15,000
20,000
4Q10
1Q11
2Q11
3Q11
4Q11
0.0%
4.0%
8.0%
12.0%
16.0%
Average Loans and Net Charge-offs Ratios
Key Statistics
Comments
4Q11 net charge-offs are 30% lower than 4Q10
Overall delinquencies were relatively flat for the quarter and lower
year-over-year Nonperforming loans have improved for two consecutive
quarters and are at their lowest level since 3Q10
$ in millions
* Excluding portfolio purchases where the acquired loans were recorded at fair
value at the purchase date Average Loans
Net Charge-offs Ratio
Net Charge-offs Ratio Excluding Acquired Portfolios*
Core Portfolio
$15,678
Portfolios Acquired
at Fair Value
$593 |
 27
4Q11 Earnings
Conference Call
Credit Quality -
Home Equity
19,119
18,801
18,634
18,510
18,281
1.67%
1.59%
1.64%
1.75%
1.72%
0
6,000
12,000
18,000
24,000
4Q10
1Q11
2Q11
3Q11
4Q11
0.0%
1.5%
3.0%
4.5%
6.0%
Average Loans
Net Charge-offs Ratio
Average Loans and Net Charge-offs Ratios
Key Statistics
Comments
Strong credit quality portfolio (weighted average FICO 747, weighted average CLTV
73%) originated primarily through the retail branch network to existing bank
customers on their primary residence Early and late stage delinquencies
improved year-over-year Net charge-offs modestly increased which
is within seasonal expectations 4Q10
3Q11
4Q11
Average Loans
19,119
18,510
18,281
30-89 Delinquencies
0.93%
0.83%
0.90%
90+ Delinquencies
0.78%
0.67%
0.73%
Nonperforming Loans
0.19%
0.19%
0.22%
Consumer Finance: 13%
Wtd Avg LTV: 82%
NCO: 4.13%
$ in millions
Traditional: 87%
Wtd Avg LTV: 71%
NCO: 1.30% |
 28
4Q11 Earnings
Conference Call
Credit Quality -
Retail Leasing
Average Loans and Net Charge-offs Ratios
Key Statistics
Comments
Average loans continued to increase as demand for new auto leases remained
strong Retail leasing delinquencies have stabilized at very low levels
Strong used auto values continue to contribute to historically low net
charge-offs 4Q10
3Q11
4Q11
Average Loans
4,459
5,097
5,150
30-89 Delinquencies
0.37%
0.19%
0.19%
90+ Delinquencies
0.05%
0.02%
0.02%
Nonperforming Loans
--%
--%
--%
$ in millions
90
100
110
120
130
4Q08
1Q09
2Q09
3Q09
4Q09
1Q10
2Q10
3Q10
4Q10
1Q11
2Q11
3Q11
4Q11
Manheim Used Vehicle Value Index*
* Manheim Used Vehicle Value Index source: www.manheimconsulting.com, January 1995 = 100, quarter
value = average monthly ending value 4,459
4,647
4,808
5,097
5,150
0.09%
0.09%
0.00%
-0.08%
0.00%
4Q10
1Q11
2Q11
3Q11
4Q11
-1.0%
0.0%
1.0%
2.0%
3.0%
Average Loans
Net Charge-offs Ratio
0
2,000
4,000
6,000 |
 29
4Q11 Earnings
Conference Call
Credit Quality -
Other Retail
24,983
24,691
24,498
24,773
24,901
1.45%
1.33%
1.16%
1.11%
1.19%
0
7,000
14,000
21,000
28,000
4Q10
1Q11
2Q11
3Q11
4Q11
0.0%
1.5%
3.0%
4.5%
6.0%
Average Loans
Net Charge-offs Ratio
Average Loans and Net Charge-offs Ratios
Key Statistics
Comments
Average balances modestly increased during the quarter
Both early and late state delinquency performance remain stable
Net charge-offs and nonperforming loans remain stable
4Q10
3Q11
4Q11
Average Loans
24,983
24,773
24,901
30-89 Delinquencies
0.85%
0.67%
0.68%
90+ Delinquencies
0.26%
0.20%
0.20%
Nonperforming Loans
0.12%
0.12%
0.11%
Installment
$5,369
Auto Loans
$11,485
Revolving
Credit
$3,331
Student
Lending
$4,716
$ in millions |
 30
4Q11 Earnings
Conference Call
$ in millions
4Q11
3Q11
2Q11
1Q11
4Q10
Total equity
34,971
$
34,210
$
33,341
$
31,335
$
30,322
$
Preferred stock
(2,606)
(2,606)
(2,606)
(1,930)
(1,930)
Noncontrolling interests
(993)
(980)
(889)
(828)
(803)
Goodwill (net of deferred tax liability)
(8,239)
(8,265)
(8,300)
(8,317)
(8,337)
Intangible assets (exclude mortgage servicing rights)
(1,217)
(1,209)
(1,277)
(1,342)
(1,376)
Tangible common equity (a)
21,916
21,150
20,269
18,918
17,876
Tier 1 Capital, determined in accordance with prescribed
regulatory requirements using Basel I definition
29,173
28,081
27,795
26,821
25,947
Trust preferred securities
(2,675)
(2,675)
(3,267)
(3,949)
(3,949)
Preferred stock
(2,606)
(2,606)
(2,606)
(1,930)
(1,930)
Noncontrolling interests, less preferred stock not eligible for Tier I
capital (687)
(695)
(695)
(694)
(692)
Tier 1 common equity using Basel I definition (b)
23,205
22,105
21,227
20,248
19,376
Tier 1 capital, determined in accordance with prescribed
regulatory requirements using anticipated Basel III definition
25,639
24,902
23,931
21,855
20,854
Preferred stock
(2,606)
(2,606)
(2,606)
(1,930)
(1,930)
Noncontrolling interests of real estate investment trusts
(667)
(667)
(667)
(667)
(667)
Tier 1 common equity using anticipated Basel III definition
(c) 22,366
21,629
20,658
19,258
18,257
Total assets
340,122
330,141
320,874
311,462
307,786
Goodwill (net of deferred tax liability)
(8,239)
(8,265)
(8,300)
(8,317)
(8,337)
Intangible assets (exclude mortgage servicing rights)
(1,217)
(1,209)
(1,277)
(1,342)
(1,376)
Tangible assets (d)
330,666
320,667
311,297
301,803
298,073
Risk-weighted assets, determined in accordance
with prescribed regulatory requirements using Basel I definition (e)
271,333
261,115
252,882
247,486
247,619
Risk-weighted assets using anticipated Basel III definitions (f)
274,351
264,103
256,205
250,931
251,704
Ratios
Tangible common equity to tangible assets (a)/(d)
6.6%
6.6%
6.5%
6.3%
6.0%
Tier 1 common equity to risk-weighted assets using Basel I definition
(b)/(e) 8.6%
8.5%
8.4%
8.2%
7.8%
Tier 1 common equity to risk-weighted assets using anticipated Basel III
definition (c)/(f) 8.2%
8.2%
8.1%
7.7%
7.3%
Tangible common equity to risk-weighted assets (a)/(e)
8.1%
8.1%
8.0%
7.6%
7.2%
4Q11 risk-weighted assets are preliminary data, subject to change prior to
filings with applicable regulatory agencies Anticipated Basel III definitions
reflect adjustments for changes to the related elements as proposed in December 2010 by regulatory agencies
Non-Regulatory Capital Ratios |
 U.S.
Bancorp 4Q11 Earnings
Conference Call
U.S. Bancorp
4Q11 Earnings
Conference Call
January 18, 2012 |