Attached files
| file | filename |
|---|---|
| 8-K - FORM 8-K - NOVANTA INC | d280204d8k.htm |
 CJS
Securities 2012 Investor Conference CJS Securities 2012 Investor
Conference “New Ideas for the New Year”
“New Ideas for the New Year”
January 11, 2012
January 11, 2012
Exhibit 99.1
Exhibit 99.1 |
 2
Factors affecting future performance…
Factors affecting future performance…
…and use of Non-GAAP financial measures
…and use of Non-GAAP financial measures
Forward-Looking
Statements
The statements in this presentation that relate to guidance, future plans, business
opportunities, events or performance are forward-looking statements that
involve risks and uncertainties, including risks associated with business and
economic conditions, customer and/or supplier contract cancellations, manufacturing
risks, competitive factors, ability to successfully introduce new products,
uncertainties pertaining to customer orders, demand for products and services,
growth and development of markets for the Company's products
and
services,
and
other
risks
identified
in
our
filings
made
with
the
Securities
and
Exchange
Commission, including, most recently, our Form 10-K for the year ended December
31, 2010. Actual results, events and performance may differ materially.
Readers are cautioned not to place undue reliance on these forward-looking
statements, which speak only as of the date of this presentation, January 11, 2012. The
Company disclaims any obligation to update these forward-looking statements as a
result of developments occurring after the date of this presentation. Readers
are encouraged to refer to the risk disclosures described in the
Company’s Form 10-K for the year ended December 31, 2010 and subsequent filings with
the
SEC,
as
applicable.
Please
see
“Safe
Harbor
and
Forward-Looking
Information”
in
the
Appendix
to
this
presentation for more information.
Non-GAAP
Measurement
The Company’s statements regarding its historical and projected revenues,
adjusted EBITDA, and net debt are
non-GAAP
financial
measures.
Please
see
“Use
of
Non-GAAP
Financial
Measures”
and
the
subsequent
slides in the Appendix to this presentation for the reasons we use these measures, a
reconciliation of these measures
to
the
most
directly
comparable
GAAP
measures
and
other
information
relating
to
these
measures.
The
Company
neither
updates
nor
confirms
any
guidance
regarding
the
operating
results
of
the Company
which may have been given prior to this presentation. |
 We
are a leading supplier… …of precision motion and laser
technology Expertise to Drive Results
Capabilities to Innovate & Grow
Positioned in Growth Segments
Global Presence and Reach
3
Note: Revenue is 2011E, based on financial guidance provided on
November 10, 2011 •
Leading
provider
of
precision
laser,
optical
and
motion
control
technology
and
semiconductor systems
•
•
Founded
Founded
in
in
1968,
1968,
headquartered
headquartered
in
in
Bedford,
Bedford,
MA
MA
-
-
major
major
presence
presence
in
in
North
North
America,
Europe,
and
Asia-Pacific
•
~$365M in revenue, approximately 1600 employees
•
Trade on NASDAQ (GSIG)
Leading Technology Franchises |
 Our
aspirations… …are clear and achievable
Strategic Vision
•
Focus growth efforts on building out
key platforms (organic and M&A)
•
Improve mix (growth, volatility) –
more Medical, less Semiconductor
•
Simplify footprint and infrastructure
A leading provider of precision photonic and
A leading provider of precision photonic and
motion technologies for OEM’s in demanding
motion technologies for OEM’s in demanding
markets –
markets –
delivering attractive shareholder
delivering attractive shareholder
returns through sustained profitable growth
returns through sustained profitable growth
Strategic Priorities
Strategic Priorities
•
Organic growth mid to high
single digits
•
>20% EBITDA margins
•
Long term shareholder returns
above peer average
Performance Goals
Performance Goals
4 |
 We
are on a journey towards our vision… …of being a focused, world
class technology company Revenue
Revenue
Growth
Growth
EBITDA**
EBITDA**
Value Chain
Value Chain
Focus
Focus
Structure
Structure
Mix
Mix
Growth
Growth
Strategy
Strategy
Performance
Performance
Focus
Focus
~$480M*
Low single digit
~$70M
33% systems
67% OEM
<20 distinct P&L’s
>30 sites
>50% Semi
<10% Medical
Unrelated
acquisitions
Maximize margins
Pre 2008
Pre 2008
~$365M
Mid single digit
~$65M
18% systems
72% OEM
3 focused groups
<20 sites
~31% Semi
~31% Semi
~15% Medical
~15% Medical
Build out growth
platforms via focused
R&D and bolt-on M&A
Profit growth
Current
Current
* pro forma Excel Technologies + GSI Group Inc results as reported in GSI Group Inc.
8K filed on 07/18/08 ** adjusted EBITDA, non-GAAP financial metric
5
$500M+
High single digit
$100M+
~100% OEM
2 focused groups
<15 sites
<15% Semi
~40% Medical
Current approach
plus selective
transformative M&A
Sustained
profitability via
revenue growth
Vision |
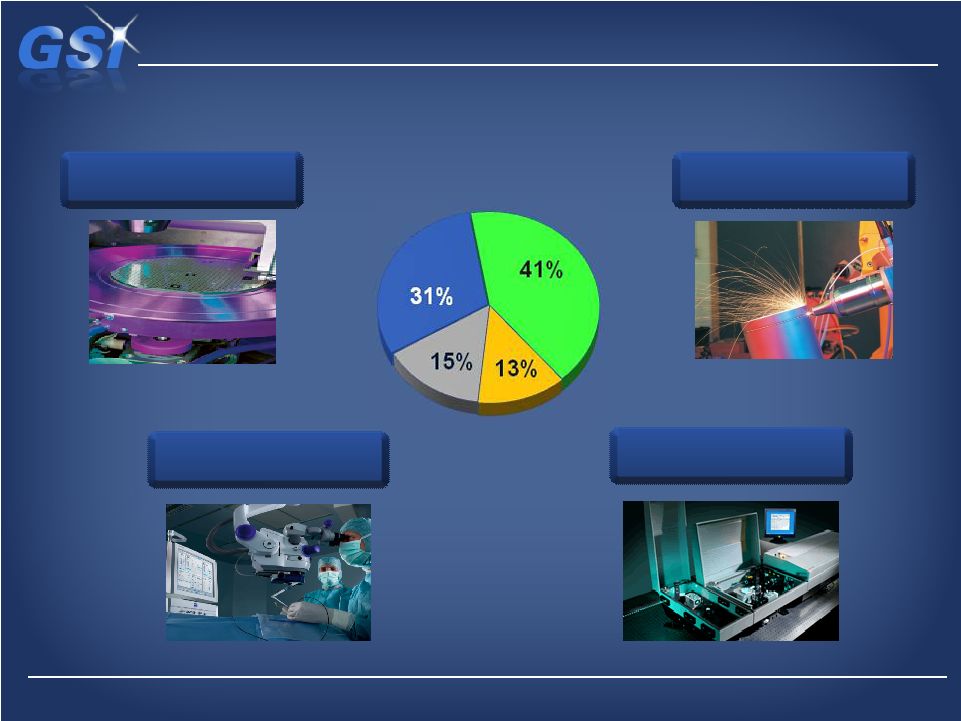
 We
have three businesses… …with Precision Motion contributing the
largest portion Laser
Laser
Products
Products
Semiconductor
Semiconductor
Systems
Systems
Revenue Breakdown
Revenue Breakdown
Precision
Precision
Motion
Motion
6
Note:
Percentages
based
on
3Q
2011
actual
financials |
 We
serve several major markets… …with Medical targeted for growth
End Market Mix
End Market Mix
Semiconductor
Semiconductor
Semiconductor
Medical
Medical
Medical
Industrial
Industrial
Industrial
Scientific
Scientific
Scientific
7
Note: Percentages based on 3Q 2011 actual financials |
 GSI
has a strong global presence… …with
significant
reach
into
the
Pacific
Rim
•
Strong international presence; 66% of revenue from outside U.S.
•
Production sites in the U.S., U.K., Germany and China
Revenue by Geography
Revenue by Geography
FY2010
FY2010
Mukilteo, WA
Mukilteo, WA
Santa Clara, CA
Santa Clara, CA
Oxnard, CA
Oxnard, CA
Chatsworth, CA
Chatsworth, CA
Bedford, MA
Bedford, MA
Lexington, MA
Lexington, MA
East Setauket, NY
East Setauket, NY
Orlando, FL
Orlando, FL
Rugby, UK
Rugby, UK
Poole, UK
Poole, UK
Taunton, UK
Taunton, UK
Suzhou, PRC
Suzhou, PRC
Shanghai, PRC
Shanghai, PRC
Tokyo, Japan
Tokyo, Japan
Seoul, Korea
Seoul, Korea
Taipei, Taiwan
Taipei, Taiwan
Malaysia
Malaysia
Sri Lanka
Sri Lanka
Italy
Italy
France
France
Darmstadt, Germany
Darmstadt, Germany
Ludwigsburg, Germany
Ludwigsburg, Germany
Munich, Germany
Munich, Germany
India
India
Global Presence
Global Presence
8 |
 •
Over 1000 active OEM customers
•
Existing penetration in over 100
major application areas
Our capabilities…
…support our focus on OEM businesses
Our Core Competencies
Our Core Competencies
•
Sub-micron location sensing
•
3-axis scanning within 1 micron
•
Spindles rotating at 250,000 RPM
•
Femtosecond lasers
Precision Technology
Precision Technology
High Quality Production
High Quality Production
OEM Sales Channels
OEM Sales Channels
Collaborative Design
Collaborative Design
•
Designed into state-of-the-art OEM
systems in demanding applications:
-
Robotic surgery
-
DNA sequencing
-
Disk drive track writing
•
ISO 13485 certification (medical device
quality standard)
•
Factories in U.S, UK and China
9 |
 We
have strong franchises… …in the Precision Motion space
Precision Motion Overview
Precision Motion Overview
Brand
Brand
Technology
Technology
Location
Location
Primary
Primary
Applications
Applications
Galvanometers
Galvanometers
Scan Heads
Scan Heads
Lexington, MA
Lexington, MA
Material
Material
Processing
Processing
Marking
Marking
Ophthalmology
Ophthalmology
PCB Drilling
PCB Drilling
Optical Encoders
Optical Encoders
Bedford, MA
Bedford, MA
Robotic Surgery
Robotic Surgery
DNA Sequencing
DNA Sequencing
Wire Bonding
Wire Bonding
Disk Drives
Disk Drives
Air Bearing Spindles
Air Bearing Spindles
Poole, UK
Poole, UK
Suzhou, China
Suzhou, China
PCB Drilling
PCB Drilling
Semiconductor
Semiconductor
Thermal Printers
Thermal Printers
Bedford, MA
Bedford, MA
Patient Monitoring
Patient Monitoring
Defibrillators
Defibrillators
EKG
EKG
LTM* Revenue
LTM* Revenue
~$200M
~$200M
Industrial
Industrial
Scientific
Scientific
Semi
Semi
Medical
Medical
Scanners
Scanners
Encoders
Encoders
Spindles
Spindles
Recorders
Recorders
10
**Last Twelve Months (LTM) is defined as Q4 2010 through Q3 2011
|
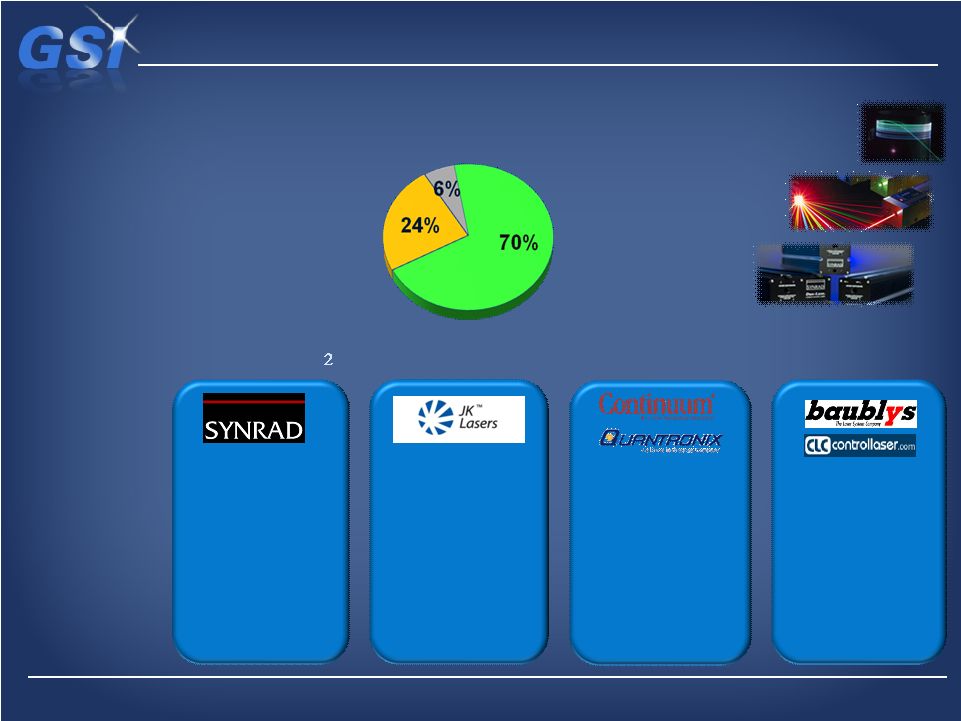 We
have a strong laser offering… …focused on industrial and scientific
markets Laser Products Overview
Laser Products Overview
LTM Revenue
LTM Revenue
~$133M
~$133M
Industrial
Industrial
Scientific
Scientific
Semi
Semi
Brands
Brands
Range
Range
Location
Location
Primary
Primary
Applications
Applications
Sealed CO
Sealed CO
10W to 400W
10W to 400W
Mukilteo, WA
Mukilteo, WA
Marking,
Engraving,
Date Coding of
non-metals
Fiber Lasers
Fiber Lasers
50W to 1kW
Rugby, UK
Metal cutting,
welding, drilling
Specialty
Specialty
High Speed/Power
Santa Clara, CA
Scientific Research
Specialty Industrial
Systems
Systems
10W to 2kW
Orlando, FL
Ludwigsburg, Ger.
Marking
Engraving
Failure Analysis
11 |
 We
are investing for growth… …in several attractive platforms
Attractive Growth Platforms
Attractive Growth Platforms
•
Beam
delivery
for
lasers
–
market
growth
~8%
•
Leverage our #1 position in Galvanometers to
enter Scan Head market (modules)
•
Double addressable market up to ~$200M
•
ASP goes from ~$750 to ~$2500
•
~$25M revenue opportunity by 2015
Scanning Solutions
Scanning Solutions
•
~$600M market growing ~20%
•
Our range: 50W to 1kW, multi kW in R&D
•
Leverage our large historical installed base to
convert long-time customers to fiber
•
Expanded production capacity
•
New applications centers in U.S. and China
•
~$25M revenue opportunity by 2015
Fiber Lasers
Fiber Lasers
•
~$50M business today, growing 20%+
•
Numerous design wins with leading OEM’s
•
Key Applications: Robotic Surgery, DNA Sequencing, OCT,
Patient Monitoring, Defibrillation, EKG, Dermatology
•
Expansion into adjacent technologies & customer platforms
Medical Components
Medical Components
12
Source: Strategies Unlimited, Management Estimates
|
 Overall market conditions…
…suggest challenging Q1 with moderate full-year growth
Market Outlook
Market Outlook
•
•
Solid growth in U.S.
Solid growth in U.S.
•
•
New technologies create opportunities
New technologies create opportunities
-
-
Robotics
Robotics
-
-
Next Gen. DNA sequencing
Next Gen. DNA sequencing
•
•
Europe potentially sluggish
Europe potentially sluggish
•
Significant Q4/Q1 downturn of > 30%
•
Major customers reporting “bottoming
out”
has occurred
•
Expect weak Q1 with recovery Q2 and
beyond
•
•
Continued sluggish recovery
Continued sluggish recovery
•
•
Technology platforms create share
Technology platforms create share
opportunities (fiber lasers, scan heads)
opportunities (fiber lasers, scan heads)
•
•
Mature technologies seeing faster
Mature technologies seeing faster
declines (e.g. lamp pumped YAG)
declines (e.g. lamp pumped YAG)
•
•
China is a question mark
China is a question mark
•
•
Government fiscal pressures keep
Government fiscal pressures keep
overall growth flat
overall growth flat
•
•
Large program opportunities exist but
Large program opportunities exist but
are binary
are binary
Industrial
Industrial
Semiconductor
Semiconductor
Scientific
Scientific
Medical
Medical
13 |
 Financial Overview
14 |
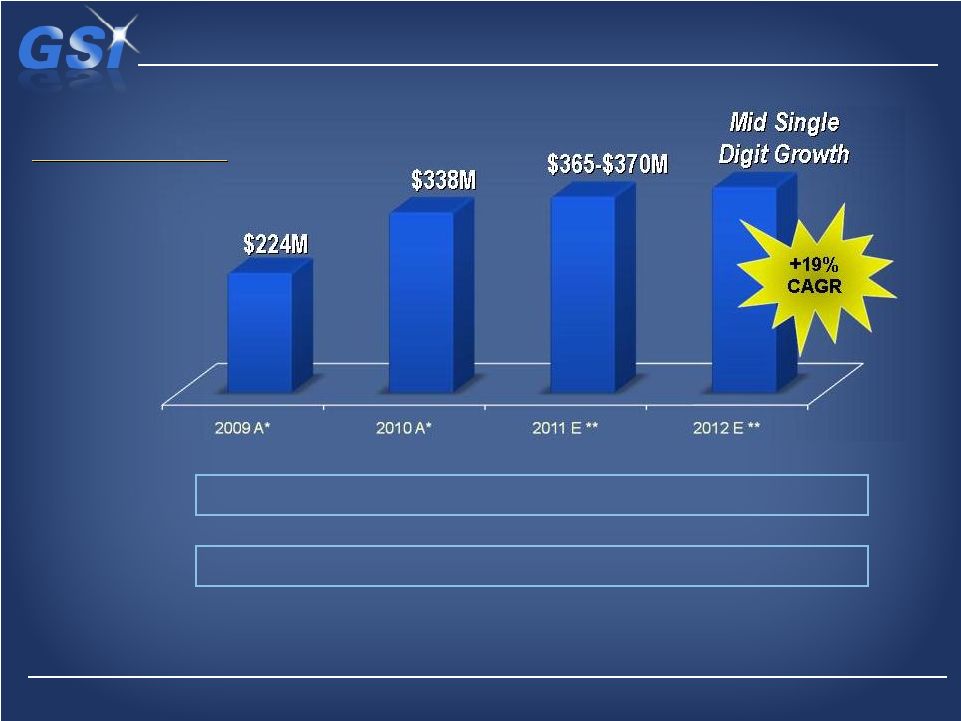 Solid revenue growth driven by economic recovery…
…with a strategy to drive high-single digit growth
$254M
$384M
n/a
n/a
US GAAP
US GAAP
Revenues
Revenues
($30.4M)
($45.7M)
n/a
n/a
Semiconductor
Adjustments*
* 2009 and 2010 (in graph) exclude revenues Company recognized
in its Semiconductor Systems segment that had been deferred from orders
placed by customers prior to 2009. See SEC
filing for further info. See Non-GAAP reconciliation in appendix herein.
** 2011E and 2012E are based on financial guidance provided on November 10,
2011 Adj. Revenue:
Adj. Revenue:
15 |
 Business continues to generate solid profitability…
…with a roadmap to continued double-digit growth
$23.4M
$74.7M
n/a
n/a
EBITDA***
EBITDA***
($16.5M)
($20.0M) n/a
n/a
Semiconductor
Adjustments*
* 2009 and 2010 (in graph) exclude revenues and cost of revenues the Company
recognized in its Semiconductor Systems segment that had been deferred from
orders placed by customers prior to 2009. See SEC filing for further info. **
2011E and 2012E are based on financial guidance provided on November 10, 2011
*** Includes income associated with Semiconductor Systems Segment revenue that had
been deferred from orders placed by customers prior to 2009
Adjusted EBITDA:
Adjusted EBITDA:
16 |
 Demonstrated history of strong cash generation…
…on an accelerated path to a net cash position
$63.3M
$56.8M
$50.7M
Total Cash &
Total Cash &
Cash Equivalent
Cash Equivalent
($146.7M)
($50.8M)
($22.5M)
Net Debt*
Leverage Ratios*
Total Debt / Adjusted EBITDA
30.3x
2.0x
1.4x
Total Debt / Equity
249%
60%
35%
Gross Debt:
Gross Debt:
* Non-GAAP financial measure
17 |
 •
•
Strengthen our strategic position
Strengthen our strategic position
•
•
Enhance our customer offering
Enhance our customer offering
•
•
Strong growth prospects
Strong growth prospects
•
•
Innovation driven
Innovation driven
•
•
Create shareholder value above
Create shareholder value above
the alternatives
the alternatives
Our strategy for Capital Deployment…
Maximize Return on Capital
through Internal Investments and
Complementary Acquisitions
Acquisition Criteria:
Acquisition Criteria:
•
•
Complementary technologies to
Complementary technologies to
existing business lines
existing business lines
•
•
Photonic components &
Photonic components &
associated technologies
associated technologies
•
•
Medical components to OEM
Medical components to OEM
manufacturers
manufacturers
Acquisition Focus:
Acquisition Focus:
…focuses on high returning, manageable investments
18 |
 We
are establishing a continuous improvement culture…
…through formalized productivity programs / initiatives
Current
Current
12 x 12 Integration and Realignment Program
Target: Up to $5 million in annualized cost
savings, with a goal of eliminating up to 12 facilities
Future
Future
Operational Excellence
Target: Consistent margin expansion
Continuous Improvement Culture
Continuous Improvement Culture
19 |
 We
have clear focus… …for success in 2012
Key Priorities for 2012
Key Priorities for 2012
•
•
Execute on 12 X 12 plan
Execute on 12 X 12 plan
•
•
Build momentum on Growth Platforms
Build momentum on Growth Platforms
•
•
Build pipeline of bolt-on acquisitions
Build pipeline of bolt-on acquisitions
•
•
Finalize Strategic Review process
Finalize Strategic Review process
•
•
Build on our core competencies
Build on our core competencies
•
•
Engage with investment community
Engage with investment community
20 |
 •
•
Experienced
Experienced
new
new
management
management
team
team
with
with
demonstrated
demonstrated
track
track
record
record
of
of
value
value
creation
creation
(GE,
(GE,
Honeywell,
Honeywell,
PerkinElmer,
PerkinElmer,
IBM,
IBM,
Millipore,
Millipore,
Analog
Analog
Devices,
Devices,
Boston
Boston
Scientific,
Scientific,
McKinsey,
McKinsey,
Bain)
Bain)
•
•
Unique technology
Unique technology
position with
position with
capability in both lasers and related
capability in both lasers and related
precision photonic technologies
precision photonic technologies
•
•
Positioned in attractive applications
Positioned in attractive applications
with untapped growth
with untapped growth
potential
potential
•
•
Global
Global
presence with strong positions
presence with strong positions
in growing markets in Asia
in growing markets in Asia
•
•
Strong
Strong
balance
balance
sheet
sheet
with
with
significant
significant
cash
cash
generation
generation
capability
capability
•
•
Low profile stock with reasonable
Low profile stock with reasonable
entry multiple
entry multiple
GSIG offers a distinctive opportunity…
…for shareholder value creation
An Attractive Investment
An Attractive Investment
21 |
 Questions
?
Thank you for your
Thank you for your
interest in GSI
interest in GSI
*****
22 |
 Appendix
23 |
 Certain
statements
in
this
presentation
are
“forward-looking
statements”
within
the
meaning
of
the
Private
Securities
Litigation
Reform
Act
of
1995
and
are
based
on
current
expectations
and
assumptions
that
are
subject
to
risks
and
uncertainties.
All
statements
contained
in
this
presentation
that
do
not
relate
to
matters
of
historical
fact
should
be
considered
forward-looking
statements,
and
are
generally
identified
by
words
such
as
“expect,”
“intend,”
“anticipate,”
“estimate,”
“plan,”
and
other
similar
expressions.
These
forward-looking
statements
include,
but
are
not
limited
to,
statements
related
to:
market
outlooks;
the
expected
growth
in
the
Company’s
revenues
and
profits;
the
expected
timing,
scope
and
benefits
of
the
12x12
Program;
the
Company’s
expected
future
financial
results;
the
Company’s
expected
growth,
revenue
opportunities,
financial
results,
structure
and
end-market
mix;
the
Company’s
optimism
regarding
its
prospects for the future; and other statements that are not historical facts.
These forward-looking statements involve a number of risks, uncertainties,
assumptions and other factors that could affect future results and cause actual
results and events to differ materially from historical and expected results and
those expressed or implied in the forward-looking statements, including, but not
limited to, the following: our failure to develop, implement and
maintain appropriate internal controls; changes in our management on our
relationships with key employees,
suppliers
and
customers;
economic
and
political
conditions;
our
dependence
on
our
customers’
capital
expenditures;
our
ability
to
respond
to
fluctuations in product demand; the need to continually innovate; the effects of
delays in delivery of new products; our reliance upon third party distribution
channels;
our
failure
to
meet
or
exceed
the
expectations
of
securities
analysts
or
investors;
timing
of
customer
orders;
changes
in
interest
rates,
credit
ratings
or foreign currency rates; risks associated with our operations in foreign
countries; our increased use of outsourcing in foreign countries; any failure to comply
with
local
customs
regulations;
our
history
of
operating
losses;
our
exposure
to
the
credit
risk
of
some
of
our
customers;
violations
of
our
intellectual
property
rights; our ability to protect our intellectual property and successfully defend
against claims of infringement by third parties; the competitive nature of our
industries; our failure to achieve anticipated benefits from acquisitions or
divestitures; our failure to successfully complete restructuring or reorganization of our
businesses; our inability to retain our key personnel; our ongoing assessment of
our operating structure; the expected consolidation of some of our operations;
product
defects
or
problems
with
integrating
our
products
with
other
vendors’
products;
disruptions
in
the
supply
of
or
defects
in
raw
materials,
certain
key
components and other goods from our suppliers; changes in governmental regulation;
a significant disruption in our information technology systems or failure to
implement new systems and software successfully; failure to realize the full value of our intangible assets; need to make additional tax payments and/or
recalculate
certain
of
our
tax
attributes;
limits
on
our
ability
to
utilize
our
net
operating
loss
carry-forwards
and
other
tax
attributes;
fluctuations
in
our
effective
tax rates; the potential to be subject to U.S. federal income taxation even though
the Company is a non-U.S. corporation; the potential to be subject to the AMT
for
U.S.
federal
income
tax
purposes;
our
limited
ability
to
carry
back
certain
losses
for
U.S.
federal
income
tax
purposes;
our
need
for
additional
capital;
the
volatility of the market for our common shares; our ability to generate cash; our
access to the cash flow and other assets of our subsidiaries; the substantial
control
of
our
significant
shareholders
over
our
outstanding
common
shares;
provisions
of
our
articles
of
incorporation
that
may
delay
or
prevent
a
change
in
control of our Company; our substantial debt; our intention not to pay dividends in
the near future; our potential inability to timely file certain periodic reports
with the Securities and Exchange Commission and Canadian Securities Administration;
or our failure to file a registration statement relating to securities issued
under our 2006 Equity Incentive Plan.
Other
important
risk
factors
that
could
affect
the
outcome
of
the
events
set
forth
in
these
statements
and
that
could
affect
the
Company’s
operating
results
and
financial condition are discussed in the Company’s Annual Report on Form
10-K for the year ended December 31, 2010, and in the Company’s subsequent
filings with the SEC made prior to or after the date hereof. Such statements are
based on the Company’s management’s beliefs and assumptions and on
information
currently
available
to
the
Company’s
management.
The
Company
disclaims
any
obligation
to
update
any
forward-looking
statements
as
a
result
of
developments
occurring
after
the
date
of
this
document
except
as
required
by
law.
Safe Harbor and Forward Looking Information
24 |
 GSI Group Reconciliation of GAAP to Non-GAAP Financials and other Financial
Information In addition to the financial measures prepared in accordance with
generally accepted accounting principles (GAAP), we use certain non-GAAP financial
measures, including non-GAAP revenues, adjusted EBITDA, and net debt.
Non-GAAP adjustments include: net interest expense, income taxes, depreciation
and amortization, Semiconductor Systems revenues and cost of sales adjustments that
had been deferred from customer orders shipped prior to 2009, but had not
been recognized in the period in which the orders were shipped due to previously undelivered elements or unresolved commitments; share-based
compensation; impairment of intangibles; restructuring and restatement costs;
pre-petition and post-emergence professional fees; reorganization costs,
earnings from equity method investments, loss on discontinued operations, and other
non-recurring items. Net debt is defined as total debt less cash and
cash equivalents.
Management believes non-GAAP financial measures provide meaningful supplemental
information regarding the Company’s operating results because it
excludes amounts that management does not consider part of operating results when
assessing and measuring the operational and financial performance of the
Company. Management believes non-GAAP measures allow a useful alternative for viewing operating trends and performing analytical comparisons.
Accordingly, the Company believes non-GAAP measures provide greater
transparency and insight into management’s method of analysis. While
management believes non-GAAP financial measures provide useful
information, these are not measures under U.S. GAAP, and therefore, should not be
considered in isolation from, or as a substitute for, GAAP financial measures such
as income from operations or net income. Non-GAAP
financial
measures
are
also
used
by
our
management
to
evaluate
our
operating
performance,
communicate
our
financial
results
to
our Board of
Directors, benchmark our operating results against our historical performance and
the performance of our peers, evaluate investment opportunities including
acquisitions and divestitures, and determine the bonus payments for senior
management and other employees. Use of Non-GAAP Financial Measures
25 |
 GSI Group, Inc.
Non-GAAP Revenue
(in thousands of dollars)
(in thousands of dollars)
2010
2010
2009
2009
GAAP revenue
GAAP revenue
$ 383,516
$ 383,516
$ 254,388
$ 254,388
Semiconductor revenue adjustments (a)
Semiconductor revenue adjustments (a)
(45,722)
(45,722)
(30,364)
(30,364)
Non-GAAP revenue
$ 337,794
$ 337,794
$ 224,024
$ 224,024
(a)
(a)
The excluded items from revenues include revenues that had been deferred from
customer orders shipped prior to 2009, but had not been recognized in the
period shipped prior to 2009, but had not been recognized in the period
in which the orders were shipped
in which the orders were shipped
due to previously undelivered elements or unresolved commitments.
Non-GAAP Revenue Reconciliation
26 |
 YTD2011
FY2010
FY2009
Net Income / (loss) attributable to GSI Group Inc.
25,118
$
(687)
$
(71,330)
$
Interest expense, net
10,298
19,821
27,457
Income tax provision (benefit)
4,012
10,739
(773)
Depreciation and amortization
11,463
15,652
17,330
EBITDA (a)
50,891
$
45,525
$
(27,316)
$
Semiconductor revenue adjustments (b)
(456)
(45,722)
$
(30,364)
$
Semiconductor cost of sales adjustments (b)
191
25,768
13,917
Share-based compensation
2,518
1,871
2,052
Impairment of intangible assets
-
-
1,045
Restructuring, restatement and other nonrecurring costs (c)
136
2,592
16,291
Pre-petition and post-emergence professional fees (d)
296
727
6,966
Other expense (income), net (e)
(1,016)
(2,168)
610
Reorganization items (f)
-
26,156
23,606
Loss on discontinued operations, net of tax
-
-
132
Adjusted EBITDA
52,560
$
54,749
$
6,939
$
(in thousands of dollars)
Non-GAAP EBITDA Reconciliation
$
27
Note:
Year-to-Date
(YTD)
is
defined
as
Q1
2011
through
Q3
2011
actual
reported results
(a)
(a)
The Company defines EBITDA, a non-GAAP financial measure, as the net income /
(loss) attributable to GSI Group Inc. before deducting net interest expense,
income taxes, depreciation and amortization.
(b)
(b)
Semiconductor revenue adjustments and cost of sales adjustments include revenues
and cost of sales that had been deferred from customer orders shipped prior to
2009, but had not been recognized in the period in which the orders were shipped
due to previously undelivered elements or unresolved commitments. (c)
(c)
Restructuring, restatement and other related costs primarily consist of fees
related to third parties for services performed in connection with the review and
investigation of revenue transactions examined and the restatement of the
Company’s 2004 through 2008 financial statements (d)
(d)
Pre-petition professional fees incurred during 2009 prior to the bankruptcy,
consist primarily of costs for legal and financial advisors to assist in the analysis of debt
alternatives, as well as other related costs. Post-emergence professional
fees represent professional fees incurred subsequent to emergence from
bankruptcy to finalize the bankruptcy process.
(e)
(e)
Other items excluded represent foreign exchange transaction gains (losses), gains
on the sale of auction rate securities, and earnings on equity method investments.
(f)
(f)
Reorganization items represent amounts recorded in the consolidated financial
statements as a result of the bankruptcy proceedings. |
 Net
Debt & Leverage Ratios Net Debt and Leverage Ratios
Net Debt and Leverage Ratios
(in thousands of dollars, except ratio information)
(in thousands of dollars, except ratio information)
YTD2011
YTD2011
FY2010
FY2010
FY2009
FY2009
Debt
Debt
($73,107)
($73,107)
($107,575)
($107,575)
($210,000)
($210,000)
Less: cash and cash equivalents
Less: cash and cash equivalents
50,655
50,655
56,781
56,781
63,328
63,328
Net debt (a)
Net debt (a)
($22,452)
($22,452)
($50,794)
($50,794)
($146,672)
($146,672)
Total Debt
Total Debt
($73,107)
($73,107)
($107,575)
($107,575)
($210,000)
($210,000)
Total Adjusted EBITDA
Total Adjusted EBITDA
$52,560
$52,560
$54,749
$54,749
$6,939
$6,939
Total Debt/Adjusted EBITDA
Total Debt/Adjusted EBITDA
1.4
1.4
2.0
2.0
30.3
30.3
Total Equity
Total Equity
$207,924
$207,924
$178,678
$178,678
$84,311
$84,311
Total Debt/Total Equity
Total Debt/Total Equity
35%
35%
60%
60%
249%
249%
(a)
(a)
Net debt is defined as total debt less cash and cash equivalents.
(b)
(b)
Adjusted EBITDA is defined as the net income / (loss) attributable to GSI Group
Inc. before deducting net interest expense, income taxes, depreciation and
amortization, Semiconductor Systems revenues and cost of sales adjustments, share-based compensation, impairment of
intangibles, restructuring and restatement costs, pre-petition and
post-emergence professional fees, reorganization costs, foreign exchange gains
(losses), earnings on equity method investments, and loss on discontinued
operations. 28
Note:
Year-to-Date
(YTD)
is
defined
as
Q1
2011
through
Q3
2011
actual
reported
results |