Attached files
| file | filename |
|---|---|
| 8-K - FORM 8-K - CNO Financial Group, Inc. | form8-k12142011dacpresenta.htm |
DAC Accounting Change Estimated Impacts of Implementing ASU 2010-26 December 14, 2011 Exhibit 99.1

CNO Financial Group 2 Forward-Looking Statements Cautionary Statement Regarding Forward-Looking Statements. Our statements, trend analyses and other information contained in these materials relative to markets for CNO Financial‟s products and trends in CNO Financial‟s operations or financial results, as well as other statements, contain forward-looking statements within the meaning of the federal securities laws and the Private Securities Litigation Reform Act of 1995. Forward-looking statements typically are identified by the use of terms such as “anticipate,” “believe,” “plan,” “estimate,” “expect,” “project,” “intend,” “may,” “will,” “would,” “contemplate,” “possible,” “attempt,” “seek,” “should,” “could,” “goal,” “target,” “on track,” “comfortable with,” “optimistic” and similar words, although some forward-looking statements are expressed differently. You should consider statements that contain these words carefully because they describe our expectations, plans, strategies and goals and our beliefs concerning future business conditions, our results of operations, financial position, and our business outlook or they state other „„forward-looking‟‟ information based on currently available information. Assumptions and other important factors that could cause our actual results to differ materially from those anticipated in our forward-looking statements include, among other things: (i) changes in or sustained low interest rates causing a reduction in investment income, the margins of our fixed annuity and life insurance businesses, and sales of, and demand for, our products; (ii) general economic, market and political conditions, including the performance and fluctuations of the financial markets which may affect the value of our investments as well as our ability to raise capital or refinance existing indebtedness and the cost of doing so; (iii) the ultimate outcome of lawsuits filed against us and other legal and regulatory proceedings to which we are subject; (iv) our ability to make changes to certain non- guaranteed elements of our life insurance products; (v) our ability to obtain adequate and timely rate increases on our health products, including our long-term care business; (vi) the receipt of any required regulatory approvals for dividend and surplus debenture interest payments from our insurance subsidiaries; (vii) mortality, morbidity, the increased cost and usage of health care services, persistency, the adequacy of our previous reserve estimates and other factors which may affect the profitability of our insurance products; (viii) changes in our assumptions related to deferred acquisition costs or the present value of future profits; (ix) the recoverability of our deferred tax assets and the effect of potential ownership changes and tax rate changes on their value; (x) our assumption that the positions we take on our tax return filings, including our position that our 7.0% convertible senior debentures due 2016 will not be treated as stock for purposes of Section 382 of the Internal Revenue Code of 1986, as amended, and will not trigger an ownership change, will not be successfully challenged by the Internal Revenue Service; (xi) changes in accounting principles and the interpretation thereof (including changes in principles related to accounting for deferred acquisition costs); (xii) our ability to continue to satisfy the financial ratio and balance requirements and other covenants of our debt agreements; (xiii) our ability to achieve anticipated expense reductions and levels of operational efficiencies including improvements in claims adjudication and continued automation and rationalization of operating systems, (xiv) performance and valuation of our investments, including the impact of realized losses (including other-than-temporary impairment charges); (xv) our ability to identify products and markets in which we can compete effectively against competitors with greater market share, higher ratings, greater financial resources and stronger brand recognition; (xvi) our ability to generate sufficient liquidity to meet our debt service obligations and other cash needs; (xvii) our ability to maintain effective controls over financial reporting; (xviii) our ability to continue to recruit and retain productive agents and distribution partners and customer response to new products, distribution channels and marketing initiatives; (xix) our ability to achieve eventual upgrades of the financial strength ratings of CNO Financial and our insurance company subsidiaries as well as the impact of our ratings on our business, our ability to access capital and the cost of capital; (xx) the risk factors or uncertainties listed from time to time in our filings with the Securities and Exchange Commission; (xxi) regulatory changes or actions, including those relating to regulation of the financial affairs of our insurance companies, such as the payment of dividends and surplus debenture interest to us, regulation of the sale, underwriting and pricing of products, and health care regulation affecting health insurance products; and (xxii) changes in the Federal income tax laws and regulations which may affect or eliminate the relative tax advantages of some of our products or affect the value of our deferred tax assets. Other factors and assumptions not identified above are also relevant to the forward-looking statements, and if they prove incorrect, could also cause actual results to differ materially from those projected. All forward-looking statements are expressly qualified in their entirety by the foregoing cautionary statements. Our forward-looking statements speak only as of the date made. We assume no obligation to update or to publicly announce the results of any revisions to any of the forward- looking statements to reflect actual results, future events or developments, changes in assumptions or changes in other factors affecting the forward-looking statements.
CNO Financial Group 3 Non-GAAP Measures This presentation contains the following financial measures that differ from the comparable measures under Generally Accepted Accounting Principles (GAAP): operating earnings measures; book value, excluding accumulated other comprehensive income (loss) per share; operating return measures; earnings before net realized investment gains (losses) and corporate interest and taxes; and debt to capital ratios, excluding accumulated other comprehensive income (loss). While management believes these measures are useful to enhance understanding and comparability of our financial results, these non-GAAP measures should not be considered substitutes for the most directly comparable GAAP measures. Additional information concerning non-GAAP measures is included in our periodic filings with the Securities and Exchange Commission that are available in the “Investors – SEC Filings” section of CNO’s website, www.CNOinc.com.
CNO Financial Group 4
CNO Financial Group 5 CNO’s Stock Value Proposition Growth – Above average growth potential – Expected sales growth of 8-12% annually – Total population of 65+ expected to increase ~35% by 2020 and ~80% by 2030 Capital – Strong capital position • 359% RBC and $169 million of cash and investments at holding company as of 9/30/2011 – Excess capital generation of $75-$200 million annually Competitive Advantage – Exclusive, growing distribution – Target market focus, with growth as Baby Boomers turn 65 – Sustainable with barriers to entry
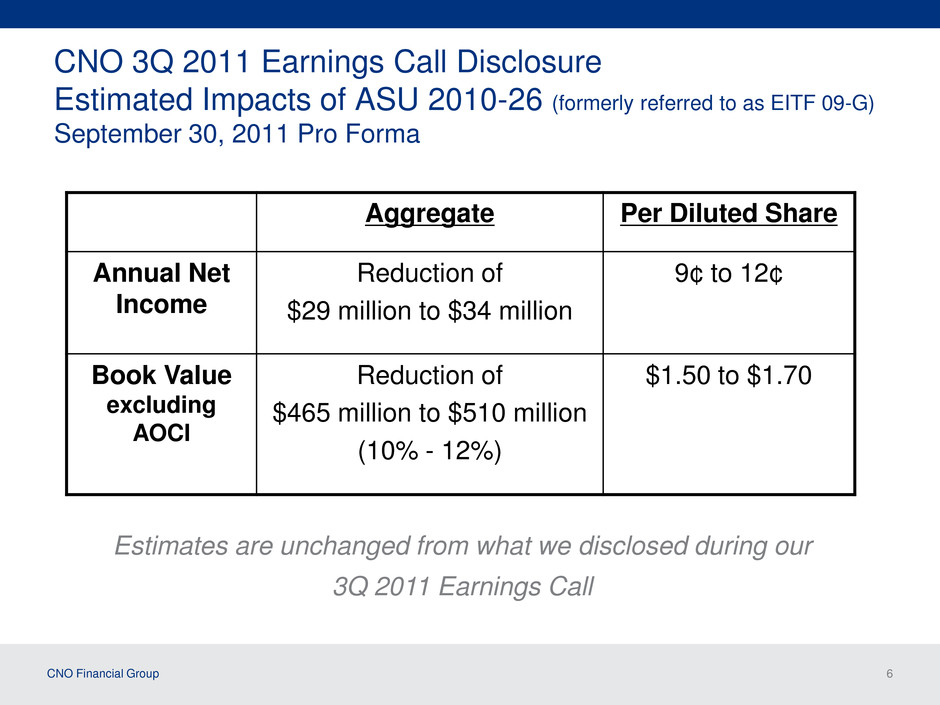
CNO Financial Group 6 CNO 3Q 2011 Earnings Call Disclosure Estimated Impacts of ASU 2010-26 (formerly referred to as EITF 09-G) September 30, 2011 Pro Forma Estimates are unchanged from what we disclosed during our 3Q 2011 Earnings Call Aggregate Per Diluted Share Annual Net Income Reduction of $29 million to $34 million 9¢ to 12¢ Book Value excluding AOCI Reduction of $465 million to $510 million (10% - 12%) $1.50 to $1.70
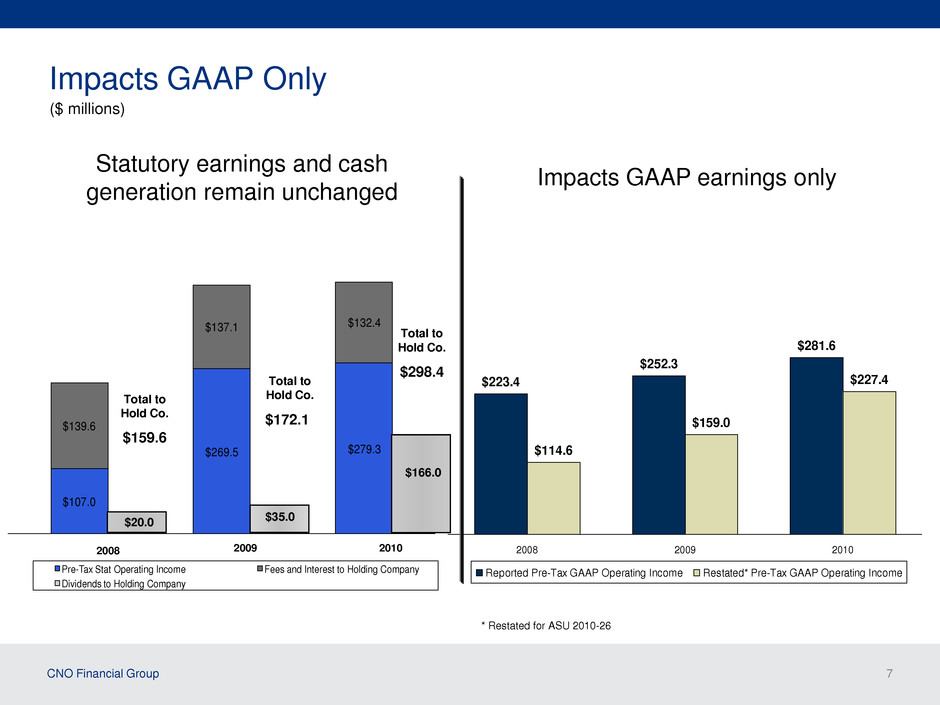
CNO Financial Group 7 $223.4 $252.3 $281.6 $114.6 $159.0 $227.4 2008 2009 2010 Reported Pre-Tax GAAP Operating Income Restated* Pre-Tax GAAP Operating Income $107.0 $269.5 $279.3 $139.6 $137.1 $132.4 Pre-Tax Stat Operating Income Fees and Interest to Holding Company Dividends to Holding Company Impacts GAAP Only ($ millions) Statutory earnings and cash generation remain unchanged Impacts GAAP earnings only Total to Hold Co. $159.6 Total to Hold Co. $172.1 Total to Hold Co. $298.4 * Restated for ASU 2010-26 $35.0 $20.0 $166.0 2008 2009 2010
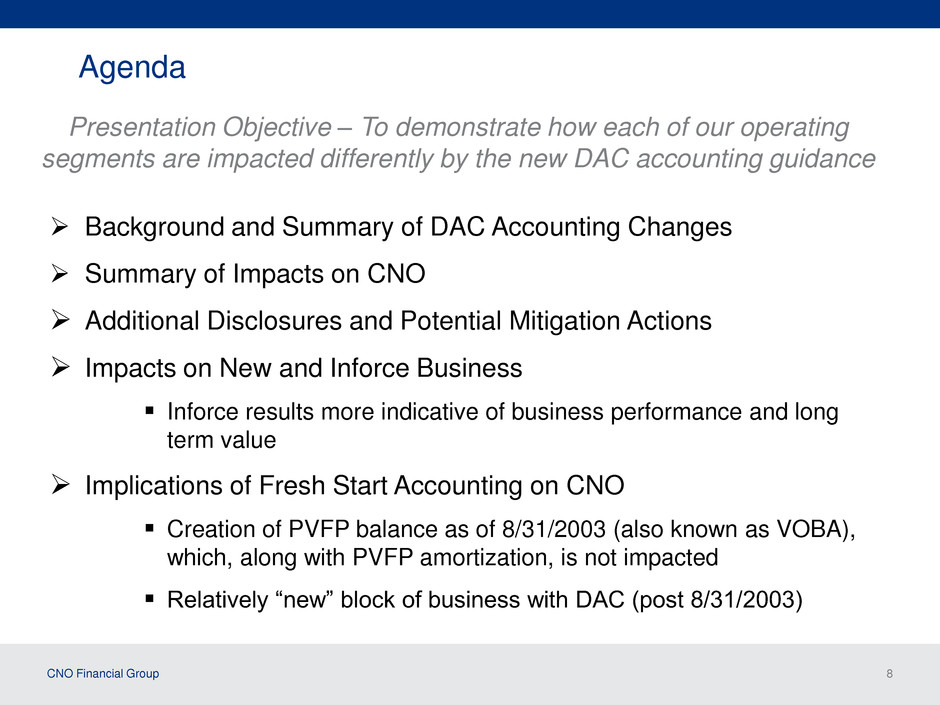
CNO Financial Group 8 Agenda Background and Summary of DAC Accounting Changes Summary of Impacts on CNO Additional Disclosures and Potential Mitigation Actions Impacts on New and Inforce Business Inforce results more indicative of business performance and long term value Implications of Fresh Start Accounting on CNO Creation of PVFP balance as of 8/31/2003 (also known as VOBA), which, along with PVFP amortization, is not impacted Relatively “new” block of business with DAC (post 8/31/2003) Presentation Objective – To demonstrate how each of our operating segments are impacted differently by the new DAC accounting guidance
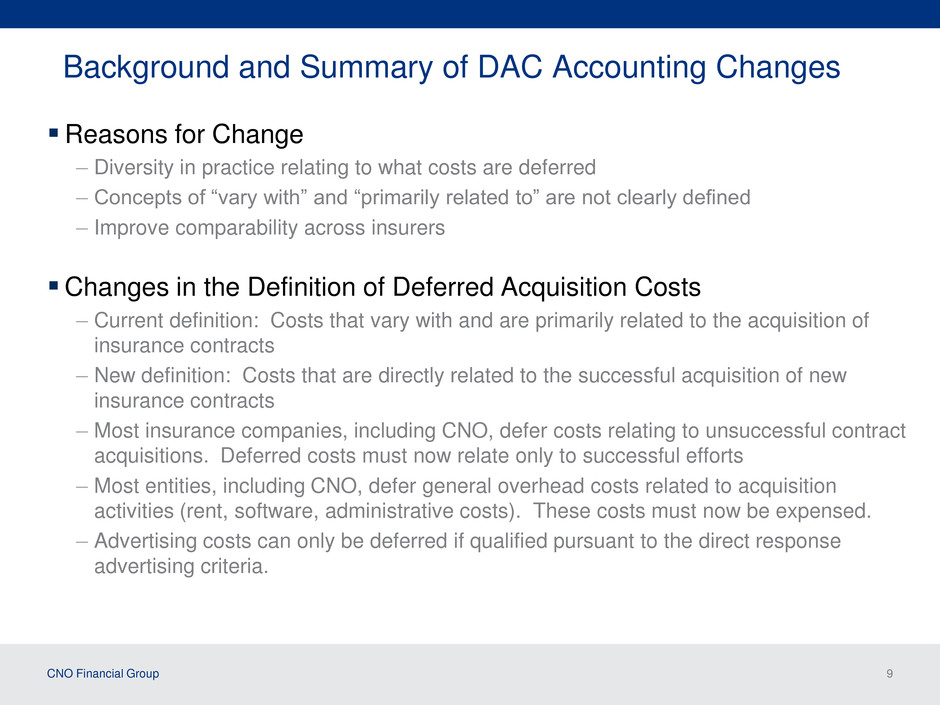
CNO Financial Group 9 Background and Summary of DAC Accounting Changes Reasons for Change – Diversity in practice relating to what costs are deferred – Concepts of “vary with” and “primarily related to” are not clearly defined – Improve comparability across insurers Changes in the Definition of Deferred Acquisition Costs – Current definition: Costs that vary with and are primarily related to the acquisition of insurance contracts – New definition: Costs that are directly related to the successful acquisition of new insurance contracts – Most insurance companies, including CNO, defer costs relating to unsuccessful contract acquisitions. Deferred costs must now relate only to successful efforts – Most entities, including CNO, defer general overhead costs related to acquisition activities (rent, software, administrative costs). These costs must now be expensed. – Advertising costs can only be deferred if qualified pursuant to the direct response advertising criteria.
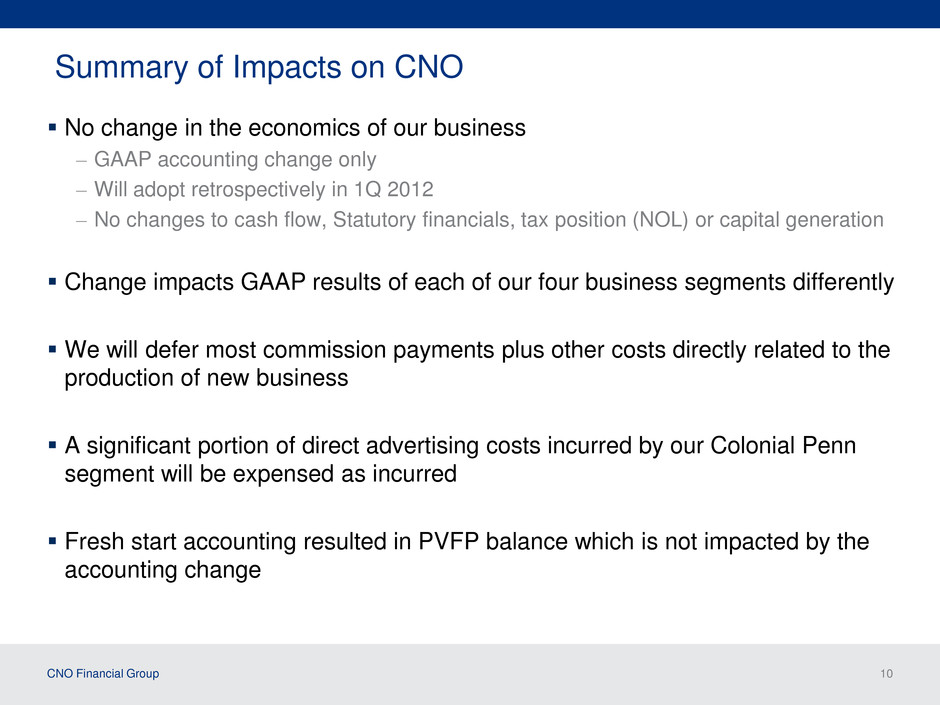
CNO Financial Group 10 Summary of Impacts on CNO No change in the economics of our business – GAAP accounting change only – Will adopt retrospectively in 1Q 2012 – No changes to cash flow, Statutory financials, tax position (NOL) or capital generation Change impacts GAAP results of each of our four business segments differently We will defer most commission payments plus other costs directly related to the production of new business A significant portion of direct advertising costs incurred by our Colonial Penn segment will be expensed as incurred Fresh start accounting resulted in PVFP balance which is not impacted by the accounting change

CNO Financial Group 11 Summary of EBIT Impact by Segment Year-ended December 31, 2010 ($ in millions) As Reported Total In-force New Business Bankers Life 284.1$ 238.5$ 330.0$ (91.5)$ Washington National 104.6 100.2 100.6 (0.4) Colonial Penn 26.5 4.1 38.4 (34.3) Other CNO Business (11.5) (9.1) (9.1) - Corporate (42.8) (42.8) (42.8) - EBIT 360.9$ 290.9$ 417.1$ (126.2)$ Year-ended December 31, 2010 Restated for ASU 2010-26
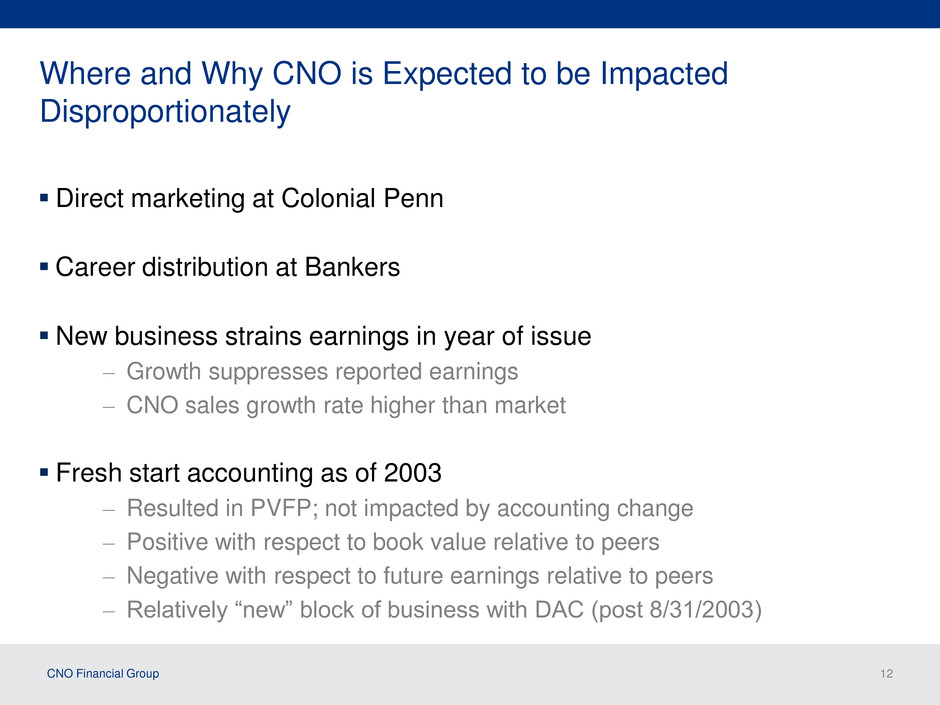
CNO Financial Group 12 Where and Why CNO is Expected to be Impacted Disproportionately Direct marketing at Colonial Penn Career distribution at Bankers New business strains earnings in year of issue – Growth suppresses reported earnings – CNO sales growth rate higher than market Fresh start accounting as of 2003 – Resulted in PVFP; not impacted by accounting change – Positive with respect to book value relative to peers – Negative with respect to future earnings relative to peers – Relatively “new” block of business with DAC (post 8/31/2003)

CNO Financial Group 13 Estimated Adjustments to Consolidated DAC Balance - Summarized by DAC Component September 30, 2011 Pro Forma ($ millions) DAC Before Retroactive Adoption (1) Adjustments DAC After Retroactive Adoption (1) Commissions 933$ (28)$ 905$ Overhead 389 (389) - Labor Costs 320 (275) 45 Sales Inducements 155 - 155 Medical Inspection and other fees 39 - 39 Direct Response Advertising 97 (90) 7 Total 1,933$ (782)$ 1,151$ (1) DAC balance before the impact of unrealized appreciation of investments
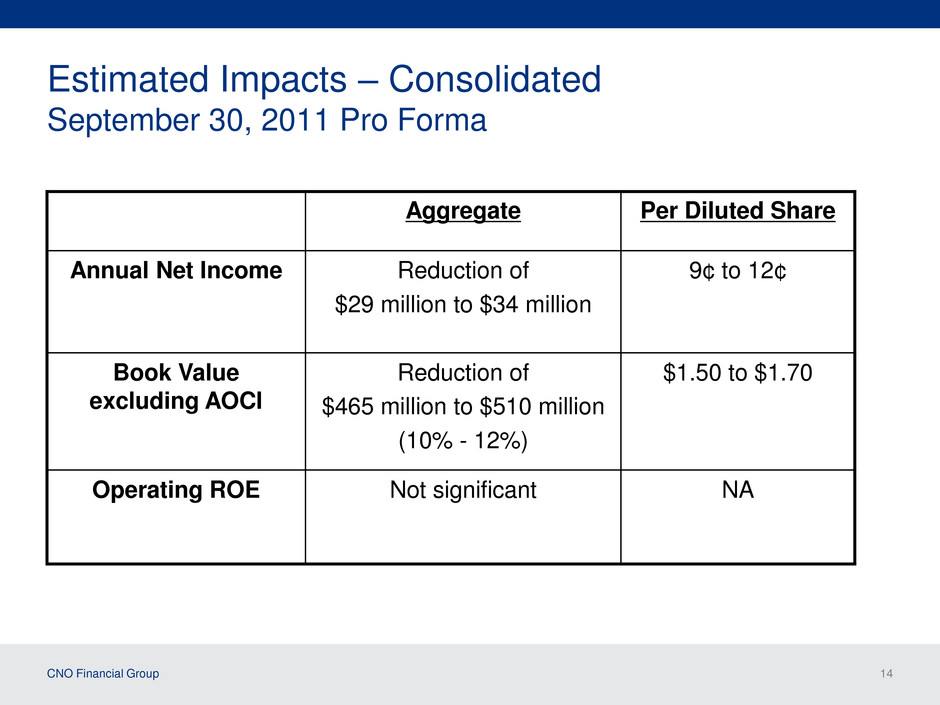
CNO Financial Group 14 Estimated Impacts – Consolidated September 30, 2011 Pro Forma Aggregate Per Diluted Share Annual Net Income Reduction of $29 million to $34 million 9¢ to 12¢ Book Value excluding AOCI Reduction of $465 million to $510 million (10% - 12%) $1.50 to $1.70 Operating ROE Not significant NA
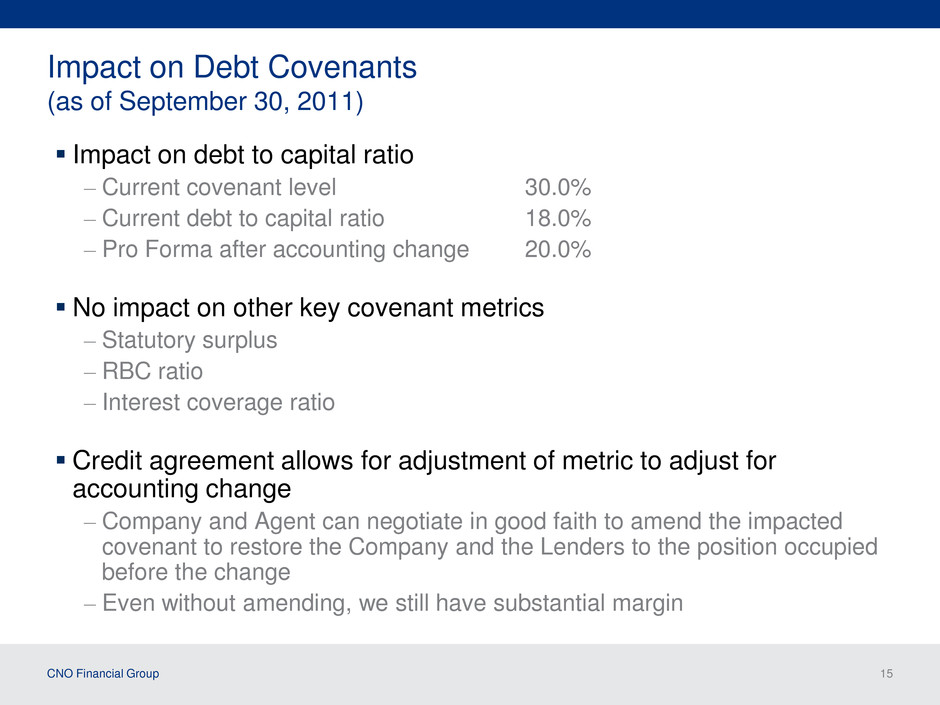
CNO Financial Group 15 Impact on Debt Covenants (as of September 30, 2011) Impact on debt to capital ratio – Current covenant level 30.0% – Current debt to capital ratio 18.0% – Pro Forma after accounting change 20.0% No impact on other key covenant metrics – Statutory surplus – RBC ratio – Interest coverage ratio Credit agreement allows for adjustment of metric to adjust for accounting change – Company and Agent can negotiate in good faith to amend the impacted covenant to restore the Company and the Lenders to the position occupied before the change – Even without amending, we still have substantial margin
CNO Financial Group 16 Additional Disclosures and Potential Mitigation Actions Bifurcate Results Between Inforce and New Business – Inforce results more indicative of business performance and long term value –New business results impacted by rate of sales and direct advertising spend Potential Business Actions – Modify certain commission and compensation arrangements so they are directly related to the successful acquisition of new insurance contracts –Reinsurance and other transactions
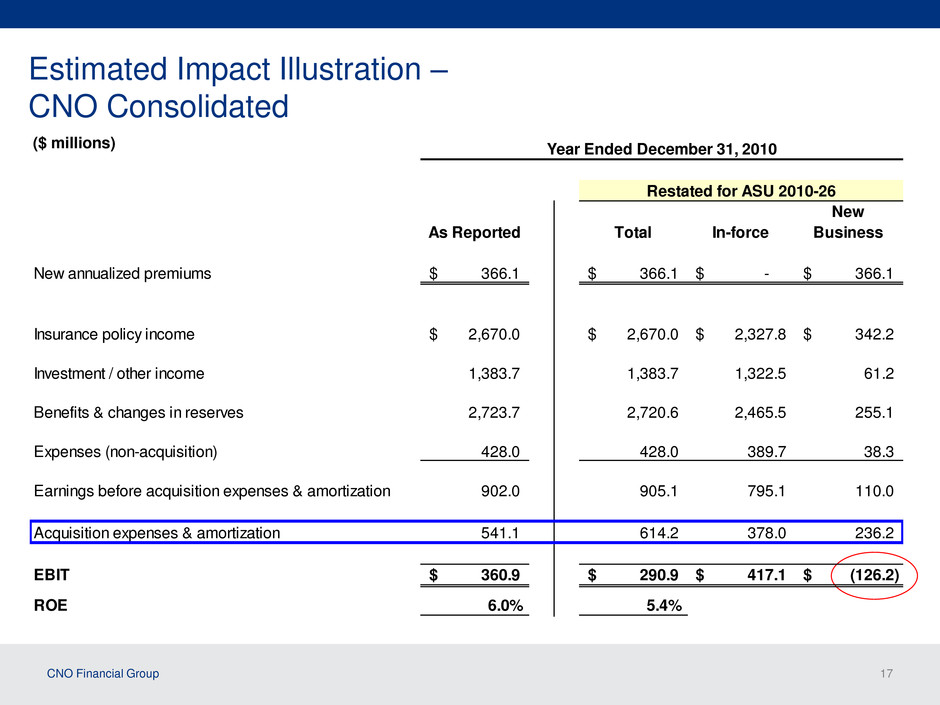
CNO Financial Group 17 Estimated Impact Illustration – CNO Consolidated ($ millions) As Reported Total In-force New Business New annualized premiums 366.1$ 366.1$ -$ 366.1$ Insurance policy income 2,670.0$ 2,670.0$ 2,327.8$ 342.2$ Investment / other income 1,383.7 1,383.7 1,322.5 61.2 Benefits & changes in reserves 2,723.7 2,720.6 2,465.5 255.1 Expenses (non-acquisition) 428.0 428.0 389.7 38.3 Earnings before acquisition expenses & amortization 902.0 905.1 795.1 110.0 Acquisition expenses & amortization 541.1 614.2 378.0 236.2 EBIT 360.9$ 290.9$ 417.1$ (126.2)$ 6.0% 5.4% Restated for ASU 2010-26 ROE Year Ended December 31, 2010
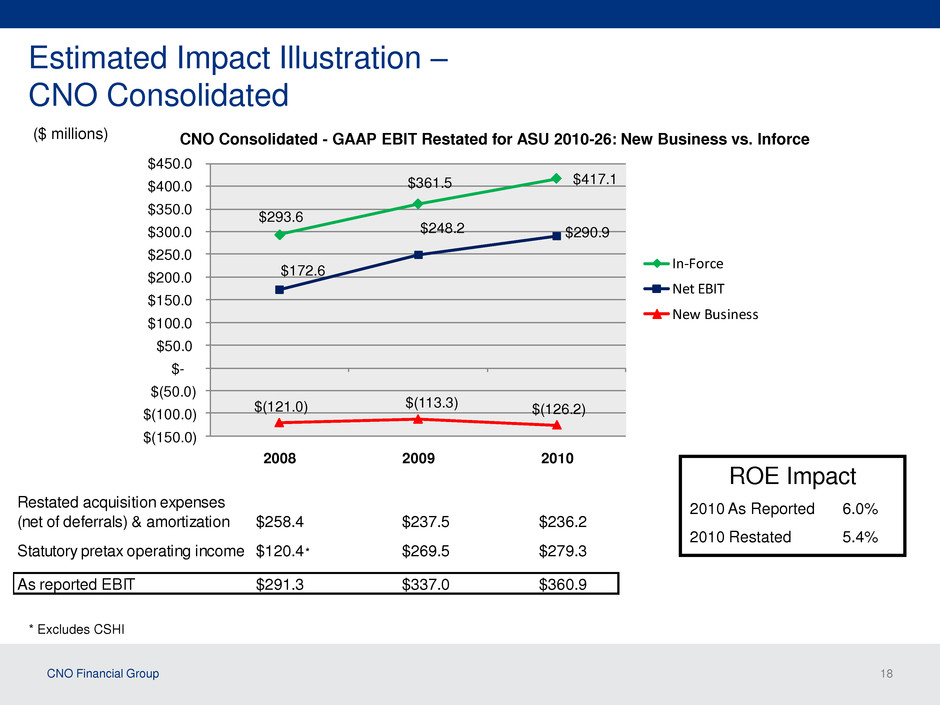
CNO Financial Group 18 $293.6 $361.5 $417.1 $172.6 $248.2 $290.9 $(121.0) $(113.3) $(126.2) $(150.0) $(100.0) $(50.0) $- $50.0 $100.0 $150.0 $200.0 $250.0 $300.0 $350.0 $400.0 $450.0 2008 2009 2010 In-Force Net EBIT New Business Estimated Impact Illustration – CNO Consolidated ($ millions) CNO Consolidated - GAAP EBIT Restated for ASU 2010-26: New Business vs. Inforce * Excludes CSHI Restated acquisition expenses (net of deferrals) & amortization $258.4 $237.5 $236.2 Statutory pretax operating income $120.4 $269.5 $279.3 As reported EBIT $291.3 $337.0 $360.9 * ROE Impact 2010 As Reported 6.0% 2010 Restated 5.4%
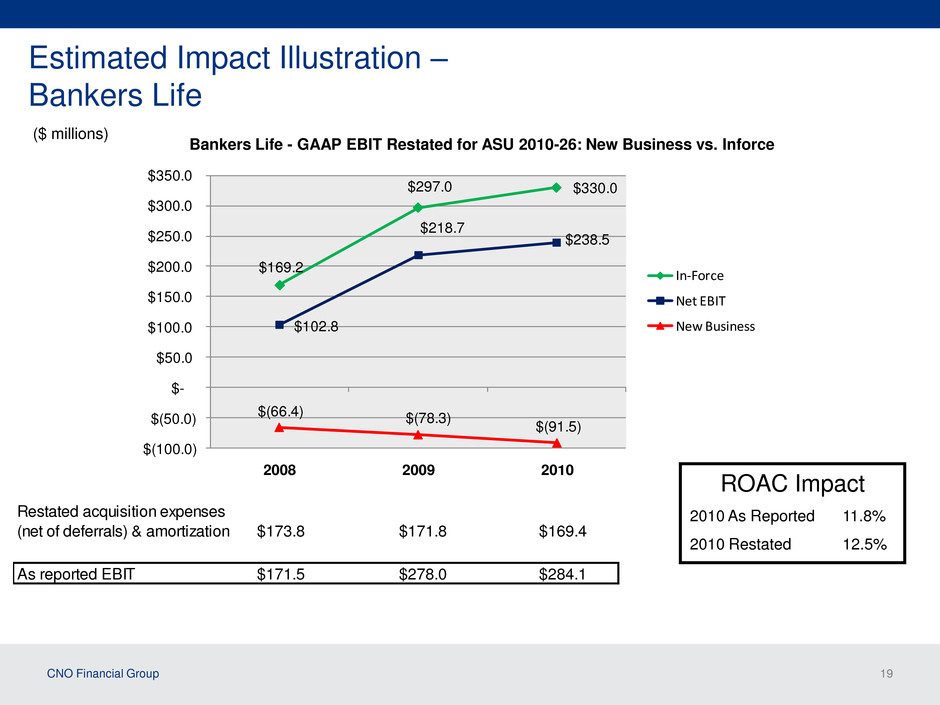
CNO Financial Group 19 Estimated Impact Illustration – Bankers Life ($ millions) Bankers Life - GAAP EBIT Restated for ASU 2010-26: New Business vs. Inforce Restated acquisition expenses (net of deferrals) & amortization $173.8 $171.8 $169.4 As reported EBIT $171.5 $278.0 $284.1 $169.2 $297.0 $330.0 $102.8 $218.7 $238.5 $(66.4) $(78.3) $(91.5) $(100.0) $(50.0) $- $50.0 $100.0 $150.0 $200.0 $250.0 $300.0 $350.0 2008 2009 2010 In-Force Net EBIT New Business ROAC Impact 2010 As Reported 11.8% 2010 Restated 12.5%
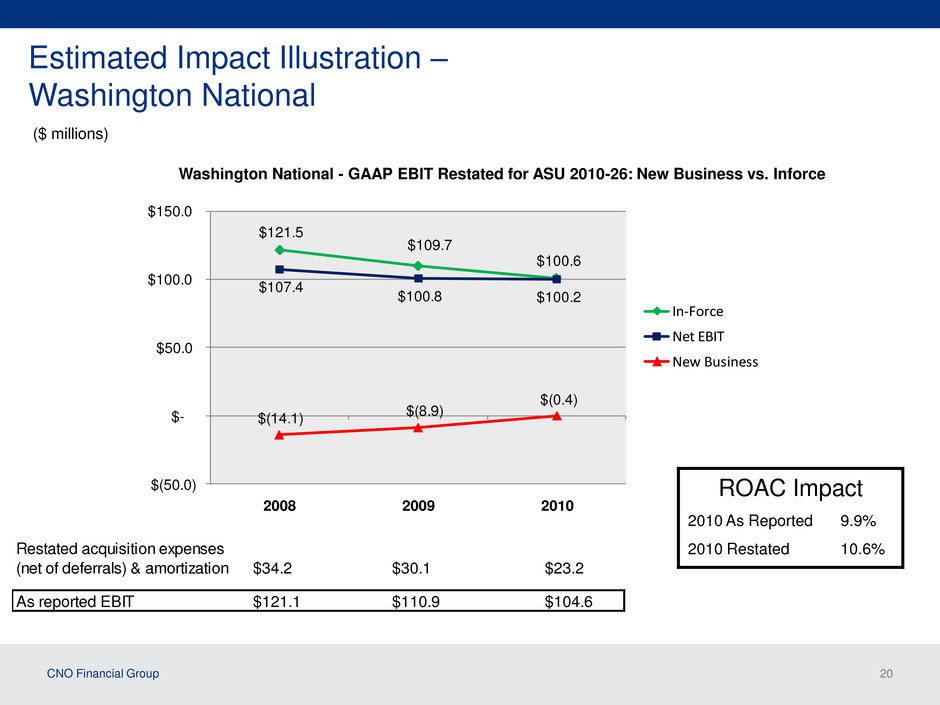
CNO Financial Group 20 Estimated Impact Illustration – Washington National ($ millions) Washington National - GAAP EBIT Restated for ASU 2010-26: New Business vs. Inforce Restated acquisition expenses (net of deferrals) & amortization $34.2 $30.1 $23.2 As reported EBIT $121.1 $110.9 $104.6 $121.5 $109.7 $100.6 $107.4 $100.8 $100.2 $(14.1) $(8.9) $(0.4) $(50.0) $- $50.0 $100.0 $150.0 2008 2009 2010 In-Force Net EBIT New Business ROAC Impact 2010 As Reported 9.9% 2010 Restated 10.6%
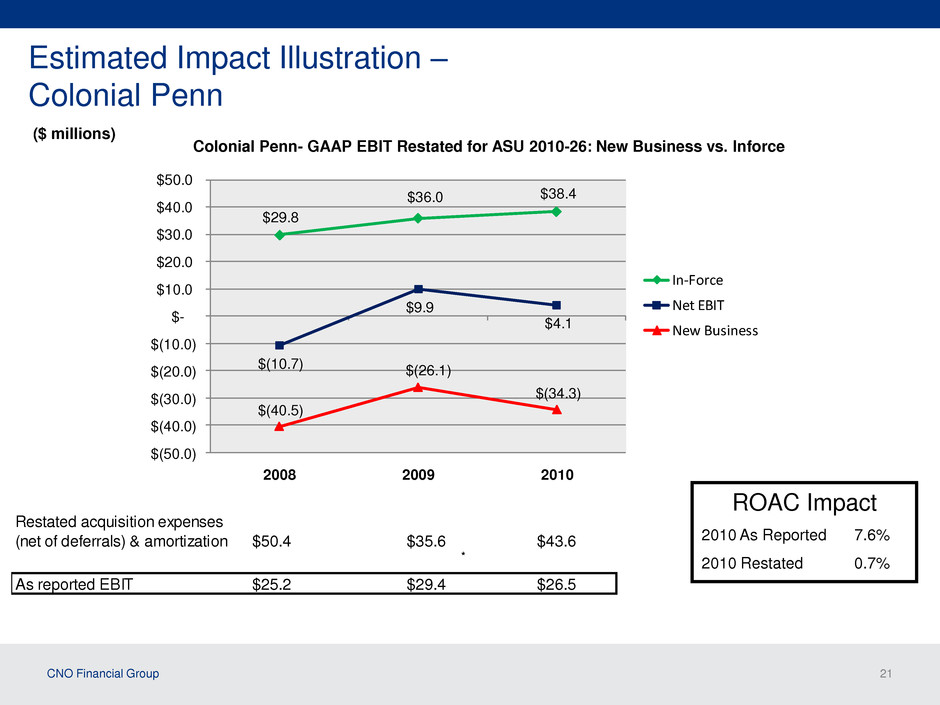
CNO Financial Group 21 Estimated Impact Illustration – Colonial Penn ($ millions) Colonial Penn- GAAP EBIT Restated for ASU 2010-26: New Business vs. Inforce * $29.8 $36.0 $38.4 $(10.7) $9.9 $4.1 $(40.5) $(26.1) $(34.3) $(50.0) $(40.0) $(30.0) $(20.0) $(10.0) $- $10.0 $20.0 $30.0 $40.0 $50.0 2008 2009 2010 In-Force Net EBIT New Business ROAC Impact 2010 As Reported 7.6% 2010 Restated 0.7% Restated acquisition expenses (net of deferrals) & amortization $50.4 $35.6 $43.6 As reported EBIT $25.2 $29.4 $26.5
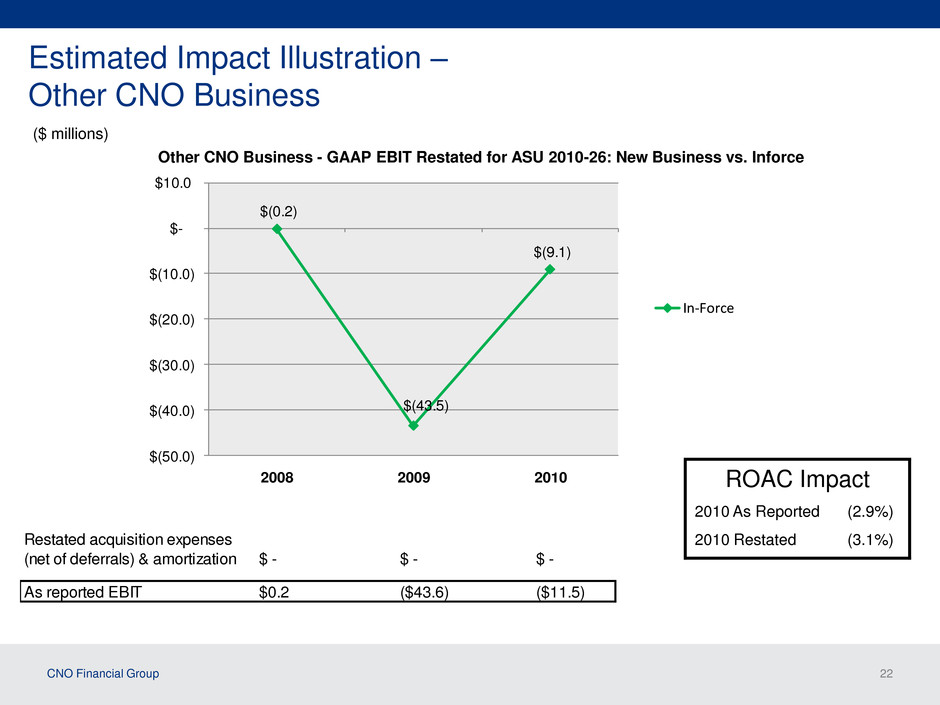
CNO Financial Group 22 Estimated Impact Illustration – Other CNO Business ($ millions) Other CNO Business - GAAP EBIT Restated for ASU 2010-26: New Business vs. Inforce $(0.2) $(43.5) $(9.1) $(50.0) $(40.0) $(30.0) $(20.0) $(10.0) $- $10.0 2008 2009 2010 In-Force ROAC Impact 2010 As Reported (2.9%) 2010 Restated (3.1%) Restated acquisition expenses (net of deferrals) & amortization $ - $ - $ - As reported EBIT $0.2 ($43.6) ($11.5)
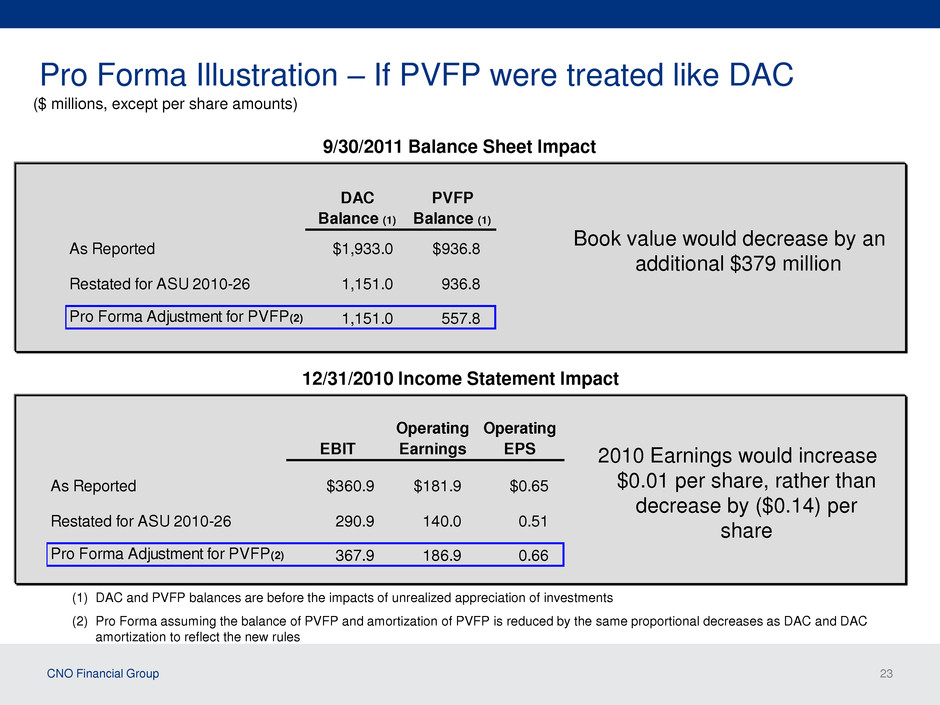
CNO Financial Group 23 Pro Forma Illustration – If PVFP were treated like DAC (1) DAC and PVFP balances are before the impacts of unrealized appreciation of investments (2) Pro Forma assuming the balance of PVFP and amortization of PVFP is reduced by the same proportional decreases as DAC and DAC amortization to reflect the new rules ($ millions, except per share amounts) Book value would decrease by an additional $379 million 2010 Earnings would increase $0.01 per share, rather than decrease by ($0.14) per share 9/30/2011 Balance Sheet Impact 12/31/2010 Income Statement Impact DAC Balance (1) PVFP Balance (1) As Reported $1,933.0 $936.8 Restated for ASU 2010-26 1,151.0 936.8 Pro Forma Adjustment for PVFP(2) 1,151.0 557.8 EBIT Operating Earnings Operating EPS As Reported $360.9 $181.9 $0.65 Restated for ASU 2010-26 290.9 140.0 0.51 Pro Forma Adjustment for PVFP(2) 367.9 186.9 0.66
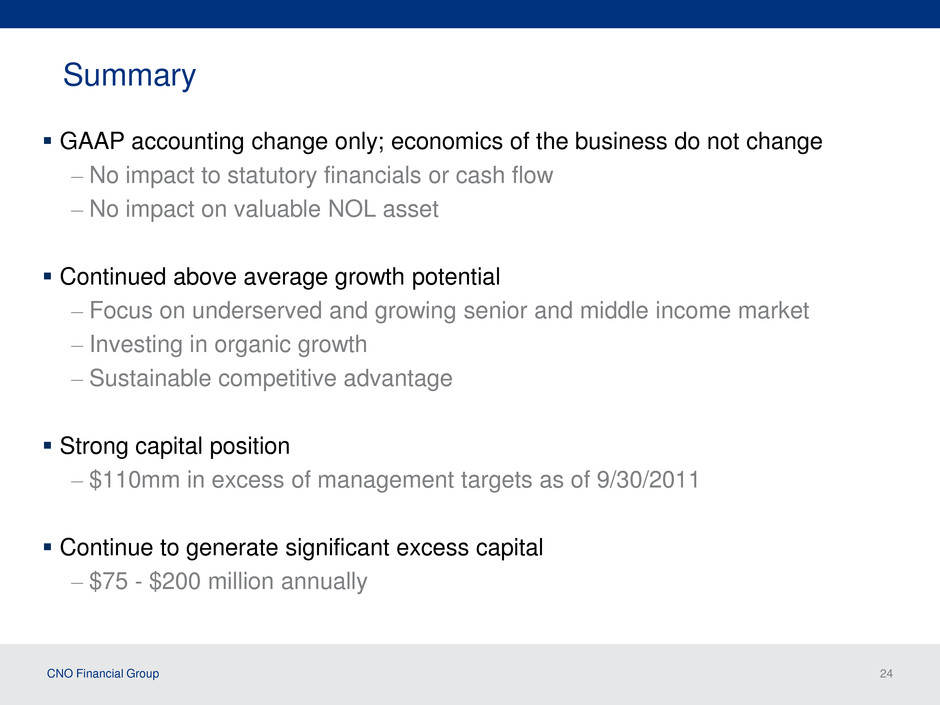
CNO Financial Group 24 Summary GAAP accounting change only; economics of the business do not change – No impact to statutory financials or cash flow – No impact on valuable NOL asset Continued above average growth potential – Focus on underserved and growing senior and middle income market – Investing in organic growth – Sustainable competitive advantage Strong capital position – $110mm in excess of management targets as of 9/30/2011 Continue to generate significant excess capital – $75 - $200 million annually
Questions and Answers
Appendix
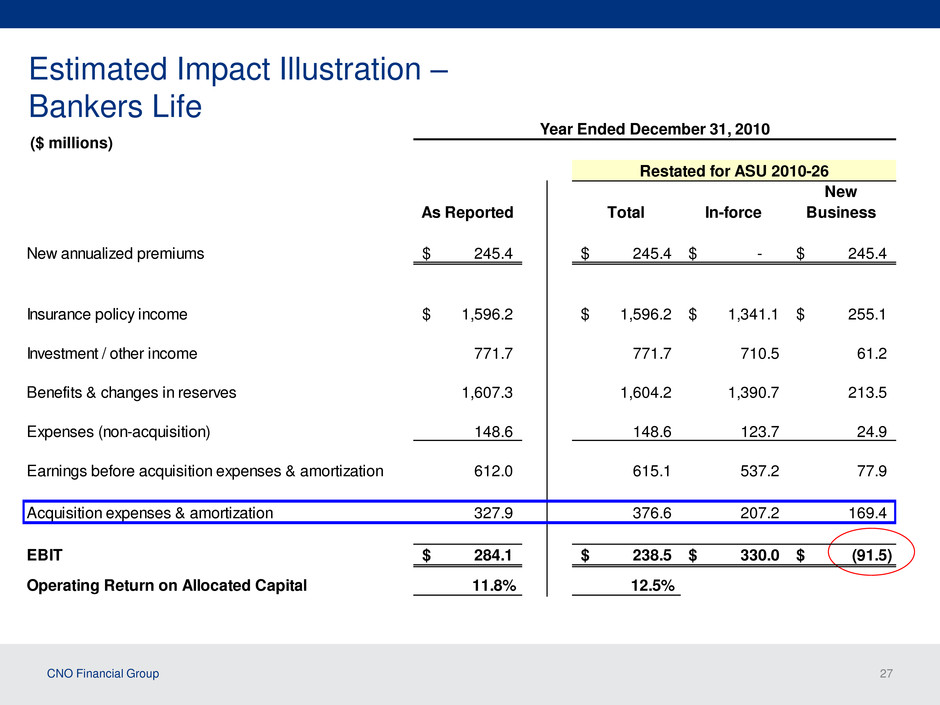
CNO Financial Group 27 Estimated Impact Illustration – Bankers Life ($ millions) As Reported Total In-force New Business New annualized premiums 245.4$ 245.4$ -$ 245.4$ Insurance policy income 1,596.2$ 1,596.2$ 1,341.1$ 255.1$ Investment / other income 771.7 771.7 710.5 61.2 Benefits & changes in reserves 1,607.3 1,604.2 1,390.7 213.5 Expenses (non-acquisition) 148.6 148.6 123.7 24.9 Earnings before acquisition expenses & amortization 612.0 615.1 537.2 77.9 Acquisition expenses & amortization 327.9 376.6 207.2 169.4 EBIT 284.1$ 238.5$ 330.0$ (91.5)$ 11.8% 12.5% Restated for ASU 2010-26 Operating Return on Allocated Capital Year Ended December 31, 2010
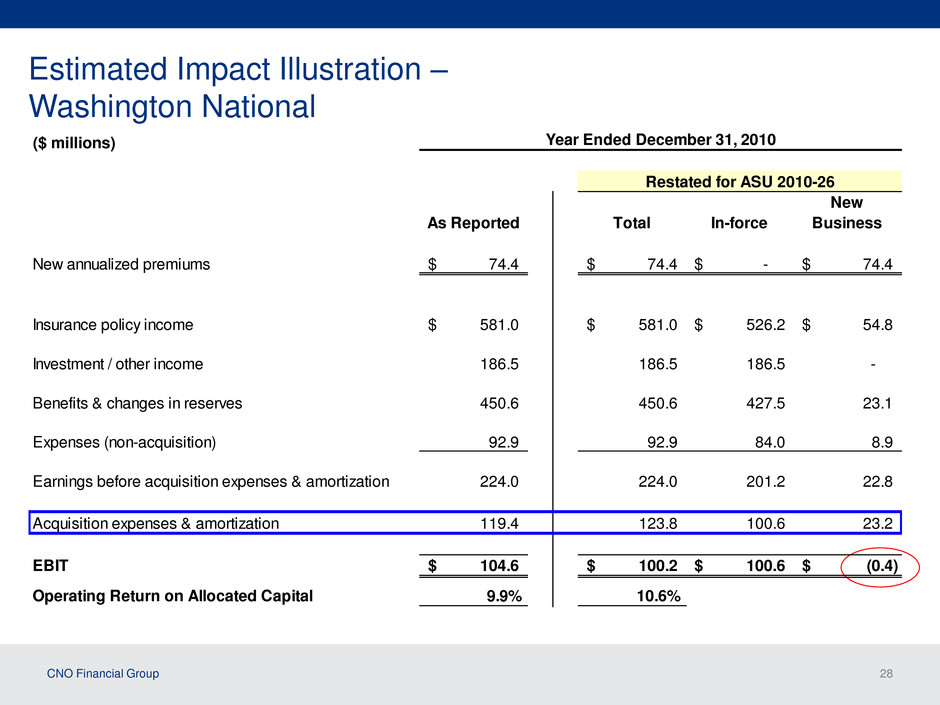
CNO Financial Group 28 Estimated Impact Illustration – Washington National ($ millions) As Reported Total In-force New Business New annualized premiums 74.4$ 74.4$ -$ 74.4$ Insurance policy income 581.0$ 581.0$ 526.2$ 54.8$ Investment / other income 186.5 186.5 186.5 - Benefits & changes in reserves 450.6 450.6 427.5 23.1 Expenses (non-acquisition) 92.9 92.9 84.0 8.9 Earnings before acquisition expenses & amortization 224.0 224.0 201.2 22.8 Acquisition expenses & amortization 119.4 123.8 100.6 23.2 EBIT 104.6$ 100.2$ 100.6$ (0.4)$ 9.9% 10.6% Restated for ASU 2010-26 Year Ended December 31, 2010 Operating Return on Allocated Capital
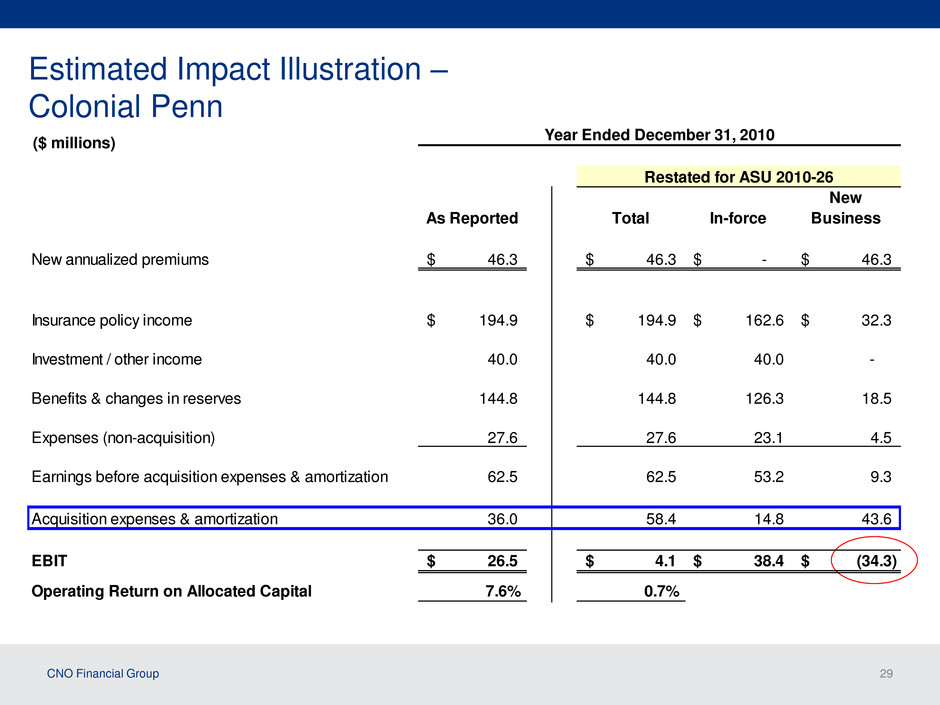
CNO Financial Group 29 Estimated Impact Illustration – Colonial Penn ($ millions) As Reported Total In-force New Business New annualized premiums 46.3$ 46.3$ -$ 46.3$ Insurance policy income 194.9$ 194.9$ 162.6$ 32.3$ Investment / other income 40.0 40.0 40.0 - Benefits & changes in reserves 144.8 144.8 126.3 18.5 Expenses (non-acquisition) 27.6 27.6 23.1 4.5 Earnings before acquisition expenses & amortization 62.5 62.5 53.2 9.3 Acquisition expenses & amortization 36.0 58.4 14.8 43.6 EBIT 26.5$ 4.1$ 38.4$ (34.3)$ 7.6% 0.7%Operating Return on Allocated Capital Restated for ASU 2010-26 Year Ended December 31, 2010
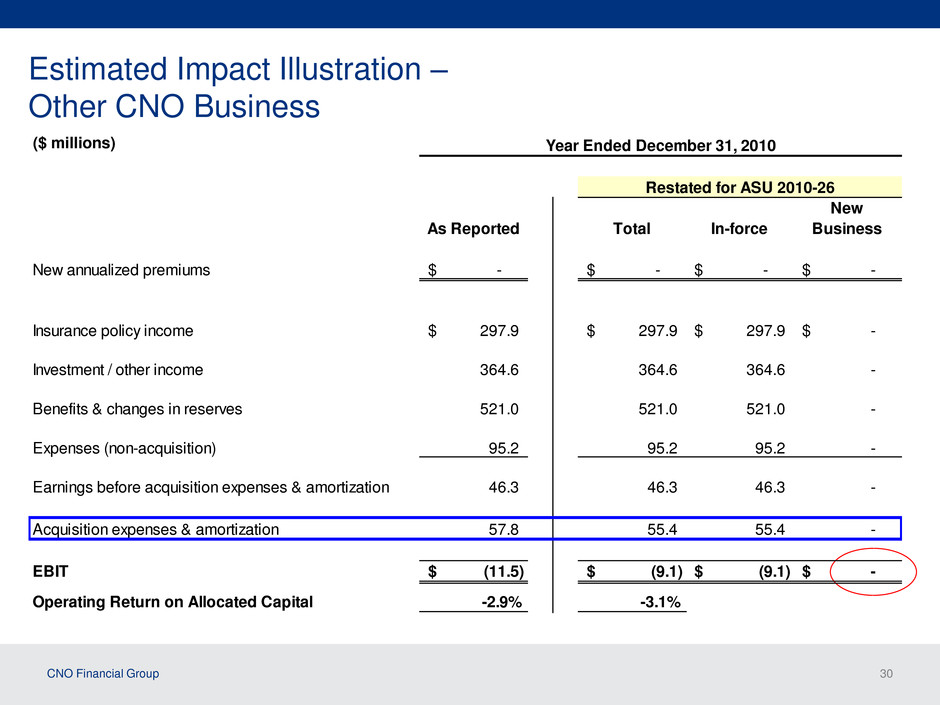
CNO Financial Group 30 Estimated Impact Illustration – Other CNO Business ($ millions) As Reported Total In-force New Business New annualized premiums -$ -$ -$ -$ Insurance policy income 297.9$ 297.9$ 297.9$ -$ Investment / other income 364.6 364.6 364.6 - Benefits & changes in reserves 521.0 521.0 521.0 - Expenses (non-acquisition) 95.2 95.2 95.2 - Earnings before acquisition expenses & amortization 46.3 46.3 46.3 - Acquisition expenses & amortization 57.8 55.4 55.4 - EBIT (11.5)$ (9.1)$ (9.1)$ -$ -2.9% -3.1% Restated for ASU 2010-26 Year Ended December 31, 2010 Operating Return on Allocated Capital
