Attached files
| file | filename |
|---|---|
| 8-K - FORM 8-K - LODGENET INTERACTIVE CORP | d266563d8k.htm |
 UBS Global
Media & Communications Conference
December 7, 2011
Exhibit 99.1 |
 2
Certain statements in this presentation constitute “forward-looking
statements.” When used in this presentation, the words “intends,”
“expects,” “anticipates,” “estimates,” “believes,” “goal,” “no assurance” and similar expressions, and statements
which are made in the future tense or refer to future events or developments, including,
without limitation, Guest Entertainment revenue and cash flows per room, and expanded
services revenue, are intended to identify such forward-looking statements.
Such forward-looking statements are subject to risks, uncertainties and other factors that
could cause the actual results, performance or achievements to be materially different
from any future results, performance or achievements expressed or implied by such
forward-looking statements. Such factors include, among others, the following: the effects of economic
conditions, including general financial conditions; the economic condition of the lodging
industry, which can be particularly affected the financial conditions referenced above,
as well as by high gas prices, levels of unemployment, consumer confidence, acts or
threats of terrorism and public health issues; competition from providers of similar services and from alternative systems
for accessing in-room entertainment; competition from HSIA providers; changes in demand
for our products and services; programming availability, timeliness, quality and costs;
technological developments by competitors; developmental costs, difficulties and
delays; relationships with customers and property owners; the availability of capital to finance growth; compliance
with credit facility covenants; the impact of governmental regulations; potential effects of
litigation; risks of expansion into new markets; risks related to the security of our
data systems; and other factors detailed, from time to time, in our filings with the
Securities and Exchange Commission. For any of the foregoing reasons, our guidance and our
actual financial results may not meet our expectations. These forward-looking
statements speak only as of the date of this presentation. We expressly disclaim any
obligation or undertaking to release publicly any updates or revisions to any forward-looking statements contained herein to
reflect any change in our expectations with regard thereto or any change in events, conditions
or circumstances on which any such statement is based. |
 3
I.
Highly Attractive Market Position
Dominant Position: 85% Share of VOD Market
Affluent Consumer Demographic
Best Screen with Best Entertainment Options
Premium VOD Content: Top 5 Hotel Channel
Strong Free Cash Flow: Proven Ability to De-lever
II.
Proven & Impactful Growth Opportunities
New Four Screen Strategy: Expands Strategic & Economic Value
Transition to Higher-Revenue HDTV: Only 20% HD Penetration Today
Mobile App: Creates ‘Over The Top’
Relationship with Travelers
Targeted & Interactive Advertising: High Value Guest Demographic
Healthcare: Growth Opportunity that Leverages Core Technology
Investment Highlights |
 Largest Provider
of Interactive Media & 1.7 Million Rooms
85% Share of VOD-Served Market
Reach Over 500 Million Consumers Annually
Highly Interactive Audience
Highly Attractive Demographic*
Guests Turn
on Television
Frequent Travelers
Carrying Smartphones**
Now “Going
Interactive”
60%
Business Overview
4
* Source: Neilson Demo Study, Oct 2011 ** SITA/ATW Survey, Oct
2011 98%
74%
Connectivity Services to Hospitality & Healthcare
-
Affluent:
2X
More
Likely
to
Have
Household
Income
Over
$100K
-
Educated:
57%
More
Likely
to
Have
College
Degree |
 1.7 Million Rooms
(as of 12/31/10)
Attractive & Diversified Hotel Base
5
Luxury
2%
Upper-Upscale
17%
Upscale
23%
Midscale
w/ F&B
12%
Midscale
w/o F&B
26%
Economy
4%
Independent
16% |
 1,500+
Ownership & Management
Groups
(as of 12/31/10)
(Based on Number of Rooms)
Focused by Brand…Diversified by Decision
6
Attractive & Diversified Hotel Base
Over 9,000 Property Level Agreements |
 Advantage:
Premium VOD Day
1
Day
60
Day
120
Day
150
* Sources: National Association of Theater Owners, LodgeNet Interactive
(streaming)
60 days before DVD | 90 days before Netflix*
Early Window
Drives Majority
of Revenue
7 |
 LodgeNet 150-Site Channel Viewing Data
LodgeNet VOD Top 5 Viewed Channel
8
Advantage: Premium VOD |
 9
Expanded Mission Driving Growth
“Four Screen”
Strategy Expands LodgeNet Opportunity
Interactive TV + Web + Mobile + Tablets
Guest Entertainment + Hotel Services + Advertising Services
In-Room + On-Property + On the Way |
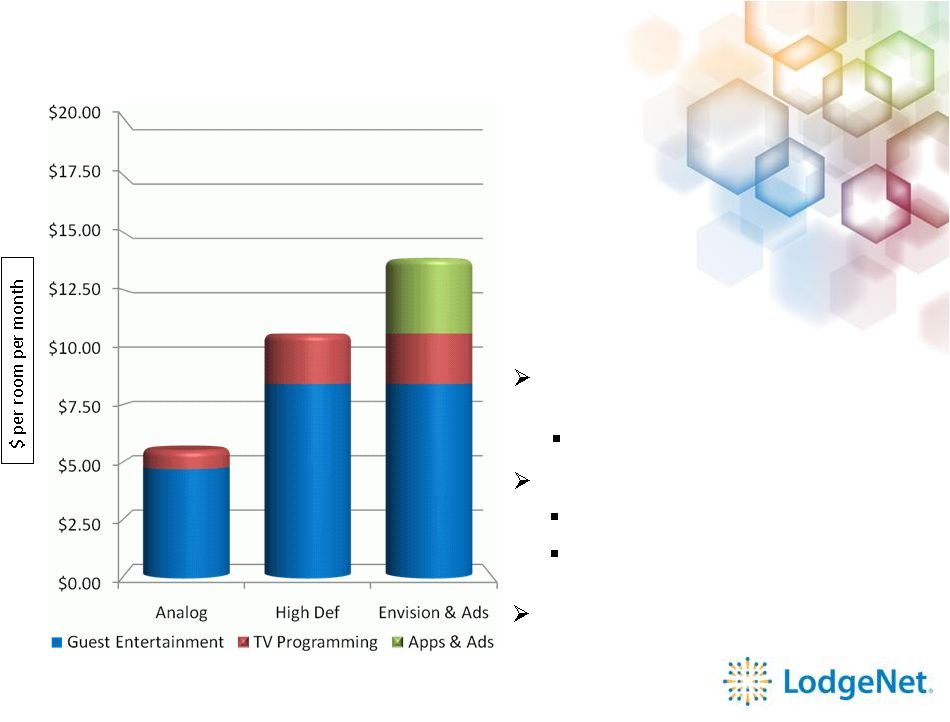
 Yesterday
Today
Tomorrow
Diversified Revenue “Stack”
High Definition: Up 64% over Analog
Incremental Revenues: +25% Potential
-
Envision Apps
Hotel Subscriptions –
Consistent
Revenue
-
Mobile App
Hotel Subscriptions –
Services
Guest Transactions –
$$ Share
Advertising Services
TV, Mobile & Web Platforms
Attractive Demographic
10
Revenue Growth from Expanded Services |
 New
Services Have High Margins with Minimal
Capex
Envision Apps: Software as
Mobile: Software Implementation
Software Upgrade to iTV
Software Download to Guests’
Smart Phones
11
Accelerated Cash Flow Growth
Yesterday
Today
Tomorrow
$10.50
$14.00
$5.50
Advertising: Low Fixed Cost
Operations
Service
Minimal Incremental Opex |
 High
Definition TV Roll-Out 60% Greater Revenue than Analog
Hotels Aggressively Moving to HDTV
Only 20% Today Have Full iHDTV Systems
Enhanced: VOD 2.0 Entertainment
Marketing
Browsing Up Significantly
Hollywood Movie Revenue Up Since Intro
Envision Driving Engagement & Revenues
More Guests Now “Going Interactive”
More Hotels Subscribing to Apps
Increase in iTV Cash Flow Per Room
Robust iTV Growth Strategy
12 |
 Compelling iHDTV
Economics iHDTV in 290,000 Rooms
(19% of
Room Base = Growth Opportunity) 13
HD Rooms = 64% Higher Revenue
Per Month vs. Analog Rooms
57% More Guest Entertainment
77% More TV Programming
Significantly Reduced Capex per Room
Solid Return on Capital Investment
Capital Returned in 12-18 Months
5 Year Contract with Upgrade
Supports Envision Platform
All Future HD Upgrades Support Envision Apps
Existing HD Rooms Upgradeable to Envision
Average
Investment
of
$144
Per
Room
Capex
Per
Room
Down
50%
in
Two
Years |
 New
Marketing Increasing Usage June VOD 2.0 Launch –
1.1 Million Rooms
tiered pricing / new look
marketing earliest window
expanded payment options
promotional codes
Revenue Up
5%
Browsing Up
20-25%
more guests into
the system
higher theatrical
purchase rates
higher theatrical
revenue per room
Immediate results in Hollywood movie purchases:
LodgeNet Internal Data, June
2011 Premium VOD
buyers purchasing
premium titles
14
Buy Rates Up
10-15%
65% |
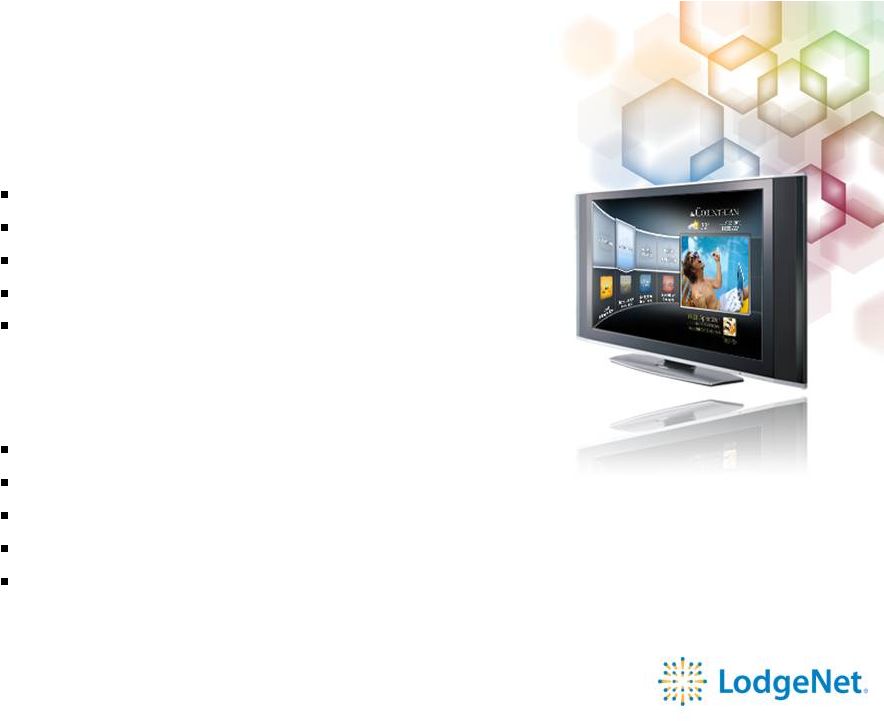
 Envision =
Internet “Connected” Television
-
Exploding in consumer market
-
25% of sets sold this year
Subscribing Hotels Can Leverage Power of Interactive Platform
-
eCompendium App: Save Operating Costs –
More “Green”; Less Printing
-
eConcierge Apps: Drive More Revenue –
Room Service & Tickets
Standard Apps Deliver Great
Interactive TV Experience
-
Premium VOD
-
TV On Demand
-
Multiple Purchase Options
-
Basic Hotel Services –
eCheckout
15 |
 Increasing
Consumer Engagement Accessing Interactive Services 3x more than Prior HD Platform
Gaining Hotel Adoption
19,000 Rooms Now Under Contract
Marquee Hotels in Four Seasons, Hilton, Hyatt, Marriott, Starwood
Over 1/3 Subscribing to One or More Envision Apps
Average Monthly Subscription Over $3.00 Per Room
16
Successful
Envision Rollout |
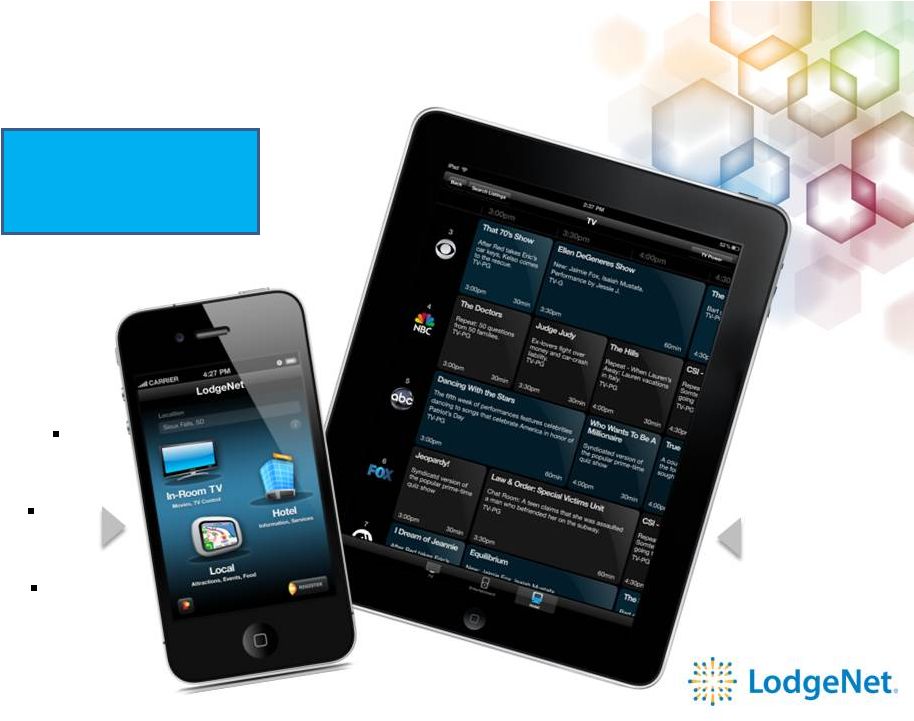 Mobile Launches
in January TV
Control
Hotel
Services
Local
Info
Interactive
Program
Guide (IPG)
17
17
Available on
Android, iPhone, iPad |
 Increase Guest Engagement with iTV
TV Controls to Draw Interest
Interactive Program Guide
Apps Relevant for Busy Travelers
Available in 500,000 Rooms in 2012
Hotel Customization Services
Customized Apps for Individual Brands
In Room Dining, Guest Requests, Hotel Info
1:1 Marketing Relationship with Consumer
Mobile Growth Strategy
18
“Over the Top”
= New Opportunity for LodgeNet
Reservations, Promotions, Points & Credit Cards
In Room + On Property + On the Way |
 LODGENET ADVERTISING PLATFORM
Current Platform
Expanded
Room Footprint
320,000 rooms
500,000+ rooms
Number of Channels
10 channels
20+ channels
Programming Format
Standard Def
High Def
Ability to Target Ads
National
Local
Content Distribution
LNET Leased Satellite
Access to DBS
Annual Impressions
1.2 Billion
5+ Billion
I.
Transition to Expanded HD Ad Platform in 2013
More Rooms and More Channels
Targeted Insertion Drives CPMs –
Taps New Advertising Budgets
Insertion Technology Similar to National DBS Providers
Network Installation & Testing Scheduled for 2012 with Launch in
Q1 2013
II.
Expand Focus on iTV + Mobile + Web
iTV: Expanded Interactive Channels w/ Telescoping
Mobile & Web: Targeted Demographic + Local
Advertising Growth Strategy
19 |
 Healthcare
Drivers: Patient Education
Patient Safety
Patient
Satisfaction
LodgeNet Healthcare
Healthcare Economics:
Interactive System Sale Per Bed
$1,000 -
$1,500
Recurring Revenue Per Bed Per Month
Gross Profit Margin
Q3 2011 TTM Revenue: $10.1 Million
Interactive System Sales to Hospitals
One Million Beds in US –
Addressable Market: 40%
63 Hospitals Installed –
73 Under Contract
(as of 9/30/11)
$25 -
$35
20
40%+ |
 Strong Free Cash
Flow* Quarterly Comparison
($ in millions)
*Free Cash Flow Definition see slide
24 ** Share Count with Preferred Stock Converted 40.42mm Shares
Q3 '11
Q3 '10
Q3 '11
W/Converted Share**
Adjusted Operating Cash Flow
$ 27.0
$ 27.9
$ 0.67
Interest Payments
(6.3)
(7.8)
Working Capital (net)
(7.3)
(0.1)
Pre-Investment Cash Flow
$ 13.4
$ 20.0
$ 0.33
Corporate Assets
(2.6)
(2.8)
HD Investments & Extensions
(3.5)
(1.9)
Total Capital Investment
(6.1)
(4.7)
Free Cash Flow
$ 7.3
$ 15.3
$ 0.18
Free Cash Flow Adjusted for Working Capital
$ 14.6
$ 15.4
$ 0.36
21 |
 Proven Ability to
Reduce Leverage (in millions) 4.28x
3.72x
3.40x
Net Debt to Bank
AOCF Ratios
$469.9
$595.5
$382.3
$347.8
Company Has Paid Down Approximately $250 Million of Net Debt During Past 3 Years
LodgeNet Continues to Reduce Leverage
Lower Debt Level Enables Aggressive Investment into Strategic Growth Initiatives
22
3.33x
$300
$350
$400
$450
$500
$550
$600
$650
Q3 08
Q3 09
Q3 '10
Q3 '11
Covenant at 4.0x |
 23
I.
Highly Attractive Market Position
Dominant Position: 85% Share of VOD Market
Affluent Consumer Demographic
Best Screen with Best Entertainment Options
Premium VOD Content: Top 5 Hotel Channel
Strong Free Cash Flow: Proven Ability to De-lever
II.
Proven & Impactful Growth Opportunities
New Four Screen Strategy: Expands Strategic & Economic Value
Transition to Higher-Revenue HDTV: Only 20% HD Penetration Today
Mobile App: Creates ‘Over The Top’
Relationship with Travelers
Targeted & Interactive Advertising: High Value Guest Demographic
Healthcare: Growth Opportunity that Leverages Core Technology
Investment Highlights |
 Reconciliation
of Operating Income to Adjusted Operating Cash Flow
Operating Income
Plus: Depreciation and Amortization
Plus: Restructuring Charges and Integration Expenses
Plus: Share-Based Compensation
Plus: Impairment Charge
Equals: Adjusted Operating Cash Flow
Reconciliation of Free Cash Flow
Cash from Operations
Less: Cash Used for Investing Activities, including Growth-Related Capital
Equals: Free Cash Flow
24 |