Attached files
| file | filename |
|---|---|
| 8-K - FORM 8-K - Alta Mesa Holdings, LP | d265972d8k.htm |
 Alta Mesa
Holdings, LP Wells
Fargo
Securities
10
th
Annual
Pipeline, MLP, and E&P, Services
and Utility Symposium
Alta Mesa Holdings, LP
December 6, 2011
Confidential
Exhibit 99.1 |
| Forward Looking Statements
2
Confidential
This material includes “forward-looking statements” within the meaning of Section
27A of the Securities Act of 1933, as amended, and Section 21E of the Securities
Exchange Act of 1934, as amended. All statements, other than statements of historical fact, regarding our strategy, future operations, financial
position, estimated revenues and losses, projected costs, prospects, plans and objectives of
management are forward-looking statements. These forward- looking statements are
based on our current expectations and assumptions about future events and are based on currently available information as to the
outcome and timing of future events. You should not place undue reliance on
forward-looking statements. They are subject to known and unknown risks,
uncertainties and other factors that may affect the company’s operations, markets,
products, services and prices and cause its actual results, performance or achievements
to be materially different from any future results, performance or achievements expressed or implied by the forward-looking statements.
Forward-looking statements may include statements about our: business strategy; reserves,
including changes to our reserves presentation in accordance with newly adopted SEC
rules; financial strategy, liquidity and capital required for our development program; realized natural gas and oil prices; timing and amount
of future production of natural gas and oil; hedging strategy and results; future drilling
plans; competition and government regulations; marketing of natural gas and oil;
leasehold or business acquisitions; costs of developing our properties and conducting our gathering and other midstream operations; general
economic conditions; credit markets; liquidity and access to capital; uncertainty regarding
our future operating results; and plans, objectives, expectations and intentions that
are not historical. We caution you that these forward-looking statements are subject to all of the risks and uncertainties, most of which are
difficult to predict and many of which are beyond our control, incident to the exploration for
and development, production, gathering and sale of natural gas and oil. These risks
include, but are not limited to: commodity price volatility; inflation; lack of availability of drilling and production equipment and services;
environmental risks; drilling and other operating risks; regulatory changes; the uncertainty
inherent in estimating natural gas and oil reserves and in projecting future rates of
production, cash flow and access to capital; the timing of development expenditures; and other risks. Except as otherwise required by
applicable law, we disclaim any intention or obligation to update or revise any
forward-looking statements, whether as a result of new information, future events
or otherwise. The SEC requires oil and gas companies, in their filings with the SEC, to disclose proved
reserves that a company has demonstrated by actual production or conclusive formation
tests to be economically and legally producible under existing economic and operating conditions. We use the terms “estimated ultimate
recovery,” “EUR,” “probable,” “3P,” “possible,”
and “non-proven” reserves, reserve “potential” or “upside,” “unrisked potential” or other descriptions of
volumes of reserves potentially recoverable through additional drilling or recovery techniques
that are not classified as proved reserves, may not have been calculated as defined by
SEC regulations and SEC’s guidelines may prohibit us from including in any future filings with the SEC. These estimates are by their
nature more speculative than estimates of proved reserves and accordingly are subject to
substantially greater risk of being actually realized by the company. We believe
these estimates are reasonable, but such estimates have not been reviewed by independent engineers. Estimates may change significantly as
development provides additional data, and actual quantities that are ultimately recovered may
differ substantially from prior estimates. Our production forecasts are dependent
upon many assumptions, including estimates of production decline rates from existing wells and the outcome of future drilling activity
Although we believe the forecasts are reasonable, we can give no assurance they will prove to
have been correct. They can be affected by inaccurate assumptions and data or by known
or unknown risks and uncertainties. Market and industry data and forecasts used in this presentation have been obtained from
independent industry sources as well as from research reports prepared for other
purposes. Although we believe these third-party sources to be reliable, we have not independently verified the data obtained from these
sources and we cannot assure you of the accuracy or completeness of the data. Forecasts and
other forward-looking information obtained from these sources are subject to the
same qualifications and uncertainties as the other forward-looking statements in this presentation.
Alta Mesa Holdings, LP |
 3
Confidential
Proved Reserves (SEC Case)
Proved Reserves PV10 (SEC Case)
Crude Oil Proved Reserves
Future Total Proved Revenue from Oil
% Proved Developed
R/P
Q3’2011 Production
2011E CAPEX (Drill, Workovers, Facilities)
Net Acreage
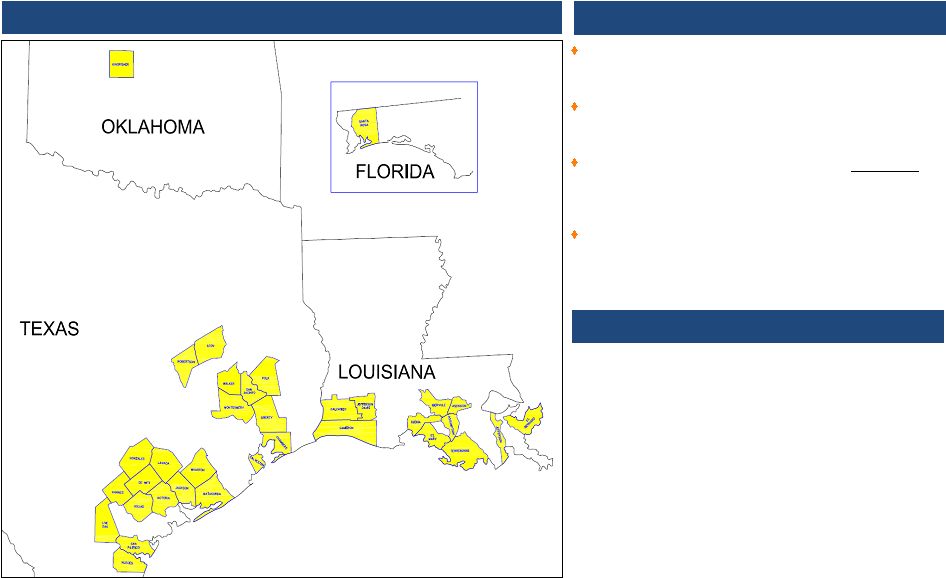
325 BCFE
$705 Million
26%
54%
66%
8.1x
119 MMCFED
$180 Million
172,000+
Key Metrics
1
Core Operating Areas
Alta Mesa Overview
1
Reserve statistics and R/P metric as of Year End 2010 SEC Reserve Report
Privately held company, founded in 1987, engaged in onshore
conventional oil and gas acquisition, exploitation, exploration and
production
Our diverse asset base is characterized by low-risk, repeatable
opportunities in well-established fields, which allows us to cost
effectively grow reserves and production
Seasoned management and technical team that creates value
by
rigorously applying new technology and new knowledge in
established fields and areas that are under-developed or over-
looked
Since 2007, increased proved reserves and production at 40% and
65% CAGR, respectively
Corporate Overview
High Quality & Diversified Asset Portfolio |
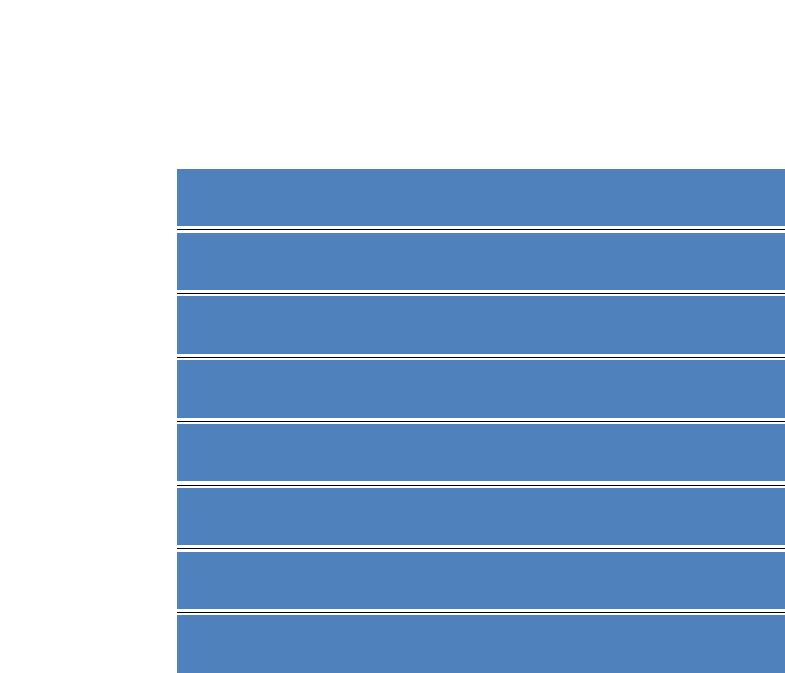 Low-Risk
Business Model Attractive Economics
Repeatability
Control Over Pace of Development
Available Rigs and Services
Proven Geology
Established Infrastructure
Stable Regulatory Environment
We create value in under-developed and over-looked areas
with the following characteristics
Multiple Pay Zones
4
Confidential |
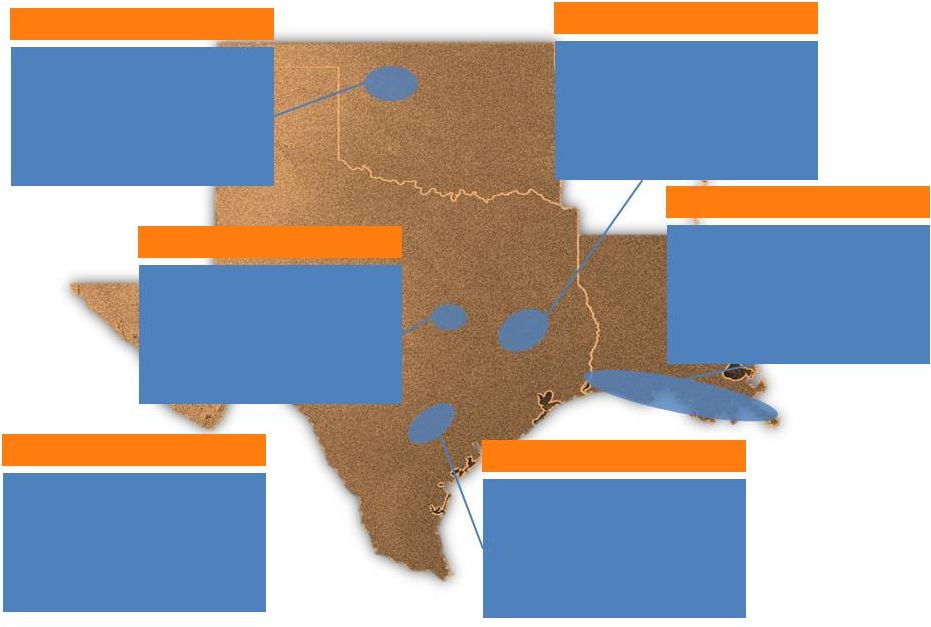 Alta
Mesa’s Focus Areas 5
Confidential
Reserve statistics and R/P metric as of Year End 2010 SEC Reserve Report
44 BCFE
$129.2
46%
62%
19.9x
946 BOEPD
48%
36,878
Reserves
PV10 ($MM)
% Gas (Reserves)
% Proved Developed
R/P
Q3 2011 Production
% Gas (Production)
Net Acreage
Oklahoma
East Texas
Hilltop
South Louisiana
Eagle Ford Shale
Other AMH Properties
93 BCFE
$111.9
100%
56%
5.5x
55.2 MMCFED
100%
16,998
Reserves
PV10 ($MM)
% Gas (Reserves)
% Proved Developed
R/P
Q3 2011 Production
% Gas (Production)
Net Acreage
Reserves
PV10 ($MM)
% Gas (Reserves)
% Proved Developed
R/P
Q3 2011 Production
% Gas (Production)
Net Acreage
63 BCFE
$153.9
74%
84%
11.2x
15.3 MMCFED
61%
41,594
Reserves
PV10 ($MM)
% Gas (Reserves)
% Proved Developed
R/P
Q3 2011 Production
% Gas (Production)
Net Acreage
76 BCFE
$229.2
72%
74%
6.1x
30.5 MMCFED
52%
36,505
Reserves
PV10 ($MM)
% Gas (Reserves)
% Proved Developed
R/P
Q3 2011 Production
% Gas (Production)
Net Acreage
47 BCFE
$67.7
58%
53%
14.9x
6.4 MMCFED
65%
36,627
Reserves
PV10 ($MM)
% Gas (Reserves)
% Proved Developed
R/P
Q3 2011 Production
% Gas (Production)
Net Acreage
3 BCFE
$13.2
13%
52%
6.5x
964 BOEPD
10%
3,611 |
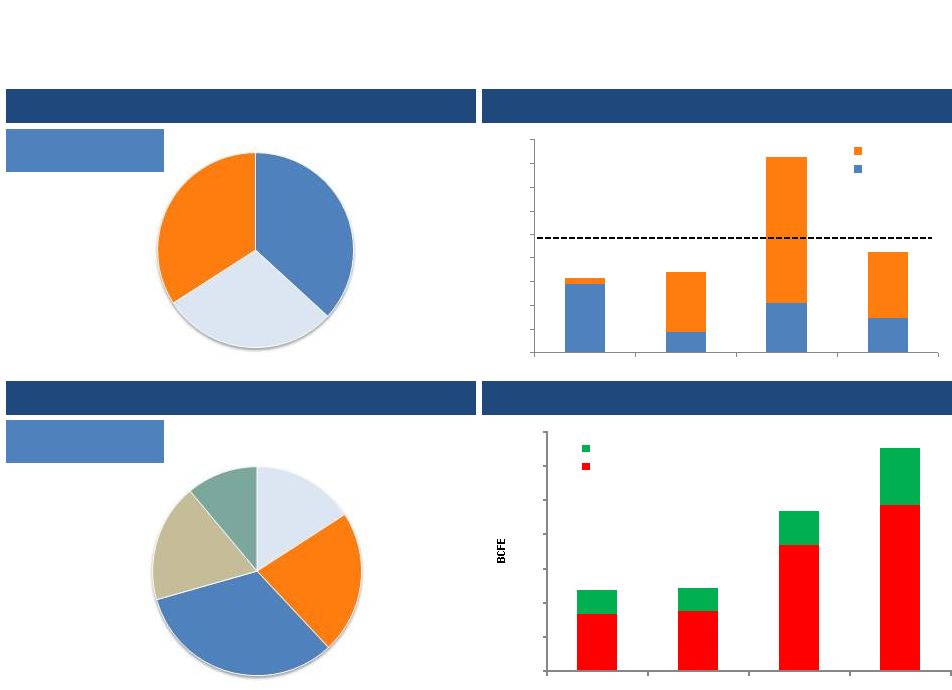 Proved
Reserves 1
Includes revisions.
Reserve statistics as of Year End 2010 SEC Reserve Report
6
Proved Reserves by Type (Bcfe)
Annual Reserve Additions as a % of Production
Proved Reserves by Commodity (Bcfe)
Proved PV-10 by Region ($MM)
PV-10 Value of $705.2
million
66% of Proved Reserves
are Developed
Confidential
0%
100%
200%
300%
400%
500%
600%
700%
800%
900%
2007
2008
2009
2010
Purchases
Extensions
Average Annual Reserve Replacement Rate of 495%
0
50
100
150
200
250
300
350
2007
2008
2009
2010
Oil
Gas
PDP
120 BCFE
37%
PDNP
95 BCFE
29%
PUD
111 BCFE
34%
Deep Bossier
$112 MM
East TX
$154 MM
South
Louisiana
$229 MM
Oklahoma
$129 MM
Other
$81 MM
1 |
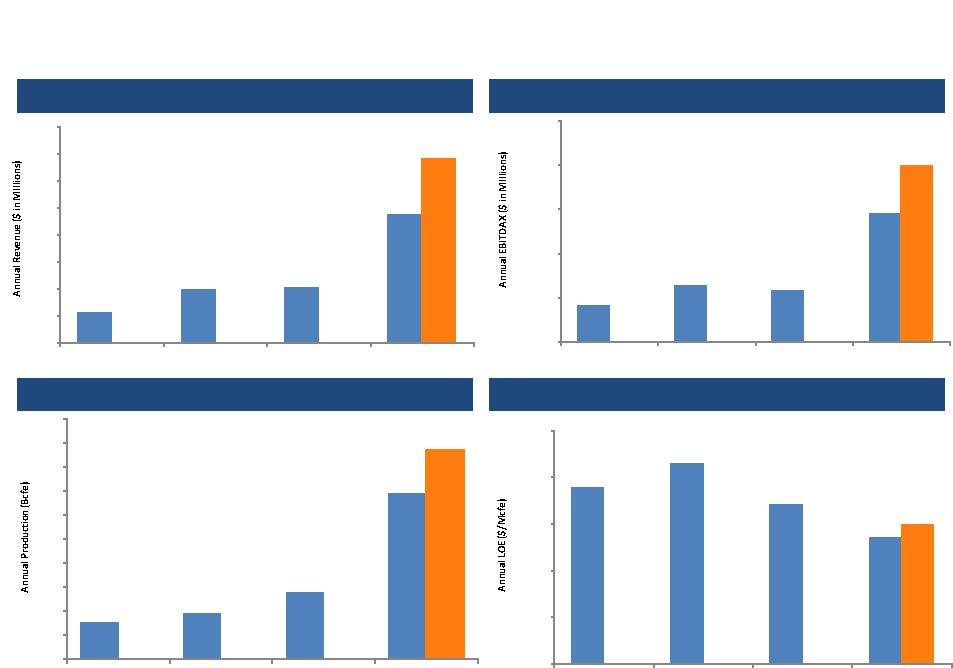 Revenue
1
Growth ($MM)
EBITDAX Growth ($MM)
Production Growth (Bcfe)
Lease and Plant Operating Expense ($/Mcfe)
Operating Efficiency & Profitable Growth
7
1
Excludes unrealized hedging gains and other revenues.
2
Pro forma adjustments for Meridian for entire 1H 2010.
Confidential
$56.7
$99.0
$102.3
$238.4
$341.9
0
50
100
150
200
250
300
350
400
2007
2008
2009
PF 2010 & Q3 2011
Annualized²
$40.9
$63.9
$58.2
$145.5
$200.0
$-
$50.0
$100.0
$150.0
$200.0
$250.0
2007
2008
2009
PF 2010 & Q3 2011
Annualized²
7.7
9.6
13.9
34.5
43.7
0
5
10
15
20
25
30
35
40
45
50
2007
2008
2009
PF 2010 & Q3 2011
Annualized²
$1.89
$2.15
$1.71
$1.35
$1.49
$-
$0.50
$1.00
$1.50
$2.00
$2.50
2007
2008
2009
PF 2010 & Q3 2011
Actual² |
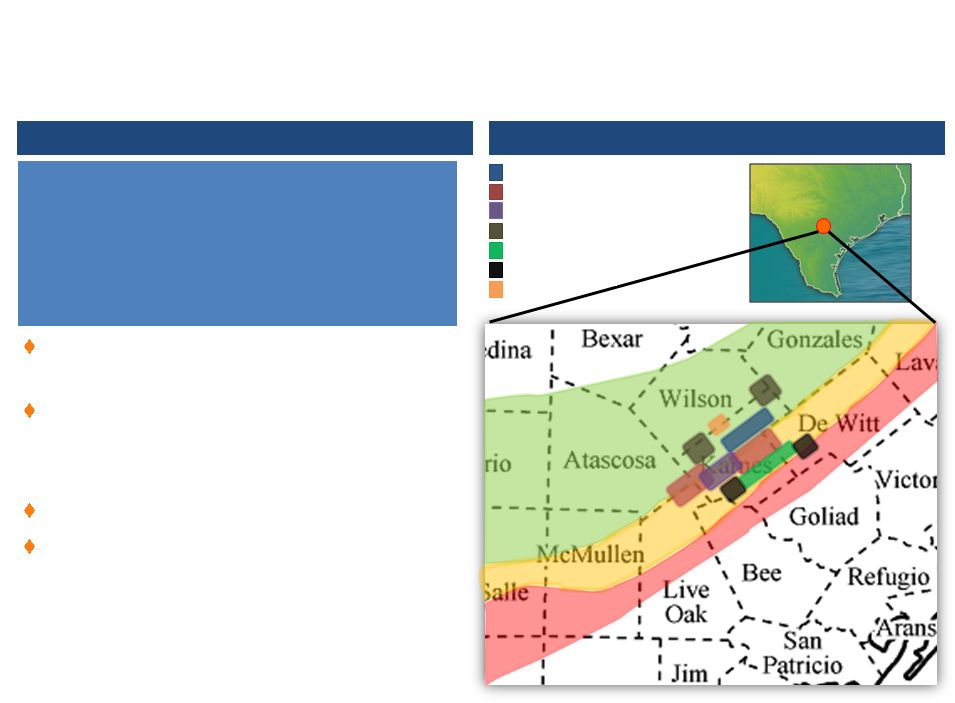
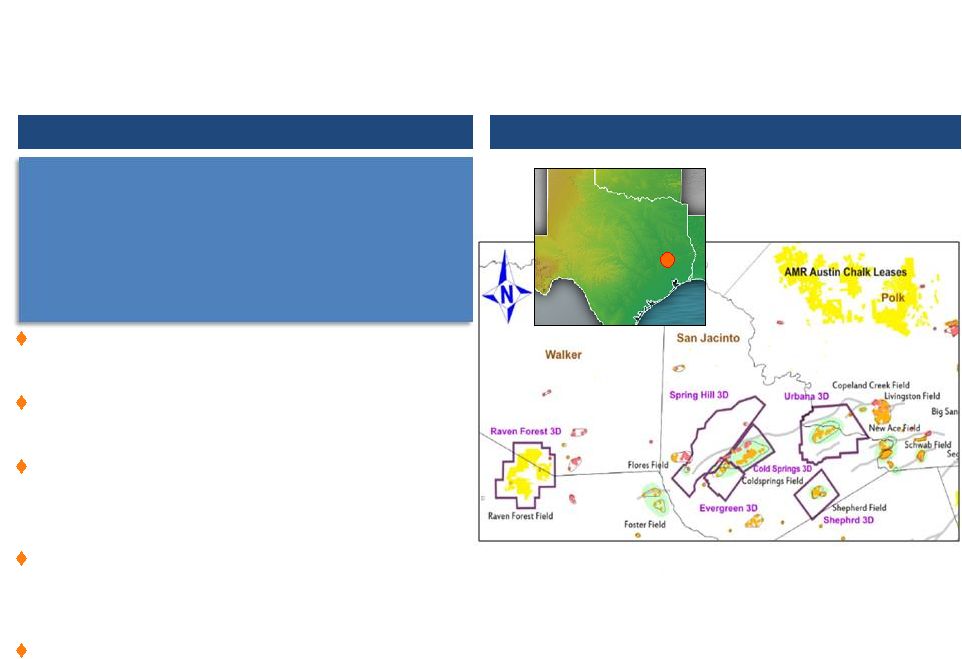 Liquids-rich gas from over 40 potential pay
sands in the Yegua and Wilcox formations
Anne Parsons field produces out of the Austin
Chalk formation
Low-risk expansions of well established fields
discovered in 1950s and 1960s by Amoco and
other large companies
Applying modern geological analysis and
engineering techniques to drive production and
reserve growth
Took over Cold Springs operations in Q2’2011
East Texas –
Overview
Increasing Reserves and Production from Established Fields
8
Confidential
Overview
1
East Texas Assets Map
1
Reserve data as of YE 2010 SEC reserve report
Proved Reserves
PV10 ($MM)
% Gas (Reserves)
% Proved Developed
R/P
Q3 2011 Production
% Gas (Production)
Net Acreage
63 BCFE
$153.9
74%
84%
11.2x
15.3 MMCFED
61%
41,594 |
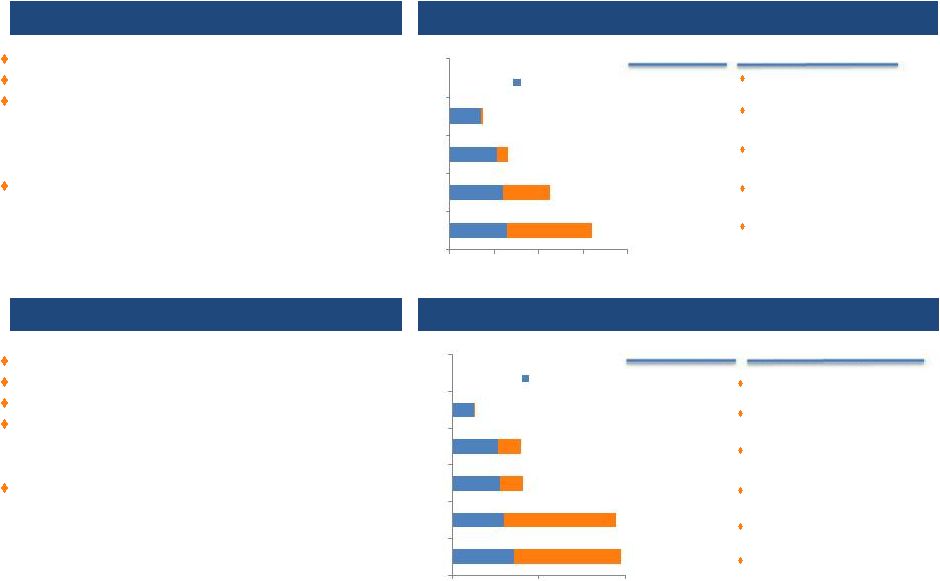 Urbana
– 3P EUR (Bcfe)
Cold Springs –
3P EUR (Bcfe)
Urbana –
Overview
Cold Springs –
Overview
Urbana and Cold Springs Field
Source: Internal reserve report.
9
Confidential
Wilcox Discovery
Famcor Purchase
Purchased remaining 50% of
Famcor East CS WI; Rediscover
7900’
oil sand
Urbana A-8 confirms low-
resistivity pay
Alta Mesa purchases 50%
Famcor, other WI
West Cold Springs extension
proved
Milestones
*Does not include oil/condensate, 60 BO/MM
Reserves (BCF)
Cum
EUR*
0
0
25
27
53
80
55
82
60
189
72
195
Known structure with multiple pay zones
Like Urbana, but larger with more development potential
Acquired > 50% working interest in past three years
Initiated development drilling and recompletions
–
Very low-resistivity pay (<0.8 ohms)
–
Modern logging technology and fracture stimulations
Field re-development and expansion
–
Confirmed 1,500-acre western field extension in multiple
Wilcox Sands
–
3D survey planned to identify Yegua potential and
delineate the Wilcox formation
–
19 PUDs documented
Known structure with multiple pay zones
Field re-development since buying Famcor WI
Recent advances have led to increased reserves
–
Low resistivity pay: modern logging
–
Fracture stimulations
–
Gas lifting and lowering surface system pressure
New 3D data will drive additional development
–
One of four new fault blocks to be tested in Dec’2011
–
Deeper pay potential to be tested in 2012-2013
Wilcox Discovery
Amoco sale to Famcor & Alta
Mesa
Urbana A-8 confirms low-
resistivity pay
Alta Mesa drilling confirms
added pay
Urbana 3-D complete
Milestones
*Does not include oil/condensate, 25 BO/MM
0
0
35
37
53
65
60
113
64
160
Reserves (BCF)
Cum
EUR*
0
50
100
150
200
1951
1989
2005
2008
2009
BCF
Cumulative to Date
0
100
200
1951
1989
2005
2007
2009
2011
BCF
Cumulative to Date |
 Overview
1
Oil Zones Actively Being Pursued Along Trend
2
Hilltop –
Overview
Primary objective is lower Bossier sand between
15,000 and 20,000 feet deep
Field is highly productive with multiple pays, low
F&D and low LOE
Value derived through active participation with
Operator on engineering, operations and
geology/geophysics
–
EnCana operates approximately 85% of Alta
Mesa’s production
Large Position in a Highly Prolific, Expanding Play
10
Confidential
1
Reserve data as of YE 2010 SEC reserve report
2
Only HZL wells with permitted target of Woodbine and Eagle Ford formations
Permitted
HZL
Wells¹
(Since
January
1,
2010)
Producing
HZL
Wells¹
(Drilled
Post
-
January
1,2010)
93 BCFE
$111.9
100%
56%
5.5x
55.2 MMCFED
100%
16,998
Proved Reserves
PV10 ($MM)
% Gas (Reserves)
% Proved Developed
R/P
Q3 2011 Production
% Gas (Production)
Net Acreage |
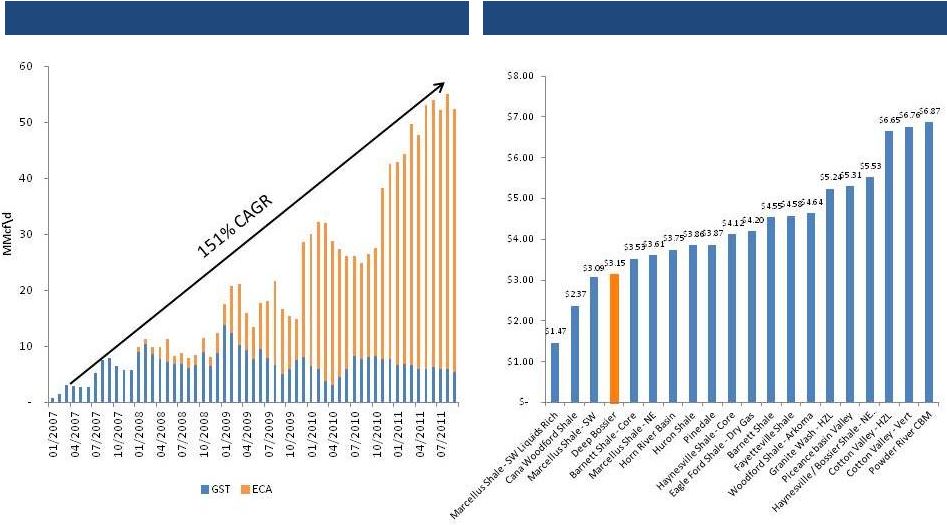 Hilltop Net
Production by Operator (MMcf/d) Prolific, Low Cost Gas Play
Major
North
American
Gas
Basin
Breakevens
¹
11
Confidential
Additional potential in other zones and application of horizontal drilling
Source: Credit Suisse. Data excludes land costs. Deep Bossier breakeven based on
AMH analysis. 1 |
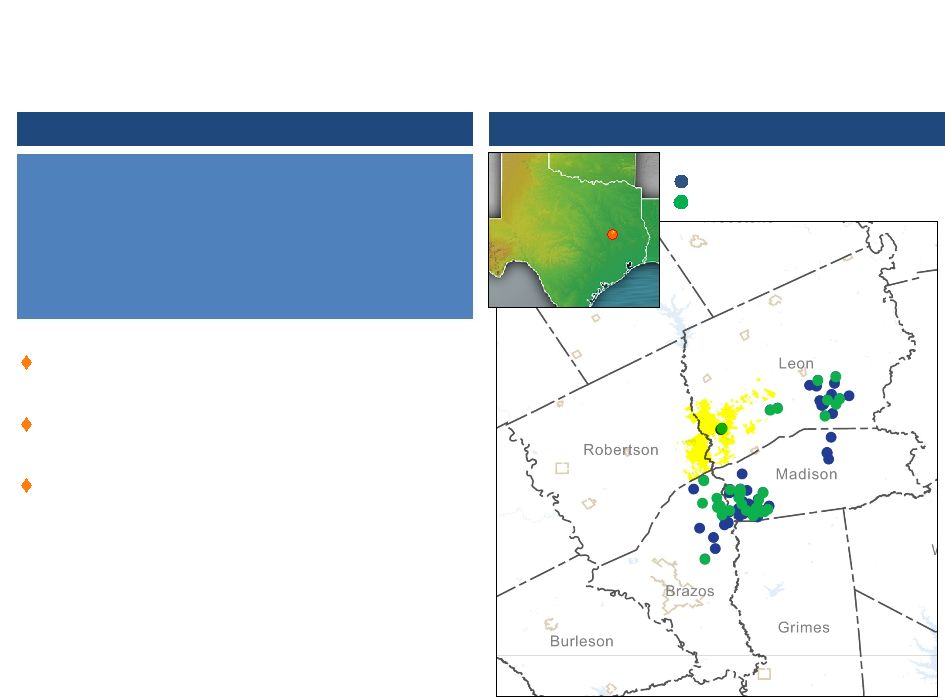
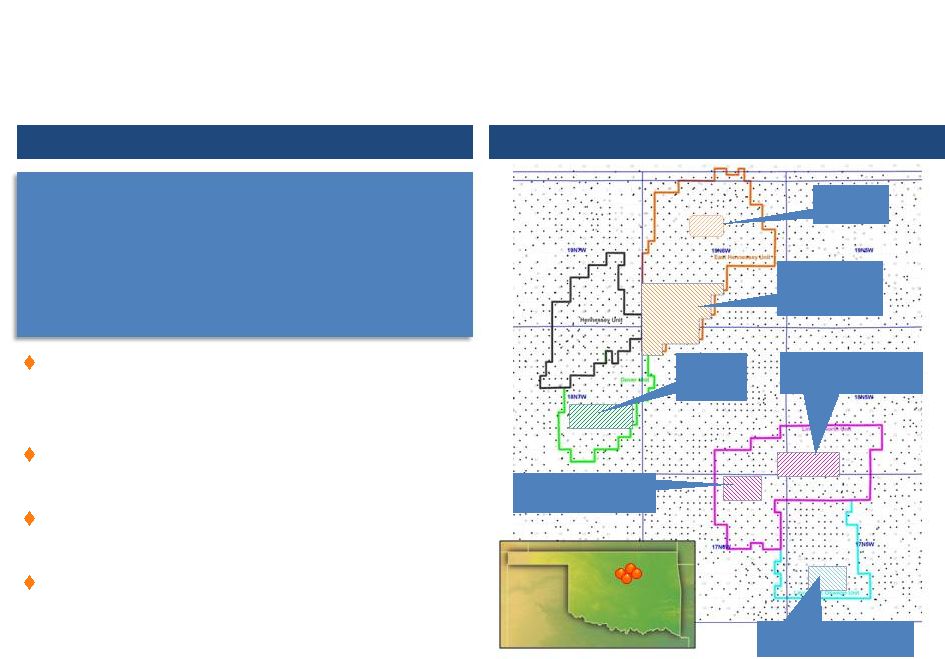 Overview
1
Oklahoma Activity Map
Oklahoma –
Current Activity
Long-lived, Stable Oil Production
12
Confidential
East Hennessey
Waterflood
Expansion
Re-Drill
Locations
Lincoln North Unit
Waterflood Expansion
Dover Unit
Infill Drilling
Lincoln North Unit
Infill Drilling
Lincoln Southeast
Waterflood Expansion
Principal assets are large fields developed by
Conoco, Texaco and Exxon on 80-acre spacing,
unitized and waterflooded
Oil dominated, long life assets with shallow
declines and steady cash flow
Potential to more than double production and
reserves with down-spacing and waterflood
Key area players include: Chaparral, Chesapeake
and Devon
1
Reserve data as of YE 2010 SEC reserve report
Proved Reserves
PV10 ($MM)
% Gas (Reserves)
% Proved Developed
R/P
Q3 2011 Production
% Gas (Production)
Net Acreage
7.3 MMBOE
$129.2
46%
62%
19.9x
946 BOEPD
48%
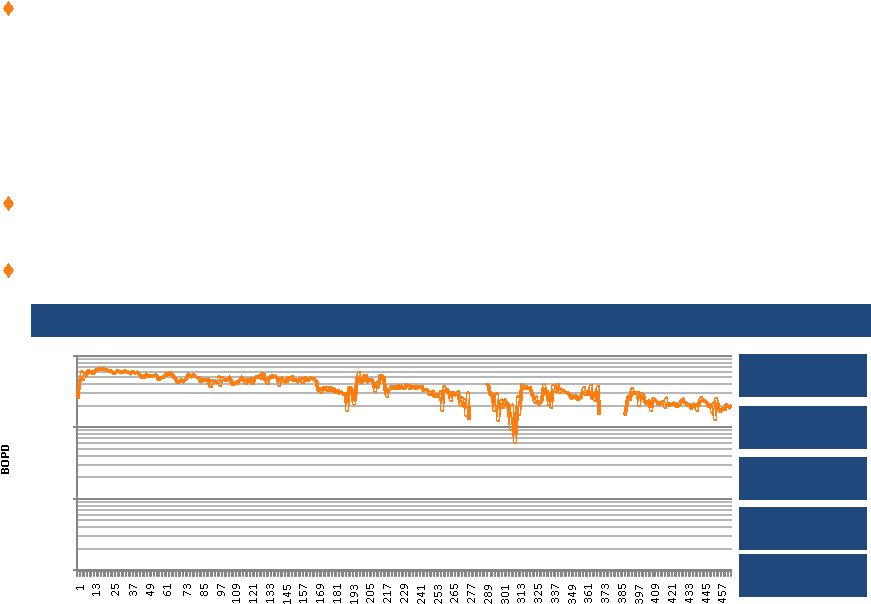
36,878 |
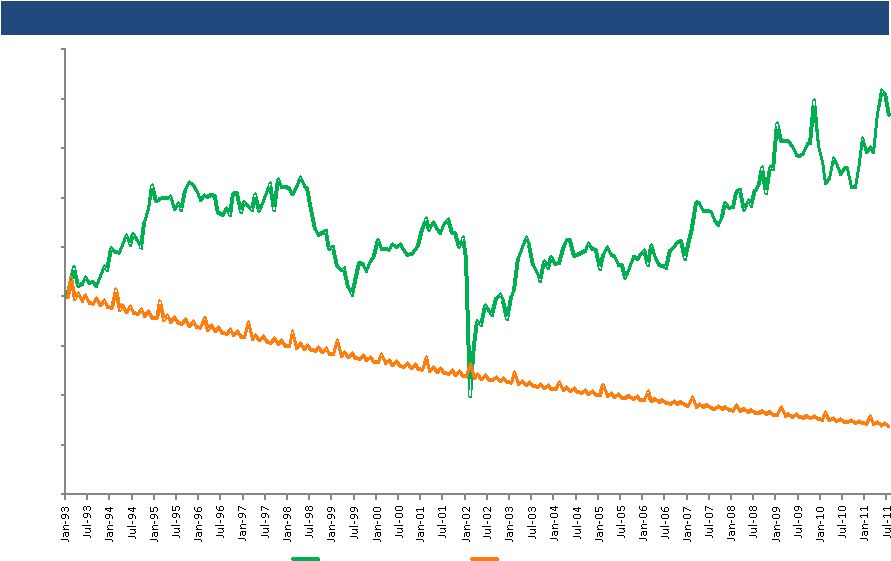 Oklahoma
Production Growth 13
Confidential
Historic 8/8ths Field Production (BOEPD)
Oklahoma Assets Producing at Multi-Decade High
-
200
400
600
800
1,000
1,200
1,400
1,600
1,800
Actual Field Production
Projected Field Decline
Wedge Equates to ~4
MMBOE of added
production since AMH took over assets |
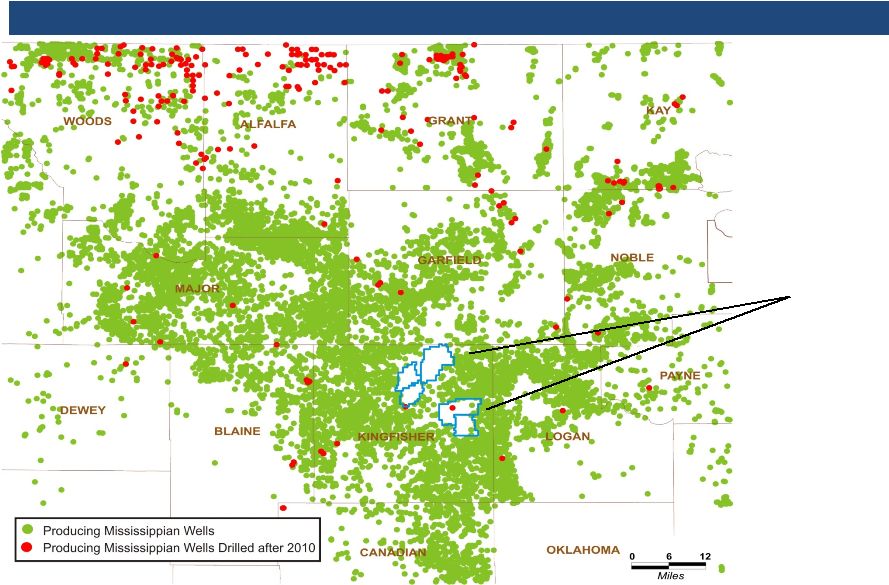 Regional
Development of Mississippian Formation Wells Targeting Mississippian Formation
AMH Currently Identifying and Testing Mississippi Locations on its Acreage
14
Confidential
AMH
Acreage |
 Eagle Ford
Shale – Overview
Significant Acreage Position Concentrated in Karnes County
15
Confidential
Karnes County is industry recognized core area
of Eagle Ford Trend
120 well development program underway with
operator Murphy; 2 rigs currently operating
•
Based on 160 acre spacing
Infrastructure & facilities to handle production
Optimizing initial rates to maximize ultimate
recovery
1
Reserve data as of YE 2010 SEC reserve report
Proved Reserves
PV10 ($MM)
% Gas (Reserves)
% Proved Developed
R/P
Q3 2011 Production
% Gas (Production)
Net Acreage
Enduring Resources
PXP
AMH / Murphy
Conoco
Marathon
EOG
Pioneer
Eagle Ford Map
Overview
1
0.6 MMBOE
$13.2
13%
52%
6.5x
964 BOEPD
10%
3,611 |
 Production and
EUR highly sensitive to drawdown –
Early EFS wells exhibit severe well damage from high drawdown
–
Theoretically, high drawdown may be “collapsing”
the near well bore frac zone, crushing proppant, and limiting connectivity to
the reservoir
–
Since mechanism of failure is mechanical, it is unlikely that damaged wells can be repaired by
restricting the rate once the damage is done
–
Recent presentations/discussions by PetroHawk, Pioneer, and Chesapeake support this
theory Our wells demonstrate positive effects with restricting rate early in well
life –
Post high IP’s, wells experience severe decline; lower IP’s equate to lower
decline Restricting rate has flattened decline and potentially enhanced EUR
Eagle Ford Shale –
Maximizing EUR and Profitability
16
Confidential
Time Normalized Average AMH Karnes County Oil Well Decline Profile
30 Day Average Rate
670 BOEPD
60 Day Average Rate
652 BOEPD
90 Day Average Rate
626 BOEPD
120 Day Average Rate
598 BOEPD
150 Day Average Rate
588 BOEPD
1
10
100
1,000
Days |
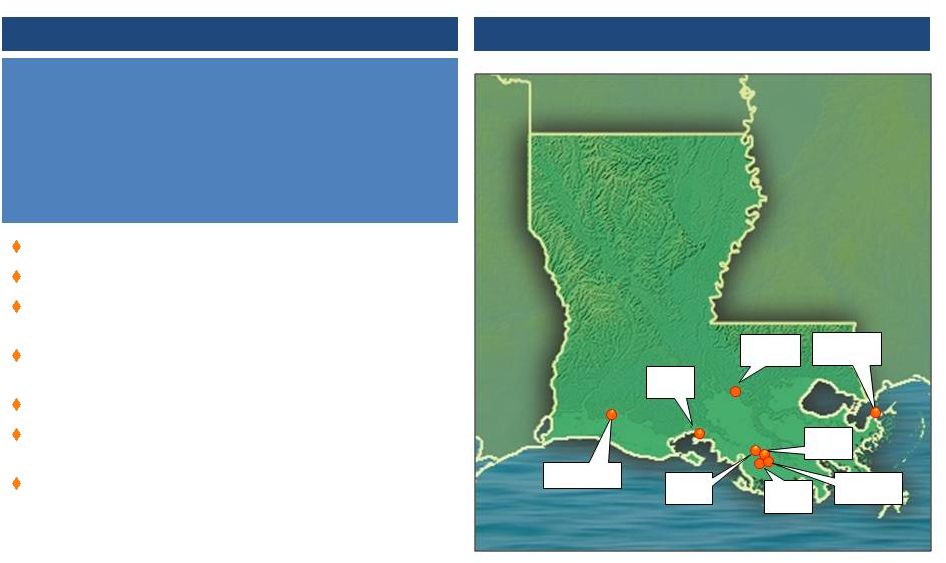 South
Louisiana – Overview
Long-standing focus area of Alta Mesa team
Primary fields are South Hayes and Weeks Island
Historically prolific areas originally developed by Shell,
Texaco and Exxon
Significant multi-pay opportunities with oil and liquids
rich gas targets
Multiple low risk exploration and development targets
Outstanding reservoir quality that yields high rates,
quick payouts and strong ROI
Expect to materially increase PDP, PDNP and PUD
reserves through rigorous analysis and development of
fields
Historically Prolific Area Originally Developed by Majors
17
Confidential
1
Data is inclusive of all assets in Louisiana.
2
Reserve data as of YE 2010 SEC reserve report
Proved Reserves
PV10 ($MM)
% Gas (Reserves)
% Proved Developed
R/P
Q3 2011 Production
% Gas (Production)
Net Acreage
76 BCFE
$229.2
72%
74%
6.1x
30.5 MMCFED
52%
36,505
Overview
1,2
South Louisiana Assets
Weeks
Island
Biloxi
Marshland
South Hayes
Ramos
Turtle
Bayou
Humphreys
St Gabriel
Gibson |
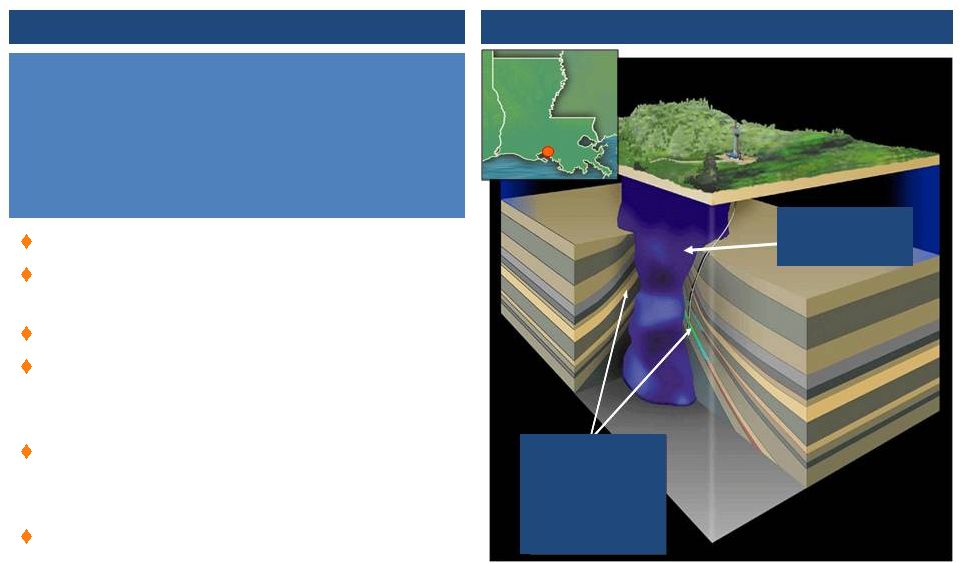 Weeks Island
- Overview
High Value Oil Field with Significant Upside Potential
18
Confidential
Discovered by Shell in 1945
Significant oil field characterized by low-risk,
multi-pay targets
Continuous 2H’2011 drilling program underway
18 PDNP and 13 PUD locations booked, with
multiple additional locations identified for 20+
MMBOE potential
Drilling targets developed through intense,
multi-discipline analysis of geologic,
geophysical, and engineering data
Ability to increase production and lower costs
by optimizing facilities
Proved Reserves
PV10 ($MM)
% Gas (Reserves)
% Proved Developed
R/P
Q3 2011 Production
% Gas (Production)
Net Acreage
3.0 MMBOE
$81.1
30%
57%
4.9x
1,923 BOEPD
5%
5,256
Oil & Gas
bearing
sediments
Piercement
Salt Dome
Overview
1
Weeks Island: Multiple Oil Pay Zones
Reserve data as of YE 2010 SEC reserve report
1 |
 Weeks Island
Development 19
Confidential
Development Drilling
Exploration Drilling
Secondary Recovery
Facility Optimization
Exploitation Opportunities
Drilling Results -
Past 36 Months
Well Costs
($MM)
IP
(BOEPD)
Current Rate
(BOEPD)
EUR
(MBOE)
Goodrich Cocke #6ST
$5.21
250
80
162
Goodrich Cocke #7ST
$3.30
800
800
969
State Weeks Bay #15ST
$4.20
350
150
269
Goodrich Cocke #5
$2.76
150
70
82
State Weeks Bay #19ST
$3.34
600
1180
65
State Weeks Bay #20ST
$2.24
250
50
77
Goodrich #25ST
$2.23
200
65
164
Myles Salt #34ST
$2.94
350
350
745
Goodrich Cocke #9*
$4.80
800
800
1825
Myles Salt #45
$0.31
500
800
832
*Production number is estimate, awaiting completion.
Historic Field Production (BOPD)
Cumulative Field Production of 280 MMBO & 1 TCF
Exxon / Shell
Stone / Meridian
AMH
-
1,000
2,000
3,000
4,000
5,000
6,000
7,000
8,000
9,000
10,000
11,000 |
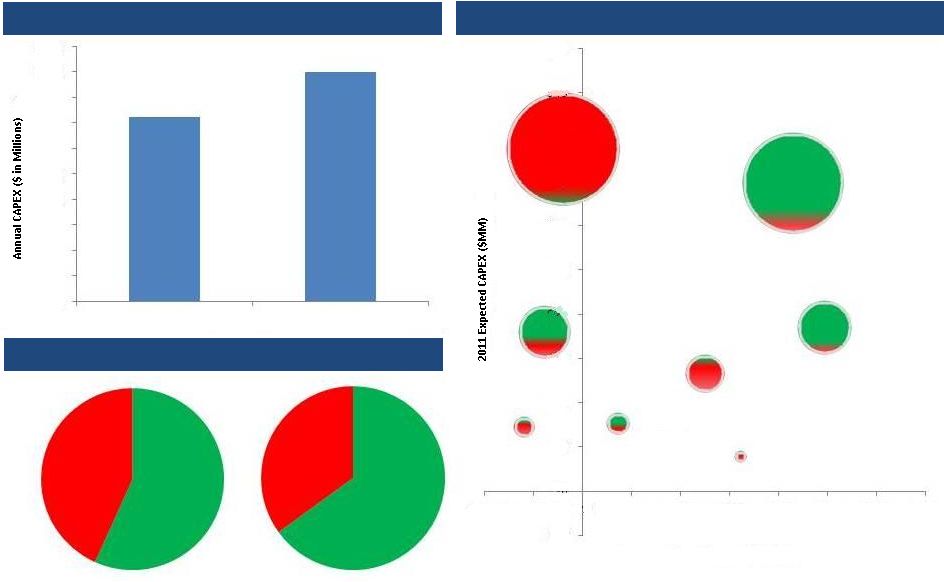 2011 CAPEX
Forecast Planned Drilling & Recompletion CAPEX by Field ($000s)
2010E
2011E
20
Confidential
%
Liquids
57%
% Gas
43%
%
Liquids
67%
% Gas
33%
$144
$180
$0
$20
$40
$60
$80
$100
$120
$140
$160
$180
$200
2010E
2011E
Other
Other SLA
Oklahoma
Other South
Texas
Weeks Island
Eagle Ford
East Texas
Deep Bossier
($5)
$0
$5
$10
$15
$20
$25
$30
$35
$40
$45
-100%
-50%
0%
50%
100%
150%
200%
250%
300%
350%
Projected Annual CAPEX
CAPEX Focus
Year over Year Change in CAPEX
$50 |
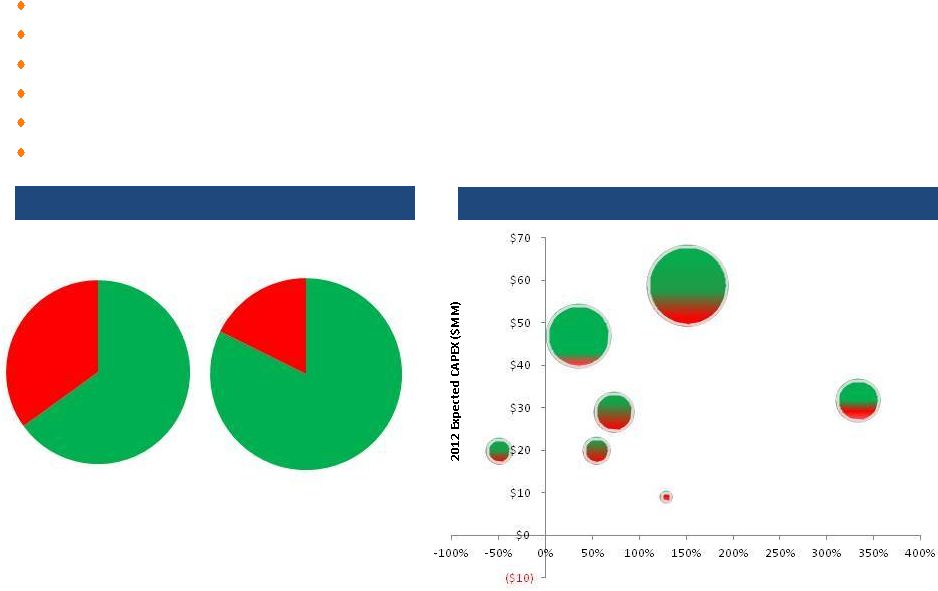 2012 CAPEX
Plan Planned Drilling & Recompletion CAPEX by Field ($000s)
Manage to cash flow neutral position, with total Capex for the year expected to range between
$220 and $240 million Significant HBP positions in core areas allow management to
accelerate / defer projects as economics dictate Over 80% of 2012E drilling and
recompletion dollars directed to oil and liquids rich properties Capital
reallocated
from
“gas
only”
Deep
Bossier
to
oily
prospects
at
Weeks
Island,
Oklahoma,
East
Texas
and
Eagle
Ford
Oil and liquids expected to generate greater than 35% of production (equivalent basis) in
2012 Multi-year drilling inventory with over 125 identified PUD locations
CAPEX Focus
21
Confidential
Continued Focus on High Margin Liquids Rich Projects
2011E
2012E
Other
SLA
Oklahoma
Other South
Eagle Ford
East Texas
Year over Year Change in CAPEX
%
Liquids
67%
% Gas
33%
% Gas
82%
%
Liquids
18%
Hilltop
Texas |
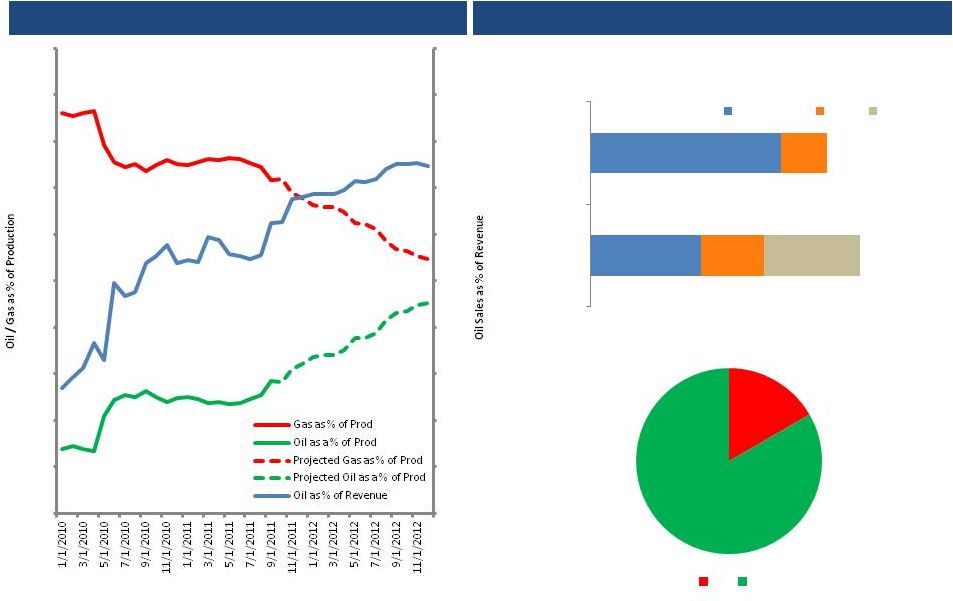 Production
Shift from Gas to Oil Historic and Projected Production Mix
Oil Production is Expected to Grow from 14% of Production to >40% Over Next 18 Months
Confidential
22
Future Oil Growth Driven by Weeks Island and Eagle Ford
Material Oil Reserves Remain to be Developed
Production from these Fields is Primarily Oil
50% Proved Developed
52% Proved Developed
0%
10%
20%
30%
40%
50%
60%
70%
80%
90%
100%
0%
10%
20%
30%
40%
50%
60%
70%
80%
90%
100%
Gas
Oil
83%
17%
Eagle Ford
Weeks Island
Total Proved
PROB
POSS |
 23
Confidential
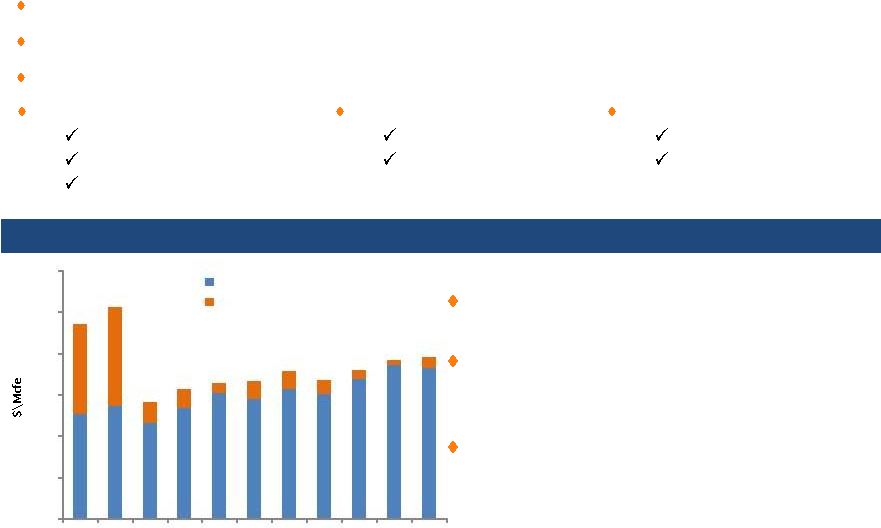
Balance Sheet Protection, Active Management of Portfolio
Management of Commodity Price Risk
Cost-effectively limit downside risk, while minimizing cash outlays
Active management across a five-year window
Tactically switching portion of WTI for Brent due to high correlation of LLS / Brent
Portfolio
Swaps
Put Spreads, Call Spreads
3-Way Collars
Natural Gas
Henry Hub
HSC Basis
Crude oil
Brent
WTI
Strong Track Record of Using Hedges to Maximize Profitability
Since 2009, hedges have increased revenue by
$67mm or 13%
As of November 1
st
, AMH’s hedge book ensures a
minimum of $545mm of revenue over the next 5
years
Over 55% of 2012 expected production is hedged
at an average $8.68/mcfe
$0
$2
$4
$6
$8
$10
$12
1Q09
2Q09
3Q09
4Q09
1Q10
2Q10
3Q10
4Q10
1Q11
2Q11
3Q11
Avg Sales Price (per Mcfe) Unhedged
Incremental Sales Gain due to Hedges |
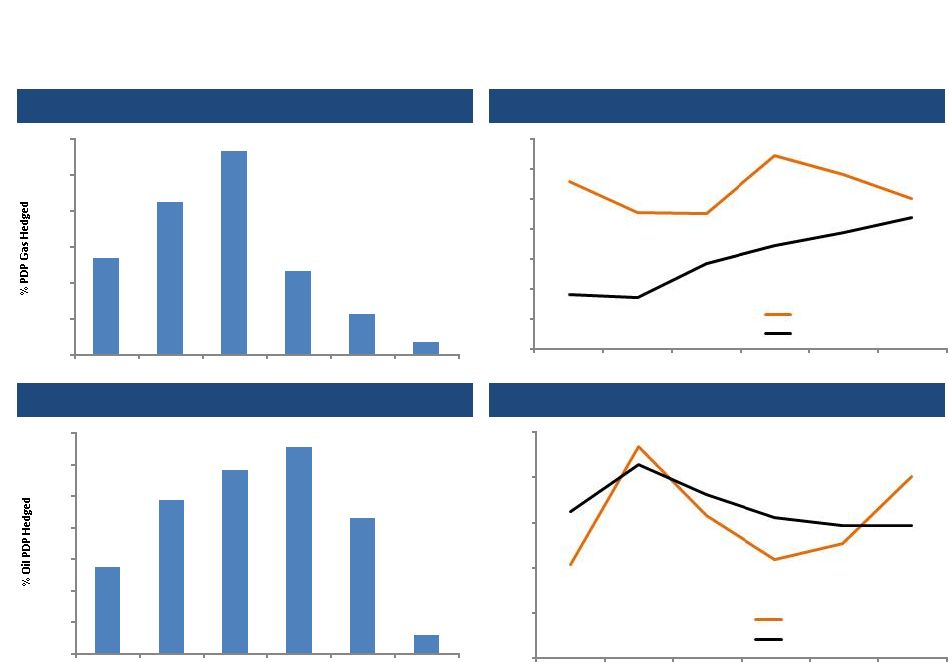 % of PDP
Hedged - Natural Gas
Average Floor Price –
Natural Gas
Note: Hedge positions as of 12/2/11; NYMEX strip as of 11/25/11.
2011 calculations are for Oct 1, 2011 forward.
Commodity Price Risk Management
Confidential
24
% of PDP Hedged -
Oil
Average Floor Price –
Oil
55%
97%
116%
131%
86%
12%
0%
20%
40%
60%
80%
100%
120%
140%
Q4'2011
2012
2013
2014
2015
2016
$85.28
$98.39
$90.69
$85.81
$87.57
$95.00
$75
$80
$85
$90
$95
$100
Q4'2011
2012
2013
2014
2015
2016
AMH Average Floor Price
NYMEX as of 11/25/2011
54%
85%
113%
46%
22%
7%
0%
20%
40%
60%
80%
100%
120%
Q4'2011
2012
2013
2014
2015
2016
$5.80
$5.27
$5.25
$6.23
$5.91
$5.50
$3.00
$3.50
$4.00
$4.50
$5.00
$5.50
$6.00
$6.50
Q4'2011
2012
2013
2014
2015
2016
AMH Average Floor Price
NYMEX as of 11/25/2011 |
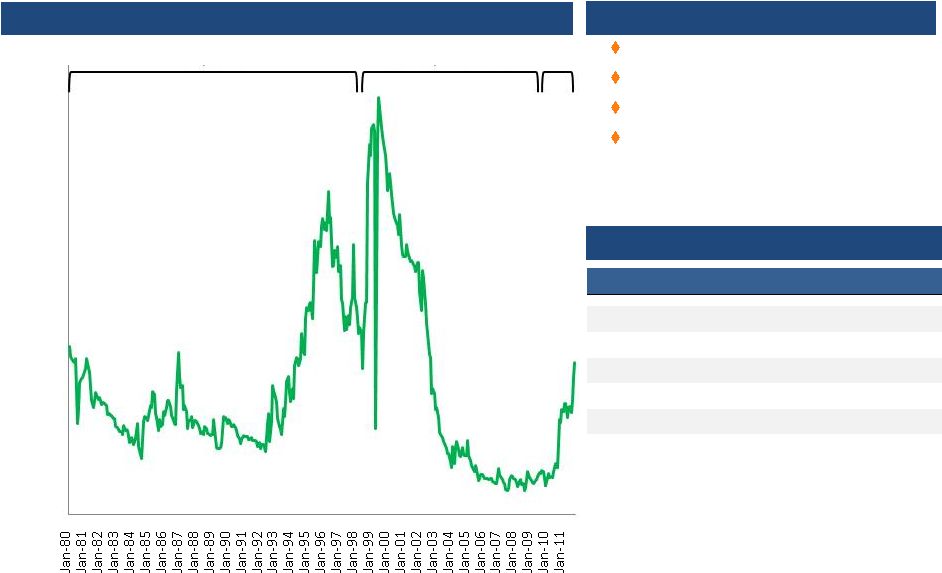
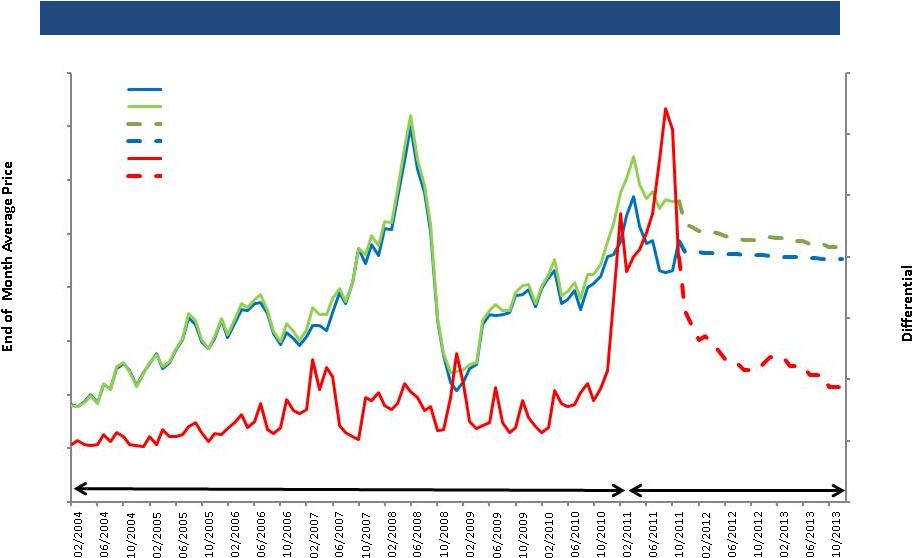 LLS Basis
Trading at Premium to WTI Historic and Forward LLS vs WTI Spread
69% of Q3 oil production indexed against LLS, resulting in $12.51 spread to WTI
$5
$0
$5
$10
$15
$20
$25
$30
$0
$20
$40
$60
$80
$100
$120
$140
$160
25
Confidential
WTI
LLS
LLS (Forecast)
WTI (Forecast)
Spread
Spread (Forecast)
2004 Through
2010
Average
Differential of $1.95/BBL
2011 Forward
Average
Differential of
$10.07/BBL |
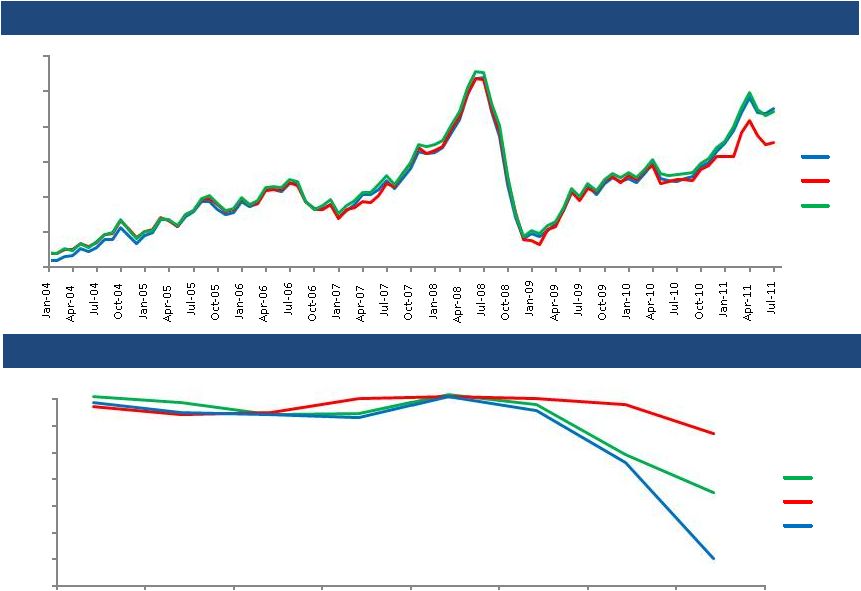 Divergence in
Historic LLS Correlations from WTI to Brent 26
Confidential
Historic Prices
Price Correlation
$25
$45
$65
$85
$105
$125
$145
Brent
WTI
LLS
86%
88%
90%
92%
94%
96%
98%
100%
2004
2005
2006
2007
2008
2009
2010
2011
WTI:LLS
Brent:LLS
Brent:WTI |
 Strong
Management Team
with Proven
Track Record
Average 25+ years industry and technical experience
Successfully
completed
over
$250mm
of
acquisitions
at
$1.27/mcfe
1
Since 2007, increased proved reserves and production at 40% and 65%
CAGR, respectively
Operational
Control and Low
F&D Costs
83%
of
wells
are
controlled
by
operations
3
All-source 4-year avg. F&D of $2.14/Mcfe compares favorably to
peers Less than 9% of core property leases expire by end of 2011
Low-Risk &
Multi-Year Drilling
Inventory
Multi-year drilling inventory with 125 current PUD locations
Significant positions in Deep Bossier play, East Texas Wilcox and South
Louisiana; upside potential from Eagle Ford shale position
72% of PDP volume hedged through 2016
High Quality &
Diversified
Asset Portfolio
Diverse asset base with significant drilling opportunities
25%
of
Q3’11
production
from
oil
and
liquids
(53%
of
Q3’11
revenue
2
)
2010 LOE of $1.37/mcfe
Key Considerations
27
1
Statistic for 2007 through 2010.
2
Excludes unrealized hedging gains and other revenues.
3
Excludes Deep Bossier resource play which constitutes approximately 16% of AMH’s
PV-10 value and where EnCana is the principal operator. Confidential
|
 Hal
Chappelle, President & CEO Phone: 281-943-1353
Email:
hchappelle@altamesa.net
Michael McCabe, Vice President & CFO
Phone: 281-530-0991
Email:
mmcabe@altamesa.net
Lance Weaver, Investor Relations Manager
Phone: 281-943-5597
Email:
lweaver@altamesa.net
www.altamesa.net
Contact Information
28
Confidential |