Attached files

This presentation contains Forward Looking Statements and other information designed to convey
our projections and expectations regarding future results. There are a number of factors which
could cause our actual results to vary materially from those projected in this presentation. The
principal risk factors that may cause these differences are described in various documents we file
with the Securities and Exchange Commission, such as our Current Reports on Form 8-K, and our
regular reports on Forms 10-Q and 10-K, particularly in “Item 1A, Risk Factors.” Please review
this presentation in conjunction with a thorough reading and understanding of these risk factors.
We especially identify statements concerning our acquisition of American Physicians Service
Group (NASDAQ: AMPH) as Forward Looking Statements and direct your attention to
filings on Forms 10K and 10Q for a discussion of risk factors pertaining to this transaction
and subsequent integration into ProAssurance.
Group (NASDAQ: AMPH) as Forward Looking Statements and direct your attention to
filings on Forms 10K and 10Q for a discussion of risk factors pertaining to this transaction
and subsequent integration into ProAssurance.
This presentation contains Non-GAAP measures, and we may reference Non-GAAP measures in
our remarks. A reconciliation of these measures to GAAP measures is available in our latest
quarterly news release, which is available in the Investor Relations section of our website,
www.ProAssurance.com, and in the related Current Reports on Form 8K disclosing that release.
our remarks. A reconciliation of these measures to GAAP measures is available in our latest
quarterly news release, which is available in the Investor Relations section of our website,
www.ProAssurance.com, and in the related Current Reports on Form 8K disclosing that release.
FORWARD LOOKING STATEMENTS
1
NON-GAAP MEASURES

ProAssurance Overview
We are the only pure-play, publicly-traded
medical professional liability (MPL)
insurance company in America
medical professional liability (MPL)
insurance company in America
This is ProAssurance
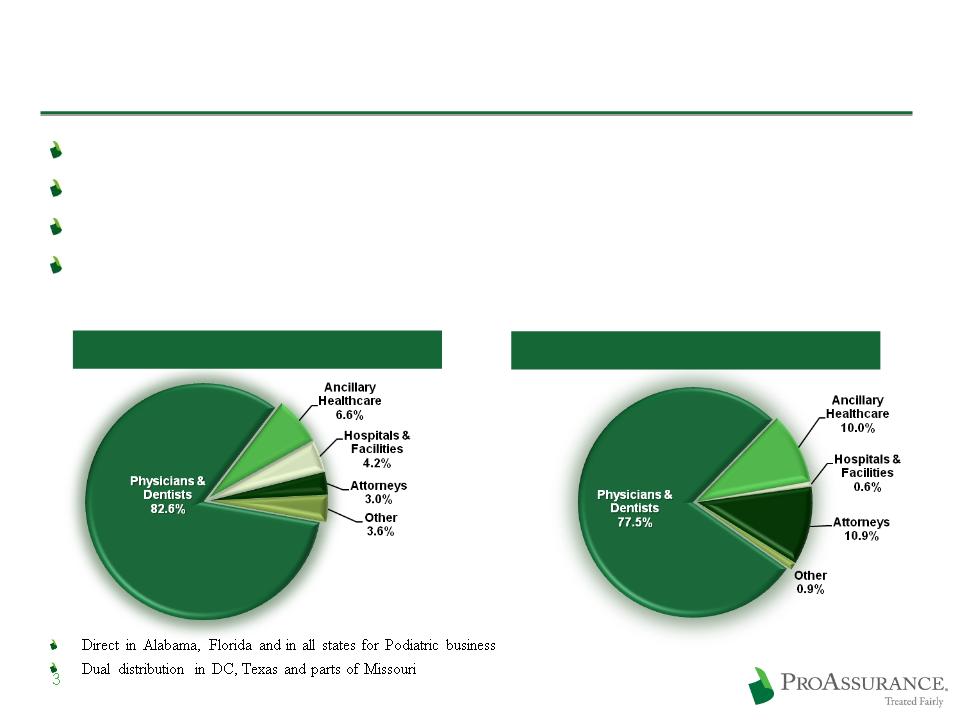
Specialty insurance company primarily writing medical professional liability
Founded in 1976, public since 1991
Historical focus on small groups, solo practitioners and healthcare facilities
Evolving strategy is successfully adding business at both ends of the risk
spectrum as the delivery of healthcare changes
spectrum as the delivery of healthcare changes
Premium & Policyholder Data is YTD, September 30, 2011
Subject to Rounding
YTD 2011 Policyholders: ~71,600
2011 YTD Premium: $451 million
Direct: 34% / Agents: 66%

This is What Differentiates our Company
4
Our commitment to Treated Fairly
Unwavering dedication to the defense of
non-meritorious lawsuits
non-meritorious lawsuits
Allows our insureds the right to an unfettered defense of
their claims where permitted by law
their claims where permitted by law
Steadfast dedication to in-depth underwriting and
adequate pricing
adequate pricing
An unsurpassed level of customer service
Unquestioned financial strength consistently
delivering value for insureds and shareholders
delivering value for insureds and shareholders
Total Assets have reached $5 billion
Shareholders’ Equity has topped $2.0 billion
Total Reserves have reached $3 billion
Market Cap : ~$2.4 billion
This is What We Have Achieved
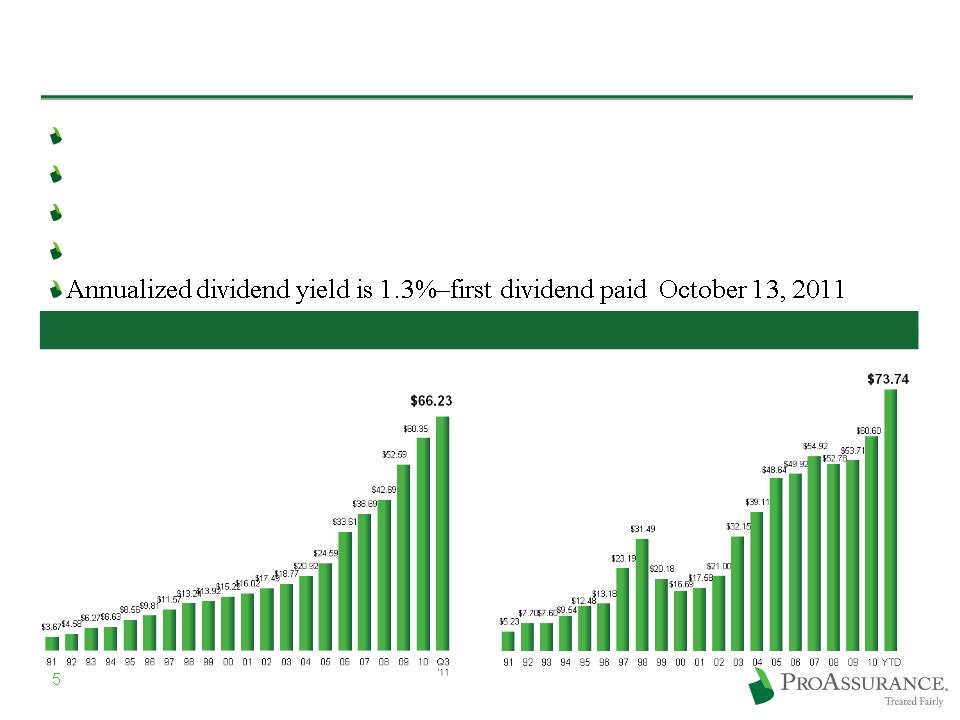
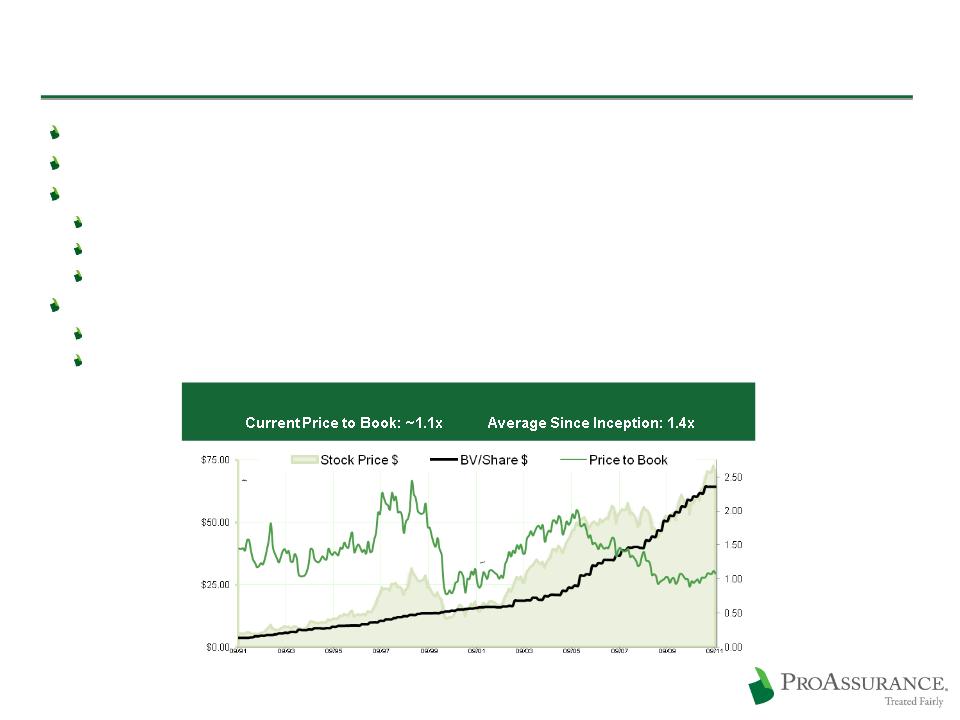
Historical Book Value Per Share
Inception to 9/30/11
CAGR: 16%
CAGR: 16%
Cumulative:1706%
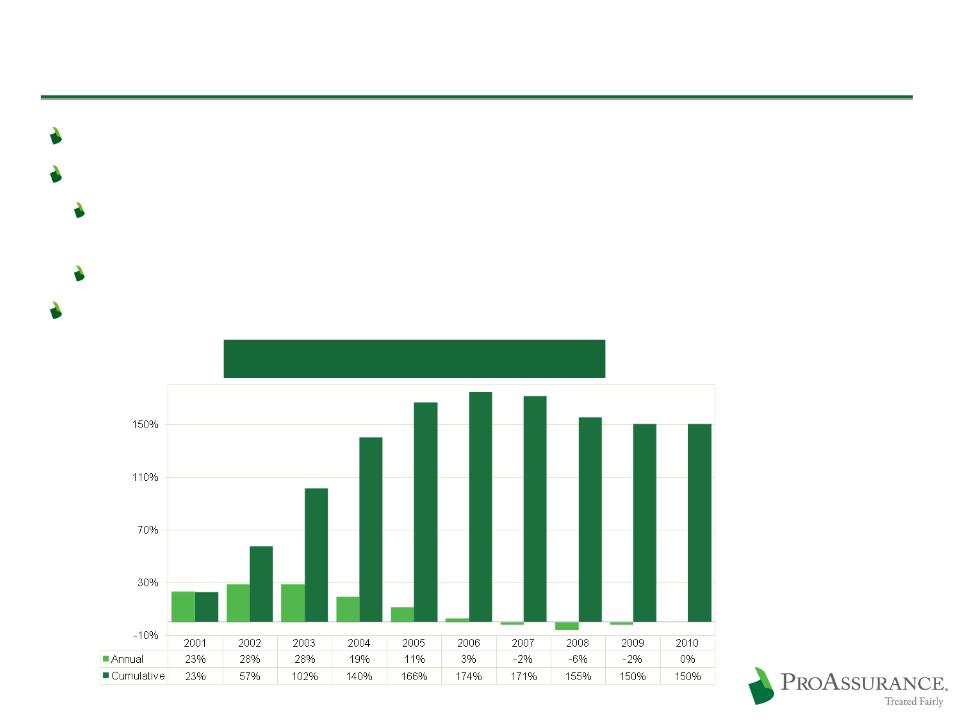
10 Year Summary (2001 -2010)
CAGR: 15%
CAGR: 15%
Cumulative: 297%
Historical Stock Price (to 11/23/11)
Inception to 11/23/11
CAGR: 14%
CAGR: 14%
Cumulative: 1310%
10 Year Summary (2001 -2010)
CAGR: 14%
CAGR: 14%
Cumulative: 263%
Consistently Successful Throughout the Insurance Cycle

Treated Fairly
Affirms our existing, enduring commitment to
every stakeholder
every stakeholder
Insureds
Agents
Investors
The public
Employees
We run our business as owners who are
rewarded for long-term success
rewarded for long-term success
6

Business Profile and Operational Strategy
2011 is our fifth straight year to be recognized by
Ward’s as one of the 50 top performing property
casualty insurance companies in America
Ward’s as one of the 50 top performing property
casualty insurance companies in America
ProAssurance: Business Profile
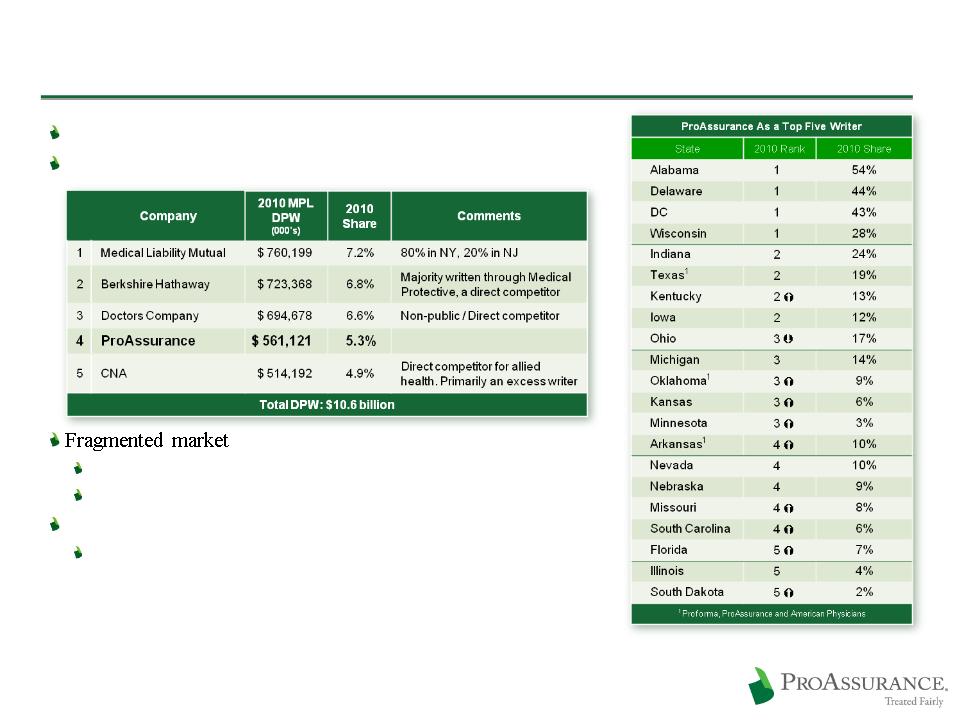
Largest independent publicly traded writer of MPL insurance
Fourth largest overall writer
Top 20 writers have just 65% of the market
More than 100 writers with some share of the market
Majority of companies are mutual or similar
Few operate in more than two or three states
8
DPW: SNL & Highline Data 2010
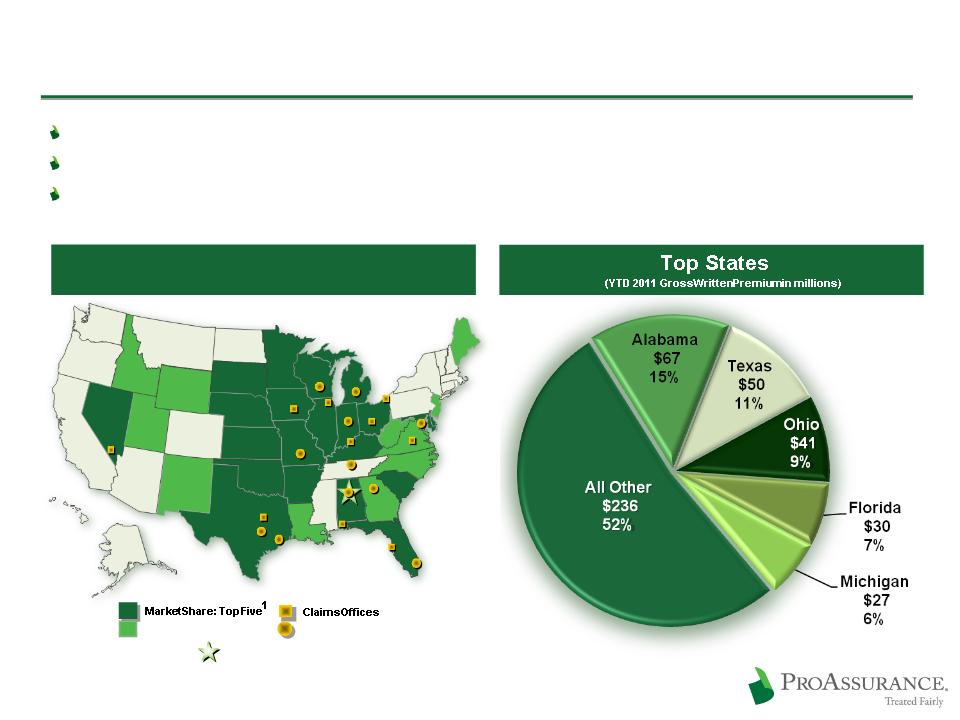
ProAssurance: Geographic Profile
Writing across the United States, ProAssurance has broad geographic diversification
Each state presents unique medical and legal challenges
Regional structure provides the local knowledge that differentiates ProAssurance
9
Corporate Headquarters
Corporate Headquarters
Claims / Underwriting Offices
Claims / Underwriting Offices
(Birmingham)
Market Share: Six-Ten1
Market Share: Six-Ten1
ProAssurance Footprint
September 30, 2011

Local Knowledge and National Reach
Medical/Legal environment varies by state
Often varies within states
Regulatory environment differs greatly
May limit the ability to ensure that rates accurately
reflect loss trends
reflect loss trends
Can affect the ability to introduce policy or
procedural changes
procedural changes
Overall business climate differs and can change
Demographics of the medical population and
consumers
consumers
10
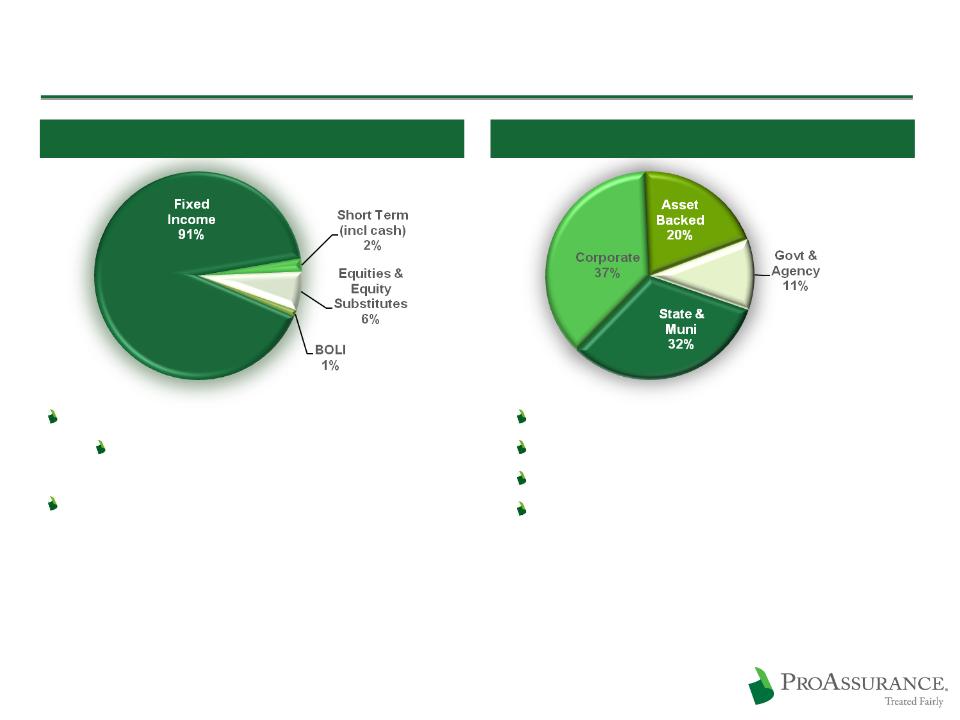
ProAssurance: Investment Profile
11
$4 Billion Overall Portfolio
$3.7 Billion Fixed Income Portfolio
Average duration: 3.9 years
Average tax-equivalent Income yield: 4.6%
Investment grade: 97%
Weighted average: AA-
9/30/11
Key actions in Q3
Added Governments to mitigate concerns
over spread widening
over spread widening
CUSIP-level portfolio disclosure on our website:
www.proassurance.com/investorrelations/supplemental.aspx
www.proassurance.com/investorrelations/supplemental.aspx

ProAssurance Operational Strategy
Maintain our profitability and book value growth
Ensure outstanding performance in a challenging
financial market and a demanding line of insurance
financial market and a demanding line of insurance
Focus on long-term
Maintaining balance sheet strength and institutional
expertise to prepare for a changing market
expertise to prepare for a changing market
Leverage financial strength
Protects the balance sheet
Maintains our leading market position
Builds strength for the next cycle turn
12

ProAssurance’s Growth Strategy
We have consistently grown our business through
M&A and opportunistic de novo expansion
M&A and opportunistic de novo expansion
Future growth will be less dependent on M&A
Growth opportunities will be shaped by a healthcare
landscape that will see enormous changes—with or
without federal healthcare reform
landscape that will see enormous changes—with or
without federal healthcare reform
We are expanding our hospital capabilities and commitment
Building on two decades of hospital experience
We continue to enhance our commitment to individual
providers and small groups
providers and small groups
13

ProAssurance’s Growth Strategy
Certitudetm program developed in conjunction with
Ascension Health
Ascension Health
Largest Catholic healthcare system in the U.S.
38 ministries in 18 states, largely mirror PRA’s footprint
Insurance operations performed by ProAssurance
PRA policies jointly marketed
Coordinated claims and risk management efforts
Financial involvement of both entities creates incentive to
reduce risk
reduce risk
Initial offering to ~1,000 Michigan physicians insured
by an Ascension affiliate
by an Ascension affiliate
14

ProAssurance’s Growth Strategy
Future opportunities for the Certitudetm
program
program
Expansion in Michigan to Ascension-affiliated
physicians insured in the open market
physicians insured in the open market
Expanding into Florida, Indiana, Tennessee and
Texas by end of Q1 2012, with other states to
follow
Texas by end of Q1 2012, with other states to
follow
Stimulating interest from other hospitals
systems and large groups
systems and large groups
15

ProAssurance’s Growth Strategy
Joint physician/hospital insurance product:
ProControlsm
ProControlsm
Addresses the unique risk tolerance and claims-handling
expectation of each insured
expectation of each insured
Physicians largely seek claims defense to protect their
reputation
reputation
Hospitals/facilities seek to protect their reputation in
different ways
different ways
Hospitals can set their risk tolerance with a full retention
level, a consultative level and a full risk transfer level
level, a consultative level and a full risk transfer level
Broad interest in the market with several policies in
force
force
16

ProAssurance’s Growth Strategy
Providing sophisticated alternative risk
programs for organizations as they increase in
size and sophistication
programs for organizations as they increase in
size and sophistication
We have proven experience in facilitating self-
insurance and captive insurance programs
insurance and captive insurance programs
17

ProAssurance’s M&A Strategy
Consolidation will continue and will remain episodic
Fewer significant targets
Remaining companies of size are in important strategic
areas
areas
We prefer “health care centric” but will consider
closely related liability lines
closely related liability lines
Legal/regulatory environment must be favorable
Not all M&A opportunities should be pursued
We have not “bet the company” on any transaction
18
The Case for Growing Through M & A
Legal and regulatory environment must be favorable
Not all M & A opportunities should be pursued
The key is understanding why companies are available
We don’t “bet the farm” and can acquire without “breaking the bank”
We prefer “healthcare centric” but look for closely related liability lines to leverage expertise
(attorneys E & O for example)
(attorneys E & O for example)
Our strategy adapts to the available opportunities for profitable growth
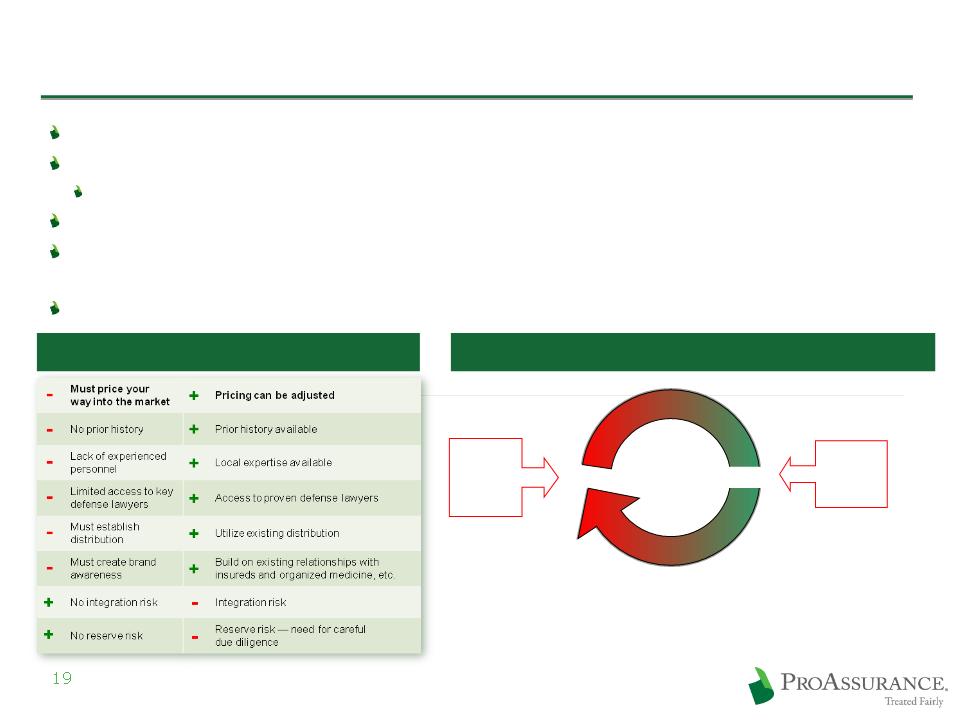
De Novo vs. Acquisition
Soft Market
Hard Market
M & A
de novo
Expansion
Expansion
Internal
Growth
Growth
All avenues
open
because of
pricing
power
open
because of
pricing
power
M & A is
preferable
because of
pricing
pressure
preferable
because of
pricing
pressure
M & A and the Insurance Cycle

Healthcare Reform & Tort Reform Update
Our long-term focus ensures that we can
continue to create value in an evolving
medical/legal climate
continue to create value in an evolving
medical/legal climate
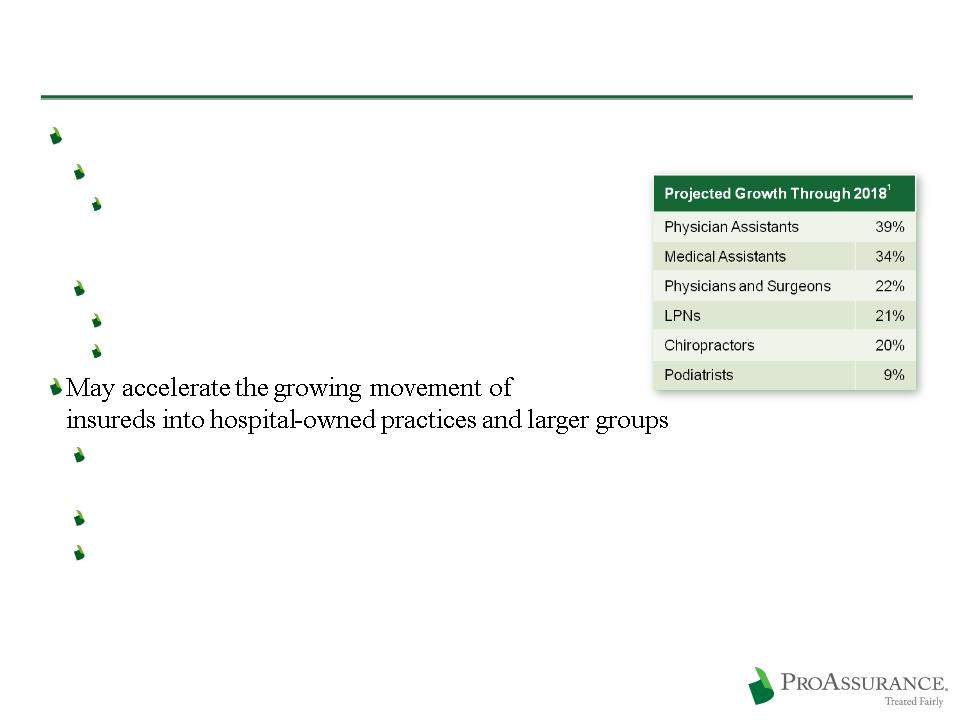
The Potential Effects of Healthcare Reform
More patients will ultimately require more physicians and ancillary providers
Known: More customers for us
We have enhanced our ability to write new classes of business
through the acquisition of PICA and
ProAssurance Mid-Continent General Underwriters
through the acquisition of PICA and
ProAssurance Mid-Continent General Underwriters
Unknown: Effect on the medical/legal environment
Increased patient frustration with the system
Possibility of more unexpected outcomes
Provides an opportunity for us due to our geographic reach,
long-term experience in hospitals and our financial strength
long-term experience in hospitals and our financial strength
We are introducing new approaches and new products to take advantage
Likely to hasten M&A amongst smaller insurers that lack the capacity
or capability to insure hospitals or facilities
or capability to insure hospitals or facilities
21
1 Bureau of Labor Statistics 2008 to 2018 Projections
http://data.bls.gov/oep/nioem
http://data.bls.gov/oep/nioem

The Fate of Tort Reform: National
No meaningful Tort Reform in healthcare reform laws
No immediate effect on the medical/legal climate
Demonstration projects do not provide meaningful reform or
immediate data
immediate data
Federal Tort Reform has reappeared in Washington
Lots of smoke, so far no fire in Washington
First mentioned during 2010 State of the Union Speech
Consider that meaningful Tort Reform was not enacted when
Republicans controlled Congress and the White House
Republicans controlled Congress and the White House
Multiple bills being pushed by Republicans in the House, at
least one bill introduced in the Senate
least one bill introduced in the Senate
22

The Fate of Tort Reform: States
State Tort Reforms—where the real battles are fought
Reforms enacted in 2011
$350,000 non-economic damage cap in Oklahoma
$750,000 non-economic damage cap in Tennessee
$500,000 non-economic damage cap in North Carolina
Non-economic damage cap rejected in New York
Courtroom update
State Supreme courts reviewing mid-2000’s reforms in
Florida, Kansas, Mississippi, Nevada and WV
Florida, Kansas, Mississippi, Nevada and WV
Long-standing reforms in California and Louisiana
upheld
upheld
23

The Fate of Tort Reform
Whether federal or state, we never give advance credit
for untested reforms unless required by law or
regulation
for untested reforms unless required by law or
regulation
We are prepared, operationally and financially, if Tort
Reforms are struck down in our states
Reforms are struck down in our states
Prices are set, and reserves established, as if there is no
tort reform, until results reflect otherwise
tort reform, until results reflect otherwise
24

Current Market Overview
We retain existing business and add new,
profitable business by competing on value
and service, not by focusing on price alone
profitable business by competing on value
and service, not by focusing on price alone
ProAssurance and Today’s Market
We are in a period of “benign profitability”
Prices have been falling yet profitability remains at attractive levels
We have seen no new large scale market entry from larger commercial
competitors
competitors
No expansion by mid-decade start-ups
Consolidation beginning in that segment
Start-up pricing advantage has vanished in current market conditions
26
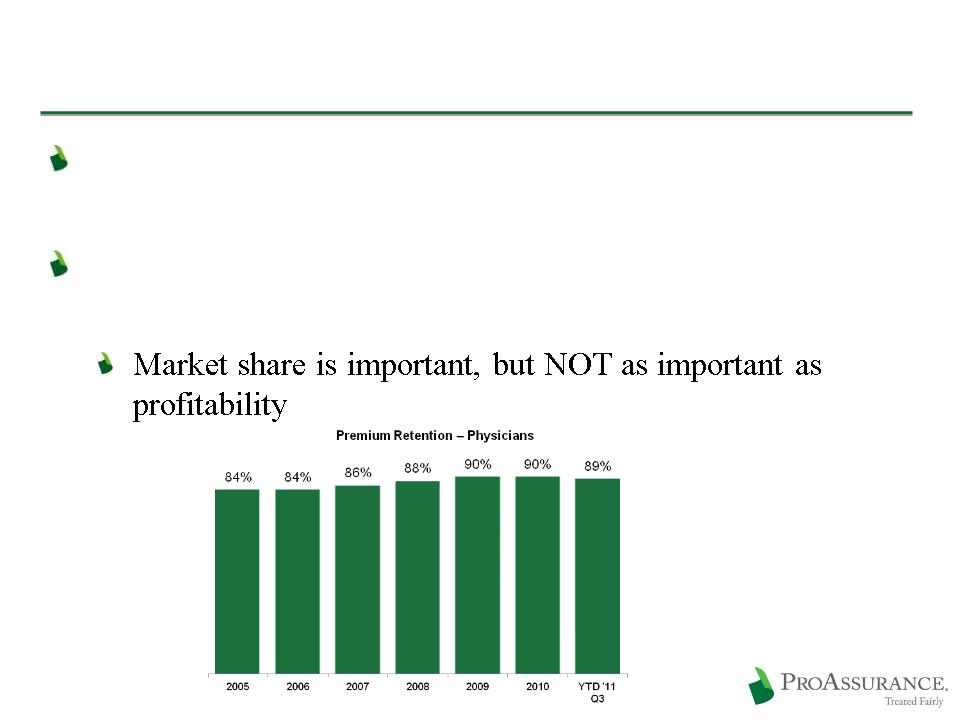
ProAssurance and Today’s Market
ProAssurance’s retention remains at historically
high levels
high levels
Continued underwriting vigilance is being used
today to ensure future success
today to ensure future success
27
ProAssurance and Today’s Market
Rates on renewing physician business down 14% from peak pricing in 2006
Improved frequency trends are reflected in recent rate declines
Improvement in frequency has outweighed a steady, manageable rise in
severity of ~4% per year
severity of ~4% per year
Loss trends have improved in states with and without tort reforms
Rate changes (up or down) through 2012 will likely be low-to-mid single digits
28
Physician Rate Change History1
1Excludes PICA for clarity of historical comparison

ProAssurance Business Outlook
We ARE writing new business that we believe will meet
our profitability goals
our profitability goals
$63 million in new physician business through Q3 2011
Approximately $44 million due to AMPH
Approximately $19 million, excluding AMPH
Includes approximately $6.2 million from Certitudetm
Major competitors continue to be largely disciplined in
pricing
pricing
No new market entrants
29

Differentiation Through Claims Handling
Our unique approach to claims benefits
our insureds and our shareholders
our insureds and our shareholders
Differentiate Through Claims Defense
Our deep expertise in claims defense has always set us apart
Our financial strength gives our insureds the opportunity for an uncompromising
defense of their claim
defense of their claim
Our successful approach to claims establishes a unique competitive advantage
Differentiates our product
Provides long-term financial and marketing advantages
A significant factor in our high retention rate
Helps deter future lawsuits
Our insureds increasingly value reputational defense as claims data becomes public
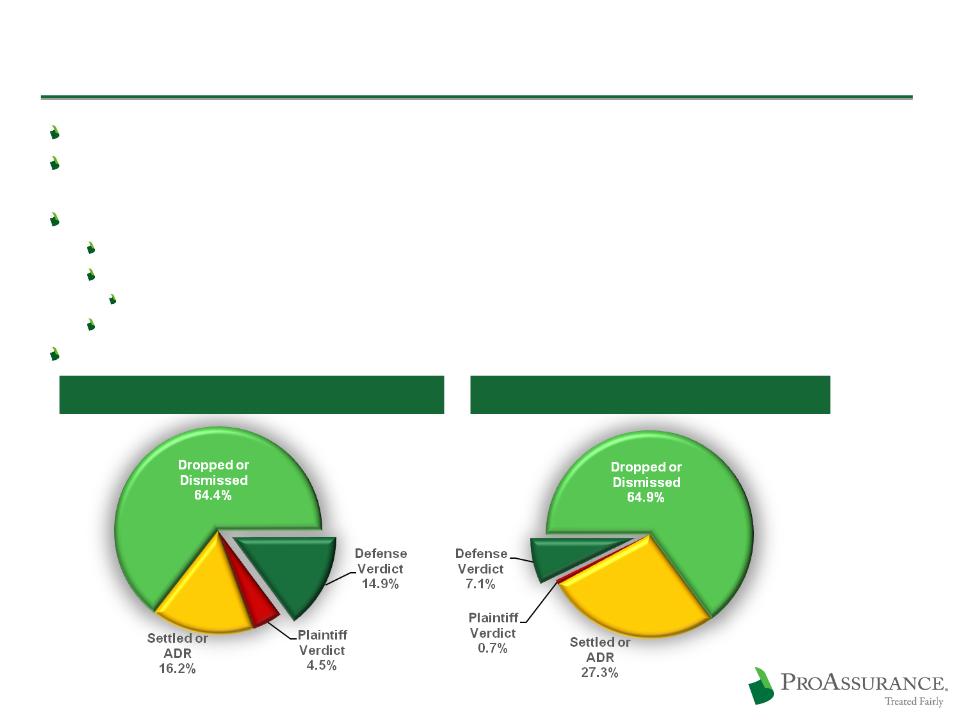
ProAssurance: 79% Favorable Outcomes
Industry: 72% Favorable Outcomes
Source: PIAA 2010 Claim Trend Analysis
ProAssurance Excluded
ProAssurance Excluded
Five Year Average
2006-2010
2006-2010
31
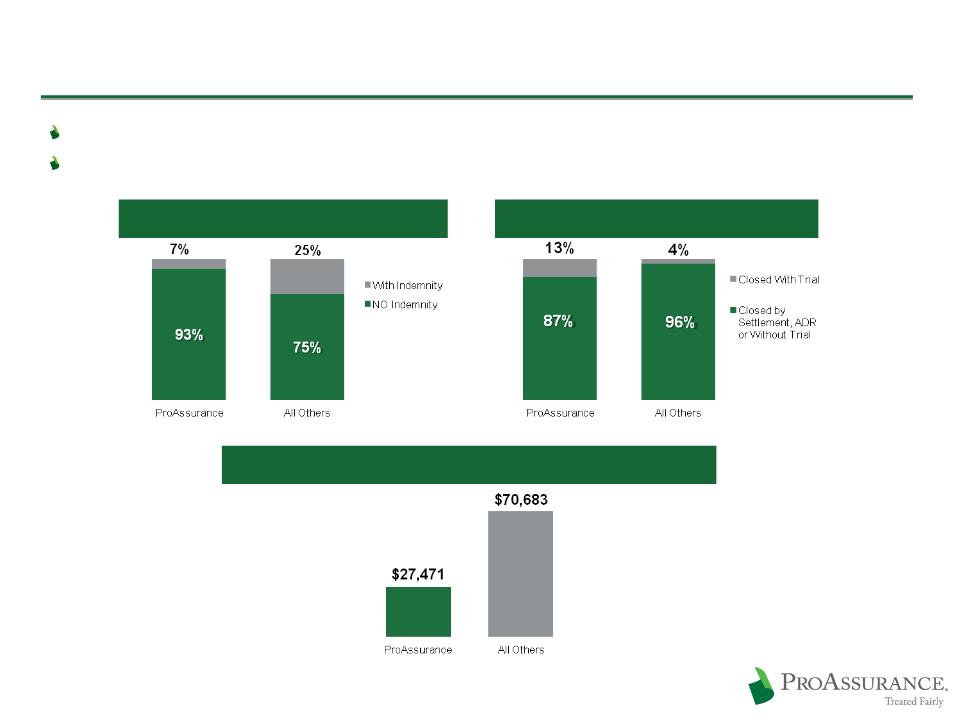
The Ohio Example: 2005 - 2009 Data
Comprehensive, reliable data provided by the Ohio Department of Insurance
Broad range of competitors and business approaches
32
www.insurance.ohio.gov/Legal/Reports/Documents/2009ClosedClaimReport.pdf
Fewer Claims Closed With Indemnity
More Claims Defended in Court
2.5x Lower Average Indemnity Payment per Closed Claim
ProAssurance Claims Tried to a Verdict
New Claims Opened Each Year
Claims Trends Remain Favorable
With frequency down compared to mid-decade the result is fewer
cases to try
cases to try
Severity trends steady and manageable
No observed effect from the economic downturn
Trends are much the same in states with or without Tort Reform
33
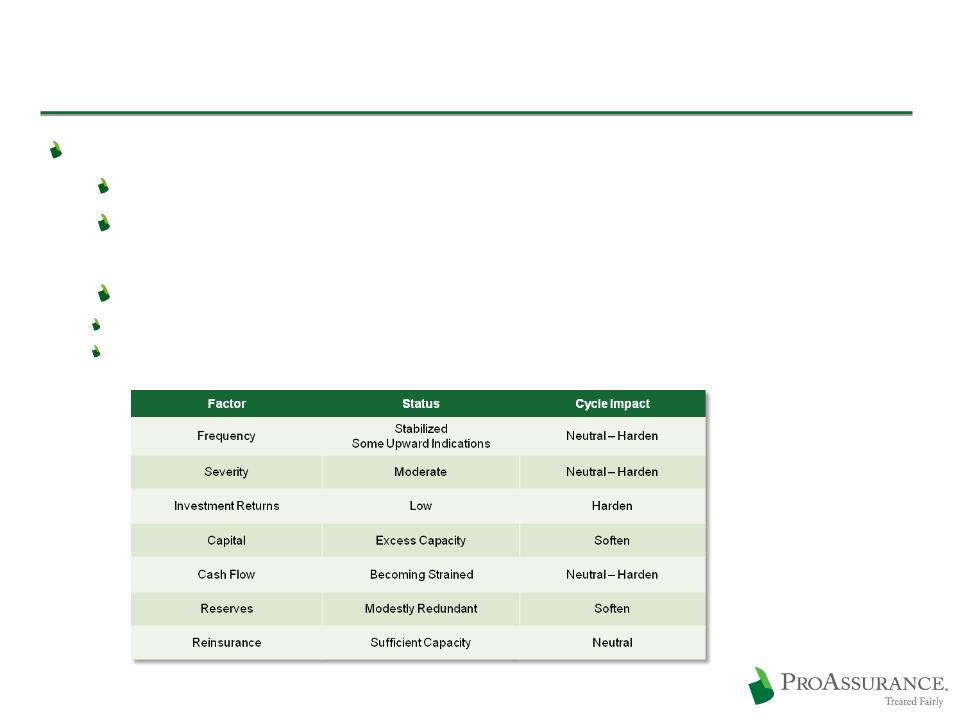
Understanding Recent Loss Trends
Frequency stable after
historic declines
historic declines
Lawyers are the gatekeepers
Must weigh the cost of a trial vs.
chances of success
chances of success
Likelihood of success is affected by
many factors
many factors
Societal perceptions of lawsuits against
physicians
physicians
Effects of the overall tort reform debate
and headlines across the country
and headlines across the country
Reforms enacted in some states
Medical utilization is down
Fewer chances for medical incidents
Better quality of care reduces the
number of medical misadventures
number of medical misadventures
Severity uptrend remains
steady at 4%-5%
steady at 4%-5%
Closely tied to inflation
Primarily medical cost inflation
Jury sentiment in reaction to
headlines has moderated, but
not eliminated, runaway
verdicts in recent years
headlines has moderated, but
not eliminated, runaway
verdicts in recent years
Tort Reforms have limited
non-economic damages in a
number of states
non-economic damages in a
number of states
34

The Residual Cost of a Plaintiff Verdict
Financial Effects
Higher MPL premiums
May affect quality scoring under new payment regimes
Credentialing Implications
Disclosure required when applying for licensing, privileges
and treatment panels throughout their medical career
and treatment panels throughout their medical career
Reputational Damage
May affect referrals
Online disclosure can affect acquisition of new patients
Emotional Stress before, during and after
Influences future treatment behavior and
patient relationships
patient relationships
35
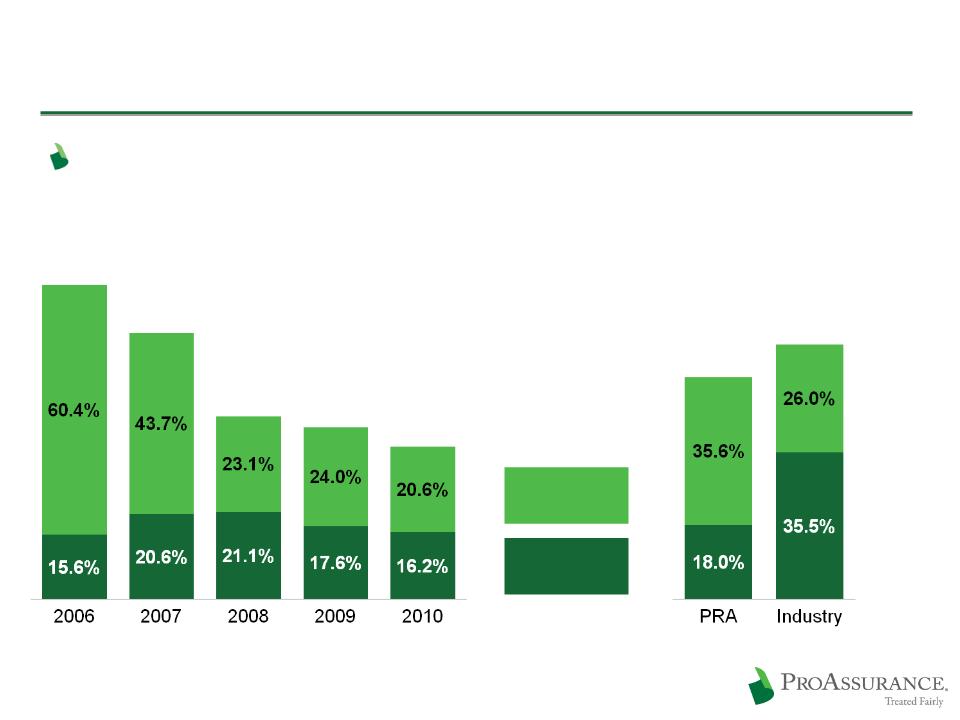
The Benefits of Strong Defense
Our ability and willingness to defend claims
allows us to achieve better results
allows us to achieve better results
Source: Statutory Basis, A.M. Best Aggregates & Averages
Some totals may not agree due to rounding
Some totals may not agree due to rounding
ProAssurance vs. Industry
Average Loss Ratio (2006-2010)
Legal
Payments
Payments
Loss
Payments
Payments
64.3%
44.2%
61.5%
53.6%
41.6%
76.0%
36.8%
ProAssurance Stand Alone
Loss Ratio (2006-2010)
36

Differentiation Through Business Discipline
We consistently outperform our industry
by ensuring our customer’s satisfaction and
our business’ profitability
by ensuring our customer’s satisfaction and
our business’ profitability
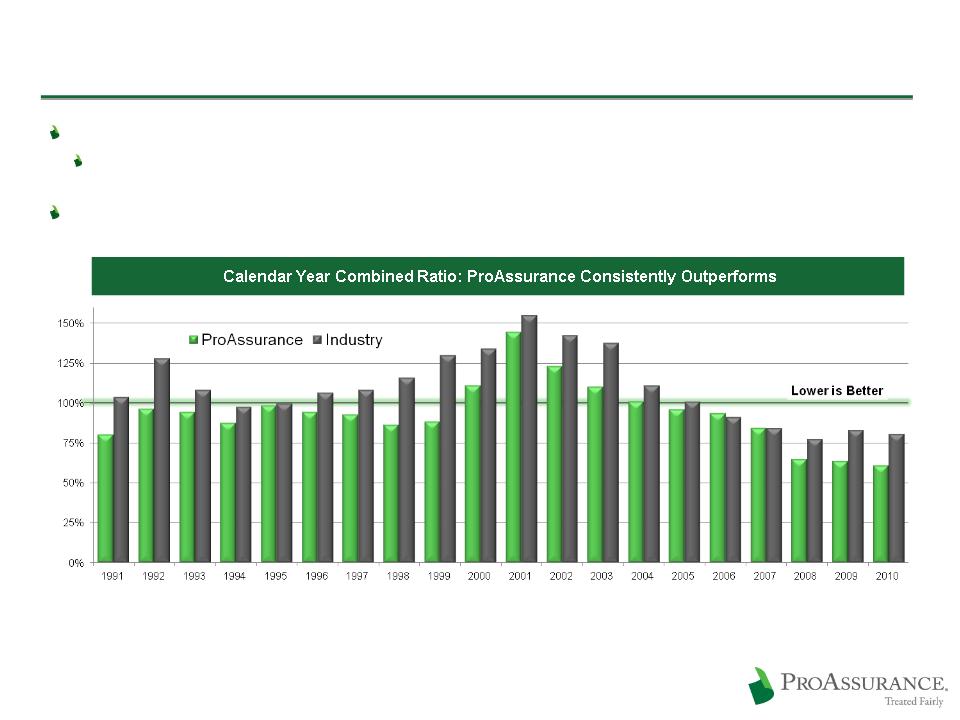
We enforce stringent underwriting standards to maintain rate structure and enhance profitability
Underwriting process driven by individual risk selection and assessment of loss history, areas of practice,
and location
and location
Rate filings consider the results of the past five to seven years to ensure a single year does not
unduly influence results
unduly influence results
Demonstrated Underwriting Performance
Five Years: ProAssurance Average: 73.5% / Industry Average: 83.3%
Ten Years: ProAssurance Average: 94.2% / Industry Average: 106.3%
All Years: ProAssurance Average: 93.6% / Industry Average: 109.7%
Source: A.M. Best Aggregates and Averages, Medical Malpractice Lines of Business
38
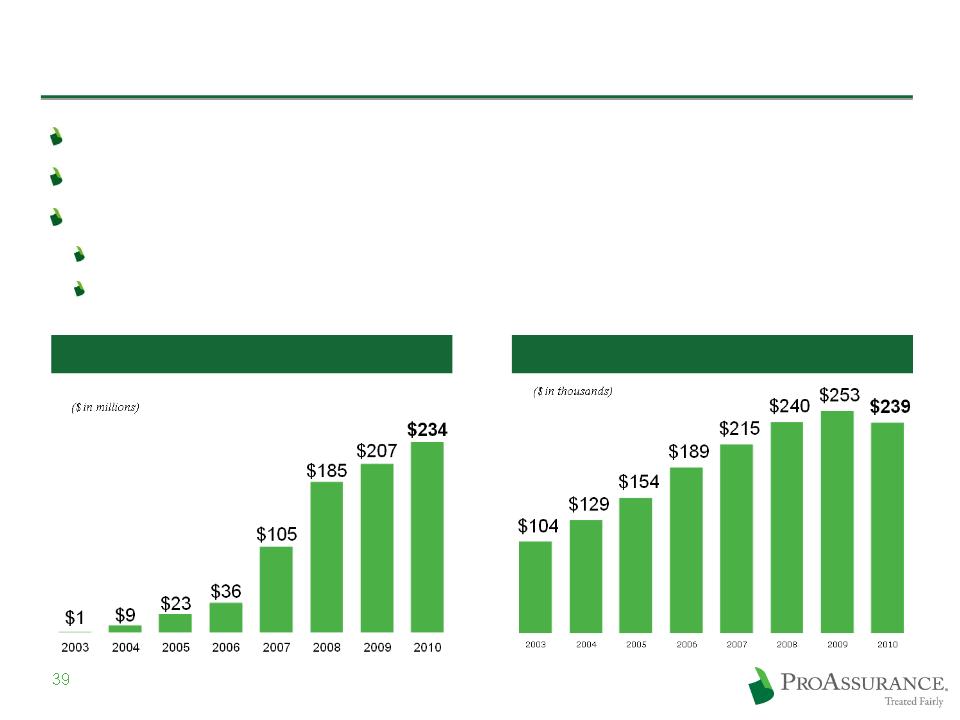
Conservative Approach to Reserves
Conservative reserve strategy provides protection against a loss trend reversal
Reviewed at least quarterly by internal actuarial staff
Regular outside reviews
Independent consulting actuaries (Towers Watson) conduct full review twice per year
Actuaries associated with independent auditor (E&Y) review once per year
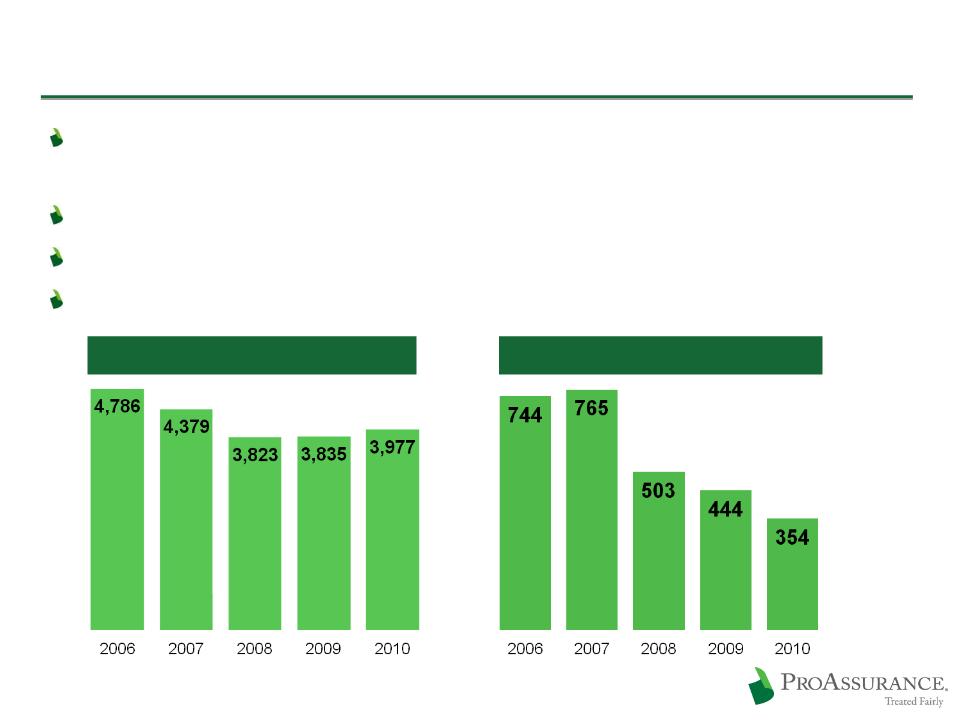
Net Favorable Reserve Development
Net Reserve per Open MPL Claim1
1 Statutory basis; Loss & LAE
Acquired company data included at end of acquiring year
Acquired company data included at end of acquiring year
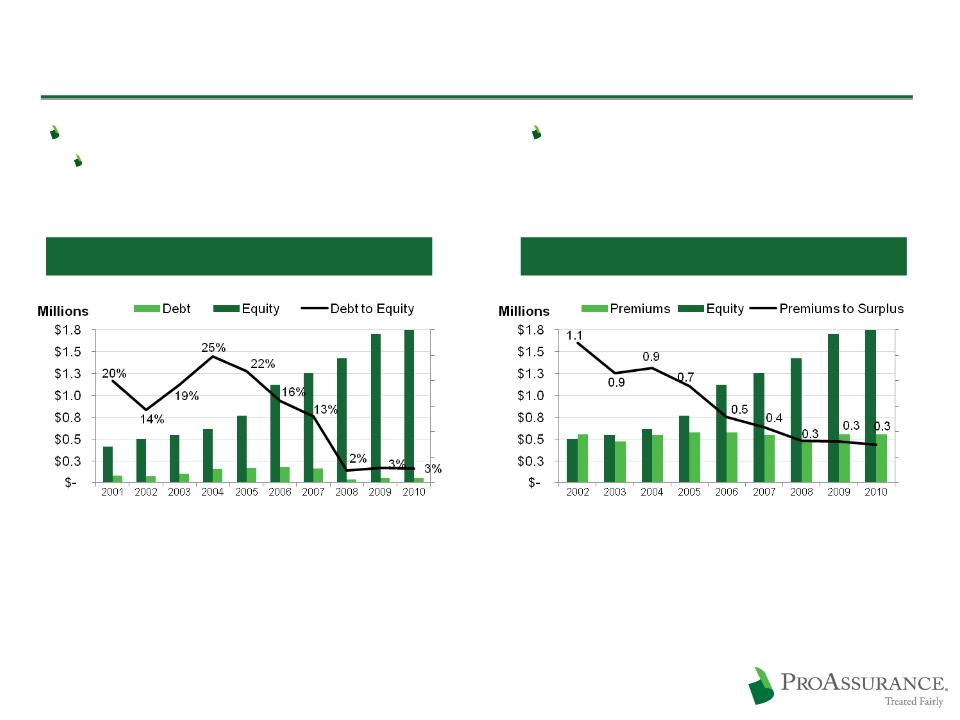
Conservative Use of Debt and Low Leverage
Low Debt to Cap Ratio
No strain on cash flow
40
Debt to Equity
No Debt Prior to 2001
Strong Capital Position
Prepared for an improving market

Differentiation Through Financial Strength
Our dedication to solid financial strength
lays an unshakable foundation for every
facet of our business
lays an unshakable foundation for every
facet of our business

Long-Term Financial Strength Sets Us Apart
Ensuring the strength of our balance sheet is our top financial priority
Financial strength differentiates us in the market
The claims defense philosophy that differentiates us in the market leverages our
financial strength
financial strength
42
Shareholders’ Equity
Up Over 80% Since 12/31/06
Total Assets
43
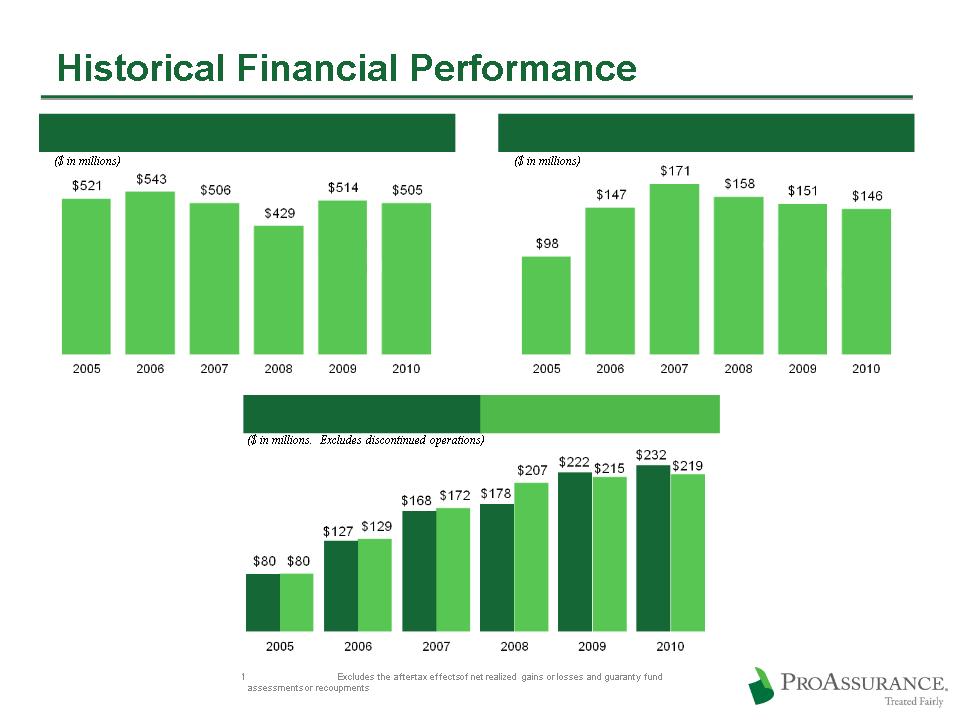
Net Investment Income
Net Premiums Written
Net Income
Operating Income1
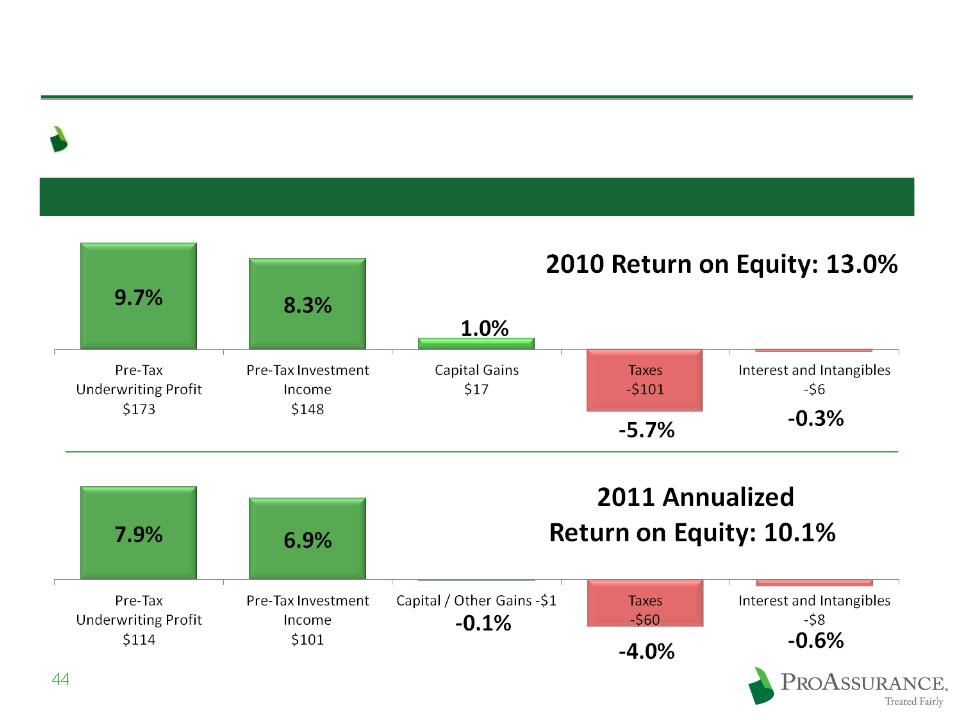
Steady Return in an Unfavorable Environment
Meeting our long-term ROE target of 12% -14%
Components of Return on Equity (in millions)
Pricing discipline becomes even more
critical in a low interest rate environment
critical in a low interest rate environment
Lack of investment yield may be a hard
market catalyst
market catalyst
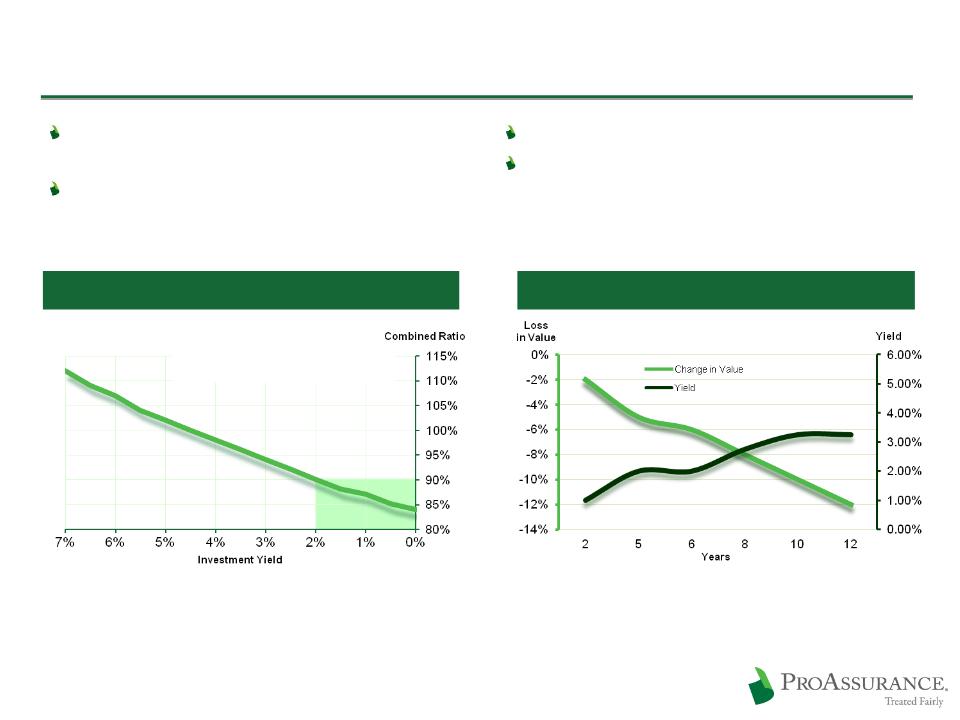
Return on Equity and Investment Returns
45
Assumes a 1:1 premium to surplus ratio for physicians
professional liability claims-made coverages
professional liability claims-made coverages
Combined Ratio Required to
Generate a 13% Return on Equity
Generate a 13% Return on Equity
Long-Term ROE Target is 13%
The choice: chase yield or extend duration
We are maintaining duration, looking for
opportunities
opportunities
The Yield Trap
Revised to reflect yields at 11/9/11
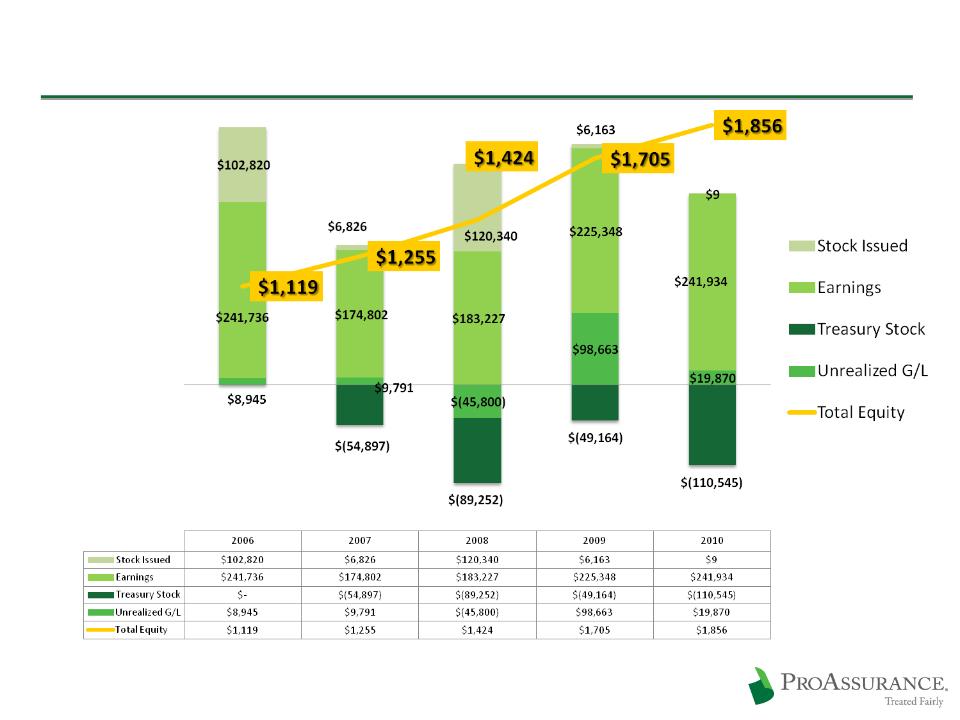
Capital Growth: 2006-2010
in $000’s except total equity (000,000’s)
46
2011 Year-to-Date Financial Highlights
47
|
|
Nine Months Ended September 30,
|
|
|
|
2011
|
2010
|
|
Gross Premiums Written
|
$ 450,795
|
$ 414,697
|
|
Net Premiums Earned
|
403,766
|
379,124
|
|
Net Investment Income
|
106,573
|
110,348
|
|
Net Income (Includes Investment Losses)
|
146,494
|
129,545
|
|
Operating Income
|
147,007
|
123,392
|
|
Net Income per Diluted Share
|
$ 4.75
|
$ 3.99
|
|
Operating Income per Diluted Share
|
$ 4.77
|
$ 3.80
|
|
|
|
|
|
|
September 30, 2011
|
December 31, 2010
|
|
Total Assets
|
$ 4,988,809
|
$ 4,875,056
|
|
Shareholders’ Equity
|
2,021,763
|
1,855,863
|
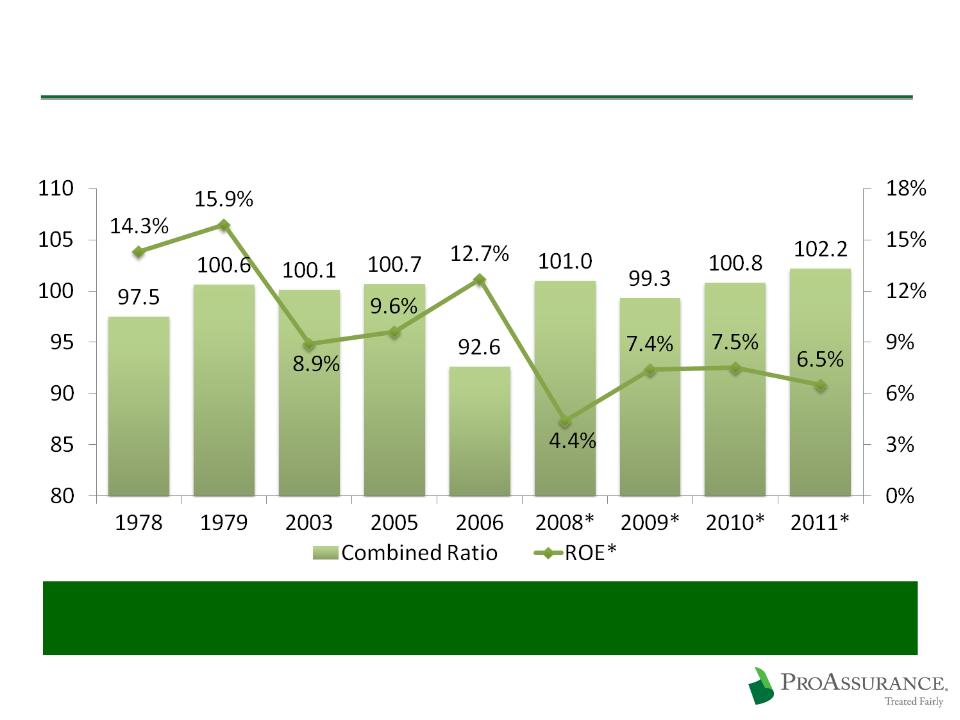
Investment Effect on P&C Industry ROE
Combined Ratio / ROE - a 100% Combined Ratio Isn’t What It Used to Be
* 2009 and 2010 figures are return on average statutory surplus.
2008 -2011 figures exclude mortgage and financial guaranty insurers
2008 -2011 figures exclude mortgage and financial guaranty insurers
Source: Insurance Information Institute from A.M. Best and ISO data.
Combined Ratios Must Be Lower in Today’s Depressed
Investment Environment to Generate Risk Appropriate ROEs
Investment Environment to Generate Risk Appropriate ROEs
48

ProAssurance Creates Value
ProAssurance leverages the long-term
focus of an experienced, invested
management team to achieve strong,
sustainable results
focus of an experienced, invested
management team to achieve strong,
sustainable results
Driven to Excel / Focused on Shareholder Value
Maintaining our profitability and book value growth
Outstanding performance in a challenging financial market and a demanding line of insurance
Producing sustainable shareholder value
Finding the right M & A opportunities
Growing Book Value per Share
Significant share ownership at all levels
Focusing on long-term
Preparing for a changing market while maintaining our leading position in the current market
Protecting the balance sheet and preparing for the market turn
50
Current Prices Present a Compelling Buying Opportunity

Investment Portfolio Detail
ProAssurance remains conservatively
invested, to ensure our ability to keep our
long-term promise of insurance protection
invested, to ensure our ability to keep our
long-term promise of insurance protection
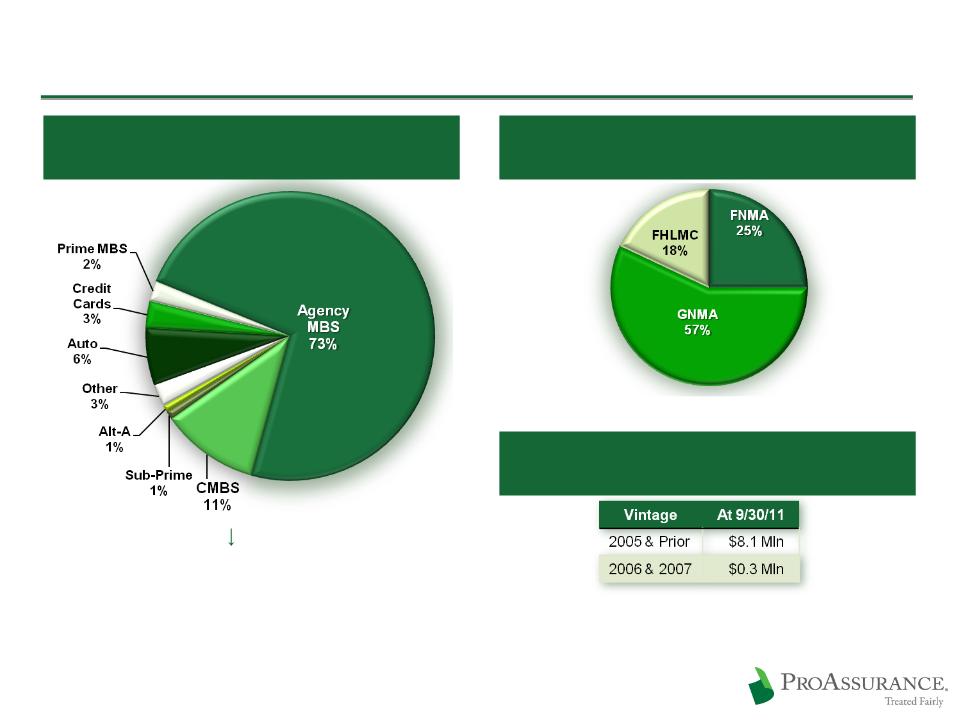
ProAssurance Portfolio Detail: Asset Backed
52
9/30/11
Asset Backed: $733 Million
Weighted Average Rating: “AA+”
Breakdown of Agency MBS Holdings
Key CMBS Details Provided on Following Page
Sub-Prime: $8.4 mln Market Value (AFS)
$1.2 mln net unrealized loss
$1.2 mln net unrealized loss
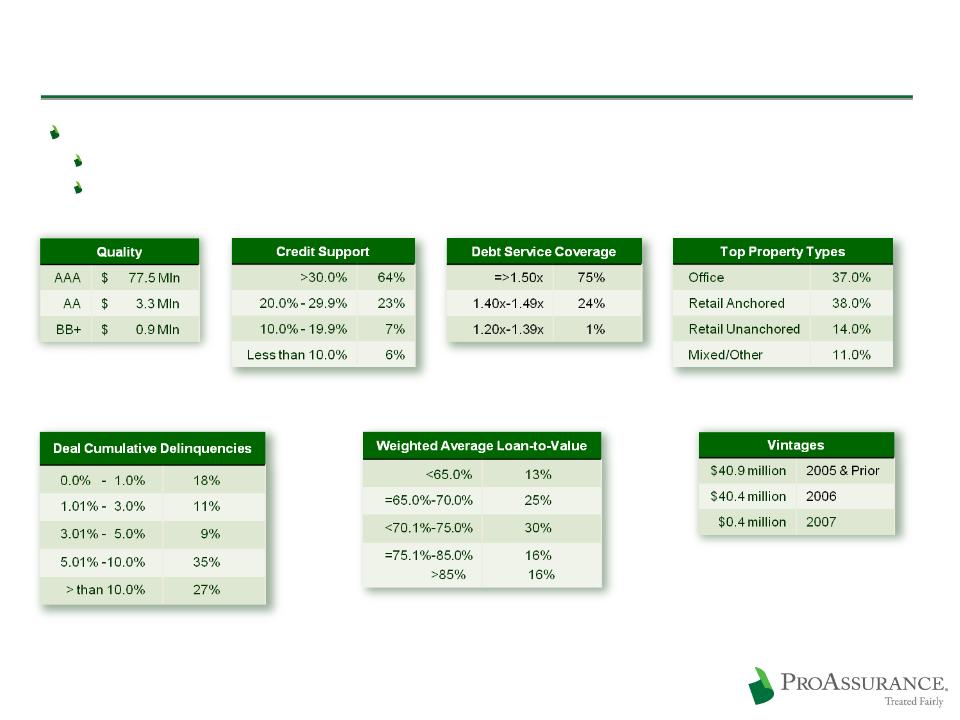
ProAssurance Portfolio Detail: CMBS
$81.7 million Fair Value in non-agency CMBS
Book Value: $78 million (2% of fixed income portfolio)
We have experienced no losses on our CMBS positions.
53
9/30/11
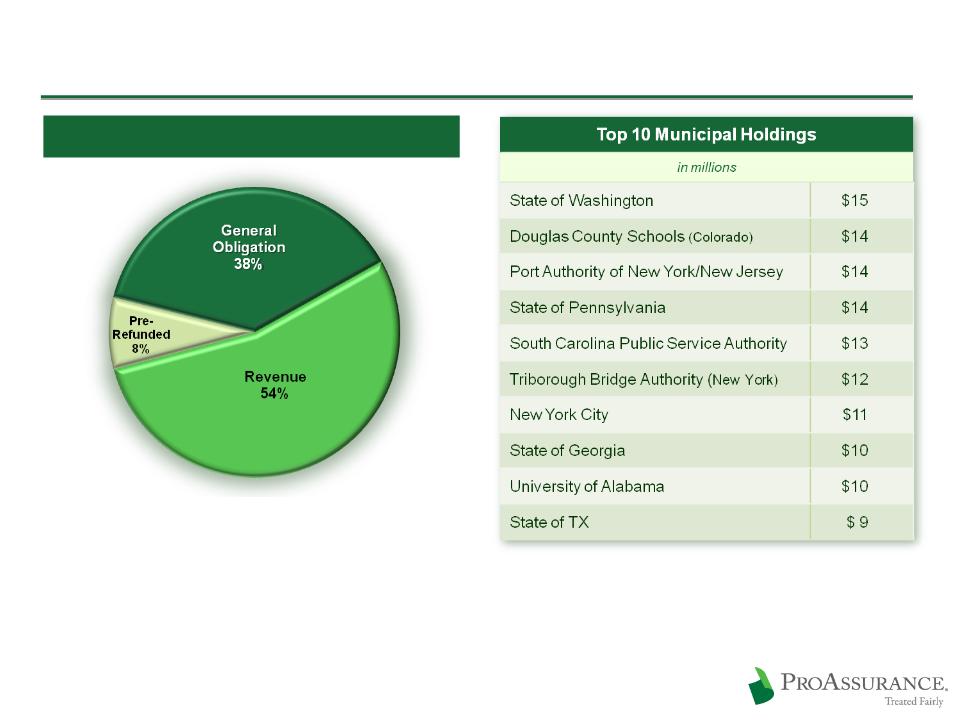
ProAssurance Portfolio Detail: Municipals
54
Municipals: $1.2 Billion / Average Rating is AA
Investment policy has always required
investment grade rating prior to applying the
effect of insurance
investment grade rating prior to applying the
effect of insurance
Weighted Average Rating: AA
9/30/11
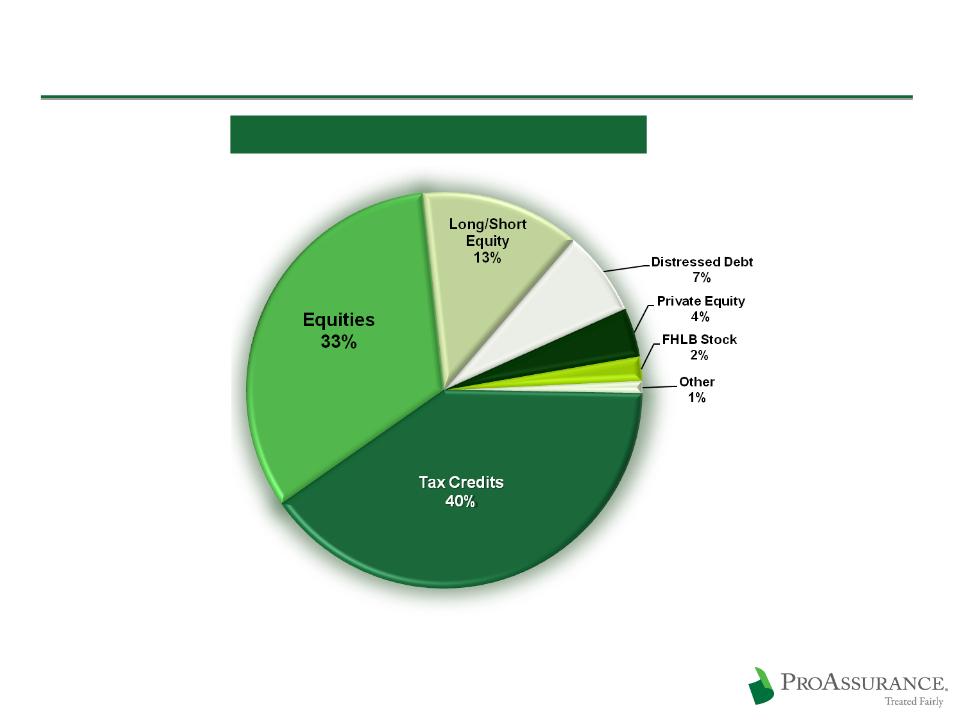
ProAssurance Portfolio Detail: Equities & Other
55
Equities & Other: $223 Million
9/30/11
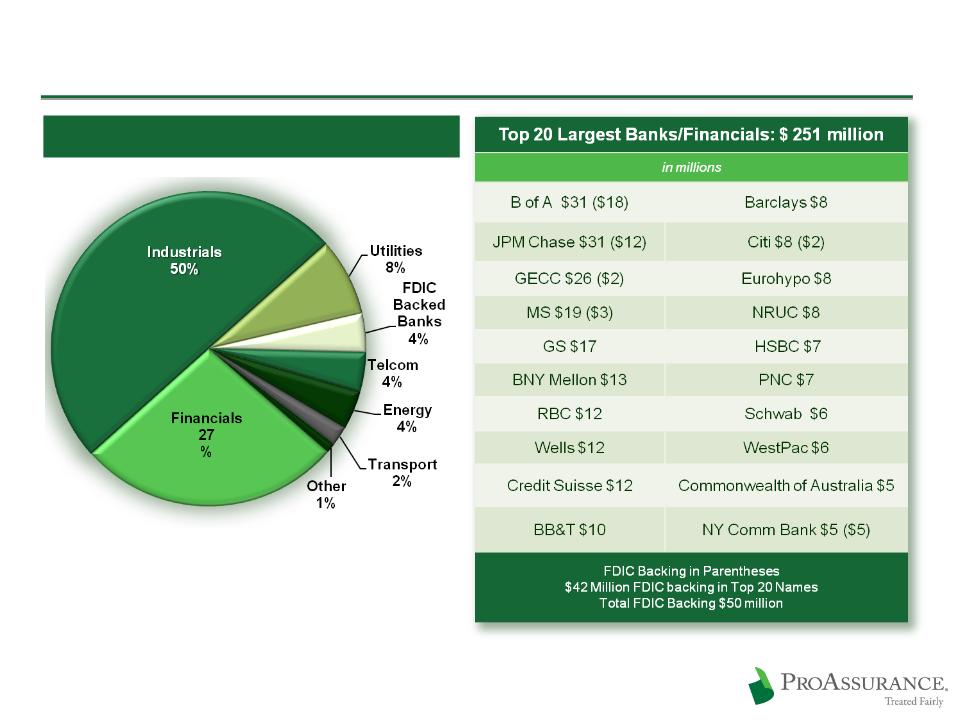
ProAssurance Portfolio Detail: Corporate
56
Corporates: $1.4 Billion
Weighted Average Rating: A
6/30/11
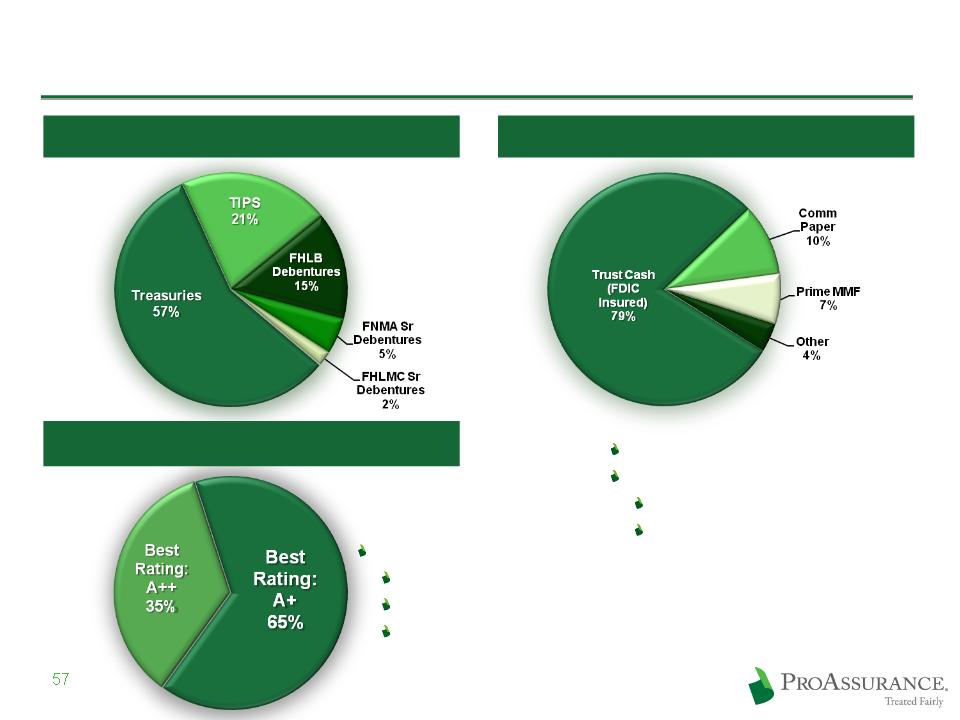
ProAssurance Portfolio Detail: Various
Rated A1/P1 or better
Money Markets:
Moody’s: Aaa
S&P: AAA
Weighted average rating
Moody’s: AA3
S&P: AA-
A. M. Best: A+
Treasury / GSE: $397 Million
Short Term: $97 Million
BOLI: $52 Million
9/30/11
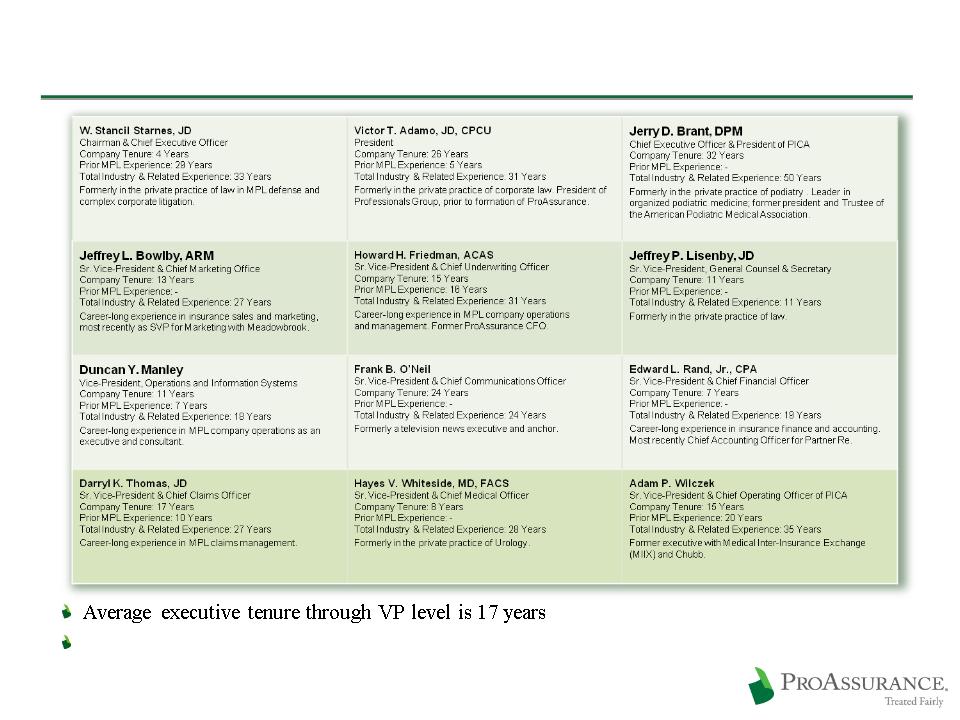
Effective, Experienced & Invested Management
58
All subject to share ownership requirements