Attached files
| file | filename |
|---|---|
| EX-99.1 - TWO RIVER BANCORP | ex99_1.pdf |
| 8-K - TWO RIVER BANCORP | s11231108k.htm |
Exhibit 99.1

Investor Presentation
Third Quarter 2011
William D. Moss, President and CEO
A. Richard Abrahamian, EVP and CFO
Alan B. Turner, EVP and SLO - Two River Community Bank
Robert C. Werner, EVP and COO - Two River Community Bank

The foregoing contains forward-looking statements within the meaning of the Private Securities Litigation Reform Act of 1995. Such
statements are not historical facts and include expressions about management's confidence and strategies and management's current views
and expectations about new and existing programs and products, relationships, opportunities, taxation, technology and market conditions.
These statements may be identified by such forward-looking terminology as "expect," "look," "believe," "anticipate," "may," "will," “should”,
“projects” or similar statements or variations of such terms. Actual results may differ materially from such forward-looking statements, and
no undue reliance should be placed on any forward-looking statement.
Factors that may cause results to differ materially from such forward-looking statements include, but are not limited to, unanticipated
changes in the financial markets and the direction of interest rates; volatility in earnings due to certain financial assets and liabilities held at
fair value; passage by Congress of a law which unilaterally amends the terms of the Treasury’s preferred stock investment in the Company in
a way that adversely affects the Company; stronger competition from banks, other financial institutions and other companies; changes in
loan, investment and mortgage prepayment assumptions; insufficient allowance for credit losses; a higher level of net loan charge-offs and
delinquencies than anticipated; material adverse changes in the Company’s operations or earnings; a decline in the economy in Community
Partners’ primary market areas; changes in relationships with major customers; changes in effective income tax rates; higher or lower cash
flow levels than anticipated; inability to hire or retain qualified employees; a decline in the levels of deposits or loss of alternate funding
sources; a decrease in loan origination volume; changes in laws and regulations, including issues related to compliance with anti-money
laundering and the bank secrecy act laws; adoption, interpretation and implementation of new or pre-existing accounting pronouncements;
operational risks, including the risk of fraud by employees or outsiders; and the inability to successfully implement new lines of business or
new products and services.
The above-listed risk factors are not necessarily exhaustive, particularly as to possible future events, and new risk factors may emerge from
time to time. Certain events may occur that could cause the Company’s actual results to be materially different than those described in the
Company’s periodic filings with the Securities and Exchange Commission (“SEC”). For a list of other factors which could affect the
Company’s results, including earnings estimates, see the Company’s filings with the SEC, including “Item 2. Management’s Discussion and
Analysis of Financial Condition and Results of Operations,” including “Forward-Looking Statements,” set forth in the Company’s Quarterly
Report on Form 10-Q for the quarter ended September 30, 2011. Any statements made by the Company that are not historical facts should be
considered to be forward-looking statements. The statements in this investor presentation are made as of the date of this investor
presentation, even if subsequently made available by the Company on its website or otherwise. No undue reliance should be placed on any
forward-looking statements. The Company is not obligated to update and does not undertake to update any of its forward-looking
statements made herein.
2
Forward-Looking Statements

Company Profile
• Community Partners Bancorp was formed in 2006 as the holding
company for Two River Community Bank, which was established in
2000
company for Two River Community Bank, which was established in
2000
• Relationship-based lender
• Focus on Business banking, including a fast-growing Private Banking
Division (medical practitioners and business owners) and SBA lending
Division (medical practitioners and business owners) and SBA lending
• Seasoned senior management and lending team along with an engaged
Board of Directors from local communities
Board of Directors from local communities
• $665 million commercial bank headquartered in Monmouth County,
NJ
NJ
• 15 branches (11 in Monmouth County, 4 in Union County)
• 2 loan production offices (New Brunswick and Summit)
• 90% of deposits core, with 16% non-interest bearing demand
3

|
|
Title
|
Years in
Banking |
Years with CPBC
|
|
William D. Moss
|
President and CEO
|
31
|
11
(since inception)
|
|
A. Richard Abrahamian
|
EVP and Chief Financial
Officer |
27
|
1
|
|
Alan B. Turner
|
EVP and Senior Loan
Officer - Two River Community Bank |
26
|
11
|
|
Robert C. Werner
|
EVP and Chief
Operating Officer - Two River Community Bank |
27
|
1
|
Experienced Executive
Management Team
Management Team
Management transition took place in 2010
4
• NASDAQ symbol: CPBC
• Market Cap - $35.5 million
• 3% stock dividend (4Q’11)
• Price / TBV - 63.7%
Price / LTM EPS - 10.7x
Price / “Est” EPS - 10.5x
• Daily average share volume (52 weeks) - 3,880
• Shares outstanding - 7.7 million
• Public Float - 6.5 million (84.1%)
• Ownership:
• 80.7% Retail
• 15.9% Insider
• 3.4% Institutional
5
Source: SNL Financial

— Strong Net Interest Margin 1
— Company ranks #5 in net interest margin out of 24 NJ Banks as of 6/30/11
— Yield on earning assets ranks 10th while cost of interest bearing deposits ranks
5th as of 6/30/11
5th as of 6/30/11
— Attractive Deposit Mix
— Core deposits comprise over 90% of deposit base
— 16% of deposits consist of non-interest bearing demand
— Company ranks 6th out of 24 in non-interest checking (1)
— Stable low deposit cost of funds - 0.83% for 3Q’11
— Appealing Market Demographics
— Above average household incomes
— Densely populated market areas
— Exceptionally strong medical service industry
— Private Banking Market Focus
1 NJ banks with assets from $300 million to $1.5 billion
Investment Appeals
6

— High unemployment
— Real estate value pressures
— Consumer and business deleveraging
— Regulatory demands and costs
— Prolonged low interest rate environment
Market Challenges
7

8

— We have been able to capitalize on opportunities resulting from
recent consolidation activity in our market area
recent consolidation activity in our market area
— Attract deposit and loan customers seeking higher service levels
— Service fee structure of larger banks becoming cost prohibitive for
the smaller business and retail customer
the smaller business and retail customer
— Recent acquisitions in our market area:
— Kearny / Central Jersey
— Wells Fargo / Wachovia
— TD Bank / Commerce Bank
— Northfield / First State
Opportunities Resulting
from Recent Mergers
from Recent Mergers
9

— NJ is # 1 in median household income - $72,519
— Monmouth County is ranked 6th in NJ
— Middlesex County is ranked 7th in NJ
— NJ is #2 in per capita income - $34,739
— Monmouth County is #5 in NJ
— Middlesex County is #8 in NJ
— NJ is #2 in population density
— Union County is ranked 3rd in NJ
Note: Rankings in NJ based on 21 counties
New Jersey Demographics
Source: SNL Financial
10

2010 Median Household Income:
— Current Markets:
— Monmouth, NJ $ 82,974 (#6 in NJ)
— Union, NJ $ 73,602 (#11 in NJ)
— Middlesex, NJ $ 78,561 (#7 in NJ)
— New Jersey $ 72,519
NJ - #1 in Median
Household Income
Household Income
Source: SNL Financial
11

Current counties of operation:
County State Total Market State # of Small
Deposits ($M) (1) Rank (2) Businesses (3)
Monmouth NJ $17,745 #6 32,022
Middlesex NJ $22,274 #3 27,519
Union NJ $17,226 #7 22,257
(1) Data as of June 30, 2011
(2) Rankings in NJ based on 21 counties
(3) Data as of 2010; Small businesses defined as those with less than 100 employees and $15
million in sales
million in sales
Appealing Business
Opportunities
Opportunities
Source: SNL Financial
12

|
At or for
Nine Months Sept. 30, 2011 |
Outstanding
|
NPA’s
|
NPA’s as % of
Outstanding 1 |
Net
Charge
-Offs |
C/O’s as % of
Outstanding (annualized)
|
|
C & I
|
$133.5
|
$2.3
|
1.76%
|
$0.5
|
0.46%
|
|
R/E -
Construction |
$39.2
|
$0.3
|
0.74%
|
$0.1
|
0.28%
|
|
R/E -
Commercial |
$273.5
|
-
|
-
|
-
|
-
|
|
R/E -
Residential |
$19.3
|
$0.3
|
1.36%
|
-
|
-
|
|
Consumer
|
$51.3
|
$3.4
|
6.61%
|
$0.5
|
1.46%
|
|
OREO
|
-
|
$6.6
|
-
|
-
|
-
|
|
TOTAL
|
$516.8
|
$12.9
|
2.47%
|
$1.1
|
0.29%
|
Loan Credit Metrics
(dollars in millions)
13
1 NPA’s defined as non-accrual loans, 90+ past due and still accruing and OREO
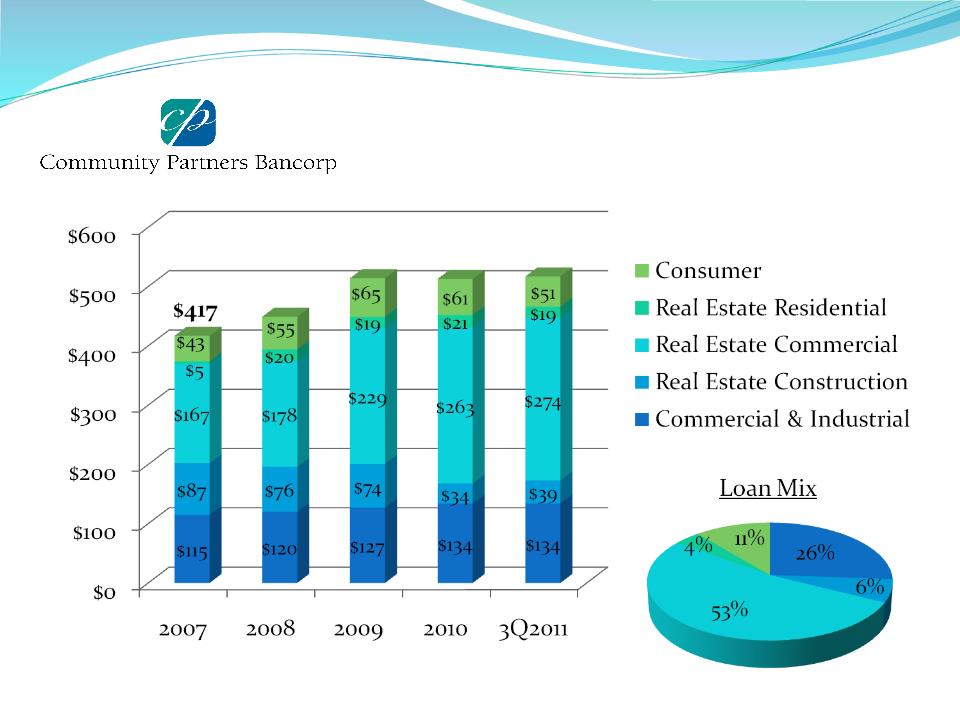
Loan Portfolio
(dollars in millions)
$449
$514
$513
$517
14

Commercial Real Estate
— Portfolio totals $274 million
— Legal lending limit - $11.2 million
— 100% of portfolio is secured by NJ properties
— Average commercial loan size approximately $680,000
— Average LTV at origination was less than 75%
— Approximately 54% of portfolio is owner-occupied
— More than 96% carries personal guarantees
— Conservative underwriting parameters on debt-service coverage
ratios and real estate valuations
ratios and real estate valuations
Commercial Lending
As of September 30, 2011
15

Commercial Real Estate
Concentration
Concentration
As of September 30, 2011
16

Commercial and Industrial
— Portfolio totals $134 million
— Relationship banking with deposit focus
— Average loan size approximates $200,000
— Most commercial loans supported by personal guarantees and by
collateral, including
collateral, including
— First and second liens on residential and/or commercial properties
— Liquid assets, such as marketable securities
— Business assets (i.e. inventory, accounts receivable, equipment)
— Private Banking Division formed in 2008
— Targets business owners, high net worth individuals and medical
practitioners
practitioners
— Established Small Business Administration unit during 2010
— Generated $101,000 in gains from SBA sales during first nine
months of 2011
months of 2011
— Earned Preferred Lender Status in 4Q’11
Commercial Lending
(continued)
17

— Portfolio totals $39 million, representing 8% of total loans
— Repositioned portfolio towards more residential owner
occupied projects with pre-determined takeouts in place
occupied projects with pre-determined takeouts in place
— Reduced speculative development and land exposure beginning
in 2008
in 2008
Construction Lending
As of September 30, 2011
18

— Portfolio totals $51 million (62% home equity)
— 100% in State of NJ
— Stronger underwriting criteria's focused on lower debt to
income ratios and loan to value requirements
income ratios and loan to value requirements
Consumer Lending
As of September 30, 2011
19

— Portfolio totals $19 million
— Primary function is to originate and sell, with servicing released
(fee-based)
(fee-based)
— No interest rate or credit exposure risk
— Mortgages retained typically have strong underwriting
characteristics with low loan to value ratios and debt to income
ratios
characteristics with low loan to value ratios and debt to income
ratios
Residential Lending
As of September 30, 2011
20

Asset Quality Metrics
As of September 30, 2011
Source: SNL Financial
1 NPA’s defined as non-accrual loans, troubled debt restructured loans and OREO
21

— Primarily used for liquidity purposes
— Portfolio totals $57 million (8.5% of total assets)
— 68% of portfolio guaranteed by U.S. Gov’t Agencies, GSEs
— One impaired security
— Pooled trust preferred - $272k balance
— Tax-equivalent yield: 3.00%
— Weighted average life: 4.4 years
Investment Portfolio
As of September 30, 2011
22

Deposits
(dollars in millions)
$475
$535
$524
$544
Core deposits represent 90% of total deposits
23

Demand Deposits
(dollars in millions)
24

— Positioned well for rising interest rates
— 12 month positive gap position (11.0% of assets)
— Economic Value of Portfolio Equity “increases” in rising rate
scenario
scenario
— Currently hold $41 million, or 6% of balance sheet, in
overnight funds at FRB
overnight funds at FRB
— 39% of loan portfolio reprices within 12 months, while only
6% reprices over 5 year
6% reprices over 5 year
— 26% of deposits represent core checking while 90%
represent core deposits 1
represent core deposits 1
Interest Rate Risk Profile
1 Core checking consists of non-interest and interest checking deposits while core deposits
consist of all deposits, except CD’s over $100K
consist of all deposits, except CD’s over $100K
25

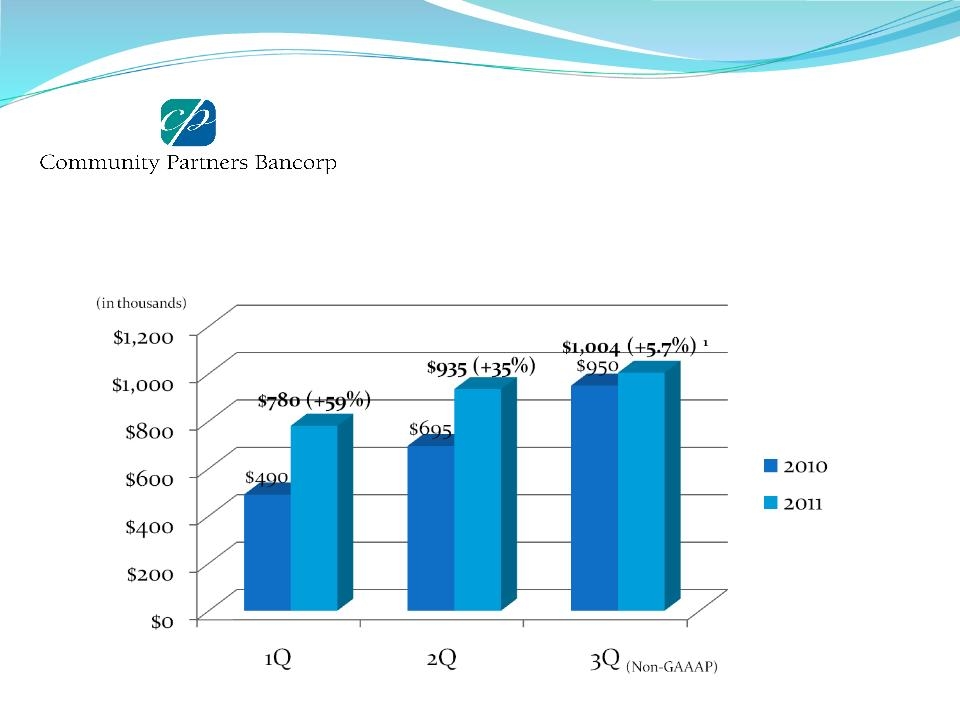
Net Income
to Common Shareholders
$3,039
1 3Q 2011 results exclude $301K of accelerated discount accretion relating to redemption of TARP
preferred stock.
preferred stock.
26
— 3Q 2011 adjusted EPS of $0.13 versus unadjusted $0.12 from 3Q 2010 1
— Nine months 2011 adjusted EPS of $0.34 versus unadjusted $0.27 from 2010 1
Net Income
to Common Shareholders
Quarterly
1 3Q 2011 results exclude $301K, or $0.04 per share, of accelerated discount accretion relating
to redemption of TARP preferred stock
to redemption of TARP preferred stock
27

Return on Average Assets
0.56%
28

Return on Average Assets
(Quarterly)
29

30
Return on Average
Tangible Equity
Source: SNL Financial

Net Interest Margin
31

Net Interest Margin
- Trends -
32
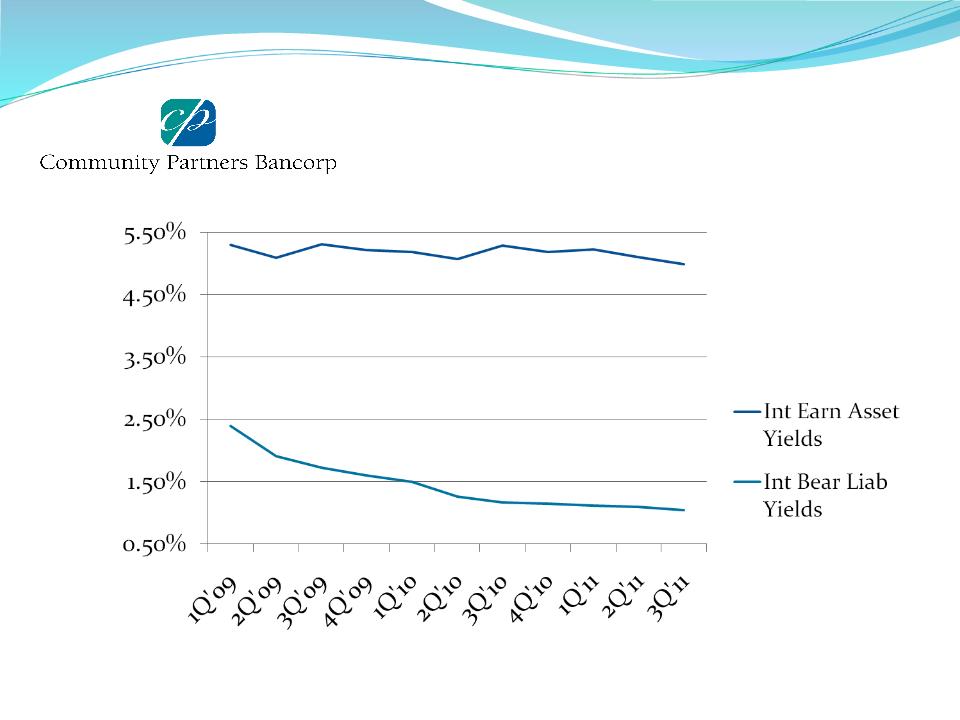
Pricing Trends
33
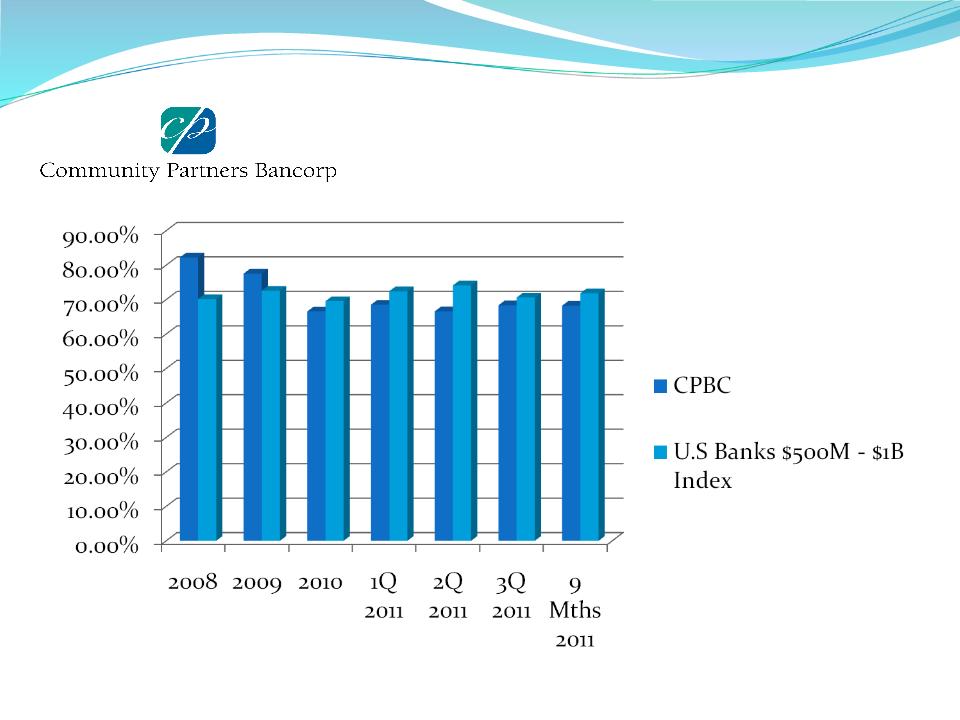
Efficiency Ratio
Source: SNL Financial
34

Capital Events and Ratios
— Received $9.0 million of TARP capital in January 2009 as an
abundance of caution during financial crisis
abundance of caution during financial crisis
— Received $12 million of SBLF capital in August 2011 and fully
redeemed TARP funds
redeemed TARP funds
— Redeemed TARP warrant in October 2011 for $460,000
35

Stock Price and Valuation
As of 11/10/11
Source: SNL Financial
36

— Attractive franchise in some of the more desirable markets in New
Jersey
Jersey
— Experienced and energetic management team and bankers
— Conservative underwriting culture
— Compelling valuation
— Continued strong profitability during challenging economic times
Summary
37

This investor presentation contains certain financial information determined by methods other than in accordance with generally
accepted accounting policies in the United States (GAAP). These non-GAAP financial measures are “net income available to
common shareholders excluding accelerated discount accretion” and “return on average tangible equity.” This non-GAAAP
disclosure has limitations as an analytical tool and should not be considered in isolation or as a substitute for analysis of the
Company's results as reported under GAAP, nor is it necessarily comparable to non-GAAP performance measures that may be
presented by other companies. Our management uses these non-GAAP measures in its analysis of our performance because it
believes these measures are material and will be used as a measure of performance by investors.
Reconciliation of Non-GAAP
Measures
Measures
|
($ in thousands)
|
3Q 2011
|
9 Mths 2011
|
|
Net income available to common shareholders
|
$ 703
|
$2,418
|
|
Effect of accelerated portion of discount accretion
|
301
|
301
|
|
Net income available to common shareholders excluding
accelerated discount accretion |
$1,004
|
$2,719
|
|
|
|
|
|
Diluted earnings per common share
|
$ 0.09
|
$ 0.30
|
|
Effect of accelerated portion of discount accretion
|
0.04
|
0.04
|
|
Diluted earnings per common share excluding accelerated
discount accretion |
$ 0.13
|
$ 0.34
|
|
|
9 Mths 2011
|
9 Mths 2010
|
|
Return on average equity
|
5.03%
|
4.38%
|
|
Effect of average intangible assets
|
1.68%
|
1.66%
|
|
Return on average tangible equity
|
6.71%
|
6.04%
38
|