Attached files
| file | filename |
|---|---|
| 8-K - FORM 8-K - PIEDMONT NATURAL GAS CO INC | d256747d8k.htm |
Exhibit 99.1
Piedmont
Natural Gas
Investor Update
Piedmont Natural Gas November 17-18, 2011
Forward-Looking Statements Under the Private Securities Litigation Reform Act of 1995 This presentation contains forward-looking statements. These statements are based on management’s current expectations and information currently available and are believed to be reasonable and are made in good faith. However, the forward-looking statements are subject to future events, risks, uncertainties and other factors that could cause actual results to differ materially from those projected in the statements. Factors that may make the actual results differ from anticipated results include, but are not limited to, weather conditions, rate of customer growth, the cost and availability of natural gas, competition from other energy providers, new legislation and regulation and application of existing laws and regulations, economic and capital market conditions, the cost and availability of labor and materials, and other uncertainties, all of which are difficult to predict and some of which are beyond our control. For these reasons, you should not rely on these forward-looking statements when making investment decisions. The words “expect,” “believe,” “project,” “anticipate,” “intend,” “should,” “could,” “assume,” “estimate,” “forecast,” “future,” “indicate,” “outlook,” “plan,” “predict,” “seek,” “target,” “would,” and variations of such words and similar expressions are intended to identify forward-looking statements. Forward-looking statements are only as of the date they are made and we do not undertake any obligation to update publicly any forward-looking statement, either as a result of new information, future events or otherwise. More information about the risks and uncertainties relating to these forward-looking statements may be found in Piedmont’s most recent Form 10-Q, which is available on the SEC’s website at http://www.sec.gov. 1 Piedmont Natural Gas
Company Representatives • Karl Newlin – Chief Financial Officer • Rob Pritchard – Treasurer & Chief Risk Officer • Nick Giaimo – Investor Relations 2 Piedmont Natural Gas
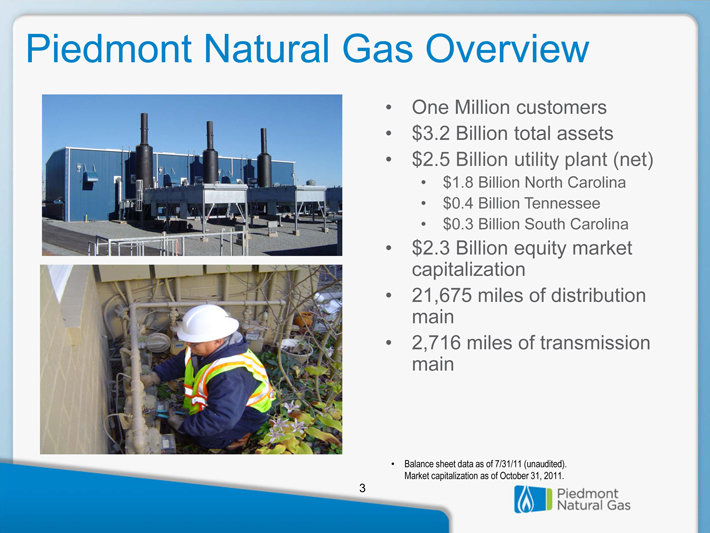
Piedmont Natural Gas Overview • One Million customers • $3.2 Billion total assets • $2.5 Billion utility plant (net) • $1.8 Billion North Carolina • $0.4 Billion Tennessee • $0.3 Billion South Carolina • $2.3 Billion equity market capitalization • 21,675 miles of distribution main • 2,716 miles of transmission main • Balance sheet data as of 7/31/11 (unaudited). Market capitalization as of October 31, 2011. Piedmont Natural Gas 3
Investment Thesis • Pure-Play LDC in the southeastern United States • Regulatory mechanisms stabilize earnings and align interests of customers and shareholders • Strategic joint ventures complement core business • Financial strength leads to investment grade ratings of A and A3 • Good visibility to sources of future earnings growth and competitive dividend yield Piedmont Natural Gas 4
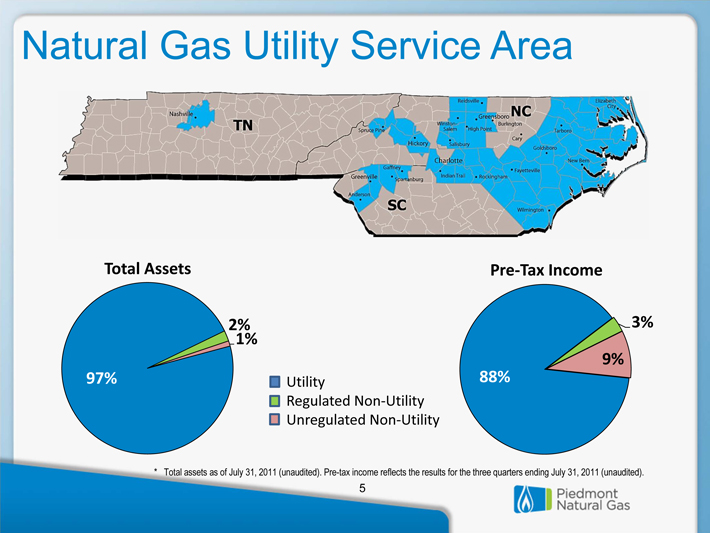
Natural Gas Utility Service Area Total Assets Pre Tax Income Utility Regulated Non Utility Unregulated Non Utility * Total assets as of July 31, 2011 (unaudited). Pre-tax income reflects the results for the three quarters ending July 31, 2011 (unaudited). 97% 2% 1% 88% 9% 3% Piedmont Natural Gas 5
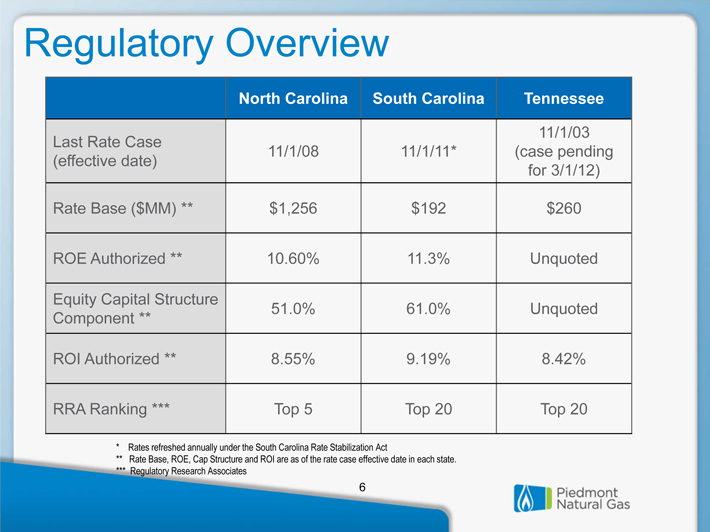
Regulatory Overview North Carolina South Carolina Tennessee 11/1/03 Last Rate Case 11/1/08 11/1/11* case pending (effective date) for 3/1/12) Rate Base ($MM) ** $1,256 $192 $260 ROE Authorized ** 10.60% 11.3% Unquoted Equity Capital Structure 51.0% 61.0% Unquoted Component ** ROI Authorized ** 8.55% 9.19% 8.42% RRA Ranking *** Top 5 Top 20 Top 20 * Rates refreshed annually under the South Carolina Rate Stabilization Act ** Rate Base, ROE, Cap Structure and ROI are as of the rate case effective date in each state. *** Regulatory Research Associates 6 Piedmont Natural Gas
Tennessee Rate Case • Filed general rate case with the Tennessee Regulatory Authority (TRA) on September 2, 2011 • Filing proposes: • Incremental revenue of $16.7 million (+8.9%) • ROE of 11.25% with a 52.7% equity capital structure component • Rate design that increases fixed recovery of costs • Amortization of regulatory assets and deferred costs and new depreciation rates • Recovery of pipeline integrity and safety-related investments • New rates effective March 1, 2012 • Last rate case effective November 1, 2003 Piedmont Natural Gas 7
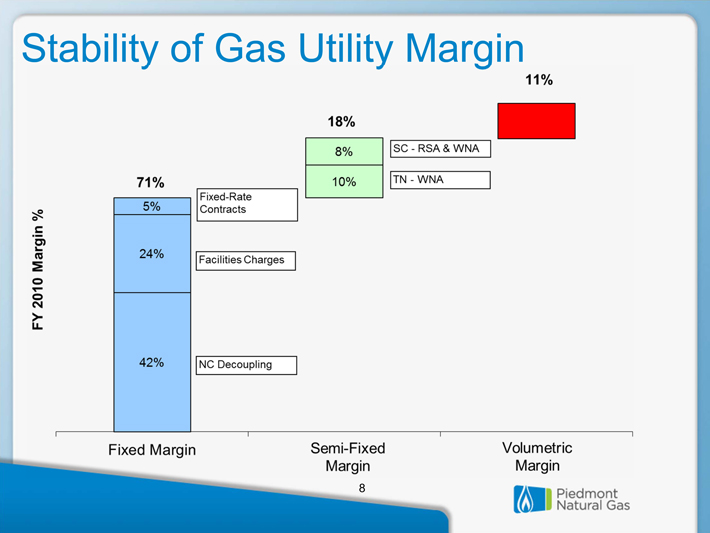
Stability of Gas Utility Margin 11% 18% 71% 8% 10% SC – RSA & WNA TN – WNA 5% Fixed-Rate Contracts 24% Facilities Charges 42% NC Decoupling FY 2010 Margin % Fixed Margin Semi-Fixed Margin Volumetric Margin Piedmont Natural Gas 8
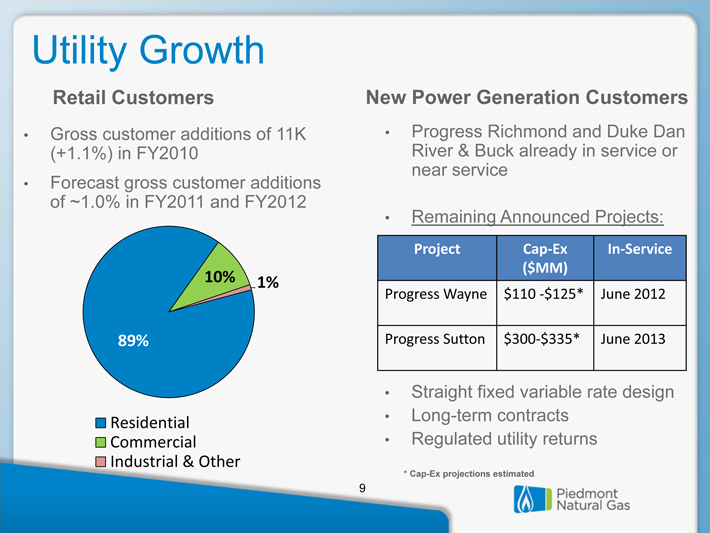
Utility Growth Retail Customers • Gross customer additions of 11K (+1.1%) in FY2010 • Forecast gross customer additions of ~1.0% in FY2011 and FY2012 New Power Generation Customers • Progress Richmond and Duke Dan River & Buck already in service or near service • Remaining Announced Projects: Project apEx InService ($MM) Progress Wayne $110 ?$125* June 2012 Progress Sutton $300?$335* June 2013 • Straight fixed variable rate design • Long-term contracts
• Regulated utility returns * Cap-Ex projections estimated 89% 10% 1% Residential Commercial Industrial & Other Piedmont Natural Gas 9
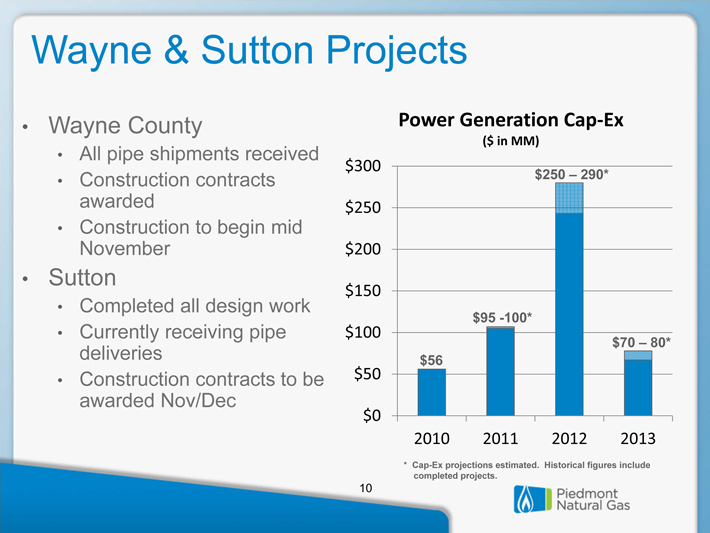
Wayne & Sutton Projects • Wayne County • All pipe shipments received • Construction contracts awarded • Construction to begin mid November • Sutton • Completed all design work • Currently receiving pipe deliveries • Construction contracts to be awarded Nov/Dec Power Generation Cap? Ex ($ in MM) $300 $250 – 290* $250 $200 $150 $95 -100* $100 $70 – 80* $56 $50 $0 2010 2011 2012 2013 * Cap-Ex projections estimated. Historical figures include completed projects. 10 Piedmont Natural Gas
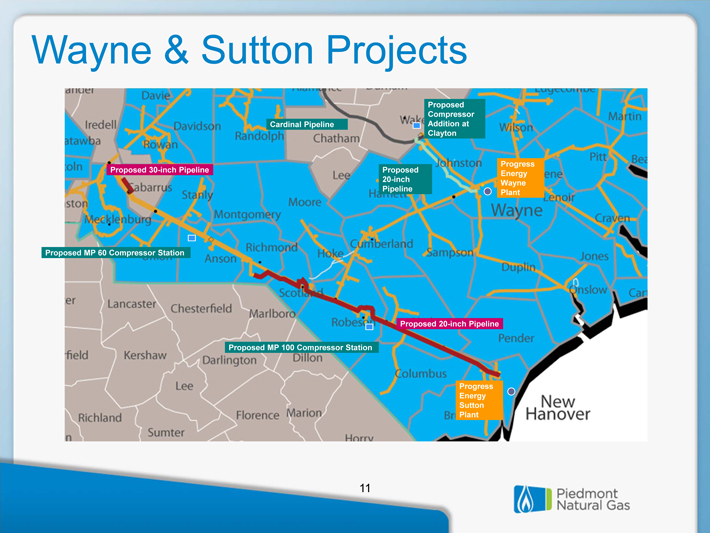
Wayne & Sutton Projects Progress Energy Wayne Plant Proposed Compressor Cardinal Pipeline Addition at Clayton Progress Proposed 30-inch Pipeline Proposed Energy 20-inch Wayne Pipeline Plant Proposed MP 60 Compressor Station Proposed 20-inch Pipeline Proposed MP 100 Compressor Station Progress Energy Sutton Plant Piedmont Natural Gas 11
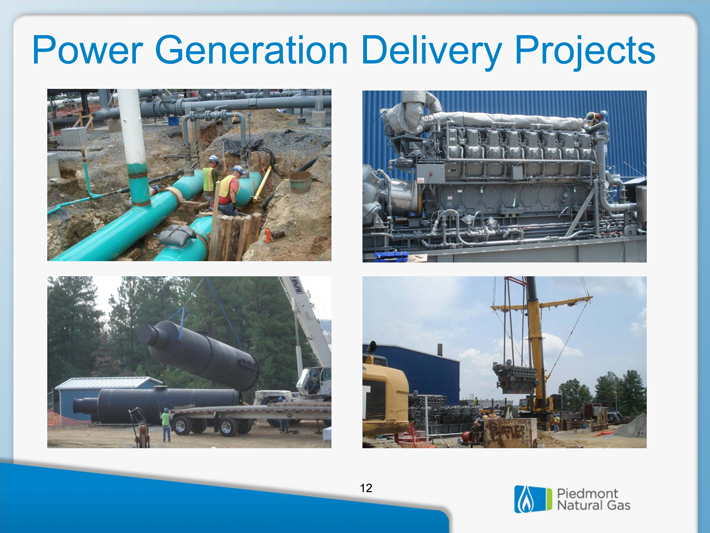
Power Generation Delivery Projects 12 Piedmont Natural Gas
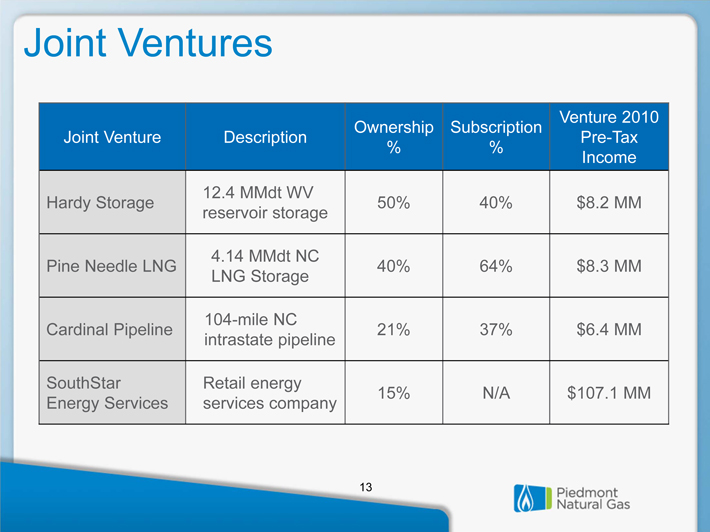
Joint Ventures Ownership Subscription Venture 2010 Joint Venture Description Pre-Tax % % Income 12.4 MMdt WV Hardy Storage 50% 40% $8.2 MM reservoir storage 4.14 MMdt NC Pine Needle LNG 40% 64% $8.3 MM LNG Storage 104-mile NC
Cardinal Pipeline 21% 37% $6.4 MM intrastate pipeline SouthStar Retail energy 15% N/A $107.1 MM Energy Services servicescompany Piedmont Natural Gas 13
Strategic Directives • Promote the benefits of natural gas • Expand our core natural gas and complementary energy-related businesses to enhance shareholder value • Be the energy and service provider of choice • Achieve excellence in customer service every time • Preserve financial strength and flexibility • Execute sustainable business practices • Enhance our healthy, high-performance culture Piedmont Natural Gas 14
2012 Earnings Guidance of $1.58—$1.68 per diluted share (Assumptions) • Gross customer additions of ~1% • Wayne County project in service on June 1, 2012 • $3.1 million margin decrease under South Carolina RSA • Capital expenditures of $550—$600 Million • $250—$290 Million for power generation projects • $70 – $80 Million for transmission pipeline integrity • $22 Million income from AFUDC • Issuance of $300 Million of long-term debt • Stock repurchases only to offset DRIP and incentive issuances • Continued performance from joint ventures Piedmont Natural Gas 15
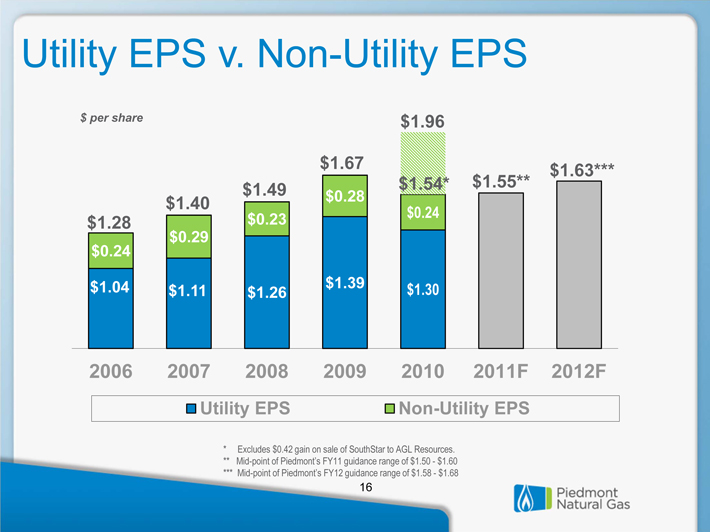
Utility EPS v. Non-Utility EPS $ per share $1.96 $1.67 $1.63*** $1.54* $1.55** $1.49 $0.28 $1.40 $0.23 $0.24 $1.28 $0.24 $0.29 $1.04 $1.39 $1.30 $1.11 $1.26 2006 2007 2008 2009 2010 2011F 2012F Utility EPS Non-Utility EPS * Excludes $0.42 gain on sale of SouthStar to AGL Resources. ** Mid-point of Piedmont’s FY11 guidance range of $1.50—$1.60 *** Mid-point of Piedmont’s FY12 guidance range of $1.58—$1.68 Piedmont Natural Gas 16
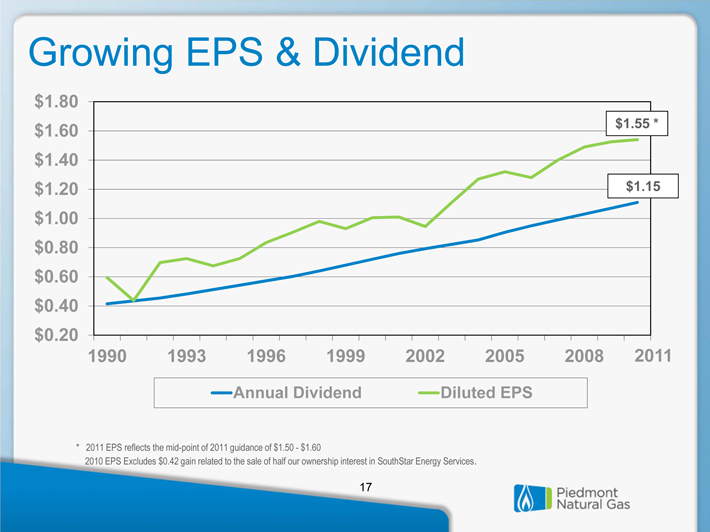
Growing EPS & Dividend $1.80 $1.60 $1.55 * $1.40 $1.20 $1.15 $1.00 $0.80 $0.60 $0.40 $0.20 1990 1993 1996 1999 2002 2005 2008 2011 Annual Dividend Diluted EPS * 2011 EPS reflects the mid-point of 2011 guidance of $1.50—$1.60
2010 EPS Excludes $0.42 gain related to the sale of half our ownership interest in SouthStar Energy Services. PiedmontNatural Gas 17