Attached files
| file | filename |
|---|---|
| 8-K - FORM 8-K - Noranda Aluminum Holding CORP | c24862e8vk.htm |
Exhibit 99.1
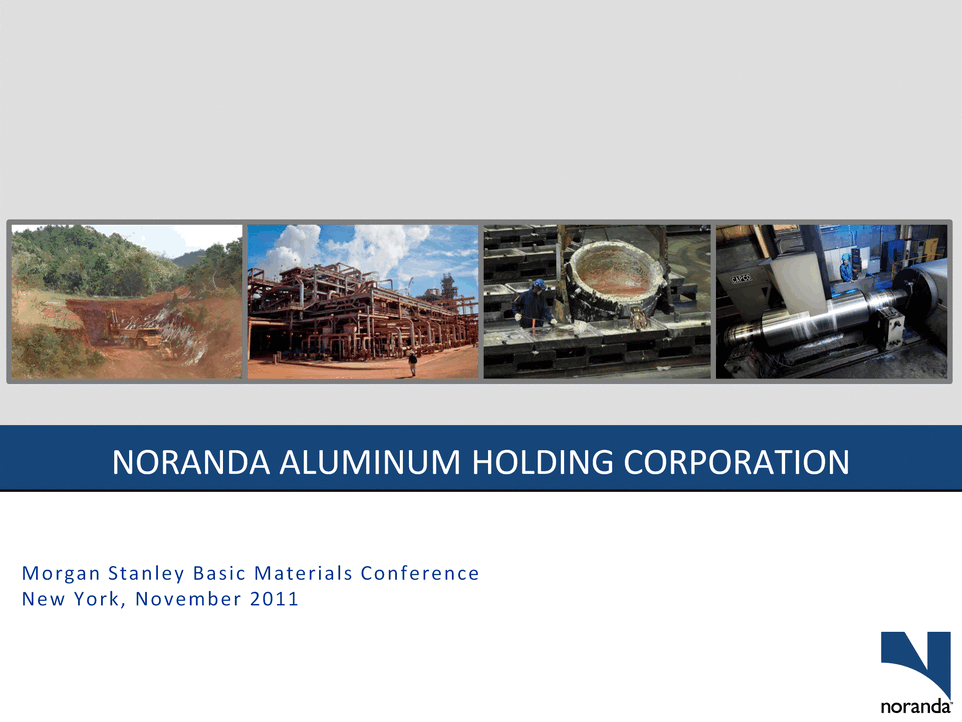
| NORANDA ALUMINUM HOLDING CORPORATION Morgan Stanley Basic Materials Conference New York, November 2011 |
| The presentation and comments made by Noranda's management contain "forward-looking statements" within the meaning of the Private Securities Litigation Reform Act of 1995. Forward-looking statements are statements about future, not past, events and involve certain important risks and uncertainties, any of which could cause the Company's actual results to differ materially from those expressed in forward-looking statements, including, without limitation: the cyclical nature of the aluminum industry and fluctuating commodity prices, which cause variability in earnings and cash flows; a downturn in general economic conditions, including changes in interest rates, as well as a downturn in the end-use markets for certain of the Company's products; fluctuations in the relative cost of certain raw materials and energy compared to the price of primary aluminum and aluminum rolled products; the effects of competition in Noranda's business lines; Noranda's ability to retain customers, a substantial number of which do not have long-term contractual arrangements with the Company; the ability to fulfill the business's substantial capital investment needs; labor relations (i.e. disruptions, strikes or work stoppages) and labor costs; unexpected issues arising in connection with Noranda's operations outside of the United States; the ability to retain key management personnel; and Noranda's expectations with respect to its acquisition activity, or difficulties encountered in connection with acquisitions, dispositions or similar transactions. Forward-looking statements contain words such as "believes," "expects," "may," "should," "seeks," "approximately," "intends," "plans," "estimates," or "anticipates" or similar expressions that relate to Noranda's strategy, plans or intentions. All statements Noranda makes relating to its estimated and projected earnings, margins, costs, expenditures, cash flows, growth rates and financial results or to the Company's expectations regarding future industry trends are forward-looking statements. Noranda undertakes no obligation to publicly update or revise any forward-looking statement as a result of new information, future events or otherwise, except as otherwise required by law. Readers are cautioned not to place undue reliance on forward-looking statements, which speak only as of the date on which they are made and which reflect management's current estimates, projections, expectations or beliefs. For a discussion of additional risks and uncertainties that may affect the future results of Noranda, please see the Company's filings with the Securities and Exchange Commission, including its Annual Report on Form 10-K. Forward Looking Statements 2 |
| Mr. Mahoney was appointed Chief Financial Officer in May 2009 Mr. Mahoney has over 24 years of cyclical industry experience in senior financial management positions for semiconductor and electrical components companies including Hi-P International Limited and Molex Inc. Mr. Mahoney received a BA in Economics and History from the University of Virginia and an MBA from the University of Michigan Layle K. "Kip" Smith President & Chief Executive Officer Mr. Smith was appointed President, Chief Executive Officer and Director in 2008 Mr. Smith has diverse leadership experience, including various management assignments with The Dow Chemical Company and positions as COO of Resolution Performance Products and CEO of Covalence Specialty Materials Mr. Smith holds a BA in Chemistry and an MBA from Harvard University 3 Management Attendees Noranda Aluminum Holding Corporation Robert B. Mahoney Chief Financial Officer John A. Parker Director of Financial Reporting Mr. Parker joined Noranda in August 2007 Mr. Parker has over 16 years of experience in financial accounting and reporting for growth-oriented private equity sponsored and public companies, including experience gained as an audit executive at Ernst & Young |
| Global economic growth and favorable substitute trends drive positive aluminum demand fundamentals, with price supported by cost pressure Our operating model drives value across the cycle We are fully integrated, from bauxite to aluminum foil We are cost independent from, and leveraged to, LME prices We have cost effective, globally competitive assets We choose to manage with a focus on productivity We drive a value-added growth strategy We have financial capacity and flexibility to support growth and prudent return of capital We have a highly flexible capital structure with no near-term maturities, undrawn revolver and no maintenance covenants We have initiated a regular quarterly dividend program Key Investment Messages 4 Noranda Aluminum Holding Corporation |
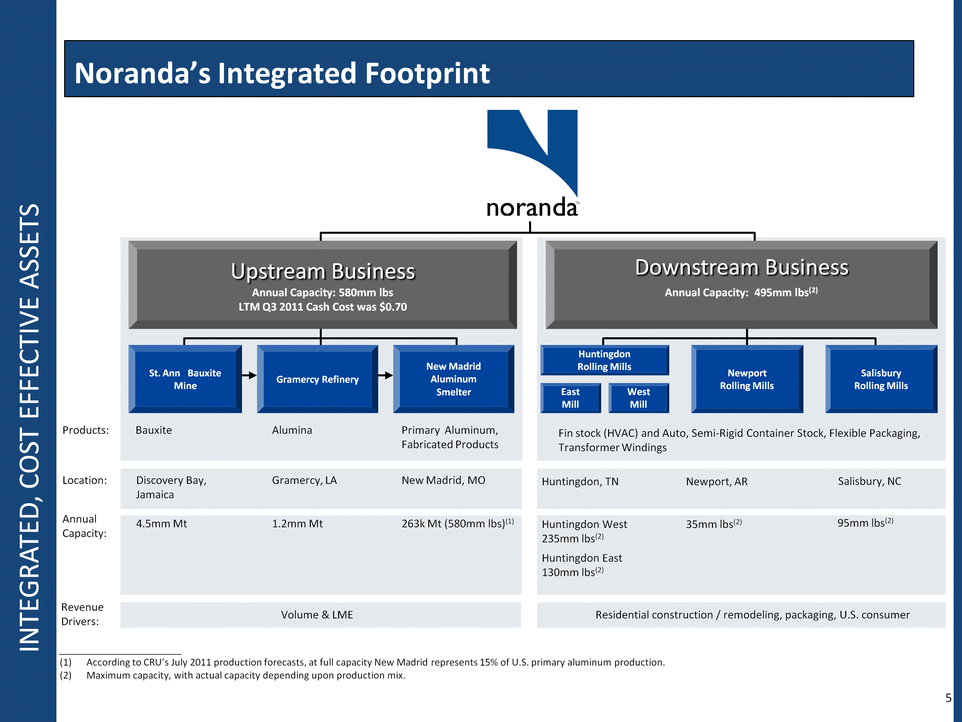
| Downstream Business Annual Capacity: 495mm lbs(2) St. Ann Bauxite Mine New Madrid Aluminum Smelter Newport Rolling Mills Salisbury Rolling Mills East Mill West Mill Huntingdon Rolling Mills Bauxite Discovery Bay, Jamaica 4.5mm Mt Alumina Gramercy, LA 1.2mm Mt Primary Aluminum, Fabricated Products New Madrid, MO 263k Mt (580mm lbs)(1) Fin stock (HVAC) and Auto, Semi-Rigid Container Stock, Flexible Packaging, Transformer Windings Huntingdon, TN Huntingdon West 235mm lbs(2) Huntingdon East 130mm lbs(2) Newport, AR 35mm lbs(2) Salisbury, NC 95mm lbs(2) Products: Location: Annual Capacity: Upstream Business Annual Capacity: 580mm lbs LTM Q3 2011 Cash Cost was $0.70 Gramercy Refinery Revenue Drivers: Volume & LME Residential construction / remodeling, packaging, U.S. consumer _______________________ (1) According to CRU's July 2011 production forecasts, at full capacity New Madrid represents 15% of U.S. primary aluminum production. (2) Maximum capacity, with actual capacity depending upon production mix. Noranda's Integrated Footprint INTEGRATED, COST EFFECTIVE ASSETS 5 |
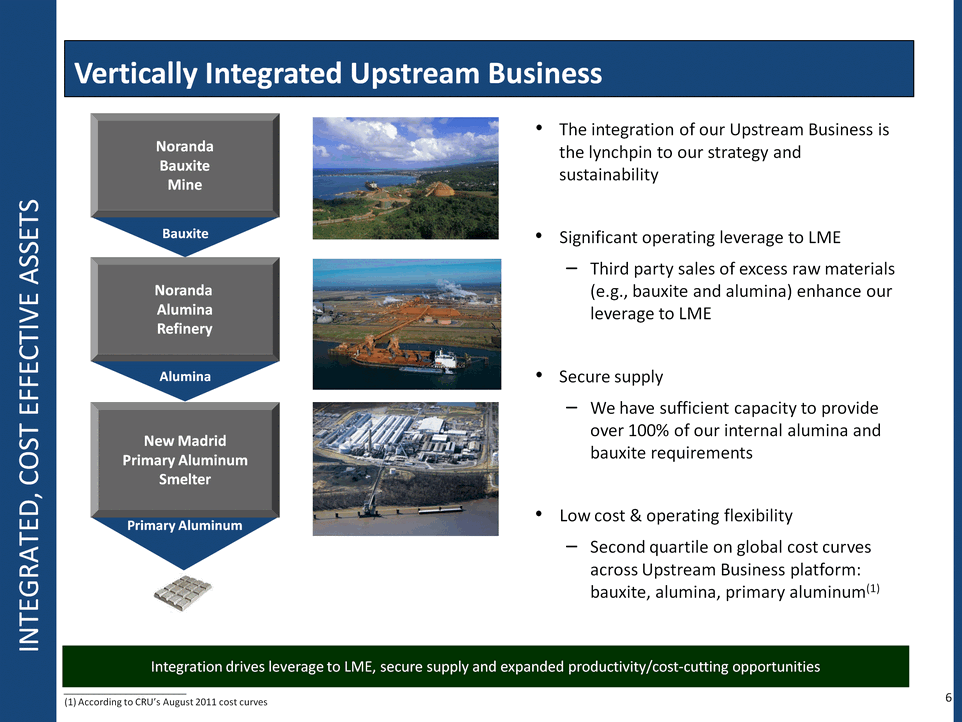
| INTEGRATED, COST EFFECTIVE ASSETS Vertically Integrated Upstream Business Primary Aluminum Alumina Noranda Bauxite Mine Noranda Alumina Refinery New Madrid Primary Aluminum Smelter Bauxite Integration drives leverage to LME, secure supply and expanded productivity/cost-cutting opportunities The integration of our Upstream Business is the lynchpin to our strategy and sustainability Significant operating leverage to LME Third party sales of excess raw materials (e.g., bauxite and alumina) enhance our leverage to LME Secure supply We have sufficient capacity to provide over 100% of our internal alumina and bauxite requirements Low cost & operating flexibility Second quartile on global cost curves across Upstream Business platform: bauxite, alumina, primary aluminum(1) 6 _______________________ (1) According to CRU's August 2011 cost curves |
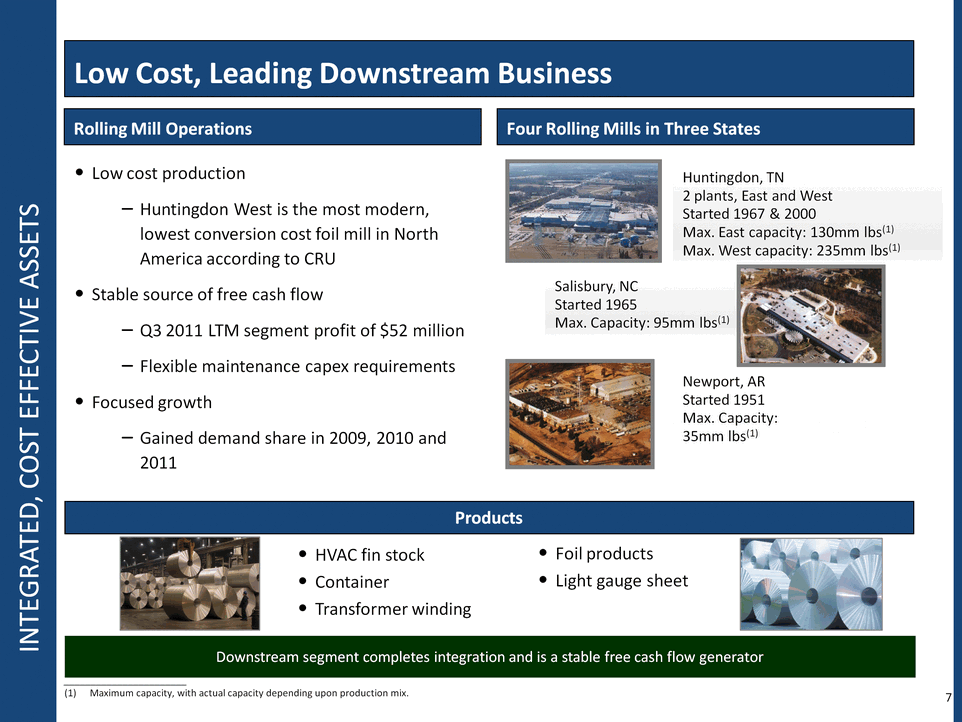
| Foil products Light gauge sheet Rolling Mill Operations Four Rolling Mills in Three States Huntingdon, TN 2 plants, East and West Started 1967 & 2000 Max. East capacity: 130mm lbs(1) Max. West capacity: 235mm lbs(1) Salisbury, NC Started 1965 Max. Capacity: 95mm lbs(1) Newport, AR Started 1951 Max. Capacity: 35mm lbs(1) Downstream segment completes integration and is a stable free cash flow generator Low Cost, Leading Downstream Business INTEGRATED, COST EFFECTIVE ASSETS Low cost production Huntingdon West is the most modern, lowest conversion cost foil mill in North America according to CRU Stable source of free cash flow Q3 2011 LTM segment profit of $52 million Flexible maintenance capex requirements Focused growth Gained demand share in 2009, 2010 and 2011 Products _______________________ (1) Maximum capacity, with actual capacity depending upon production mix. HVAC fin stock Container Transformer winding 7 |
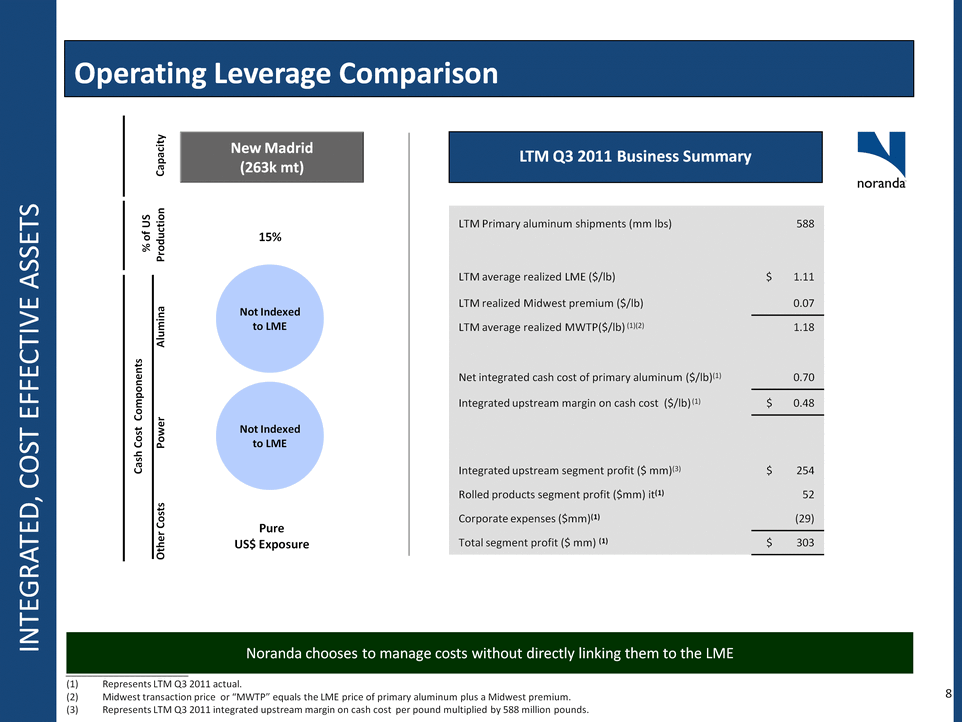
| Noranda chooses to manage costs without directly linking them to the LME Operating Leverage Comparison INTEGRATED, COST EFFECTIVE ASSETS 15% New Madrid (263k mt) Not Indexed to LME Not Indexed to LME Pure US$ Exposure % of US Production Capacity Other Costs Power Alumina Cash Cost Components LTM Q3 2011 Business Summary _______________________ Represents LTM Q3 2011 actual. Midwest transaction price or "MWTP" equals the LME price of primary aluminum plus a Midwest premium. (3) Represents LTM Q3 2011 integrated upstream margin on cash cost per pound multiplied by 588 million pounds. LTM Primary aluminum shipments (mm lbs) 588 LTM average realized LME ($/lb) $ 1.11 LTM realized Midwest premium ($/lb) 0.07 LTM average realized MWTP($/lb) (1)(2) 1.18 Net integrated cash cost of primary aluminum ($/lb)(1) 0.70 Integrated upstream margin on cash cost ($/lb) (1) $ 0.48 Integrated upstream segment profit ($ mm)(3) $ 254 Rolled products segment profit ($mm) it(1) 52 Corporate expenses ($mm)(1) (29) Total segment profit ($ mm) (1) $ 303 8 |
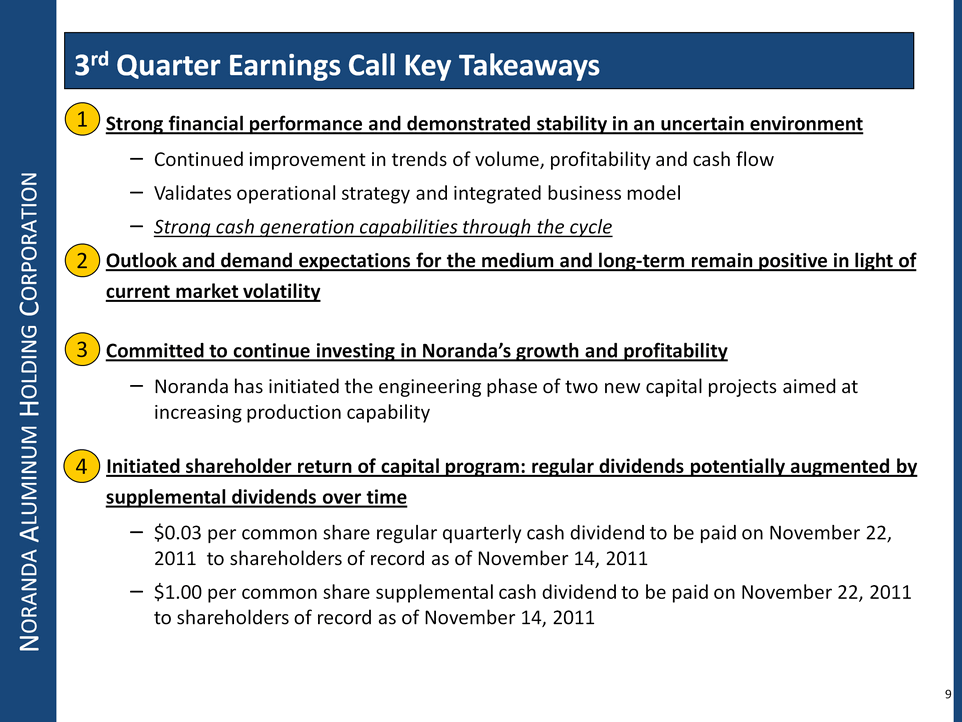
| Noranda Aluminum Holding Corporation Strong financial performance and demonstrated stability in an uncertain environment Continued improvement in trends of volume, profitability and cash flow Validates operational strategy and integrated business model Strong cash generation capabilities through the cycle Outlook and demand expectations for the medium and long-term remain positive in light of current market volatility Committed to continue investing in Noranda's growth and profitability Noranda has initiated the engineering phase of two new capital projects aimed at increasing production capability Initiated shareholder return of capital program: regular dividends potentially augmented by supplemental dividends over time $0.03 per common share regular quarterly cash dividend to be paid on November 22, 2011 to shareholders of record as of November 14, 2011 $1.00 per common share supplemental cash dividend to be paid on November 22, 2011 to shareholders of record as of November 14, 2011 3rd Quarter Earnings Call Key Takeaways 9 3 1 2 4 |
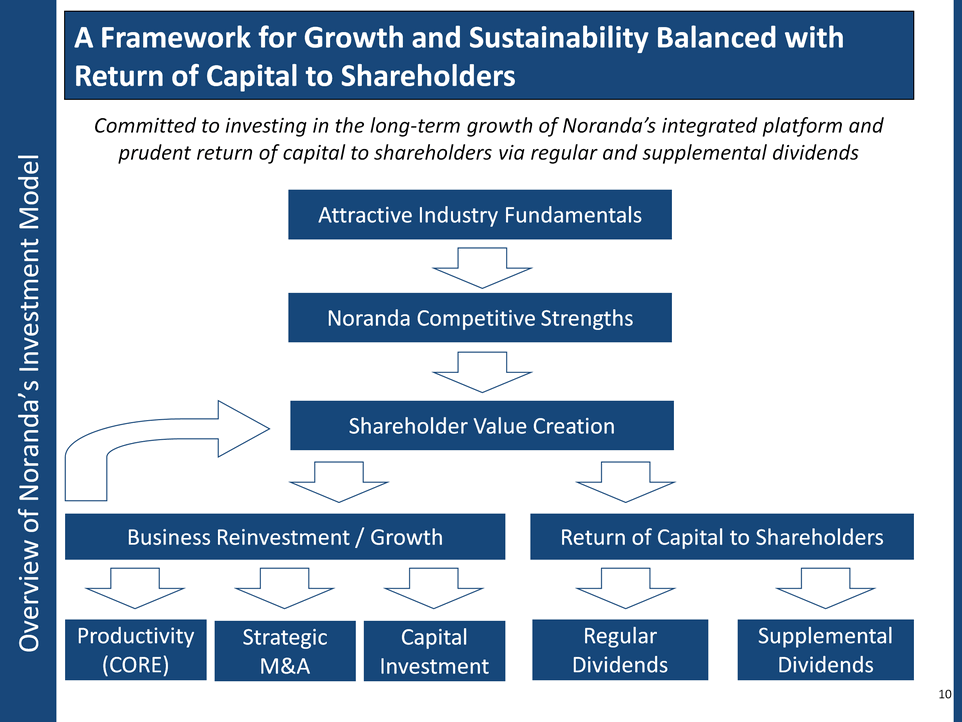
| Overview of Noranda's Investment Model A Framework for Growth and Sustainability Balanced with Return of Capital to Shareholders 10 Attractive Industry Fundamentals Noranda Competitive Strengths Shareholder Value Creation Business Reinvestment / Growth Return of Capital to Shareholders Regular Dividends Supplemental Dividends Committed to investing in the long-term growth of Noranda's integrated platform and prudent return of capital to shareholders via regular and supplemental dividends Productivity (CORE) Capital Investment Strategic M&A |
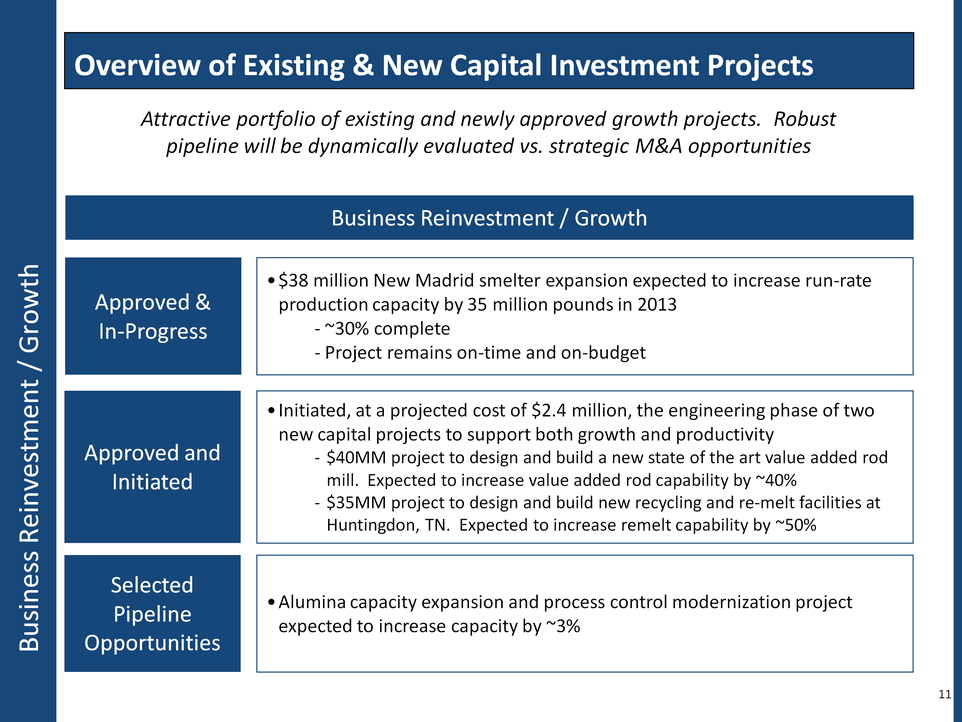
| Business Reinvestment / Growth 11 Overview of Existing & New Capital Investment Projects Attractive portfolio of existing and newly approved growth projects. Robust pipeline will be dynamically evaluated vs. strategic M&A opportunities Business Reinvestment / Growth Approved & In-Progress Approved and Initiated Initiated, at a projected cost of $2.4 million, the engineering phase of two new capital projects to support both growth and productivity - $40MM project to design and build a new state of the art value added rod mill. Expected to increase value added rod capability by ~40% - $35MM project to design and build new recycling and re-melt facilities at Huntingdon, TN. Expected to increase remelt capability by ~50% Selected Pipeline Opportunities Alumina capacity expansion and process control modernization project expected to increase capacity by ~3% $38 million New Madrid smelter expansion expected to increase run-rate production capacity by 35 million pounds in 2013 - ~30% complete - Project remains on-time and on-budget |
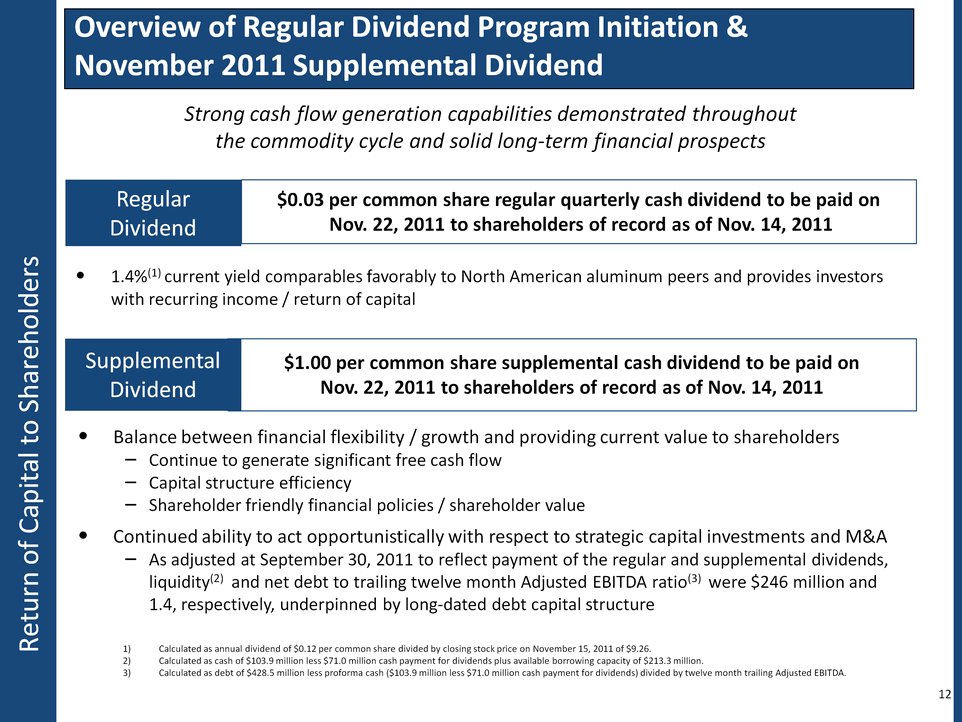
| Return of Capital to Shareholders 12 Overview of Regular Dividend Program Initiation & November 2011 Supplemental Dividend Strong cash flow generation capabilities demonstrated throughout the commodity cycle and solid long-term financial prospects Balance between financial flexibility / growth and providing current value to shareholders Continue to generate significant free cash flow Capital structure efficiency Shareholder friendly financial policies / shareholder value Continued ability to act opportunistically with respect to strategic capital investments and M&A As adjusted at September 30, 2011 to reflect payment of the regular and supplemental dividends, liquidity(2) and net debt to trailing twelve month Adjusted EBITDA ratio(3) were $246 million and 1.4, respectively, underpinned by long-dated debt capital structure Supplemental Dividend $1.00 per common share supplemental cash dividend to be paid on Nov. 22, 2011 to shareholders of record as of Nov. 14, 2011 Regular Dividend $0.03 per common share regular quarterly cash dividend to be paid on Nov. 22, 2011 to shareholders of record as of Nov. 14, 2011 1.4%(1) current yield comparables favorably to North American aluminum peers and provides investors with recurring income / return of capital Calculated as annual dividend of $0.12 per common share divided by closing stock price on November 15, 2011 of $9.26. Calculated as cash of $103.9 million less $71.0 million cash payment for dividends plus available borrowing capacity of $213.3 million. Calculated as debt of $428.5 million less proforma cash ($103.9 million less $71.0 million cash payment for dividends) divided by twelve month trailing Adjusted EBITDA. |
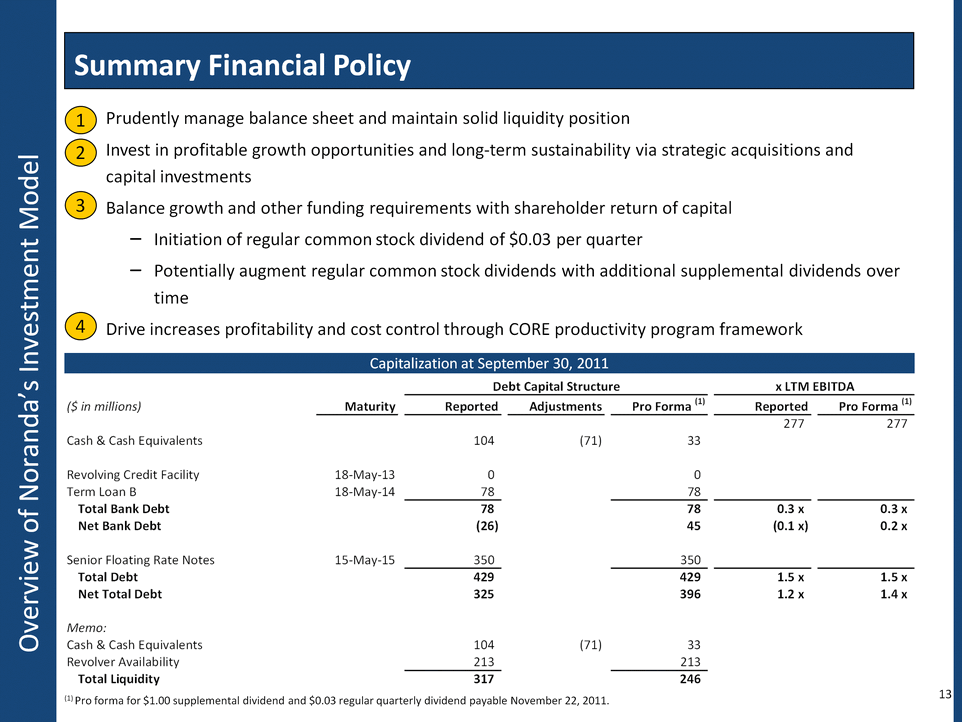
| Overview of Noranda's Investment Model 13 Summary Financial Policy Prudently manage balance sheet and maintain solid liquidity position Invest in profitable growth opportunities and long-term sustainability via strategic acquisitions and capital investments Balance growth and other funding requirements with shareholder return of capital Initiation of regular common stock dividend of $0.03 per quarter Potentially augment regular common stock dividends with additional supplemental dividends over time Drive increases profitability and cost control through CORE productivity program framework 1 2 3 4 Capitalization at September 30, 2011 (1) Pro forma for $1.00 supplemental dividend and $0.03 regular quarterly dividend payable November 22, 2011. |
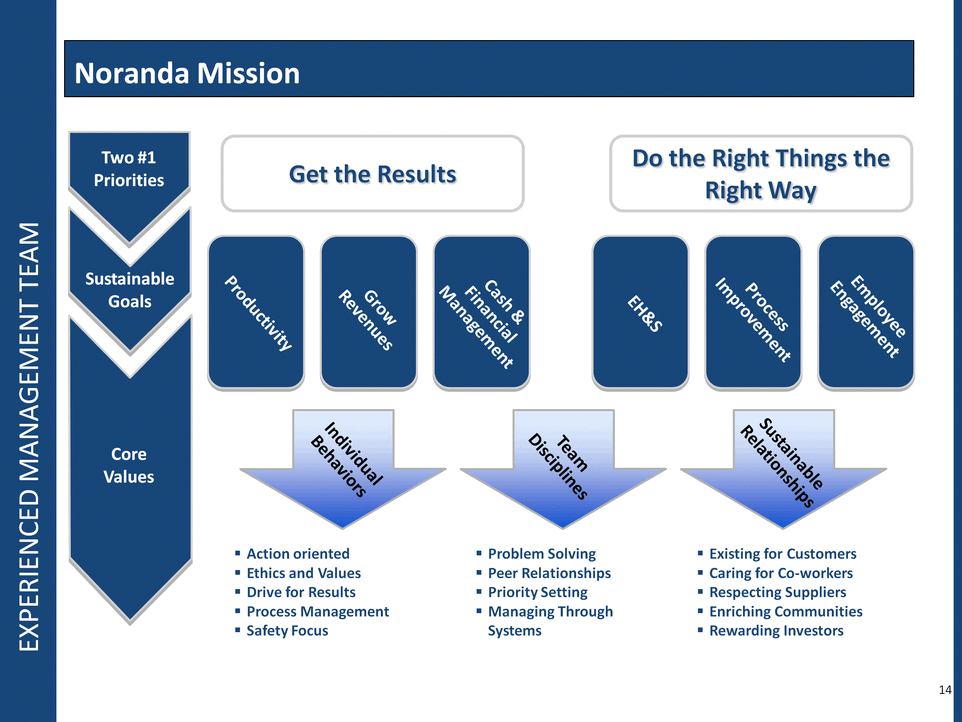
| EXPERIENCED MANAGEMENT TEAM Noranda Mission Get the Results Do the Right Things the Right Way Two #1 Priorities Sustainable Goals Core Values Productivity Grow Revenues Cash & Financial Management EH&S Process Improvement Employee Engagement Individual Behaviors Team Disciplines Sustainable Relationships Action oriented Ethics and Values Drive for Results Process Management Safety Focus Problem Solving Peer Relationships Priority Setting Managing Through Systems Existing for Customers Caring for Co-workers Respecting Suppliers Enriching Communities Rewarding Investors 14 |

| Q3 Results |
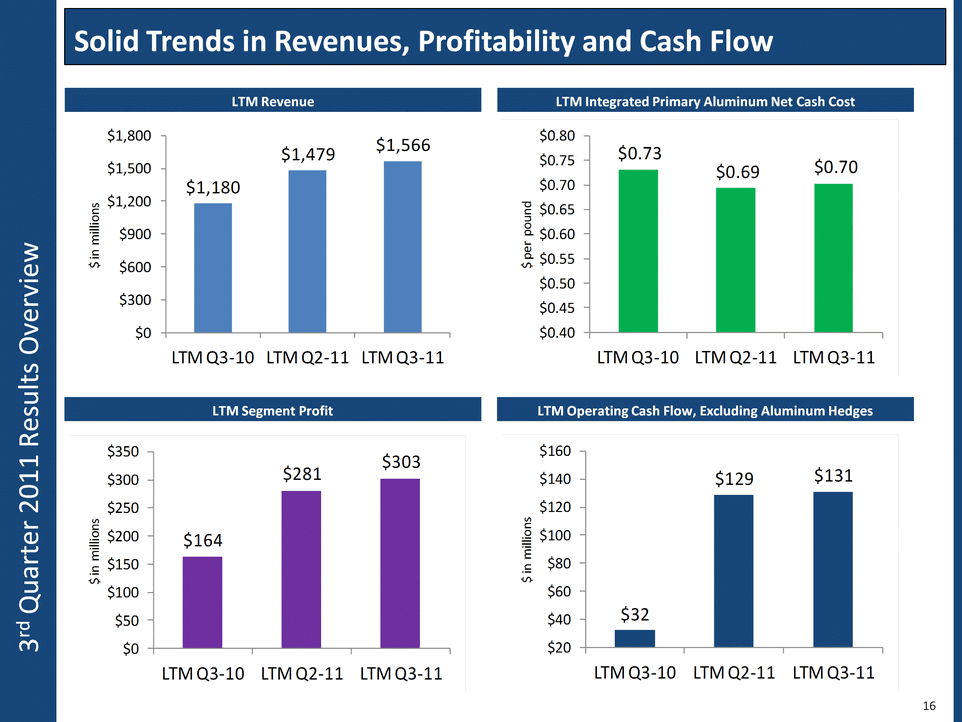
| 3rd Quarter 2011 Results Overview LTM Revenue LTM Segment Profit LTM Integrated Primary Aluminum Net Cash Cost LTM Operating Cash Flow, Excluding Aluminum Hedges Solid Trends in Revenues, Profitability and Cash Flow 16 |
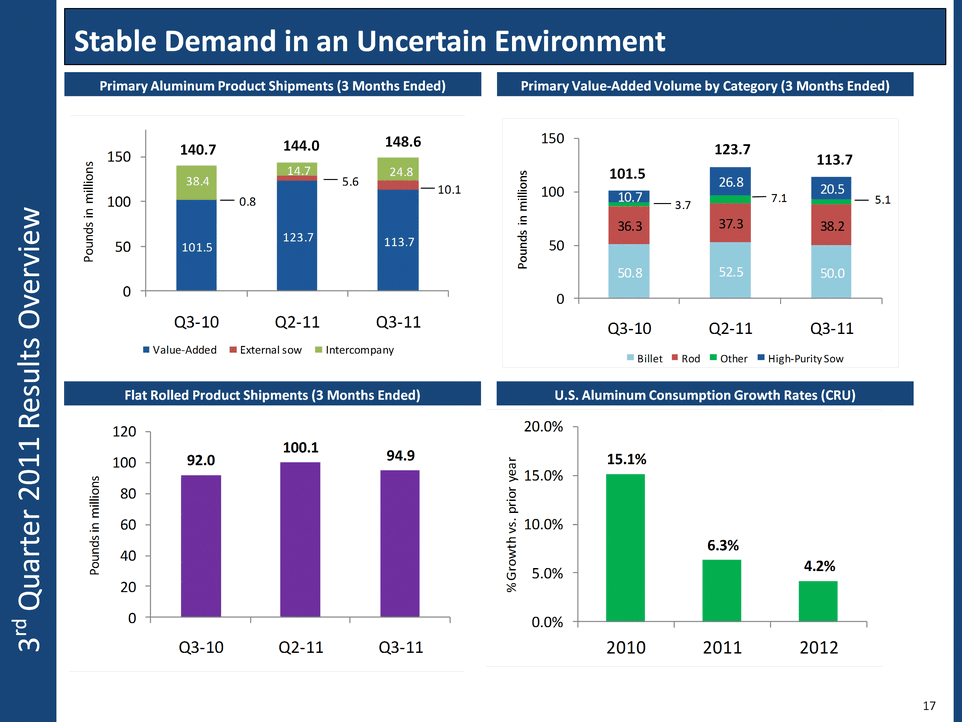
| Primary Aluminum Product Shipments (3 Months Ended) Primary Value-Added Volume by Category (3 Months Ended) U.S. Aluminum Consumption Growth Rates (CRU) 17 Stable Demand in an Uncertain Environment Flat Rolled Product Shipments (3 Months Ended) 101.5 123.7 113.7 140.7 144.0 148.6 3rd Quarter 2011 Results Overview |
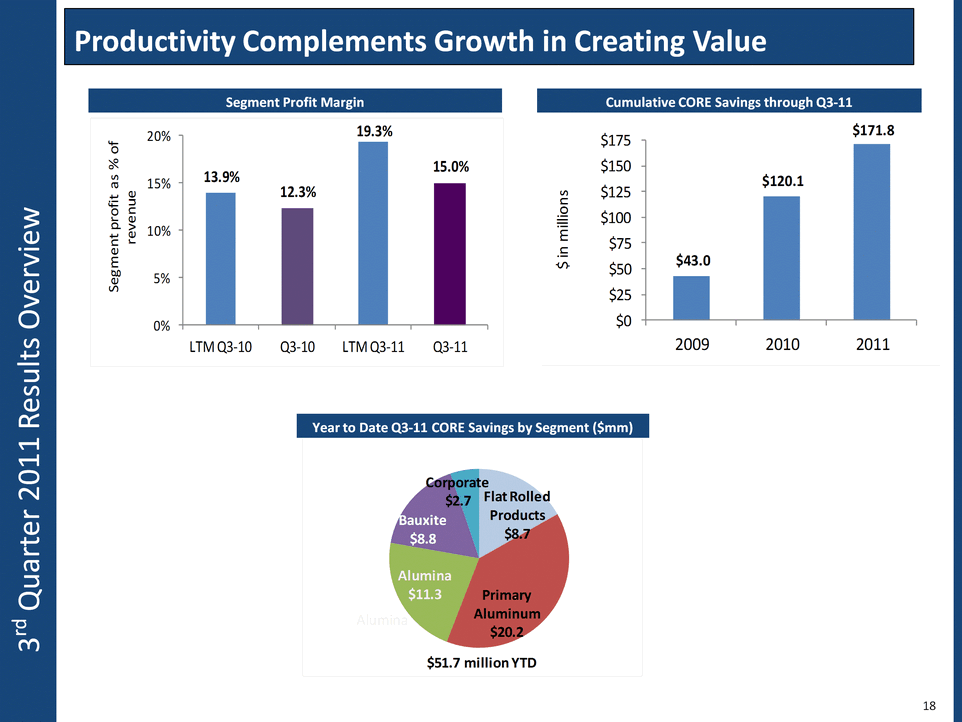
| Cumulative CORE Savings through Q3-11 Year to Date Q3-11 CORE Savings by Segment ($mm) Productivity Complements Growth in Creating Value Segment Profit Margin 3rd Quarter 2011 Results Overview 18 |
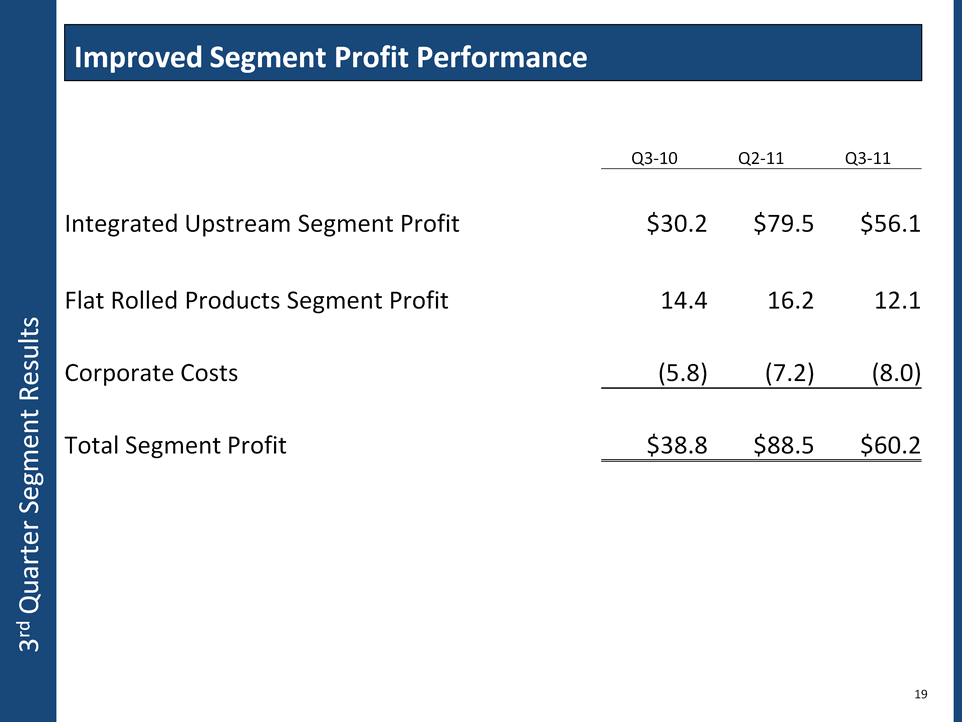
| 3rd Quarter Segment Results 19 Improved Segment Profit Performance Q3-10 Q2-11 Q3-11 Integrated Upstream Segment Profit $30.2 $79.5 $56.1 Flat Rolled Products Segment Profit 14.4 16.2 12.1 Corporate Costs (5.8) (7.2) (8.0) Total Segment Profit $38.8 $88.5 $60.2 |
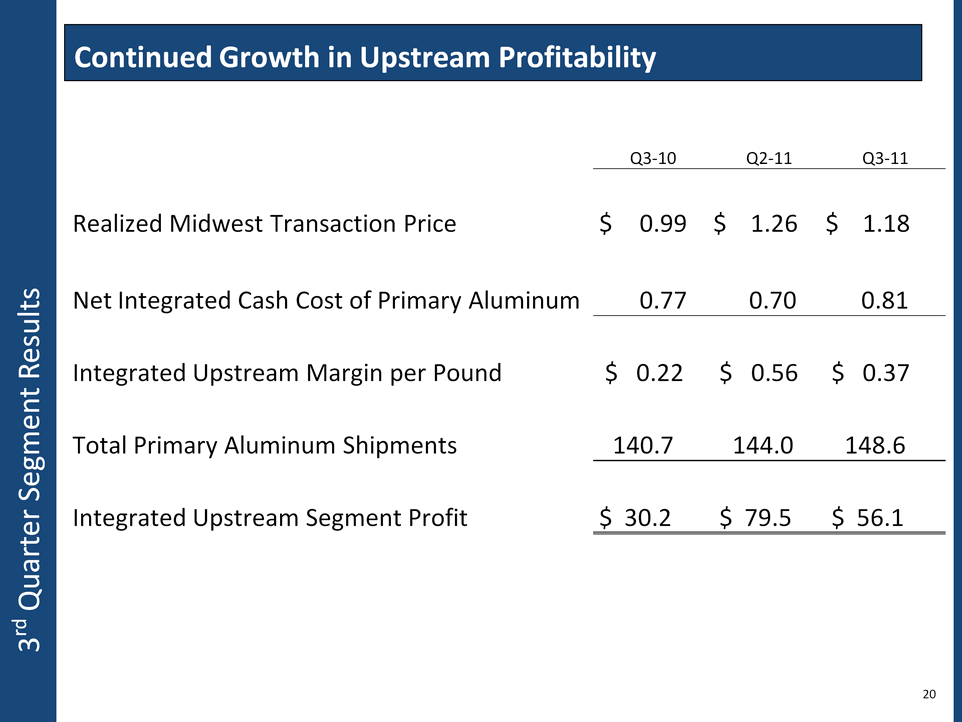
| 20 Continued Growth in Upstream Profitability Q3-10 Q2-11 Q3-11 Realized Midwest Transaction Price $ 0.99 $ 1.26 $ 1.18 Net Integrated Cash Cost of Primary Aluminum 0.77 0.70 0.81 Integrated Upstream Margin per Pound $ 0.22 $ 0. 56 $ 0.37 Total Primary Aluminum Shipments 140.7 144.0 148.6 Integrated Upstream Segment Profit $ 30.2 $ 79.5 $ 56.1 3rd Quarter Segment Results |
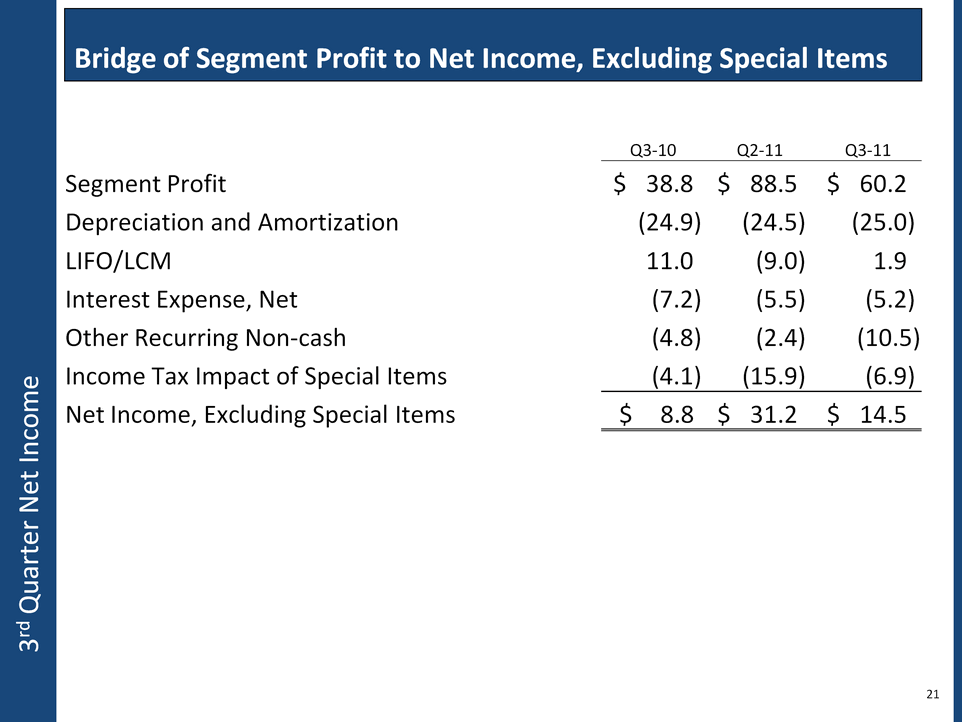
| 3rd Quarter Net Income 21 Bridge of Segment Profit to Net Income, Excluding Special Items Q3-10 Q2-11 Q3-11 Segment Profit $ 38.8 $ 88.5 $ 60.2 Depreciation and Amortization (24.9) (24.5) (25.0) LIFO/LCM 11.0 (9.0) 1.9 Interest Expense, Net (7.2) (5.5) (5.2) Other Recurring Non-cash (4.8) (2.4) (10.5) Income Tax Impact of Special Items (4.1) (15.9) (6.9) Net Income, Excluding Special Items $ 8.8 $ 31.2 $ 14.5 |
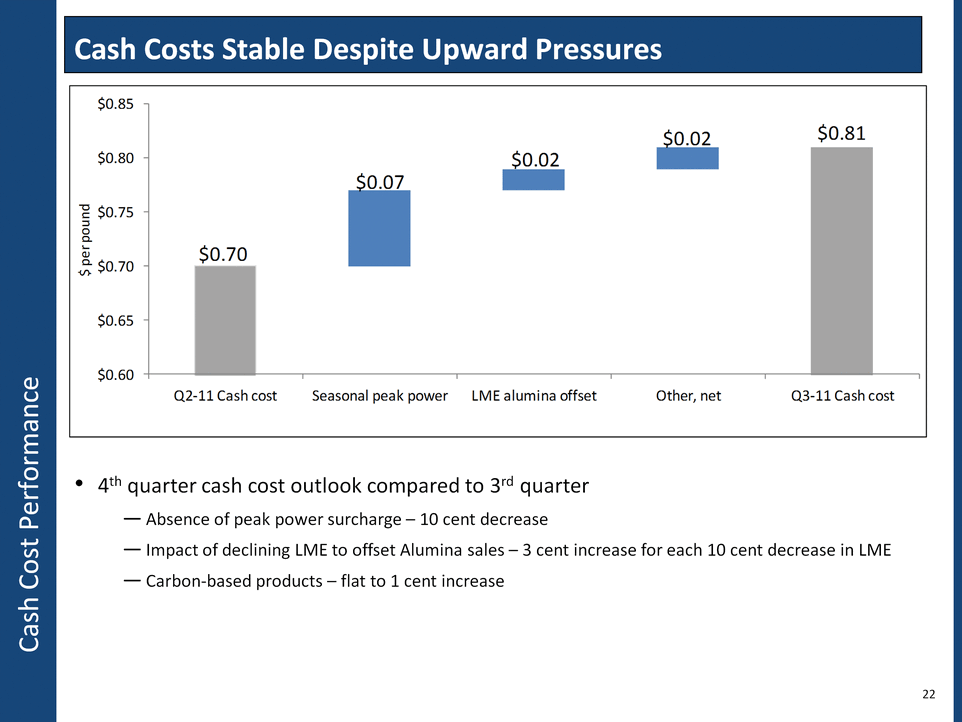
| Cash Cost Performance 22 Cash Costs Stable Despite Upward Pressures 4th quarter cash cost outlook compared to 3rd quarter Absence of peak power surcharge - 10 cent decrease Impact of declining LME to offset Alumina sales - 3 cent increase for each 10 cent decrease in LME Carbon-based products - flat to 1 cent increase |
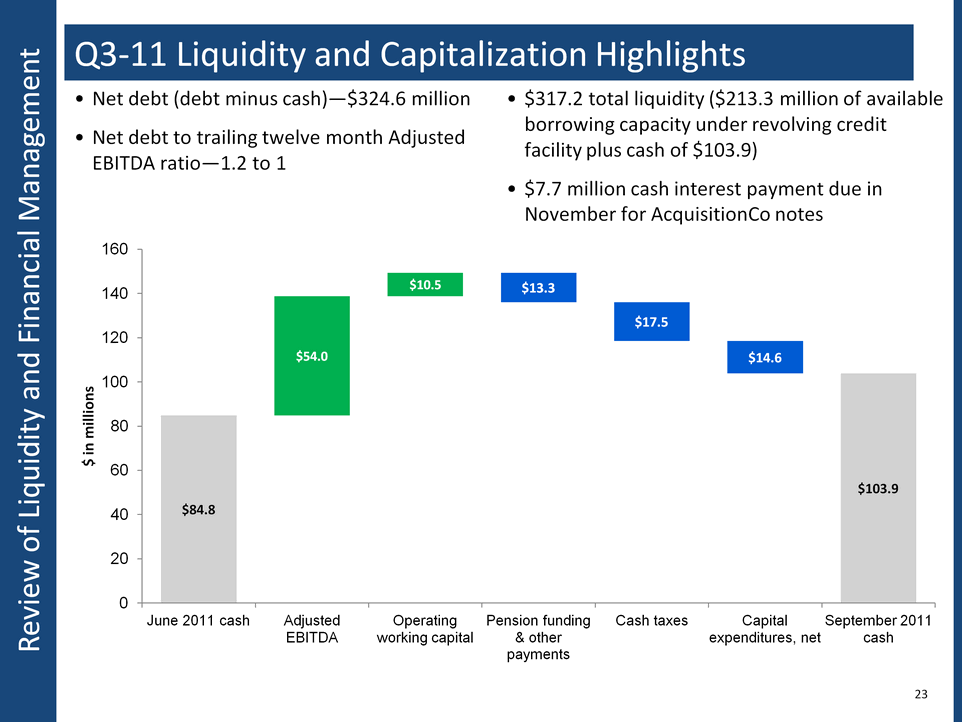
| (CHART) Review of Liquidity and Financial Management Q3-11 Liquidity and Capitalization Highlights Net debt (debt minus cash)-$324.6 million Net debt to trailing twelve month Adjusted EBITDA ratio-1.2 to 1 23 $317.2 total liquidity ($213.3 million of available borrowing capacity under revolving credit facility plus cash of $103.9) $7.7 million cash interest payment due in November for AcquisitionCo notes |

| Appendices |
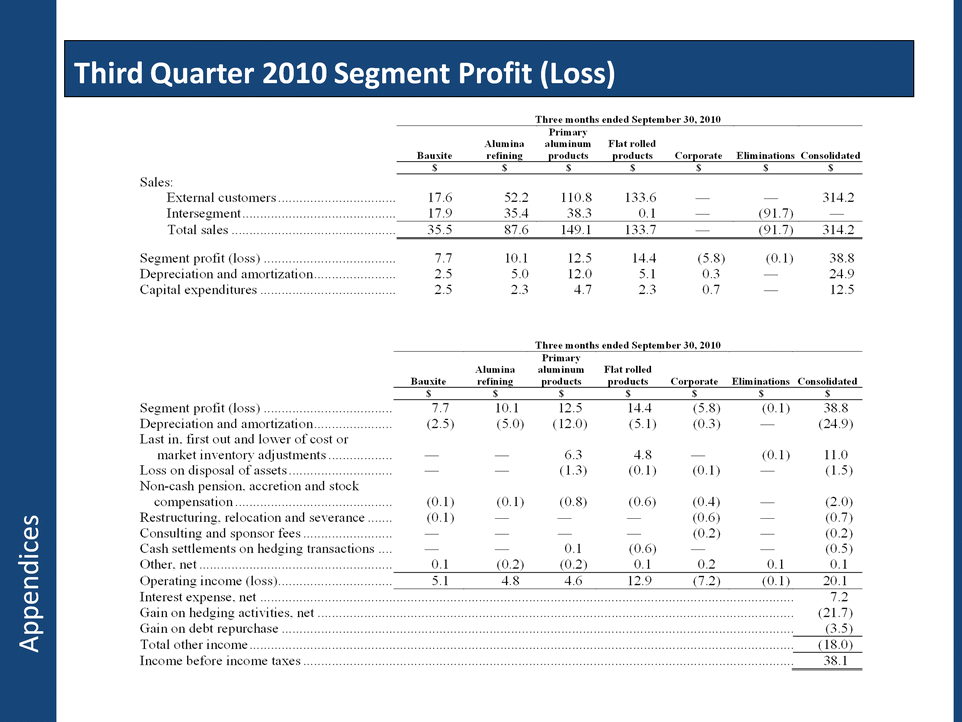
| Appendices Third Quarter 2010 Segment Profit (Loss) |
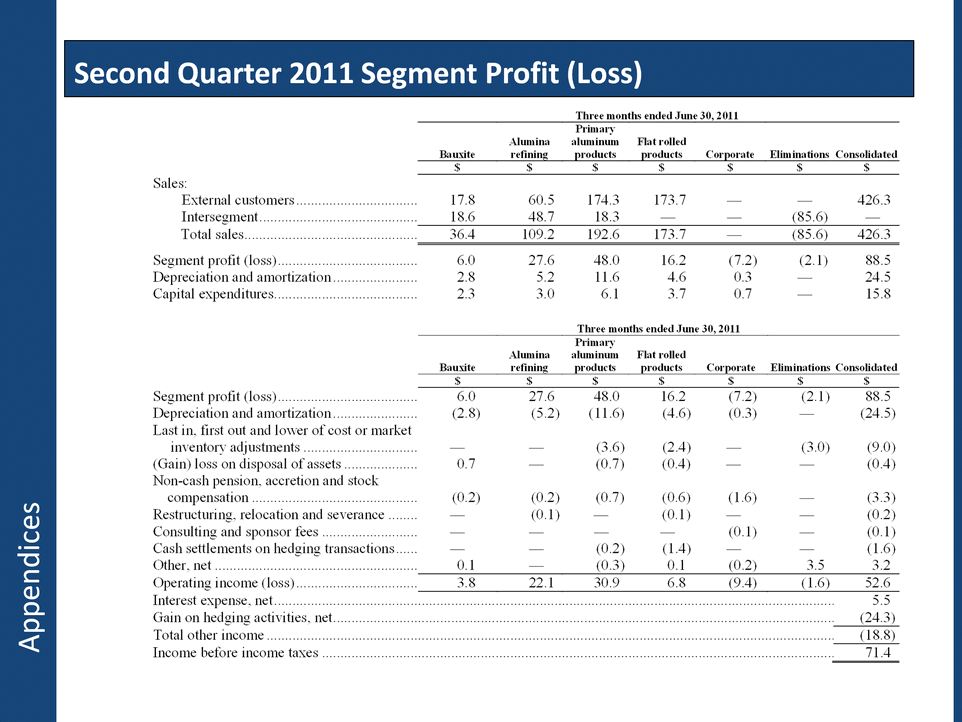
| Second Quarter 2011 Segment Profit (Loss) Appendices |
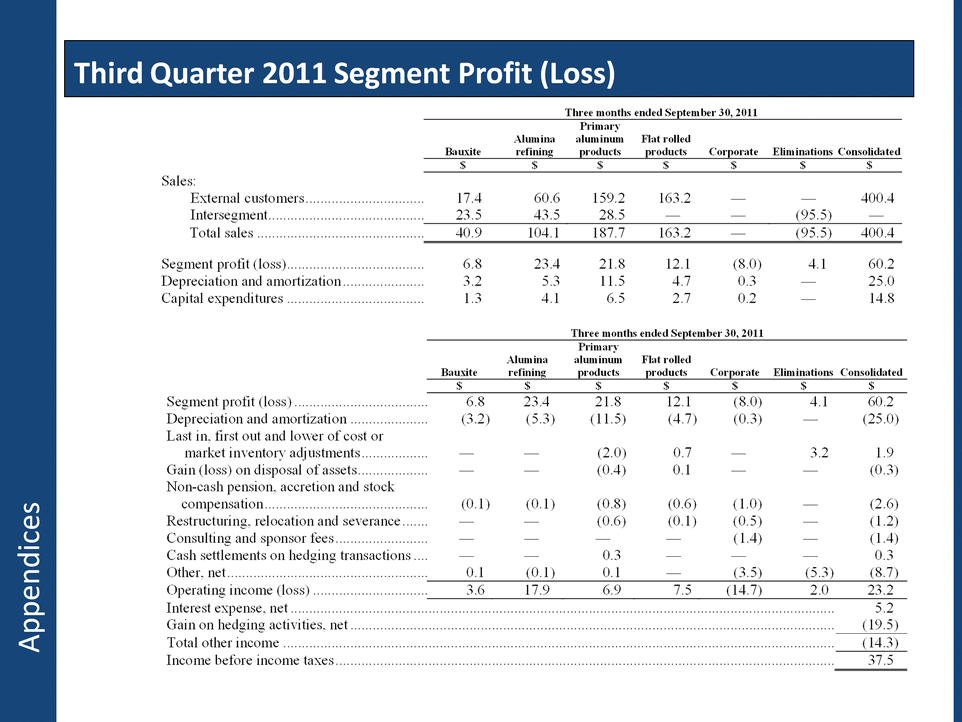
| Third Quarter 2011 Segment Profit (Loss) Appendices |
| Non-GAAP Measure: Disclaimer This presentation contains non-GAAP financial measures as defined by SEC rules. We think that these measures are helpful to investors in measuring our financial performance and comparing our performance to our peers. However, our non-GAAP financial measures may not be comparable to similarly titled non-GAAP financial measures used by other companies. These non-GAAP financial measures have limitations as an analytical tool and should not be considered in isolation or as a substitute for U.S. GAAP financial measures. To the extent we discuss any non-GAAP financial measures on the earnings call, a reconciliation of each measure to the most directly comparable U.S. GAAP measure are available in the appendices that follow and are filed as an Exhibit 99 to our Current Report on Form 8-K furnished to the SEC concurrent with the use of this presentation. Appendices |
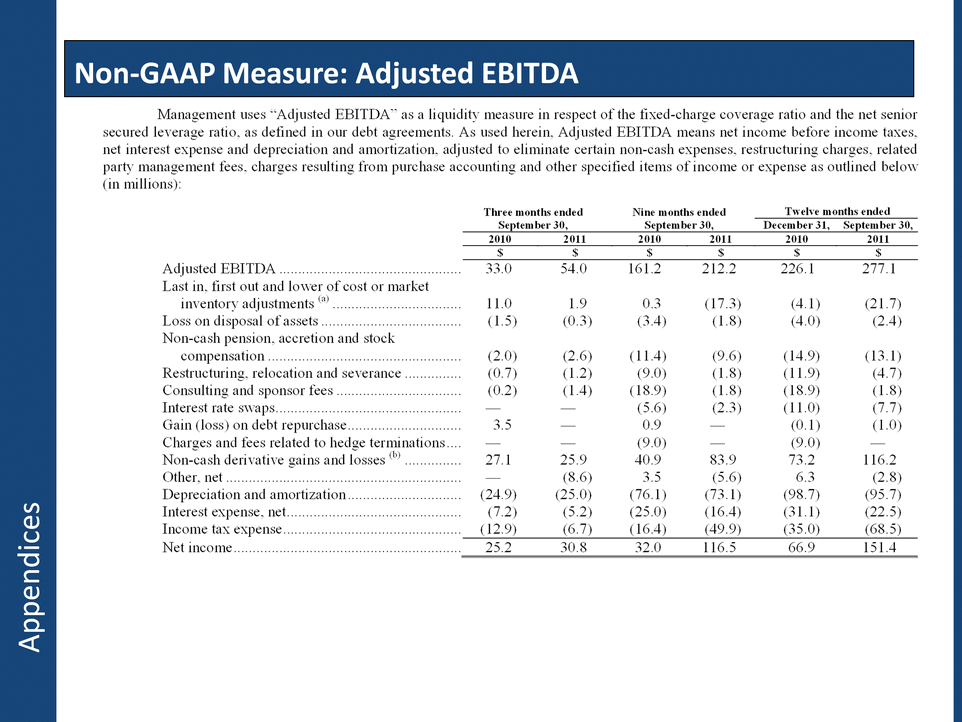
| Non-GAAP Measure: Adjusted EBITDA Appendices |
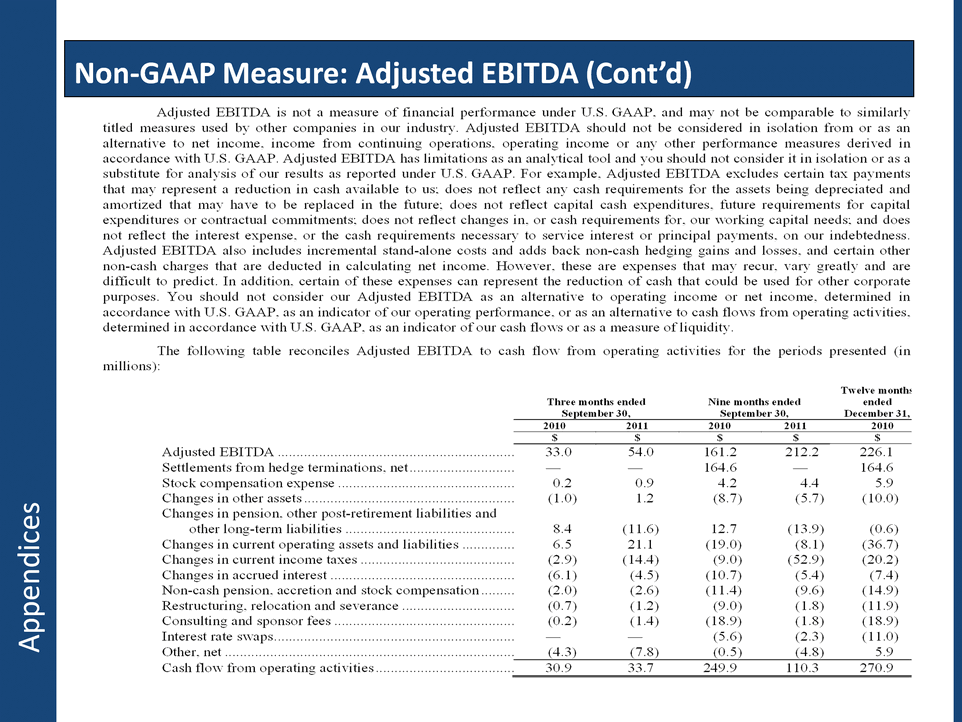
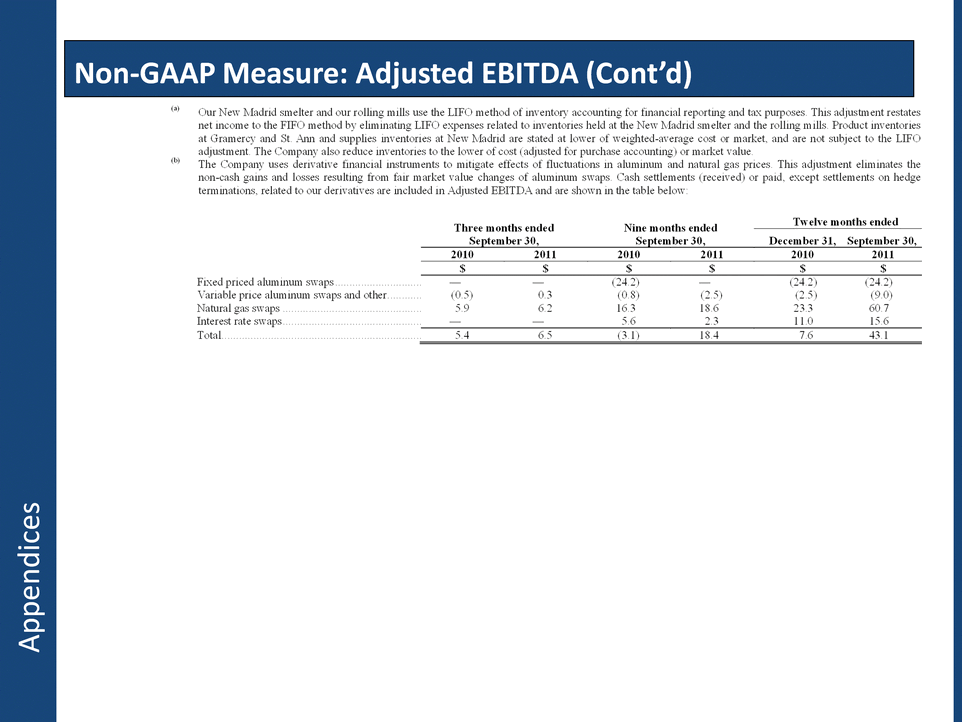
| Non-GAAP Measure: Adjusted EBITDA (Cont'd) Appendices |
| Non-GAAP Measure: Adjusted EBITDA (Cont'd) Appendices |
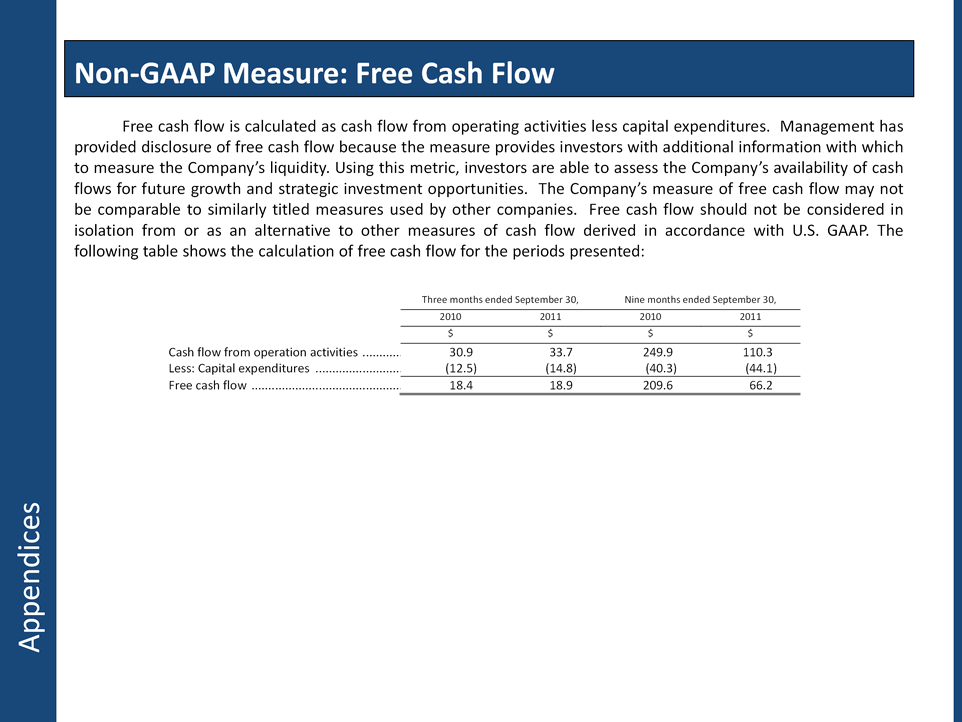
| Non-GAAP Measure: Free Cash Flow Appendices Free cash flow is calculated as cash flow from operating activities less capital expenditures. Management has provided disclosure of free cash flow because the measure provides investors with additional information with which to measure the Company's liquidity. Using this metric, investors are able to assess the Company's availability of cash flows for future growth and strategic investment opportunities. The Company's measure of free cash flow may not be comparable to similarly titled measures used by other companies. Free cash flow should not be considered in isolation from or as an alternative to other measures of cash flow derived in accordance with U.S. GAAP. The following table shows the calculation of free cash flow for the periods presented: |
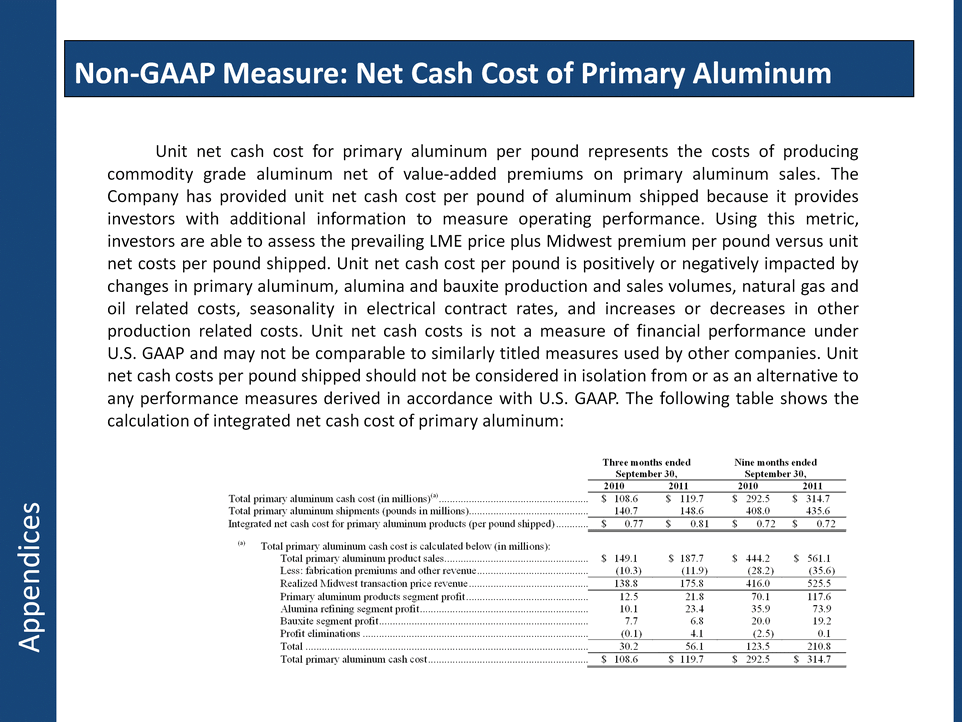
| Non-GAAP Measure: Net Cash Cost of Primary Aluminum Appendices Unit net cash cost for primary aluminum per pound represents the costs of producing commodity grade aluminum net of value-added premiums on primary aluminum sales. The Company has provided unit net cash cost per pound of aluminum shipped because it provides investors with additional information to measure operating performance. Using this metric, investors are able to assess the prevailing LME price plus Midwest premium per pound versus unit net costs per pound shipped. Unit net cash cost per pound is positively or negatively impacted by changes in primary aluminum, alumina and bauxite production and sales volumes, natural gas and oil related costs, seasonality in electrical contract rates, and increases or decreases in other production related costs. Unit net cash costs is not a measure of financial performance under U.S. GAAP and may not be comparable to similarly titled measures used by other companies. Unit net cash costs per pound shipped should not be considered in isolation from or as an alternative to any performance measures derived in accordance with U.S. GAAP. The following table shows the calculation of integrated net cash cost of primary aluminum: |
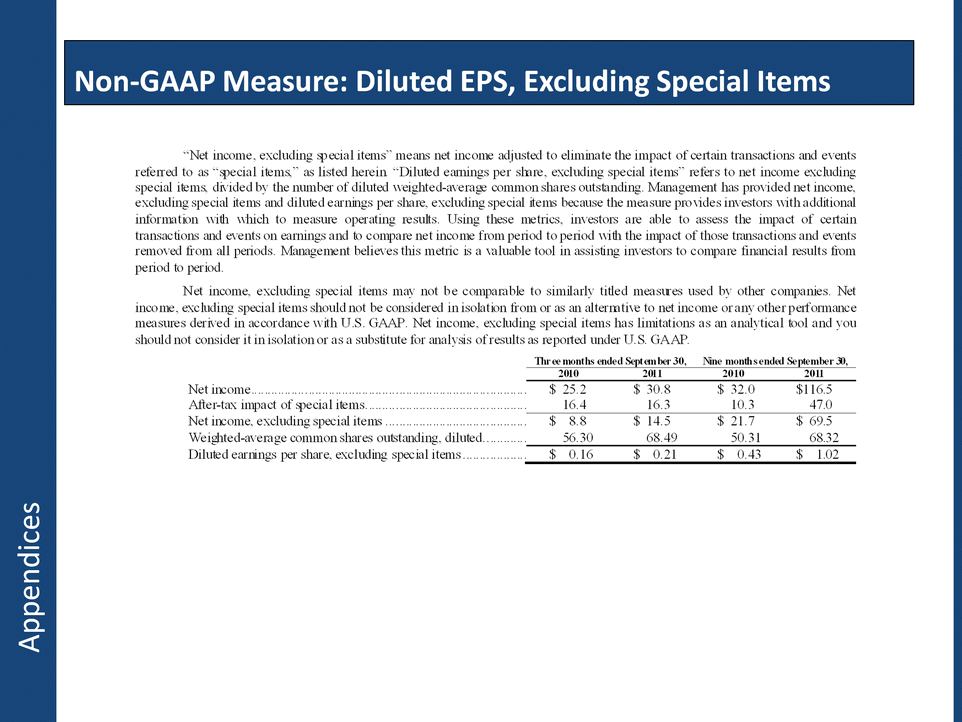
| Non-GAAP Measure: Diluted EPS, Excluding Special Items Appendices |
| TM |