Attached files
| file | filename |
|---|---|
| 8-K - 8-K - TFS Financial CORP | d259338d8k.htm |
 Investor Conference Call
November 17, 2011
Exhibit 99.1 |
 2
Forward-Looking Statements
This presentation contains forward-looking statements, which can be identified
by the use of such words as estimate, project, believe, intend, anticipate, plan,
seek, expect and similar expressions. These forward-looking statements
include: Statements of our goals, intentions and expectations;
Statements regarding our business plans and prospects and growth and operating
strategies; Statements concerning trends in our provision for loan losses
and charge-offs; Statements regarding the asset quality of our loan and
investment portfolios; and Estimates of our risks and future costs and
benefits. These forward-looking statements are subject to significant
risks, assumptions and uncertainties, including, among other things, the
following important factors
that could affect the actual outcome of future events:
Significantly increased competition among depository and other financial
institutions; Inflation and changes in the interest rate environment that
reduce our interest margins or reduce the fair value of financial instruments;
General
economic
conditions,
either
nationally
or
in
our
market
areas,
including
employment
prospects
and
conditions
that
are
worse
than expected;
Decreased demand for our products and services and lower revenue and earnings in
the event of a recession; Adverse changes and volatility in the securities
and credit markets; Legislative or regulatory changes that adversely affect
our business; Changes in consumer spending, borrowing and savings habits;
Changes
in
accounting
policies
and
practices,
as
may
be
adopted
by
the
bank
regulatory
agencies,
the
Financial
Accounting
Standards
Board
and the Public Company Accounting Oversight Board;
Future adverse developments concerning Fannie Mae or Freddie Mac;
Changes in monetary and fiscal policy of the U.S. Government, including policies of
the U.S. Treasury and the Federal Reserve Board; Changes
in
policy
and/or
assessment
rates
of
taxing
authorities
that
adversely
affect
us;
The timing and the amount of revenue that we may recognize;
Changes in expense trends (including, but not limited to, trends affecting
non-performing assets, charge offs and provisions for loan losses); The
impact of the current governmental effort to restructure the U.S. financial and regulatory system
The extensive reforms enacted in the Dodd-Frank Act which will impact us
The adoption of implementing regulations by a number of different regulatory bodies
under the Dodd-Frank Act, and uncertainty in the exact nature, extent
and timing of such regulations and the impact they will have
on us, including the impact of coming under the jurisdiction of
new federal regulators
Changes in our organization, or compensation and benefit plans;
Inability of third-party providers to perform their obligations to us;
Adverse changes and volatility in real estate markets;
A slowing or failure of the moderate economic recovery that began last year;
The strength or weakness of the real estate markets and of the consumer and
commercial credit sectors and its impact on the credit quality of our loans
and other assets; and. The efficacy of the U.S. Federal Government to manage
federal debt limits. Because of these and other uncertainties, our actual
future results may be materially different from the results indicated by these forward-
looking statements. |
 3
Organized in 1997 as the mid-tier stock holding company for Third Federal
Savings & Loan Association of Cleveland (“Thrift”), which was
founded in 1938 by Ben and Gerome Stefanski
Completed first step IPO conversion in April 2007
TFSL (NASDAQ)
Financials at 9/30/2011:
Total Assets:
$10.9B
Total Deposits:
$ 8.7B
Shareholders’
Equity:
$ 1.8B
Market Capitalization:
$ 2.5B
As of September 30, 2011, there were 308.9 million shares outstanding, of
which 73.5% were held by the Mutual Holding Company
Overview of TFS Financial Corporation |
 4
Strategic Overview
Our business model is to originate and service first mortgage loans and continue to
service
existing
home
equity
loans
and
lines,
which
we
fund
with
core
retail
deposits
Historically a fixed rate lender, but 55% of fiscal 2011 loan production was Smart
Rate adjustable rate mortgage product (product introduced to market in July
2010). First mortgage loans and retail deposits have been generated
mainly in our Ohio and Florida footprint.
Expanded to several new states in May 2011, offering our Smart Rate adjustable
rate mortgage
to
refinance
customers
through
our
Customer
Service
and
Internet
Channels
and
using
our
underwriting
standards
and
processing
requirements
of
our
traditional
markets.
Only non-commissioned Third Federal associates have been and continue to be
used to gather applications, underwrite and process the requests to generate
mortgage loans and home equity loans and lines
First
mortgage
originations
continue
to
be
made
using
stringent,
conservative
lending
standards. For first mortgages originated during the current fiscal year, the
average FICO score was 775, and the average LTV was 64%.
Being a low cost provider is a critical strategic advantage
Historically, prudent capital management has supplemented shareholder
returns. Repurchased
24.1
million
shares
of
TFSL
stock
(approximately
23%
of
the
public
float)
since
the IPO in April 2007
Dividends of $49 million paid to public common shareholders since IPO
|
 5
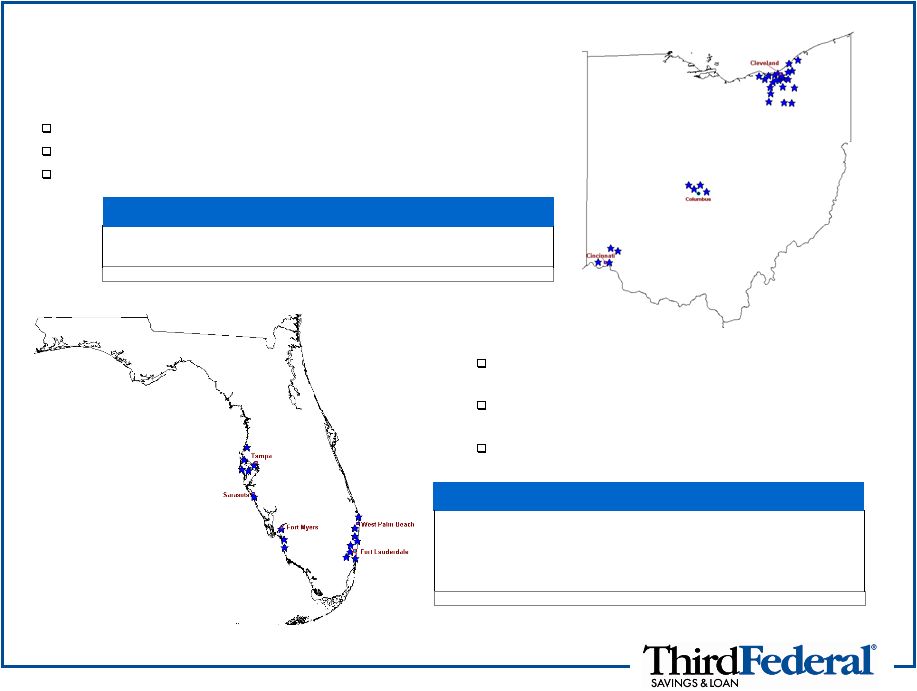
Ohio
22 full service branches in Northeast Ohio
4 loan production offices in the Columbus area (Central Ohio)
4 loan production offices in the Cincinnati area (Southwestern Ohio)
Markets of Operation
Florida
Organic, de novo expansion into Florida started in
2000
9 full service branches along the West Coast from
New Port Richey to Naples
8 full-service branches along the East Coast from
Palm Gardens to Hallandale
Source: SNL Financial for market data as of June 30, 2011
Deposits from Company data as of September 30, 2011
Deposits
Market
Market
MSA
Branches
($M)
Share (%)
Rank
Tampa-St.Petersburg-Clearwater, FL
5
1,112
1.86
8
Miami-Fort Lauderdale, FL
8
1,076
0.66
26
Cape Coral-Fort Myers, FL
2
257
2.14
14
Sarasota-Bradenton-Venice, FL
1
255
1.53
12
Naples-Marco Island, FL
1
117
1.18
17
Florida Totals
17
2,817
0.66
22
Deposits
Market
Market
MSA
Branches
($M)
Share (%)
Rank
Cleveland-Elyria-Mentor, OH
19
5,405
11.23
3
Akron, OH
3
494
4.21
8
Ohio Totals
22
5,899
2.64
9 |
 6
Financial Highlights
(Dollars in Thousands)
At, or for the year ended,
9/30/11
9/30/10
9/30/09
9/30/11
6/30/11
9/30/10
Balance Sheet
Assets ($)
10,892,948
11,076,027
10,598,840
10,892,948
10,877,541
11,076,027
Net Loans ($)
9,750,943
9,181,749
9,219,585
9,750,943
9,698,228
9,181,749
Deposits ($)
8,715,910
8,851,941
8,570,506
8,715,910
8,701,896
8,851,941
Common Equity ($)
1,773,924
1,752,897
1,745,865
1,773,924
1,766,387
1,752,897
Balance Sheet Ratios
Loans/ Deposits (%)
111.9
103.7
107.6
111.9
111.4
103.7
TCE / TA (%)
16.2
15.8
16.4
16.2
16.2
15.8
Thrift Only Ratios:
Core Capital Ratio (%)
13.9
12.1
12.5
13.9
13.8
12.1
Tier 1 Risk Based Ratio (%)
21.0
18.0
17.3
21.0
20.8
18.0
Total Risk Based Capital Ratio (%)
22.3
19.2
18.2
22.3
22.0
19.2
Profitability
Net Interest income ($)
247,648
227,506
230,075
64,016
63,045
55,143
Provision for loan losses ($)
(98,500)
(106,000)
(115,000)
(19,000)
(22,500)
(35,000)
Net Interest income after prov for loan losses ($)
149,148
121,506
115,075
45,016
40,545
20,143
Non-interest income ($)
30,982
58,638
67,384
7,137
8,759
6,828
Non-interest expense ($)
(168,055)
(161,933)
(162,388)
(41,584)
(39,552)
(41,820)
Income (loss) before income taxes ($)
12,075
18,211
20,071
10,569
9,752
(14,849)
Income tax benefit (expense) ($)
(2,735)
(6,873)
(5,676)
(2,090)
(3,767)
4,102
Net income (loss) ($)
9,340
11,338
14,395
8,479
5,985
(10,747)
Net interest margin (%)
2.32
2.16
2.20
2.42
2.37
2.05
Non-interest expense to average assets (%)
1.54
1.50
1.51
1.54
1.45
1.52
Asset Quality
NPAs/ Assets (%)
2.3
2.7
2.6
2.3
2.4
2.7
NCOs/ Avg Loans (%)
0.8
0.7
0.7
0.6
0.8
0.9
Reserves/ Loans (%)
1.6
1.4
1.0
1.6
1.6
1.4
Texas Ratio (NPAs & TDRs / TCE & LLR) (%)
19.6
20.9
17.4
19.6
19.9
20.9
At, or for the three months ended, |
 7
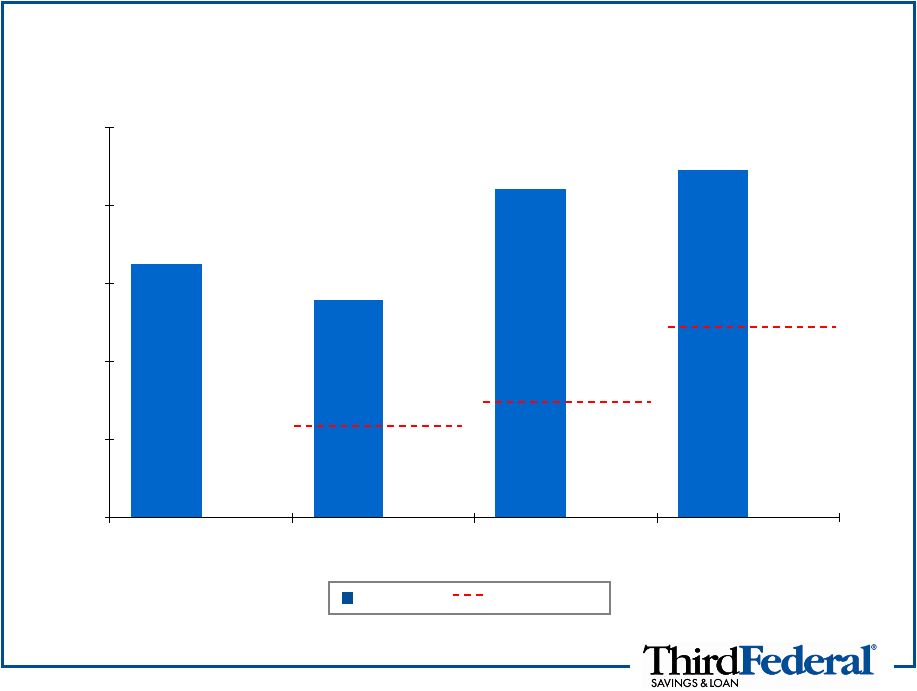
Capital Position as of September 30, 2011
16.21%
13.90%
21.04%
22.29%
0.00%
5.00%
10.00%
15.00%
20.00%
25.00%
Tangible Common
Equity Ratio (TFSL)
Core Capital Ratio
(Thrift)
Tier 1 Risk-based Ratio
(Thrift)
Total Risk-Based
Capital Ratio (Thrift)
Well Capitalized
6.00%
10.00%
5.00%
TFSL/Thrift |
 8
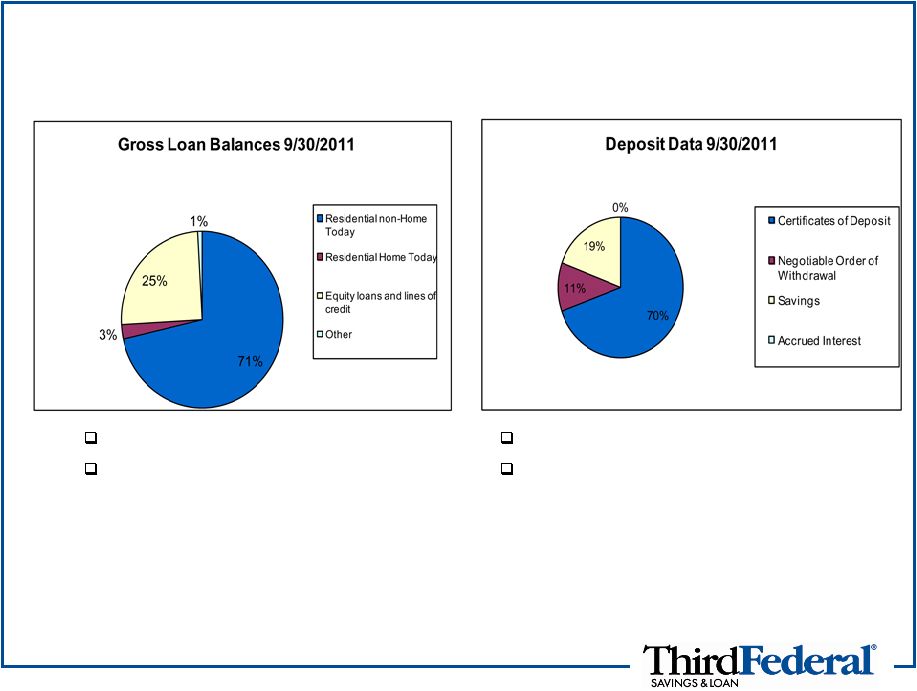
Loan and Deposit Balances
*About Home Today:
An affordable housing program targeted toward low and moderate income home buyers
that is designed to teach the essential skills needed for successful
homeownership. Most loans supported by private mortgage insurance. Cumulative
loan originations under this program have been less than $20 million over the last
three years. 80% of first mortgages in Ohio
Also service $5.4 billion in loans for
others
No brokered deposits
Average branch has $223 million in deposits |
 9
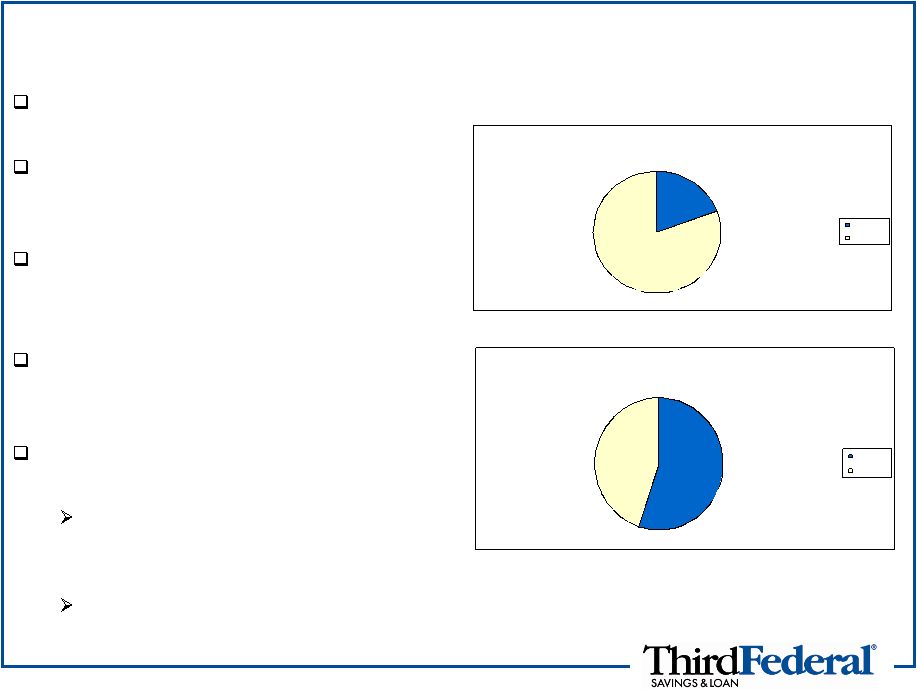
Adjustable Rate Growth
Smart Rate adjustable product
began July 2010
Fiscal year 2011 total loan
production of $2.14 billion was
55% adjustable and 45% fixed
Average credit score of fiscal
2011 ARM production is
775 with
average LTV of 63%
Total ARMs of $1.8 billion
represent approximately 25% of
all first mortgages at 9/30/11
Expansion of ARM refinance
offerings into new states:
PA, NJ, IL, NC in May, 2011
–
Represents $20MM in closed loans
as of 9/30/11
VA, CT, TN, CO, OR, and WA in
Sept. 2011
81%
Loan Production, 9/30/10
Adjustable
Fixed
81%
19%
Loan Production, 9/30/11
Adjustable
Fixed
45%
55% |
 10
Loan Delinquencies and Charge-offs
Dollars in millions
Loan
Balances
9/30/11
9/30/11
6/30/11
9/30/10
9/30/11
6/30/11
9/30/11
9/30/10
Residential non-Home Today
Ohio
$5,692
1.4%
1.5%
1.9%
$2
$3
$9
$5
Florida
$1,269
5.1%
5.1%
5.2%
3
2
9
7
Other
160
0.7%
0.9%
1.5%
-
-
-
-
Total
$7,121
2.1%
2.1%
2.5%
$5
$5
$18
$12
Residential Home Today
Ohio
$253
30.0%
29.8%
34.8%
$1
$2
$7
$5
Florida
11
32.1%
35.3%
32.1%
-
-
-
-
Total
$264
30.1%
30.0%
34.6%
$1
$2
$7
$5
Home Equity Loans and Lines of Credit
Ohio
$983
1.6%
1.7%
2.0%
$3
$2
$10
$7
Florida
712
3.3%
3.1%
4.1%
4
9
29
33
California
293
1.4%
1.7%
1.5%
1
1
5
4
Other
503
2.1%
2.1%
2.4%
1
1
5
5
Total
$2,491
2.2%
2.2%
2.6%
$9
$13
$49
$49
Other
$89
4.3%
4.7%
4.2%
-
-
$1
$2
Overall Total
$9,965
2.9%
2.9%
3.5%
$15
$20
$75
$68
Quarter-end
Net Charge Offs
Delinquencies at:
FYE |
 11
Regulatory Status
Company believes it has met all key provisions of February 7, 2011
MOU received from OTS, subject to regulatory exam validation
Supervisory responsibility transferred from OTS to OCC (for thrift) and
Federal Reserve (for holding company) on July 21, 2011
Dividends and stock buyback program still subject to regulatory 45 day
non-objection
OCC charge-off rules to be implemented, resulting in one time $55.5
million additional charge-off in quarter ending December 31, 2011. No
income statement impact, but the allowance and non-performing loans
will decrease by same amount.
Comment letter submitted October 27, 2011, on proposed Fed rules
for
MHCs |
 12
Cash Dividends and Stock Repurchases
Under the terms of the MOU, TFS Financial must provide 45 days written
notice and obtain the non-objection of its regulator prior to the
Company’s intent to declare and pay dividends to its stockholders or
repurchase any of its outstanding stock.
The Company understands and shares the view of the importance to
shareholders of dividends and stock repurchases. However, given the new
regulators and oversight, The Federal Reserve and the OCC will need to
review and determine the ability of the Company to repurchase stock and
declare dividends moving forward. It is unclear the
exact timing of any decisions with regard to these steps. The Company
continues to work diligently to resolve this matter on behalf of the Company
and its shareholders. |
 13
Summary
Focus on our core competency of originating high credit quality 1-4
family residential mortgages primarily in our banking footprint,
expanding into new markets with our adjustable rate mortgage loans
TFSL has a strong capital position and flexibility at the holding
company
Working with new regulatory agencies to refocus efforts on returning
to shareholder-enhancing activities
Dividends
Share Buybacks |
 14
Investor Conference Call
November 17, 2011
Investor Questions |