Attached files
Table of Contents
UNITED STATES
SECURITIES AND EXCHANGE COMMISSION
WASHINGTON, D.C. 20549
FORM 10-K
| x | ANNUAL REPORT PURSUANT TO SECTION 13 OR 15(d) OF THE SECURITIES EXCHANGE ACT OF 1934 |
| For the fiscal year ended September 30, 2009 |
or
| ¨ | TRANSITION REPORT PURSUANT TO SECTION 13 OR 15(d) OF THE SECURITIES EXCHANGE ACT OF 1934 |
| For transition period from to |
Commission File Number 001-33390
TFS FINANCIAL CORPORATION
(Exact Name of Registrant as Specified in its Charter)
| United States of America | 52-2054948 | |
| (State or Other Jurisdiction of Incorporation or Organization) |
(I.R.S. Employer Identification No.) | |
| 7007 Broadway Avenue | ||
| Cleveland, Ohio | 44105 | |
| (Address of Principal Executive Offices) | (Zip Code) |
(216) 441-6000
(Registrant’s telephone number, including area code)
Securities registered pursuant to Section 12(b) of the Act:
Common Stock, par value $0.01 per share
(Title of class)
The NASDAQ Stock Market, LLC
(Name of exchange on which registered)
Securities registered pursuant to Section 12(g) of the Act: None
Indicate by check mark if the registrant is a well-known seasoned issuer, as defined in Rule 405 of the Securities Act. Yes x No ¨.
Indicate by check mark if the registrant is not required to file reports pursuant to Section 13 or Section 15(d) of the Act. Yes ¨ No x
Indicate by check mark whether the Registrant (1) has filed all reports required to be filed by Section 13 or 15(d) of the Securities Exchange Act of 1934 during the preceding 12 months (or for such shorter period that the Registrant was required to file such reports), and (2) has been subject to such filing requirements for the past 90 days. Yes x No ¨.
Indicate by check mark whether the registrant has submitted electronically and posted on its corporate Web site, if any, every Interactive Data File required to be submitted and posted pursuant to Rule 405 of Regulation S-T during the preceding 12 months (or for such shorter period that the registrant was required to submit and post such files). Yes ¨ No ¨
Indicate by check mark if disclosure of delinquent filers pursuant to Item 405 of Regulation S-K (§229.405 of this chapter) is not contained herein, and will not be contained, to the best of registrant’s knowledge, in definitive proxy or information statements incorporated by reference in Part III of this Form 10-K or any amendment to this Form 10-K. ¨
Indicate by check mark whether the Registrant is a large accelerated filer, an accelerated filer, or a non-accelerated filer. See definition of “accelerated filer and large accelerated filer” in Rule 12b-2 of the Exchange Act (Check one):
| Large accelerated filer x | Accelerated filer ¨ | Non-accelerated filer ¨ | Smaller reporting company ¨ | |||
| (do not check if a smaller reporting company) |
Indicate by check mark whether the Registrant is a shell company (as defined in Rule 12b-2 of the Exchange Act.) Yes ¨ No x.
The aggregate market value of the voting and non-voting common equity held by non-affiliates of the Registrant, computed by reference to the last sale price on March 31, 2009, as reported by the NASDAQ Global Select Market, was approximately $983.8 million.
Indicate the number of shares outstanding of each of the Registrant’s classes of common stock as of the latest practicable date.
At November 23, 2009 there were 308,378,500 shares of the Registrant’s common stock, par value $0.01 per share, outstanding, of which 227,119,132 shares, or 73.65% of the Registrant’s common stock, were held by Third Federal Savings and Loan Association of Cleveland, MHC, the Registrant’s mutual holding company.
DOCUMENTS INCORPORATED BY REFERENCE (to the Extent Indicated Herein)
Portions of the registrant’s Proxy Statement for the 2010 Annual Meeting of Shareholders are incorporated by reference in Part III hereof.
Table of Contents
TFS Financial Corporation
| Part I |
||||
| Item 1. |
3 | |||
| Item 1A. |
40 | |||
| Item 1B. |
44 | |||
| Item 2. |
44 | |||
| Item 3. |
44 | |||
| Item 4. |
45 | |||
| Part II |
||||
| Item 5. |
46 | |||
| Item 6. |
49 | |||
| Item 7. |
Management’s Discussion and Analysis of Financial Condition and Results of Operation |
51 | ||
| Item 7A. |
71 | |||
| Item 8. |
74 | |||
| Item 9. |
Changes in and Disagreements With Accountants on Accounting and Financial Disclosure |
74 | ||
| Item 9A. |
74 | |||
| Item 9B. |
77 | |||
| Part III |
||||
| Item 10. |
77 | |||
| Item 11. |
77 | |||
| Item 12. |
Security Ownership of Certain Beneficial Owners and Management and Related Stockholder Matters |
78 | ||
| Item 13. |
Certain Relationships and Related Transactions, and Director Independence |
78 | ||
| Item 14. |
78 | |||
| Part IV |
||||
| Item 15. |
78 | |||
2
Table of Contents
PART I
| Item 1. | Business |
Forward Looking Statements
This report contains forward-looking statements, which can be identified by the use of such words as estimate, project, believe, intend, anticipate, plan, seek, expect and similar expressions. These forward-looking statements include:
| • | statements of our goals, intentions and expectations; |
| • | statements regarding our business plans and prospects and growth and operating strategies; |
| • | statements regarding the asset quality of our loan and investment portfolios; and |
| • | estimates of our risks and future costs and benefits. |
These forward-looking statements are subject to significant risks, assumptions and uncertainties, including, among other things, the following important factors that could affect the actual outcome of future events:
| • | significantly increased competition among depository and other financial institutions; |
| • | inflation and changes in the interest rate environment that reduce our interest margins or reduce the fair value of financial instruments; |
| • | general economic conditions, either nationally or in our market areas, that are worse than expected; |
| • | decreased demand for our products and services and lower revenue and earnings because of a recession; |
| • | adverse changes and volatility in the securities markets; |
| • | adverse changes and volatility in credit markets; |
| • | legislative or regulatory changes that adversely affect our business; |
| • | our ability to enter new markets successfully and take advantage of growth opportunities, and the possible short-term dilutive effect of potential acquisitions or de novo branches, if any; |
| • | changes in consumer spending, borrowing and savings habits; |
| • | changes in accounting policies and practices, as may be adopted by the bank regulatory agencies, the Financial Accounting Standards Board and the Public Company Accounting Oversight Board; |
| • | future adverse developments concerning Fannie Mae or Freddie Mac; |
| • | changes in monetary and fiscal policy of the U.S. Government, including policies of the U.S. Treasury and the Federal Reserve Board; |
| • | changes in policy and/or assessment rates of taxing authorities that adversely affect us; |
| • | changes in laws or governmental regulations affecting financial institutions, including changes in regulatory costs and capital requirements; |
| • | the timing and the amount of revenue that we may recognize; |
| • | changes in expense trends (including, but not limited to trends affecting non-performing assets, chargeoffs and provisions for loan losses); |
| • | changes in consumer spending, borrowing and spending habits; |
| • | the impact of the current governmental effort to restructure the U.S. Financial and regulatory system; |
3
Table of Contents
| • | inability of third-party providers to perform their obligations to us; |
| • | changes in our organization, or compensation and benefit plans; and |
| • | the strength or weakness of the real estate markets and of the consumer and commercial credit sectors and its impact on the credit quality of our loans and other assets. |
Because of these and other uncertainties, our actual future results may be materially different from the results indicated by these forward-looking statements. Please see Item 1A. Risk Factors, for a discussion of certain risks related to our business.
TFS FINANCIAL CORPORATION
TFS Financial Corporation (“we” “us” “our” or the “Company”) was organized in 1997 as the mid-tier stock holding company for Third Federal Savings and Loan Association of Cleveland (“Third Federal Savings and Loan” or the “Association”). We completed our initial public stock offering on April 20, 2007 and issued 100,199,618 shares of common stock, or 30.16% of our post-offering outstanding common stock, to subscribers in the offering. Additionally, at the time of the public offering, 5,000,000 shares of our common stock, or 1.50% of our outstanding shares, were issued to our newly formed charitable foundation, Third Federal Foundation (the “Foundation”). Third Federal Savings and Loan Association of Cleveland, MHC (“Third Federal Savings, MHC”), our mutual holding company parent, holds the remainder of our outstanding common stock (227,119,132 shares). Net proceeds from our initial public stock offering were approximately $886 million and reflected the costs we incurred in completing the offering as well as a $106.5 million loan to the Third Federal Employee Stock Ownership Plan related to its acquisition of shares in the initial public stock offering.
Our ownership of the Association remains our primary business activity.
We also operate Third Capital, Inc. as a wholly-owned subsidiary.
As the holding company of Third Federal Savings and Loan, we are authorized to pursue other business activities permitted by applicable laws and regulations for savings and loan holding companies, which include making equity investments and the acquisition of banking and financial services companies.
Our cash flow depends primarily on earnings from the investment of the portion of the net offering proceeds we retained, and any dividends we receive from Third Federal Savings and Loan and Third Capital, Inc. The majority of our officers are also officers of the Association. In addition, we use the services of the support staff of the Association from time to time. We may hire additional employees, as needed, to the extent we expand our business in the future.
THIRD CAPITAL, INC.
Third Capital, Inc. is a Delaware corporation that was organized in 1998 as our wholly-owned subsidiary. At September 30, 2009, Third Capital, Inc. had consolidated assets of $78.3 million, and for the fiscal year ended September 30, 2009, Third Capital, Inc. had consolidated net income of $2.2 million. Third Capital, Inc. has no separate operations other than as the holding company for its operating subsidiaries, and as a minority investor or partner in other entities including minority investments in private equity funds. The following is a description of the entities, other than the private equity funds, in which Third Capital, Inc. is the owner, an investor or a partner.
Hazelmere Investment Group I, Ltd. This entity engages in net lease transactions of commercial buildings in targeted United States markets. Third Capital, Inc. is a partner of this entity, receives a preferred return on amounts contributed to acquire investment properties and has a 70% ownership interest in remaining earnings. James Gascoigne, a director of the Company, indirectly owns or controls the majority of the remaining 30% ownership interest of this entity. A similar structured entity, Hazelmere of California Limited Partnership, which sold its commercial building in 2007 and has had minimal subsequent activity, was dissolved during fiscal 2009. Overall, the Hazelmere entities had pre-tax income of $1.5 million during fiscal 2009.
4
Table of Contents
Third Cap Associates, Inc. This Ohio corporation also maintains minority investments in private equity funds, and owns between 49% and 60% of two title agencies that provide escrow and settlement services in the State of Ohio, primarily to customers of Third Federal Savings and Loan. For the fiscal year ended September 30, 2009, Third Cap Associates, Inc. recorded net income of $2.1 million.
Third Capital Mortgage Insurance Company. This Vermont corporation reinsures private mortgage insurance on residential mortgage loans originated by Third Federal Savings and Loan. For the fiscal year ended September 30, 2009, Third Capital Mortgage Insurance Company recorded net income of $463 thousand.
THIRD FEDERAL SAVINGS AND LOAN ASSOCIATION OF CLEVELAND
General
Third Federal Savings and Loan is a federally chartered savings and loan association headquartered in Cleveland, Ohio that was organized in 1938. In May 1997, the Association reorganized into its current two-tier mutual holding company structure. The Association’s principal business consists of originating residential real estate mortgage loans and equity loans and lines of credit and attracting retail savings deposits.
The Association’s business strategy is to originate mortgage loans with interest rates that are competitive with those of similar products offered by other financial institutions in its markets. Similarly, the Association offers high-yield checking accounts and high-yield savings accounts and certificate of deposit accounts, each bearing interest rates that are competitive with similar products offered by other financial institutions in its markets. The Association expects to continue to pursue this business philosophy. While this strategy does not enable it to earn the highest rates of interest on loans it offers or pay the lowest rates on its deposit accounts, the Association believes that this strategy is the primary reason for its successful growth in the past.
The Association attracts retail deposits from the general public in the areas surrounding its main office and its branch offices. It also utilizes its internet website and its telephone call center to generate loan applications and attract retail deposits. In addition to residential real estate mortgage loans and equity loans and lines of credit, the Association originates residential construction loans. The Association retains in its portfolio a large portion of the loans that it originates. Loans that the Association sells consist primarily of long-term, fixed-rate residential real estate mortgage loans. The Association retains the servicing rights on all loans that it sells. The Association’s revenues are derived primarily from interest on loans and, to a lesser extent, interest on interest-bearing deposits in other financial institutions, federal funds sold, and investment securities including mortgage-backed securities. The Association also generates revenues from fees and service charges. The Association’s primary sources of funds are deposits, borrowings, principal and interest payments on loans and securities and proceeds from loan sales.
The Association’s website address is www.thirdfederal.com. Filings of the Company made with the Securities and Exchange Commission are available for free on the Association’s website. Information on that website is not and should not be considered a part of this document.
Market Area
Third Federal Savings and Loan conducts its operations from its main office in Cleveland, Ohio, and from 39 additional, full-service branches and eight loan production offices located throughout the states of Ohio and Florida. In Ohio, the Association’s 22 full-service offices are located in the northeast Ohio counties of Cuyahoga, Lake, Lorain, Medina and Summit, four loan production offices are located in the central Ohio county of Franklin (Columbus, Ohio) and four loan production offices are located in the southern Ohio counties of Butler and Hamilton (Cincinnati, Ohio). In Florida, 17 full-service branches are located in the counties of Pasco, Pinellas, Hillsborough, Sarasota, Lee, Collier, Palm Beach and Broward. The economies and housing markets in Ohio and Florida have been seriously impacted by the current economic downturn. Both states have experienced
5
Table of Contents
dramatic increases in foreclosures and reductions in employment rates and housing values. The depressed housing market and employment uncertainties have created an aura of pessimism and apprehension, which is manifested in suppressed consumer housing demand. Additionally, a number of troubled financial institutions, both national and regional, that compete in our markets have targeted retail deposit gathering as an alternative funding source as the wholesale funding markets that they previously utilized have either ceased to function or have imposed punitive pricing parameters. These institutions have significantly increased their interest rates paid to depositors. The combination of reduced demand by borrowers and higher rates paid to depositors has created an increasingly competitive marketplace that could adversely affect future operating results.
The Association also provides savings products in all 50 states and offers secured lines of credit in 18 states through its internet site.
Competition
The Association faces intense competition in its market areas both in making loans and attracting deposits. Its market areas have a high concentration of financial institutions, including large money center and regional banks, community banks and credit unions, and it faces additional competition for deposits from money market funds, brokerage firms, mutual funds and insurance companies. Some of its competitors offer products and services that the Association currently does not offer, such as commercial business loans, trust services and private banking.
The majority of the Association’s deposits are held in its offices located in Cuyahoga County, Ohio. As of June 30, 2009 (the latest date for which information is publicly available), the Association had $4.97 billion of deposits in Cuyahoga County, and ranked third among all financial institutions with offices in the county in terms of deposits, with a market share of 9.27%. As of that date, the Association had $6.19 billion of deposits in the State of Ohio, and ranked 9th among all financial institutions in the state in terms of deposits, with a market share of 2.63%. As of June 30, 2009, the Association had $2.58 billion of deposits in the State of Florida, and ranked 24th among all financial institutions in terms of deposits, with a market share of 0.64%.
From January 2009 through September 2009, the Association had the largest market share of conventional purchase mortgage loans originated in Cuyahoga County, Ohio. For the same period, it also had the largest market share of conventional purchase mortgage loans originated in four of the largest northeast Ohio counties. In addition, based on the same statistic, the Association has consistently been one of the six largest lenders in Franklin County (Columbus, Ohio) and Hamilton County (Cincinnati, Ohio) since it entered those markets in 1999.
The Association’s primary strategy for increasing and retaining its customer base is to offer competitive deposit and loan rates and other product features, delivered with exceptional customer service, in each of the markets it serves.
We rely on our more than 70-year history of serving our customers and the communities in which we operate, our high capital levels, and liquidity alternatives to maintain and nurture customer and marketplace confidence. Our high capital ratio continues to reflect the beneficial impact of our April 2007 initial public offering, which raised net proceeds of $886 million. At September 30, 2009, our ratio of shareholders’ equity to total assets was 16.5%. Our liquidity alternatives include management and monitoring of the level of liquid assets held in our portfolio as well as the maintenance of alternative wholesale funding sources. At September 30, 2009, our liquidity ratio was 8.42% and we had the ability to immediately borrow an additional $898.4 million from the Federal Home Loan Bank of Cincinnati (“FHLB of Cincinnati”) under existing credit arrangements along with $399.9 million from the Federal Reserve Bank of Cleveland (“Federal Reserve”). See “Item 7. Management’s Discussion and Analysis of Financial Condition and Results of Operation—Liquidity and Capital Resources.”
6
Table of Contents
We continue to utilize a multifaceted approach to support our efforts to instill customer and marketplace confidence. First, we provide thorough and timely information to all of our associates so as to prepare them for their day-to-day interactions with customers and other individuals who are not part of the Company. We believe that it is important that our customers and others sense the comfort level and confidence of our associates throughout their dealings. Second, we encourage our management team to maintain a presence and to be available in our branches and other areas of customer contact, so as to provide more opportunities for informal contact and interaction with our customers and community members. Third, our CEO remains accessible to both local and national media, as a spokesman for our institution as well as an observer and interpreter of financial marketplace situations and events. Fourth, we periodically include advertisements in local newspapers that display our strong capital levels and history of service. We also continue to emphasize our traditional tagline—“STRONG * STABLE * SAFE”—in our advertisements and branch displays. Finally, for customers who adhere to the old adage of trust but verify, we refer them to the safety/security rankings of a nationally recognized, independent rating organization that specializes in the evaluation of financial institutions which has awarded Third Federal Savings and Loan with its highest rating.
Lending Activities
The Association’s principal lending activity is the origination of first mortgage loans to purchase or refinance residential real estate. Its current policies generally provide that it will maintain between 40% and 70% of its assets in fixed-rate, residential real estate, first mortgage loans and up to 20% of its assets in adjustable-rate, residential real estate, first mortgage loans, subject to its liquidity levels and the credit demand of its customers. The Association also originates a significant amount of equity loans and equity lines of credit, and, to a lesser extent, residential construction loans. At September 30, 2009, residential real estate mortgage loans totaled $6.28 billion, or 67.1% of our loan portfolio, equity loans and lines of credit totaled $2.98 billion, or 31.8% of our loan portfolio, and residential construction loans totaled $94.3 million, or 1.0% of our loan portfolio.
Loan Portfolio Composition. The following table sets forth the composition of the Association’s loan portfolio, by type of loan at the dates indicated, excluding loans held for sale.
| At September 30, | |||||||||||||||||||||||||||||||||||
| 2009 | 2008 | 2007 | 2006 | 2005 | |||||||||||||||||||||||||||||||
| Amount | Percent | Amount | Percent | Amount | Percent | Amount | Percent | Amount | Percent | ||||||||||||||||||||||||||
| (Dollars in thousands) | |||||||||||||||||||||||||||||||||||
| Real estate loans: |
|||||||||||||||||||||||||||||||||||
| Residential non-Home Today |
$ | 5,990,283 | 64.0 | % | $ | 6,399,492 | 68.7 | % | $ | 5,842,827 | 71.5 | % | $ | 5,278,290 | 69.4 | % | $ | 5,257,601 | 67.5 | % | |||||||||||||||
| Residential Home Today |
291,692 | 3.1 | 303,153 | 3.3 | 304,046 | 3.7 | 285,492 | 3.8 | 250,068 | 3.2 | |||||||||||||||||||||||||
| Equity loans and lines of credit(1) |
2,983,003 | 31.8 | 2,488,054 | 26.7 | 1,867,899 | 22.8 | 1,803,900 | 23.7 | 1,965,604 | 25.2 | |||||||||||||||||||||||||
| Construction |
94,287 | 1.0 | 115,323 | 1.2 | 150,695 | 1.8 | 207,634 | 2.7 | 270,136 | 3.5 | |||||||||||||||||||||||||
| Commercial |
— | — | — | — | — | — | 2,335 | 0.0 | 2,383 | 0.0 | |||||||||||||||||||||||||
| Consumer loans: |
|||||||||||||||||||||||||||||||||||
| Automobile |
35 | 0.0 | 1,044 | 0.0 | 5,627 | 0.1 | 15,676 | 0.2 | 33,410 | 0.4 | |||||||||||||||||||||||||
| Other |
7,072 | 0.1 | 6,555 | 0.1 | 9,065 | 0.1 | 12,793 | 0.2 | 10,847 | 0.2 | |||||||||||||||||||||||||
| Total loans receivable |
$ | 9,366,372 | 100.0 | % | $ | 9,313,621 | 100.0 | % | $ | 8,180,159 | 100.0 | % | $ | 7,606,120 | 100.0 | % | $ | 7,790,049 | 100.0 | % | |||||||||||||||
| Deferred loan costs (fees) |
(10,463 | ) | (14,596 | ) | (19,174 | ) | (18,698 | ) | (22,783 | ) | |||||||||||||||||||||||||
| Loans in process |
(41,076 | ) | (46,493 | ) | (62,167 | ) | (89,676 | ) | (127,944 | ) | |||||||||||||||||||||||||
| Allowance for loan losses |
(95,248 | ) | (43,796 | ) | (25,111 | ) | (20,705 | ) | (18,601 | ) | |||||||||||||||||||||||||
| Total loans receivable, net |
$ | 9,219,585 | $ | 9,208,736 | $ | 8,073,707 | $ | 7,477,041 | $ | 7,620,721 | |||||||||||||||||||||||||
| (1) | Includes bridge loans. |
7
Table of Contents
Loan Portfolio Maturities. The following table summarizes the scheduled repayments of the Association’s loan portfolio at September 30, 2009. Demand loans, loans having no stated repayment schedule or maturity, and overdraft loans are reported as being due in the fiscal year ending September 30, 2010. Maturities are based on the final contractual payment date and do not reflect the impact of prepayments and scheduled principal amortization.
| Due During the Years |
Residential Real Estate | Equity Loans and Lines of Credit(1) |
Construction Loans |
Automobile Loans |
Other Consumer Loans |
Total | |||||||||||||||
| Non-Home Today |
Home Today |
||||||||||||||||||||
| (In thousands) | |||||||||||||||||||||
| 2010 |
$ | 8,689 | $ | — | $ | 19,312 | $ | 35,812 | $ | 35 | $ | 5,295 | $ | 69,143 | |||||||
| 2011 |
5,351 | — | 4,275 | 5,791 | — | — | 15,417 | ||||||||||||||
| 2012 |
4,697 | — | 9,477 | — | — | — | 14,174 | ||||||||||||||
| 2013 to 2014 |
59,132 | 30 | 14,850 | — | — | 391 | 74,403 | ||||||||||||||
| 2015 to 2019 |
372,970 | 2,772 | 72,601 | — | — | 1,386 | 449,729 | ||||||||||||||
| 2020 to 2024 |
690,039 | 5,166 | 353,502 | 3,177 | — | — | 1,051,884 | ||||||||||||||
| 2025 and beyond |
4,849,405 | 283,724 | 2,508,986 | 49,507 | — | — | 7,691,622 | ||||||||||||||
| Total |
$ | 5,990,283 | $ | 291,692 | $ | 2,983,003 | $ | 94,287 | $ | 35 | $ | 7,072 | $ | 9,366,372 | |||||||
| (1) | Includes bridge loans. |
The following table sets forth the scheduled repayments of fixed- and adjustable-rate loans at September 30, 2009 that are contractually due after September 30, 2010.
| Due After September 30, 2010 | |||||||||
| Fixed | Adjustable | Total | |||||||
| (In thousands) | |||||||||
| Real estate loans: |
|||||||||
| Residential non-Home Today |
$ | 5,332,892 | $ | 648,702 | $ | 5,981,594 | |||
| Residential Home Today |
291,457 | 235 | 291,692 | ||||||
| Equity Loans and Lines of Credit(1) |
152,672 | 2,811,019 | 2,963,691 | ||||||
| Construction |
52,292 | 6,183 | 58,475 | ||||||
| Consumer Loans: |
|||||||||
| Other |
1,777 | — | 1,777 | ||||||
| Total |
$ | 5,831,090 | $ | 3,466,139 | $ | 9,297,229 | |||
| (1) | Includes bridge loans. |
Residential Real Estate Mortgage Loans. The Association’s primary lending activity is the origination of residential real estate mortgage loans. At September 30, 2009, $6.28 billion, or 67.1% of its total loan portfolio, consisted of residential real estate mortgage loans. A comparison of 2009 data to the corresponding 2008 data and the Company’s expectations for 2009 can be found in “Item 7. Management’s Discussion and Analysis of Financial Condition and Results of Operation.” The Association offers conforming and non-conforming, fixed-rate and adjustable-rate residential real estate mortgage loans with maturities of up to 30 years and maximum loan amounts generally of up to $650,000.
The Association currently offers fixed-rate conventional mortgage loans with terms of up to 30 years that are fully amortizing with monthly loan payments, and adjustable-rate mortgage loans that amortize over a period of up to 30 years, provide an initial fixed interest rate for one, three, or five years and then adjust annually. The Association originates fixed-rate mortgage loans with terms of less than 15 years, but at rates applicable to our 15-year loans. Effective March 11, 2009, the Association stopped offering “interest only” residential real estate mortgage loans, where the borrower pays interest for an initial period (one, three or five years), after which the
8
Table of Contents
loan converts to a fully amortizing loan. At September 30, 2009, “interest only” residential real estate mortgage loans totaled $150.2 million. The Association’s Lowest Rate Guarantee program provides that, subject to the terms and conditions of the guarantee program, if a loan applicant finds a lower fixed interest rate on a residential real estate mortgage loan than the rate the Association offers, the Association will offer a lower rate or, after the applicant closes a loan with another lender at the lower interest rate, pay the loan applicant $1,000.
Residential real estate mortgage loans are generally underwritten according to Fannie Mae guidelines, and the Association refers to loans that conform to such guidelines as “conforming loans.” The Association generally originates both fixed- and adjustable-rate mortgage loans in amounts up to the maximum conforming loan limits as established by the Office of Federal Housing Enterprise Oversight, which is currently $417,000 for single-family homes in most of our lending markets. The Association also originates loans above the lending limit for conforming loans, which the Association refers to as “jumbo loans.” The Association generally underwrites jumbo loans in a manner similar to conforming loans. These jumbo loans are generally eligible for sale to various firms that specialize in purchasing non- conforming loans although activity in the sales market for jumbo loans has decreased dramatically during 2008 and 2009. Jumbo loans are not uncommon in the Association’s market areas.
The Association has always considered the promotion of home ownership a primary goal. In that regard, it offers affordable housing programs in all of its market areas. These programs are targeted toward low- and moderate-income home buyers. The Association’s primary program is called Home Today and is described in detail below. Prior to March 27, 2009, loans originated under the Home Today program had higher risk characteristics. The Association did not classify it as a sub-prime lending program based on the exclusion provided to community development loans in the Office of Thrift Supervision’s Expanded Guidance for Sub-prime Lending. Recently, attention has focused on sub-prime lending and its negative effect on borrowers and financial markets. Borrowers in the Home Today program are not charged higher fees or interest rates than non-Home Today borrowers. These loans are not interest only or negative amortizing and contain no low initial payment features or adjustable interest rates, which are features often associated with sub-prime lending. While the credit risk profiles of the Association’s borrowers in the Home Today program are generally higher risk than the credit risk profiles of its non-Home Today borrowers, the Association attempts to mitigate that higher risk through the use of private mortgage insurance and continued pre- and post-purchase counseling. The Association’s philosophy has been to provide borrowers the opportunity for home ownership within their financial means. Effective March 27, 2009, the Home Today underwriting guidelines were revised so as to be substantially the same as for our traditional first mortgage product.
Prior to March 27, 2009, through the Home Today program, the Association originated loans with its standard terms to borrowers who might not have otherwise qualified for such loans. After March 27, 2009 borrowers under the Home Today program are subject to the same qualification requirements as non-Home Today borrowers. To qualify for the Association’s Home Today program, a borrower must complete financial management education and counseling and must be referred to the Association by a sponsoring organization with which the Association has partnered as part of the program. Borrowers must meet a minimum credit score threshold. The Association will originate loans with a loan-to-value ratio of up to 90% through its Home Today program, provided that any loan originated through this program with a loan-to-value ratio in excess of 80% must meet the underwriting criteria mandated by its private mortgage insurance carrier. Because the Association previously applied less stringent underwriting and credit standards to these loans, the vast majority of the loans originated under the Home Today program generally have greater credit risk than traditional residential real estate mortgage loans. Effective October 2007, the private mortgage insurance carrier that provides coverage for the Home Today loans with loan-to-value ratios in excess of 80% imposed more restrictive lending requirements that have decreased the volume of Home Today lending, which we expect will continue through 2010. As of September 30, 2009, the Association had $291.7 million of loans outstanding that were originated through its Home Today program. Originations under the Home Today program have effectually stopped as a result of these new requirements. See “—Non-performing and Problem Assets—Delinquent Loans” for a discussion of the asset quality of this portion of the Association’s loan portfolio.
9
Table of Contents
Prior to November 25, 2008 the Association also originated loans under its High LTV program. These loans have loan-to-value ratios of 90% or greater, and may be as high as 95%. To qualify for this program, the loan applicant was required to satisfy more stringent underwriting criteria (credit score, income qualification, and other criteria). Borrowers do not obtain private mortgage insurance with respect to these loans. High LTV loans were originated with higher interest rates than the Association’s other residential real estate loans. The higher credit quality of this portion of the Association’s portfolio offsets the risk of not requiring private mortgage insurance. While these loans were not initially covered by private mortgage insurance, the Association had negotiated with a private mortgage insurance carrier a contract under which, at the Association’s option, a pre-determined dollar amount of qualifying loans may be grouped and submitted to the carrier for pooled private mortgage insurance coverage. As of September 30, 2009, the Association had $379.0 million of loans outstanding that were originated through its High LTV program, $330.7 million of which the Association has insured through a mortgage insurance carrier. The High LTV program was suspended November 25, 2008.
For loans with loan-to-value ratios in excess of 80% but equal to or less than 90%, the Association requires private mortgage insurance.
The Association actively monitors its interest rate risk position to determine the desirable level of investment in fixed-rate mortgages. Depending on market interest rates and its capital and liquidity positions, the Association may retain all of its newly originated longer-term fixed-rate residential mortgage loans, the Association may sell all or a portion of such loans in the secondary mortgage market to governmental entities such as Fannie Mae or other purchasers, or the Association may securitize such loans by selling the loans in exchange for mortgage-backed securities. These securities can be sold more readily to meet its liquidity or interest rate risk management needs, and have a lower risk-weight than the underlying loans, which reduces the Association’s regulatory capital requirements. Almost all of the loans that the Association securitizes are fixed-rate mortgage loans.
During the financial market upheaval of 2008, concern arose about the financial health of Fannie Mae and Freddie Mac, the value of their guarantees and; therefore, the continued existence of the secondary market for mortgage loans upon which the Association relies for liquidity and interest rate risk management. This market was preserved when, in September 2008, the Federal Housing Finance Agency placed Fannie Mae and Freddie Mac into conservatorship. Shortly after taking control, the U.S. Treasury Department established financing agreements to ensure Fannie Mae and Freddie Mac meet their obligations to holders of mortgage-backed securities that they have issued or guaranteed.
During periods of low market interest rates, the Association may sell a substantial portion of its newly originated fixed-rate residential real estate mortgage loans. The Association currently retains the servicing rights on all loans sold in order to generate fee income and reinforce its commitment to customer service. For the fiscal years ended September 30, 2009 and 2008, the Association recognized servicing fees, net of amortization, related to these servicing rights of $16.5 million and $21.5 million, respectively. As of September 30, 2009 and 2008, the principal balance of loans serviced for others totaled $7.50 billion and $6.93, billion respectively.
The Association currently offers adjustable-rate mortgage loan products secured by residential properties with interest rates that are fixed for an initial period ranging from one year to five years, after which the interest rate generally resets every year based upon a contractual spread or margin above the average yield on U.S. Treasury securities, adjusted to a constant maturity of one year, as published weekly by the Federal Reserve Board, subject to periodic and lifetime limitations on interest rate changes. Previously, the Association offered mortgage loans where the borrower paid only interest for a portion of the loan term. All of its adjustable-rate mortgage loans with initial fixed-rate periods of one, three or five years have initial and periodic caps of two percentage points on interest rate changes, with a cap of six percentage points for the life of the loan. Previously, the Association also offered adjustable-rate mortgage loans with an initial fixed-rate period of seven years. Loans originated under that program had an initial cap of five percentage points on the changes in interest rate, with a two percentage point cap on subsequent changes and a cap of five percentage points for the life of the loan. Many
10
Table of Contents
of the borrowers who select adjustable-rate mortgage loans have shorter-term credit needs than those who select long-term, fixed-rate mortgage loans. The Association will permit borrowers to convert adjustable-rate mortgage loans into fixed-rate mortgage loans at no cost to the borrower. The Association does not offer “Option ARM” loans, where borrowers can pay less than the interest owed on their loan, resulting in an increased principal balance during the life of the loan.
Adjustable-rate mortgage loans generally present different credit risks than fixed-rate mortgage loans primarily because the underlying debt service payments of the borrowers increase as interest rates increase, thereby increasing the potential for default. Interest-only loans present different credit risks than fully amortizing loans, as the principal balance of the loan does not decrease during the interest-only period. As a result, the Association’s exposure to loss of principal in the event of default does not decrease during this period. These adjustable rate, interest only, loans comprise less than 3% of our residential loans.
The Association requires title insurance on all of its residential real estate mortgage loans, and the Association also requires that borrowers maintain fire and extended coverage casualty insurance (and, if appropriate, flood insurance) in an amount at least equal to the lesser of the loan balance or the replacement cost of the improvements. A majority of its residential real estate mortgage loans have a mortgage escrow account from which disbursements are made for real estate taxes and flood insurance. The Association does not conduct environmental testing on residential real estate mortgage loans unless specific concerns for hazards are identified by the appraiser used in connection with the origination of the loan.
Equity Loans and Equity Lines of Credit. The Association offers equity loans and equity lines of credit, which are primarily secured by a second mortgage on residences. The Association also offers an equity lending product that is secured by a third mortgage, although the Association only originates this loan to borrowers where the Association also holds the second mortgage. At September 30, 2009, equity loans totaled $318.0 million, or 3.4% of total loans receivable, and equity lines of credit totaled $2.66 billion, or 28.4% of total loans receivable. Additionally, at September 30, 2009, the unadvanced amounts of equity lines of credit totaled $2.35 billion. The Association’s equity lending products include bridge loans, where a borrower can utilize the existing equity in their current home to fund the purchase of a new home before the current home is sold. As of September 30, 2009, bridge loans totaled $18.9 million, or 0.2% of total loans receivable, which is included in the total for equity loans above.
The underwriting standards for equity loans and equity lines of credit include an evaluation of the applicant’s credit history, employment and income verification, an assessment of the applicant’s ability to meet existing obligations and payments on the proposed loan and the value of the collateral securing the loan. In the summer of 2008, the combined loan-to-value ratio (first and second mortgage liens) for equity loans and equity lines of credit was reestablished at a limit of 80%, (from a limit of 85% that was generally in effect from the fall of 2007 through the summer of 2008). The Association originates its equity loans and equity lines of credit without application fees (except for bridge loans) or borrower-paid closing costs. Equity loans are offered with fixed interest rates, are fully amortizing and have terms of up to 15 years. The Association’s equity lines of credit are offered with adjustable rates of interest indexed to the prime rate, as reported in The Wall Street Journal. The Association’s Lowest Rate Guarantee program provides that, subject to the terms and conditions of the guarantee program, if a loan applicant or current equity line of credit borrower finds and qualifies for a better interest rate on a similar product with another lender, the Association will offer a lower rate or, if they close under the rate and terms presented with respect to the other lender, the Association will pay the loan applicant or borrower $1,000.
Bridge loans are originated for a one-year term, with no prepayment penalties. These loans have fixed interest rates, and are currently limited to a combined 80% loan-to-value ratio (first and second mortgage liens). The Association charges a closing fee with respect to bridge loans.
11
Table of Contents
Construction Loans. The Association originates construction loans for the purchase of developed lots and for the construction of single-family residences. Construction loans are offered to individuals for the construction of their personal residences by a qualified builder (construction/permanent loans), and to qualified builders (builder loans). At September 30, 2009, construction loans totaled $94.3 million, or 1.0% of total loans receivable. At September 30, 2009, the unadvanced portion of these construction loans totaled $41.1 million.
The Association’s construction/permanent loans generally provide for disbursements to the builder or sub-contractors during the construction phase as work progresses. During the construction phase, the borrower only pays interest on the drawn balance. Upon completion of construction, the loan converts to a permanent amortizing loan without the expense of a second closing. The Association offers construction/permanent loans with fixed or adjustable rates, and a current maximum loan-to-completed-appraised value ratio of 80%. At September 30, 2009, the Association’s construction/permanent loans totaled $52.7 million, or 0.6% of total loans receivable.
The Association’s builder loans consist of loans for homes that have been pre-sold as well as loans to developers that build homes before a buyer has been identified. The Association does not make land loans to developers for the acquisition and development of raw land. Construction loans to developers are currently limited to an 80% loan-to-completed-appraised value ratio for homes that are under contract for purchase and a 70% loan-to-completed-appraised value ratio for loans where no buyer has been identified. The interest rates are based on and adjust with the prime rate of interest, and are for terms of up to two years. As of September 30, 2009, the Association’s builder loans totaled $41.6 million, or 0.4% of total loans receivable.
Before making a commitment to fund a construction loan, the Association requires an appraisal of the property by an independent licensed appraiser. The Association generally also reviews and inspects each property before disbursement of funds during the term of the construction loan.
Construction financing generally involves greater credit risk than long-term financing on improved, owner-occupied real estate. Risk of loss on a construction loan depends largely upon the accuracy of the initial estimate of the value of the property at completion of construction compared to the estimated cost (including interest) of construction and other assumptions. If the estimate of construction cost proves to be inaccurate, the Association may be required to advance additional funds beyond the amount originally committed in order to protect the value of the property. Moreover, if the estimated value of the completed project proves to be inaccurate, the borrower may hold a property with a value that is insufficient to assure full repayment of the construction loan upon the sale of the property. This is more likely to occur in a recession where home prices are falling, like our current economic environment.
Loan Originations, Purchases, Sales, Participations and Servicing. Lending activities are conducted primarily by the Association’s loan personnel (all of whom are salaried employees) operating at our main and branch office locations and at our loan production offices. All loans that the Association originates are underwritten pursuant to its policies and procedures, which incorporate Fannie Mae underwriting guidelines to the extent applicable. The Association originates both adjustable-rate and fixed-rate loans. Its ability to originate fixed- or adjustable-rate loans is dependent upon the relative customer demand for such loans, which is affected by current market interest rates as well as anticipated future market interest rates. The Association’s loan origination and sales activity may be adversely affected by a rising interest rate environment or economic recession, which typically results in decreased loan demand. Most of the Association’s residential real estate mortgage loan originations are generated by its in-house loan representatives, by referrals from existing or past customers, by referrals from local builders and real estate brokers, from calls to its telephone call center and from the internet. The Association has a relationship with only one mortgage broker, which is affiliated with a national builder. During the fiscal year ended September 30, 2009, the Association originated $44.9 million of loans through this relationship. All such loans are underwritten to conform to the Association’s loan underwriting policies and procedures. The Association also advertises extensively throughout its market area.
12
Table of Contents
The Association decides whether to retain the loans that it originates, sell loans in the secondary market or securitize loans after evaluating current and projected market interest rates, its interest rate risk objectives, its liquidity needs and other factors. The Association securitized and sold $2.22 billion of residential real estate mortgage loans (all fixed-rate loans, and primarily with 30-year terms) during the fiscal year ended September 30, 2009, and it held $40.0 million of loans committed for sale in the secondary market at September 30, 2009. The fixed-rate mortgage loans that the Association originated and retained during the fiscal year ended September 30, 2009 consisted primarily of loans with 30-year terms.
The Association primarily sells its loans without recourse. Historically, the Association has retained the servicing rights on all residential real estate mortgage loans that it has sold, and intends to continue this practice in the future. At September 30, 2009, the Association serviced loans owned by others with a principal balance of $7.50 billion. Loan servicing includes collecting and remitting loan payments, accounting for principal and interest, contacting delinquent borrowers, supervising foreclosures and property dispositions in the event of unremedied defaults, making certain insurance and tax payments on behalf of the borrowers and generally administering the loans. The Association retains a portion of the interest paid by the borrower on the loans it services as consideration for its servicing activities. The Association did not enter into any loan participations during the fiscal year ended September 30, 2009 and does not expect to do so in the near future.
Loan Approval Procedures and Authority. The Association’s lending activities follow written, non-discriminatory underwriting standards and loan origination procedures established by its board of directors. The loan approval process is intended to assess the borrower’s ability to repay the loan and the value of the property that will secure the loan. To assess the borrower’s ability to repay, the Association reviews the borrower’s employment and credit history and information on the historical and projected income and expenses of the borrower.
The Association’s policies and loan approval limits are established by its board of directors. The Association’s board of directors has delegated authority to its Executive Committee (consisting of the Association’s Chief Executive Officer and three directors) to review and assign lending authorities to certain individuals of the Association to consider and approve loans within their designated authority. Residential real estate mortgage loans and construction loans in amounts above $650,000 require the approval of two individuals with designated underwriting authority. Loans in amounts below $650,000, including equity loans and equity lines of credit (which the Association caps at $150,000) require the approval of one individual with designated underwriting authority.
The Association also maintains automated underwriting systems for point-of-sale approvals of residential real estate mortgage loans, equity loans and equity lines of credit. Applications for loans in amounts no greater than the conforming loan limit that meet certain credit and income criteria may receive a full approval with respect to the amount of credit available and the subject property. If the property securing the loan cannot be valued using an automated valuation model, the borrower may receive a credit approval only. Applications for loan amounts in excess of the conforming loan limit may only receive a credit approval, subject to an appraisal of the subject property.
The Association generally requires independent third-party appraisals of real property securing loan amounts in excess of $250,000, although the Association may rely on alternative property valuation methods for loans up to the conforming loan limit. The Association obtains valuations or appraisals for all loans even if an appraisal is not required. The Association uses an automated valuation model to value most loans of $250,000 or less. Appraisals are performed by independent licensed appraisers. All appraisers are reviewed and approved by the Association’s board of directors annually.
Non-performing Assets and Restructured Loans. Within 15 days of a borrower’s delinquency, the Association attempts personal, direct contact with the borrower to determine the reason for the delinquency, to ensure that the borrower correctly understands the terms of the loan and to emphasize the importance of making payments on or before the due date. If necessary, subsequent late charges and delinquent notices are issued and
13
Table of Contents
the borrower’s account will be monitored on a regular basis thereafter. The Association also mails system-generated reminder notices on a monthly basis. When a loan is more than 30 days past due, the Association attempts to contact the borrower and develop a plan of repayment. By the 90th day of delinquency, the Association may recommend foreclosure. By this date, if a repayment agreement has not been established, or if an agreement is established but is subsequently broken, the borrower’s credit file is reviewed and, if considered necessary, information is updated or confirmed and the property securing the loan is re-evaluated. A summary report of all loans 30 days or more past due is provided to the Association’s board of directors.
Loans are automatically placed on non-accrual status when payment of principal or interest is more than 90 days delinquent. Loans are also placed on non-accrual status if collection of principal or interest in full is in doubt or if the loan has been restructured. When loans are placed on a non-accrual status, unpaid accrued interest is fully reversed, and further income is recognized only to the extent received. The loan may be returned to accrual status if unpaid principal and interest are repaid so that the loan is less than 90 days delinquent.
Debt restructuring is a method being increasingly used to help families keep their homes and preserve our neighborhoods. This involves making changes to the borrowers’ loan terms through capitalization of delinquent payments; interest rate reductions, either for a specific period or for the remaining term of the loan; term extensions including beyond that provided in the original agreement; or some combination of the above. These loans are measured for impairment based on the present value of expected future cash flows discounted at the effective interest rate of the original loan contract. Any shortfall is recorded as a charge-off against the allowance for loan losses. We evaluate these loans using the expected future cash flows because we expect the borrower to be the source of repayment for the loan and not liquidation of the collateral.
14
Table of Contents
The table below sets forth the amounts and categories of our non-performing assets and troubled debt restructurings at the dates indicated.
| At September 30, | ||||||||||||||||||||
| 2009 | 2008 | 2007 | 2006 | 2005 | ||||||||||||||||
| (Dollars in thousands) | ||||||||||||||||||||
| Non-accrual loans: |
||||||||||||||||||||
| Real estate loans: |
||||||||||||||||||||
| Residential non-Home Today |
$ | 100,061 | $ | 43,935 | $ | 21,746 | $ | 22,420 | $ | 21,527 | ||||||||||
| Residential Home Today |
84,694 | 63,679 | 55,653 | 40,153 | 25,724 | |||||||||||||||
| Equity loans and lines of credit(1) |
59,351 | 54,430 | 31,467 | 15,867 | 13,220 | |||||||||||||||
| Construction |
11,638 | 10,842 | 4,659 | 1,266 | 630 | |||||||||||||||
| Consumer loans: |
||||||||||||||||||||
| Automobile |
1 | — | — | 3 | 33 | |||||||||||||||
| Other |
— | — | — | — | 5 | |||||||||||||||
| Total non-performing loans |
255,745 | 172,886 | 113,525 | 79,709 | 61,139 | |||||||||||||||
| Real estate owned |
17,697 | 14,108 | 9,903 | 6,895 | 6,308 | |||||||||||||||
| Other non-performing assets |
— | — | — | — | — | |||||||||||||||
| Total non-performing assets |
$ | 273,442 | $ | 186,994 | $ | 123,428 | $ | 86,604 | $ | 67,447 | ||||||||||
| Troubled debt restructurings: |
||||||||||||||||||||
| Real estate loans: |
||||||||||||||||||||
| Residential non-Home Today |
$ | 21,382 | $ | 643 | $ | — | $ | — | $ | 157 | ||||||||||
| Residential Home Today |
20,918 | 226 | — | — | — | |||||||||||||||
| Equity loans and lines of credit(1) |
2,285 | — | — | — | — | |||||||||||||||
| Construction |
— | — | — | — | — | |||||||||||||||
| Consumer loans: |
||||||||||||||||||||
| Automobile |
— | — | — | — | — | |||||||||||||||
| Other |
— | — | — | — | — | |||||||||||||||
| Total |
$ | 44,585 | $ | 869 | $ | — | $ | — | $ | 157 | ||||||||||
| Ratios: |
||||||||||||||||||||
| Total non-performing loans to total loans |
2.73 | % | 1.86 | % | 1.39 | % | 1.05 | % | 0.78 | % | ||||||||||
| Total non-performing loans to total assets |
2.41 | % | 1.60 | % | 1.10 | % | 0.93 | % | 0.69 | % | ||||||||||
| Total non-performing assets to total assets |
2.58 | % | 1.73 | % | 1.20 | % | 1.01 | % | 0.76 | % | ||||||||||
| (1) | Includes bridge loans. |
For the year ended September 30, 2009, gross interest income that would have been recorded had the non-accruing loans been current in accordance with their original terms was $4.6 million. Interest income recognized on such loans for the year ended September 30, 2009 was not material. See “—Delinquent Loans.” Interest income on troubled debt restructurings was $498 thousand for the year ended September 30, 2009.
15
Table of Contents
Delinquent Loans. The following table sets forth loan delinquencies by type and by amount at the dates indicated.
| Loans Delinquent For | Total | ||||||||||||||
| 30-89 Days | 90 Days and Over | ||||||||||||||
| Number(1) | Amount | Number(1) | Amount | Number(1) | Amount | ||||||||||
| (Dollars in thousands) | |||||||||||||||
| At September 30, 2009 |
|||||||||||||||
| Real estate loans: |
|||||||||||||||
| Residential non-Home Today |
253 | $ | 30,940 | 745 | $ | 100,061 | 998 | $ | 131,001 | ||||||
| Residential Home Today |
296 | 25,831 | 913 | 84,694 | 1,209 | 110,525 | |||||||||
| Equity loans and lines of credit(1) |
491 | 26,072 | 793 | 59,351 | 1,284 | 85,423 | |||||||||
| Construction |
7 | 1,465 | 56 | 11,638 | 63 | 13,103 | |||||||||
| Consumer loans: |
|||||||||||||||
| Automobile |
2 | 1 | 3 | 1 | 5 | 2 | |||||||||
| Other |
— | — | — | — | — | — | |||||||||
| Total |
1,049 | $ | 84,309 | 2,510 | $ | 255,745 | 3,559 | $ | 340,054 | ||||||
| At September 30, 2008 |
|||||||||||||||
| Real estate loans: |
|||||||||||||||
| Residential non-Home Today |
287 | $ | 31,385 | 422 | $ | 43,935 | 709 | $ | 75,320 | ||||||
| Residential Home Today |
330 | 30,018 | 688 | 63,679 | 1,018 | 93,697 | |||||||||
| Equity loans and lines of credit(1) |
546 | 26,704 | 796 | 54,430 | 1,342 | 81,134 | |||||||||
| Construction |
4 | 758 | 57 | 10,842 | 61 | 11,600 | |||||||||
| Consumer loans: |
|||||||||||||||
| Automobile |
4 | 3 | — | — | 4 | 3 | |||||||||
| Other |
— | — | — | — | — | — | |||||||||
| Total |
1,171 | $ | 88,868 | 1,963 | $ | 172,886 | 3,134 | $ | 261,754 | ||||||
| At September 30, 2007 |
|||||||||||||||
| Real estate loans: |
|||||||||||||||
| Residential non-Home Today |
278 | $ | 23,276 | 244 | $ | 21,746 | 522 | $ | 45,022 | ||||||
| Residential Home Today |
292 | 26,775 | 600 | 55,653 | 892 | 82,428 | |||||||||
| Equity loans and lines of credit(1) |
536 | 24,795 | 500 | 31,467 | 1,036 | 56,262 | |||||||||
| Construction |
5 | 595 | 30 | 4,659 | 35 | 5,254 | |||||||||
| Consumer loans: |
|||||||||||||||
| Automobile |
20 | 95 | — | — | 20 | 95 | |||||||||
| Other |
— | — | — | — | — | — | |||||||||
| Total |
1,131 | $ | 75,536 | 1,374 | $ | 113,525 | 2,505 | $ | 189,061 | ||||||
| At September 30, 2006 |
|||||||||||||||
| Real estate loans: |
|||||||||||||||
| Residential non-Home Today |
235 | $ | 18,337 | 280 | $ | 22,420 | 515 | $ | 40,757 | ||||||
| Residential Home Today |
309 | 29,107 | 431 | 40,153 | 740 | 69,260 | |||||||||
| Equity loans and lines of credit(1) |
500 | 23,447 | 290 | 15,867 | 790 | 39,314 | |||||||||
| Construction |
5 | 595 | 12 | 1,266 | 17 | 1,861 | |||||||||
| Consumer loans: |
|||||||||||||||
| Automobile |
53 | 365 | 1 | 3 | 54 | 368 | |||||||||
| Other |
— | — | — | — | — | — | |||||||||
| Total |
1,102 | $ | 71,851 | 1,014 | $ | 79,709 | 2,116 | $ | 151,560 | ||||||
| At September 30, 2005 |
|||||||||||||||
| Real estate loans: |
|||||||||||||||
| Residential non-Home Today |
250 | $ | 19,099 | 295 | $ | 21,527 | 545 | $ | 40,626 | ||||||
| Residential Home Today |
296 | 27,275 | 280 | 25,274 | 576 | 52,549 | |||||||||
| Equity loans and lines of credit(1) |
432 | 17,819 | 264 | 13,220 | 696 | 31,039 | |||||||||
| Construction |
— | — | 6 | 630 | 6 | 630 | |||||||||
| Consumer loans: |
|||||||||||||||
| Automobile |
55 | 554 | 8 | 33 | 63 | 587 | |||||||||
| Other |
— | — | 1 | 5 | 1 | 5 | |||||||||
| Total |
1,033 | $ | 64,747 | 854 | $ | 61,139 | 1,887 | $ | 125,886 | ||||||
| (1) | Includes bridge loans. |
16
Table of Contents
Loans delinquent 90 days and over have continued to increase. Loans delinquent 90 days and over increased 47.9% to $255.7 million at September 30, 2009, from $172.9 million at September 30, 2008. The inability of borrowers to repay their loans is primarily a result of rising unemployment and uncertain economic prospects in our primary lending markets. Inasmuch as job losses and unemployment levels both continue to increase, we expect some borrowers who are current on their loans at September 30, 2009 to experience payment problems in the future. The excess number of housing units available for sale in the market today also may limit their ability to sell a home they can no longer afford. In Florida, housing values continue to remain depressed due to prior rapid building and speculation, which is now resulting in considerable inventory on the market and may limit a borrower’s ability to sell a home. As a result, we expect the level of loans delinquent 90 days and over will increase in the future.
Loans originated under the Home Today program prior to March 27, 2009, where the Association provided loans with its standard terms to borrowers who might not otherwise have qualified for such loans, have greater credit risk than traditional residential real estate mortgage loans. At September 30, 2009, we had $291.7 million of loans that were originated under the Home Today program, 37.9% of which were delinquent 30 days or more in repayments, compared to 2.2% for the portfolio of non-Home Today loans as of that date. At September 30, 2009, $84.7 million of loans originated under the Home Today program were non-accruing loans, representing 33.1% of total non-accruing loans as of that date.
Our equity loans and lines of credit portfolio consist of $318.0 million in equity loans, $18.9 million in bridge loans and $2.66 billion in equity lines of credit. At September 30, 2009, $146.0 million of equity lines of credit which are in repayment are included in the $318 million balance of equity loans. The $2.24 billion balance of equity lines of credit at September 30, 2008 included $121.1 million of loans which were in repayment. The following table sets forth committed and drawn amounts, percent delinquent 90 days or more and the mean combined loan-to-value (“CLTV”) percent at the time of origination of our equity line of credit portfolio by geographical distribution as of September 30, 2009:
| State |
Committed Amount |
Drawn Amount |
Percent Delinquent 90 days or more |
Mean CLTV Percent at Origination |
||||||||
| (Dollars in thousands) | ||||||||||||
| Ohio |
$ | 2,272,666 | $ | 1,044,623 | 0.96 | % | 63 | % | ||||
| Florida |
1,364,768 | 808,450 | 2.58 | % | 63 | % | ||||||
| California |
497,847 | 309,973 | 0.57 | % | 68 | % | ||||||
| Other(1) |
886,110 | 501,939 | 0.41 | % | 64 | % | ||||||
| Total |
$ | 5,021,391 | $ | 2,664,985 | 1.31 | % | 63 | % | ||||
| (1) | No individual state has a committed or drawn balance greater than 5% of the total. |
17
Table of Contents
The following table represents committed and drawn amounts, percent delinquent 90 days or more and the mean CLTV percent at the time of origination of our equity line of credit portfolio by the year originated as of September 30, 2009:
| Calendar Year Originated |
Committed Amount |
Drawn Amount |
Percent Delinquent 90 days or more |
Mean CLTV Percent at Origination |
||||||||
| (Dollars in thousands) | ||||||||||||
| 2000 and prior |
$ | 554,289 | $ | 236,247 | 1.11 | % | 51 | % | ||||
| 2001 |
161,468 | 74,258 | 1.27 | % | 66 | % | ||||||
| 2002 |
285,222 | 124,304 | 1.75 | % | 64 | % | ||||||
| 2003 |
413,927 | 195,872 | 1.66 | % | 68 | % | ||||||
| 2004 |
274,093 | 129,541 | 4.17 | % | 67 | % | ||||||
| 2005 |
212,922 | 106,964 | 3.72 | % | 68 | % | ||||||
| 2006 |
483,032 | 269,165 | 2.91 | % | 67 | % | ||||||
| 2007 |
708,531 | 435,586 | 1.55 | % | 68 | % | ||||||
| 2008 |
1,373,517 | 827,925 | 0.23 | % | 65 | % | ||||||
| 2009 |
554,390 | 265,123 | 0.00 | % | 57 | % | ||||||
| Total |
$ | 5,021,391 | $ | 2,664,985 | 1.31 | % | 63 | % | ||||
Current CLTV of loans in the equity loans and lines of credit portfolio may be different from the CLTV at origination as a result of changing home values.
In light of the housing market deterioration, the unfavorable trending of our delinquency statistics and the current instability in employment and economic prospects, beginning June 30, 2008 and at each quarter end thereafter, we expanded our loan evaluation methodology related to equity line of credit loans to include impairment evaluations for each equity line of credit loan that was 90 or more days past due. Beginning September 30, 2008, we expanded our loan level evaluation methodology related to closed-end real estate and equity loans to include impairment evaluations for each real estate and equity loan that was 180 or more days past due.
Real Estate Owned. Real estate acquired as a result of foreclosure or by deed in lieu of foreclosure is classified as real estate owned until sold. When property is acquired, it is recorded at the lower of cost or estimated fair market value at the date of foreclosure, establishing a new cost basis. Estimated fair value generally represents the sale price a buyer would be willing to pay on the basis of current market conditions. Holding costs and declines in estimated fair market value result in charges to expense after acquisition. At September 30, 2009, we had $17.7 million in real estate owned. For additional discussion see “Management’s Discussion and Analysis of Financial Condition and Results of Operation.”
Classification of Assets. Our policies, consistent with regulatory guidelines, provide for the classification of loans and other assets that are considered to be of lesser quality as substandard, doubtful, or loss assets. An asset is considered substandard if it is inadequately protected by the current net worth and paying capacity of the obligor or of the collateral pledged, if any. Substandard assets include those assets characterized by the distinct possibility that we will sustain some loss if the deficiencies are not corrected. Assets classified as doubtful have all of the weaknesses inherent in those classified substandard with the added characteristic that the weaknesses present make collection or liquidation in full, on the basis of currently existing facts, conditions and values, highly questionable and improbable. Assets (or portions of assets) classified as loss are those considered uncollectible and of such little value that their continuance as assets is not warranted. Assets that do not expose us to risk sufficient to warrant classification in one of the aforementioned categories, but which possess potential weaknesses that deserve our close attention, are required to be designated as special mention.
18
Table of Contents
When we classify assets as either substandard or doubtful, we allocate a portion of the related general loss allowances to such assets as we deem prudent. The allowance for loan losses is the amount estimated by management as necessary to absorb credit losses incurred in the loan portfolio that are both probable and reasonably estimable at the balance sheet date. When we classify a problem asset as loss, we provide a specific reserve for that portion of the asset that is uncollectible. Our determinations as to the classification of our assets and the amount of our loss allowances are subject to review by our principal federal regulator, the Office of Thrift Supervision (“OTS”), which can require that we establish additional loss allowances. We regularly review our asset portfolio to determine whether any assets require classification in accordance with applicable regulations. On the basis of our review of our assets at September 30, 2009, classified assets, net of reserves, consisted of substandard assets of $254.5 million, doubtful assets of $172 thousand and loss assets of $25.1 million. As of September 30, 2009, we did not have any individual assets classified as substandard with balances exceeding $1 million. The classified assets total includes $255.7 million of nonperforming loans, $17.7 million of real estate owned, and $6.4 million of performing loans displaying a weakness sufficient to warrant an adverse classification. As of September 30, 2009, we had $24.5 million of assets designated as special mention.
Impaired Loans. A loan is considered impaired when, based on current information and events, it is probable that the Company will be unable to collect the scheduled payments of principal and interest according to the contractual terms of the loan agreement. During the year ended September 30, 2008, the Company changed the population of loans that it individually evaluates for impairment to include real estate secured loans 180 days or more past due, except equity lines of credit, which it evaluates at 90 or more days past due. Large groups of smaller balance homogeneous loans are combined and collectively evaluated by portfolio for impairment. For a collateral dependent loan, impairment is measured based on the fair value of the collateral. For a loan whose terms are modified in a troubled debt restructuring, the Company measures impairment based on the present value of expected future cash flows discounted at the loan’s effective interest rate, where the loan’s effective interest rate is based on the contractual rate of the original loan, not the terms of the restructuring. When the recorded investment of an impaired loan exceeds the fair value of the collateral (or the present value of its expected future cash flows), a valuation allowance is established for the excess. For additional information regarding impaired loans, see footnote 5 in “Item 15.(a)(1) Financial Statements.”
Allowance for Loan Losses. We provide for loan losses based on the allowance method. Accordingly, all loan losses are charged to the related allowance and all recoveries are credited to it. Additions to the allowance for loan losses are provided by charges to income based on various factors which, in our judgment, deserve current recognition in estimating probable losses. We regularly review the loan portfolio and make provisions for loan losses in order to maintain the allowance for loan losses in accordance with accounting principles generally accepted in the United States of America. The allowance for loan losses consists of three components:
| (1) | specific allowances established for any impaired loans for which the recorded investment in the loan exceeds the measured value of the collateral or, alternatively, the present value of expected future cash flows for the loan; |
| (2) | general allowances for loan losses for each loan type based on historical loan loss experience; and |
| (3) | adjustments, which we describe as a market valuation adjustment, to historical loss experience (general allowances), maintained to cover uncertainties that affect our estimate of probable losses for each loan type. |
The market value adjustments are based on our evaluation of several factors, including:
| • | delinquency statistics (both current and historical) and the factors behind delinquency trends; |
| • | the status of loans in foreclosure, real estate in judgment and real estate owned; |
| • | the composition of the loan portfolio; |
| • | national, regional and local economic factors and trends; |
19
Table of Contents
| • | asset disposition loss statistics (both current and historical); |
| • | the current status of all assets classified during the immediately preceding meeting of the Asset Classification Committee; and |
| • | the industry. |
We evaluate the allowance for loan losses based upon the combined total of the specific, historical loss and general components. Generally when the loan portfolio increases, absent other factors, the allowance for loan loss methodology results in a higher dollar amount of estimated probable losses than would be the case without the increase. Generally when the loan portfolio decreases, absent other factors, the allowance for loan loss methodology results in a lower dollar amount of estimated probable losses than would be the case without the decrease.
As described in “Non-performing and Problem Assets—Delinquent Loans,” loans originated under the Home Today program prior to March 27, 2009 have greater credit risk than traditional residential real estate mortgage loans. At September 30, 2009, we had $291.7 million of loans that were originated under our Home Today program, 37.9% of which were delinquent 30 days or more in repayments, compared to 2.2% for our portfolio of non-Home Today loans as of that date.
Construction loans generally have greater credit risk than traditional residential real estate mortgage loans. The repayment of these loans depends upon the sale of the property to third parties or the availability of permanent financing upon completion of all improvements. In the event we make a loan on property that is not yet approved for the planned development, there is the risk that approvals will not be granted or will be delayed. These events may adversely affect the borrower and the collateral value of the property. Construction loans also expose us to the risk that improvements will not be completed on time in accordance with specifications and projected costs. In addition, the ultimate sale or rental of the property may not occur as anticipated.
We periodically evaluate the carrying value of loans and the allowance is adjusted accordingly. The increased provisions in the current fiscal year reflect the continued increase in the unprecedented level of net charge-offs over the past few quarters and the uncertain economic times that face many of our loan customers. A combination of various market conditions, mainly a decrease in home values and an increase in unemployment rates, have caused higher delinquencies and charge-offs in the loan portfolio. The market value adjustment discussed above has been expanded due to the magnitude and persistence of these negative trends.
While we use the best information available to make evaluations, future adjustments to the allowance may be necessary if conditions differ substantially from the information currently used in making the evaluations. In addition, as an integral part of its examination process, the OTS periodically reviews the allowance for loan losses. The OTS may require us to recognize additions to the allowance based on its analysis of information available to it at the time of its examination. For more on loan losses, see “Management’s Discussion and Analysis of Financial Condition and Results of Operation.”
20
Table of Contents
The following table sets forth activity in our allowance for loan losses for the fiscal years indicated.
| At or For the Years Ended September 30, | ||||||||||||||||||||
| 2009 | 2008 | 2007 | 2006 | 2005 | ||||||||||||||||
| (Dollars in thousands) | ||||||||||||||||||||
| Allowance balance (beginning of year) |
$ | 43,796 | $ | 25,111 | $ | 20,705 | $ | 18,601 | $ | 15,080 | ||||||||||
| Charge-offs: |
||||||||||||||||||||
| Real estate loans: |
||||||||||||||||||||
| Residential non-Home Today |
6,895 | 4,999 | 1,248 | 487 | 468 | |||||||||||||||
| Residential Home Today |
4,010 | 4,283 | 1,118 | 1,434 | 11 | |||||||||||||||
| Equity loans and lines of credit(1) |
51,623 | 6,187 | 2,839 | 2,631 | 1,750 | |||||||||||||||
| Construction |
1,442 | 598 | — | — | — | |||||||||||||||
| Commercial |
— | — | 517 | — | — | |||||||||||||||
| Consumer loans: |
||||||||||||||||||||
| Automobile |
— | 8 | 9 | 51 | — | |||||||||||||||
| Other |
— | — | 7 | — | 59 | |||||||||||||||
| Total charge-offs |
63,970 | 16,075 | 5,738 | 4,603 | 2,288 | |||||||||||||||
| Recoveries: |
||||||||||||||||||||
| Real estate loans: |
||||||||||||||||||||
| Residential non-Home Today |
195 | 128 | 271 | 89 | — | |||||||||||||||
| Residential Home Today |
— | 117 | 251 | 49 | — | |||||||||||||||
| Equity loans and lines of credit(1) |
225 | 8 | 22 | 519 | — | |||||||||||||||
| Construction |
— | — | — | — | — | |||||||||||||||
| Commercial |
— | — | — | — | — | |||||||||||||||
| Consumer loans: |
||||||||||||||||||||
| Automobile |
2 | — | — | — | — | |||||||||||||||
| Other |
— | 7 | — | — | 2 | |||||||||||||||
| Total recoveries |
422 | 260 | 544 | 657 | 2 | |||||||||||||||
| Net charge-offs |
(63,548 | ) | (15,815 | ) | (5,194 | ) | (3,946 | ) | (2,286 | ) | ||||||||||
| Reduction due to sale of subsidiary |
— | — | — | — | (193 | ) | ||||||||||||||
| Provision for loan losses |
115,000 | 34,500 | 9,600 | 6,050 | 6,000 | |||||||||||||||
| Allowance balance (end of year) |
$ | 95,248 | $ | 43,796 | $ | 25,111 | $ | 20,705 | $ | 18,601 | ||||||||||
| Ratios: |
||||||||||||||||||||
| Net charge-offs to average loans outstanding |
0.66 | % | 0.18 | % | 0.07 | % | 0.05 | % | 0.03 | % | ||||||||||
| Allowance for loan losses to non-performing loans at end of year |
37.24 | % | 25.33 | % | 22.12 | % | 25.98 | % | 30.42 | % | ||||||||||
| Allowance for loan losses to total loans at end of year |
1.02 | % | 0.47 | % | 0.31 | % | 0.27 | % | 0.24 | % | ||||||||||
| (1) | Includes bridge loans. |
The increased level of charge-offs in the residential mortgage loan and equity loan and lines of credit categories are not unexpected. The levels of delinquent loans in these portfolios have been increasing, more so in the equity loans and lines of credit portfolio. In light of continued housing market deterioration and the current instability in the employment and economic prospects in our primary lending markets, in June 2008 we began conducting expanded loan level reviews of equity lines of credit and as a result providing for increased losses. As these delinquencies have been resolved through pay-off, short sale or foreclosure, or management determines the collateral is not sufficient to satisfy the loan, uncollected balances have been charged against the allowance for loan losses previously provided. In the fiscal year ended September 30, 2009, $51.6 million in charge-offs for equity loans and lines of credit have been recorded compared to $6.2 million for the same period ended September 30, 2008. We continue to evaluate loans becoming delinquent for potential loss and record provisions
21
Table of Contents
for our estimate of those losses. We expect this higher level of charge-offs to continue as the higher level of delinquent loans are resolved in the future and uncollected balances are charged against the allowance.
In our quarterly reports on Form 10-Q for the quarters ended December 31, 2008, March 31, 2009 and June 30, 2009, the balances in the charge-off and recoveries sections of the activity in our allowance for loan losses tables were reversed between the Residential non-Home Today portfolio and the Residential Home Today portfolio lines. The following table provides the year to date balances, as filed and as revised, at the periods indicated for each line item.
| For the three months ended December 31, 2008 |
For the six months ended March 31, 2009 |
For the nine months ended June 30, 2009 | ||||||||||||||||
| as filed | revised | as filed | revised | as filed | revised | |||||||||||||
| Charge-offs: |
||||||||||||||||||
| Real estate loans: |
||||||||||||||||||
| Residential non-Home Today |
$ | 1,025 | $ | 989 | $ | 1,850 | $ | 2,037 | $ | 2,911 | $ | 4,739 | ||||||
| Residential Home Today |
989 | 1,025 | 2,037 | 1,850 | 4,739 | 2,911 | ||||||||||||
| Recoveries: |
||||||||||||||||||
| Real estate loans: |
||||||||||||||||||
| Residential non-Home Today |
— | 2 | — | 4 | — | 64 | ||||||||||||
| Residential Home Today |
2 | — | 4 | — | 64 | — | ||||||||||||
Allocation of Allowance for Loan Losses. The following table sets forth the allowance for loan losses allocated by loan category, the total loan balances by category, and the percent of loans in each category to total loans at the dates indicated. The allowance for loan losses allocated to each category is not necessarily indicative of future losses in any particular category and does not restrict the use of the allowance to absorb losses in other categories.
| At September 30, | |||||||||||||||||||||||||||
| 2009 | 2008 | 2007 | |||||||||||||||||||||||||
| Amount | Percent of Allowance to Total Allowance |
Percent of Loans in Category to Total Loans |
Amount | Percent of Allowance to Total Allowance |
Percent of Loans in Category to Total Loans |
Amount | Percent of Allowance to Total Allowance |
Percent of Loans in Category to Total Loans |
|||||||||||||||||||
| (Dollars in thousands) | |||||||||||||||||||||||||||
| Real estate loans: |
|||||||||||||||||||||||||||
| Residential non-Home Today |
$ | 22,678 | 23.8 | % | 64.0 | % | $ | 7,873 | 18.0 | % | 68.7 | % | $ | 4,781 | 19.1 | % | 71.5 | % | |||||||||
| Residential Home Today |
9,232 | 9.7 | 3.1 | 5,883 | 13.4 | 3.3 | 6,361 | 25.3 | 3.7 | ||||||||||||||||||
| Equity loans and lines of credit(1) |
57,594 | 60.5 | 31.8 | 28,118 | 64.2 | 26.7 | 13,141 | 52.3 | 22.8 | ||||||||||||||||||
| Construction |
5,743 | 6.0 | 1.0 | 1,922 | 4.4 | 1.2 | 778 | 3.1 | 1.8 | ||||||||||||||||||
| Commercial |
— | — | — | — | — | — | 23 | 0.1 | 0.0 | ||||||||||||||||||
| Consumer loans: |
|||||||||||||||||||||||||||
| Automobile |
1 | — | — | — | — | 0.0 | 25 | 0.1 | 0.1 | ||||||||||||||||||
| Other |
— | — | 0.1 | — | — | 0.1 | 2 | 0.0 | 0.1 | ||||||||||||||||||
| Total allowance for loan losses |
$ | 95,248 | 100.0 | % | 100.0 | % | $ | 43,796 | 100.0 | % | 100.0 | % | $ | 25,111 | 100.0 | % | 100.0 | % | |||||||||
22
Table of Contents
| At September 30, | ||||||||||||||||||
| 2006 | 2005 | |||||||||||||||||
| Amount | Percent of Allowance to Total Allowance |
Percent of Loans in Category to Total Loans |
Amount | Percent of Allowance to Total Allowance |
Percent of Loans in Category to Total Loans |
|||||||||||||
| (Dollars in thousands) | ||||||||||||||||||
| Real estate loans: |
||||||||||||||||||
| Residential non-Home Today |
$ | 4,636 | 22.4 | % | 69.4 | % | $ | 5,487 | 29.5 | % | 67.5 | % | ||||||
| Residential Home Today |
4,879 | 23.6 | 3.8 | 1,613 | 8.7 | 3.2 | ||||||||||||
| Equity loans and lines of credit(1) |
9,724 | 47.0 | 23.7 | 9,924 | 53.4 | 25.2 | ||||||||||||
| Construction |
414 | 2.0 | 2.7 | 300 | 1.6 | 3.5 | ||||||||||||
| Commercial |
975 | 4.7 | 0.0 | 1,118 | 6.0 | 0.0 | ||||||||||||
| Consumer loans: |
||||||||||||||||||
| Automobile |
75 | 0.3 | 0.2 | 155 | 0.8 | 0.4 | ||||||||||||
| Other |
2 | 0.0 | 0.2 | 4 | 0.0 | 0.2 | ||||||||||||
| Total allowance for loan losses |
$ | 20,705 | 100.0 | % | 100.0 | % | $ | 18,601 | 100.0 | % | 100.0 | % | ||||||
| (1) | Includes bridge loans. |
The percentage allocations for each loan category are impacted by changes and activities that occur in other categories of the Company’s loan portfolio. Because Home Today loans represent such a small portion (3.1%) of the overall portfolio, they are disproportionately impacted by changes in other categories. Specifically, large additions to the allowance for loan losses in the other, more significant, loan categories caused most of the percentage decrease in the portion of the allowance for loan losses allocated to Home Today loans.
Provisions for loan losses on equity loans and lines of credit have been increasing and are expected to increase in the future if non-performing loan balances and charge-offs continue to increase. Additional discussion of non-performing equity loan and lines of credit as well as charge-offs appears later in this section as well as the “Management’s Discussion and Analysis of Financial Conditions and Operating Results”.
In light of housing market deterioration, the unfavorable trending of our delinquency statistics and the current instability in employment and economic prospects, beginning June 30, 2008 and at each quarter end thereafter, we expanded our loan evaluation methodology related to equity line of credit loans to include impairment evaluations for each equity line of credit loan that was 90 or more days past due. Beginning September 30, 2008, we expanded our loan level evaluation methodology related to closed-end real estate and equity loans to include impairment evaluations for each real estate and equity loan that was 180 or more days past due. As more delinquent loans were subjected to individual evaluation, the portion of the allowance for loan losses identified as specific reserves increased, and, as a result the loss experiences factors used to evaluate the adequacy of the general loss reserve applicable to loans not evaluated for specific reserves decreased between March 31, 2008 and September 30, 2008. Adjustments to the historical loss experience factors have been made in response to the decrease in housing values, unemployment concerns in the Ohio market, an excess of available housing units in the Florida market, uncertainties surrounding the future performance of restructured loans, and, as a result, the general loan loss allowance increased between September 30, 2008 and September 30, 2009.
Investments
The Association’s board of directors is responsible for establishing and overseeing the Association’s investment policy. The investment policy is reviewed at least annually by management and any changes to the policy are recommended to the board of directors and are subject to its approval. This policy dictates that investment decisions be made based on the safety of the investment, liquidity requirements, potential returns, the ability to provide collateral for pledging requirements, and consistency with our interest rate risk management
23
Table of Contents
strategy. The Association’s Investment Committee, which consists of its chief operating officer, chief financial officer and other members of management, oversees its investing activities and strategies. The portfolio manager is responsible for making securities portfolio decisions in accordance with established policies. The portfolio manager has the authority to purchase and sell securities within specific guidelines established by the investment policy, but historically the portfolio manager has executed purchases only after extensive discussions with other Investment Committee members. All transactions are formally reviewed by the Investment Committee at least quarterly. In addition, all investment transactions are reviewed by the Executive Committee of the Association’s board of directors within 60 days of the transaction date to determine compliance with our investment policy. Any investment which, subsequent to its purchase, fails to meet the guidelines of the policy is reported to the Investment Committee, which decides whether to hold or sell the investment.
The Association’s current investment policy requires that it invests primarily in debt securities issued by the U.S. Government and agencies of the U.S. Government, which now include Fannie Mae and Freddie Mac. The policy also permits investments in mortgage-backed securities, including pass-through securities issued and guaranteed by Fannie Mae, Freddie Mac and Ginnie Mae as well as collateralized mortgage obligations (“CMOs”) and real estate mortgage investment conduits (“REMICS”) issued or backed by securities issued by these governmental agencies. The investment policy also permits investments in asset-backed securities, banker’s acceptances, money market funds, term federal funds, repurchase agreements and reverse repurchase agreements.
The Association’s current investment policy does not permit investment in municipal bonds, corporate debt obligations, preferred or common stock of government agencies or equity securities other than its required investment in the common stock of the FHLB of Cincinnati. As of September 30, 2009, we held no asset-backed securities or securities with sub-prime credit risk exposure. As a federal savings association, Third Federal Savings and Loan is not permitted to invest in equity securities. This general restriction does not apply to the Company.
The Association’s current investment policy prohibits hedging through the use of such instruments as financial futures, interest rate options and swaps, without specific approval from its board of directors.
Financial Accounting Standards Board (“FASB”) Accounting Standards Codification (“ASC”) 320, “Investments—Debt and Equity Securities”, requires that, at the time of purchase, we designate a security as held to maturity, available-for-sale, or trading, depending on our ability and intent. Securities designated as available-for-sale are reported at fair value, while securities designated as held to maturity are reported at amortized cost. We do not have a trading portfolio.
Our investment portfolio at September 30, 2009, primarily consisted of $9.0 million of U.S. Government and federal agency obligations, $25.5 million in primarily fixed-rate securities guaranteed by Fannie Mae, Freddie Mac or Ginnie Mae, and $557.8 million of REMICs.
U.S. Government and Federal Agency Obligations. While U.S. Government and federal agency securities generally provide lower yields than other investments in our securities investment portfolio, we maintain these investments, to the extent appropriate, for liquidity purposes, as collateral for borrowings and as an interest rate risk hedge in the event of significant mortgage loan prepayments.
Mortgage-Backed Securities. We purchase mortgage-backed securities insured or guaranteed by Fannie Mae, Freddie Mac or Ginnie Mae. We invest in mortgage-backed securities to achieve positive interest rate spreads with minimal administrative expense, and to lower our credit risk as a result of the guarantees provided by Freddie Mac, Fannie Mae or Ginnie Mae. During the financial market upheaval of 2008, concern arose about the financial health of Fannie Mae and Freddie Mac, the value of their guarantees and; therefore, the continued existence of the secondary market for mortgage loans upon which the Company relies for liquidity and interest rate risk management. This market was preserved when, in September 2008, the Federal Housing Finance Agency placed Freddie Mac and Fannie Mae into conservatorship. The U.S. Treasury Department has established financing agreements to ensure that Fannie Mae and Freddie Mac meet their obligations to holders of mortgage-backed securities that they have issued or guaranteed.
24
Table of Contents
Mortgage-backed securities are created by the pooling of mortgages and the issuance of a security with an interest rate that is less than the interest rate on the underlying mortgages. Mortgage-backed securities typically represent a participation interest in a pool of single-family or multi-family mortgages, although we invest primarily in mortgage-backed securities backed by one- to four-family mortgages. The issuers of such securities (generally Ginnie Mae, Fannie Mae and Freddie Mac) pool and resell the participation interests in the form of securities to investors such as the Association, and guarantee the payment of principal and interest to investors. Mortgage-backed securities generally yield less than the loans that underlie such securities because of the cost of payment guarantees and credit enhancements. However, mortgage-backed securities are more liquid than individual mortgage loans since there is an active trading market for such securities. While there has been significant disruption in the demand for private issuer mortgage-backed securities, the U.S. Treasury support for Fannie Mae and Freddie Mac guarantees has maintained an orderly market for the mortgage-backed securities the Company typically purchases. In addition, mortgage-backed securities may be used to collateralize our specific liabilities and obligations. Investments in mortgage-backed securities involve a risk that the timing of actual payments will be earlier or later than the timing estimated when the mortgage-backed security was purchased, which may require adjustments to the amortization of any premium or acceleration of any discount relating to such interests, thereby affecting the net yield on our securities. We periodically review current prepayment speeds to determine whether prepayment estimates require modification that could cause amortization or accretion adjustments.
CMOs and REMICs are types of debt securities issued by a special-purpose entity that aggregates pools of mortgages and mortgage-backed securities and creates different classes of securities with varying maturities and amortization schedules, as well as a residual interest, with each class possessing different risk characteristics. The cash flows from the underlying collateral are generally divided into “tranches” or classes that have descending priorities with respect to the distribution of principal and interest cash flows, while cash flows on pass-through mortgage-backed securities are distributed pro rata to all security holders.
The following table sets forth the amortized cost and fair value of our securities portfolio (excluding FHLB of Cincinnati common stock) at the dates indicated.
| At September 30, | ||||||||||||||||||
| 2009 | 2008 | 2007 | ||||||||||||||||
| Amortized Cost |
Fair Value |
Amortized Cost |
Fair Value |
Amortized Cost |
Fair Value | |||||||||||||
| (In thousands) | ||||||||||||||||||
| Investments available for sale: |
||||||||||||||||||
| U.S. Government and agency obligations |
$ | 9,000 | $ | 9,333 | $ | 8,997 | $ | 9,213 | $ | 28,994 | $ | 28,777 | ||||||
| Fannie Mae certificates |
— | — | 483 | 478 | 761 | 748 | ||||||||||||
| REMICs |
5,017 | 5,053 | 13,488 | 13,518 | 21,198 | 21,084 | ||||||||||||
| Other |
9,048 | 9,048 | 7,893 | 7,893 | 6,072 | 6,072 | ||||||||||||
| Total investment securities available for sale |
$ | 23,065 | $ | 23,434 | $ | 30,861 | $ | 31,102 | $ | 57,025 | $ | 56,681 | ||||||
| Investments held to maturity: |
||||||||||||||||||
| U.S. Government and agency obligations |
$ | — | $ | — | $ | — | $ | — | $ | 26,994 | $ | 26,968 | ||||||
| Freddie Mac certificates |
8,023 | 8,445 | 9,826 | 9,862 | 12,100 | 12,101 | ||||||||||||
| Ginnie Mae certificates |
7,161 | 7,490 | 8,366 | 8,481 | 10,278 | 10,418 | ||||||||||||
| REMICs |
552,792 | 560,408 | 787,699 | 789,562 | 761,172 | 762,347 | ||||||||||||
| Fannie Mae certificates |
10,355 | 11,097 | 11,859 | 12,142 | 13,265 | 13,484 | ||||||||||||
| Other |
— | — | — | — | 6 | 24 | ||||||||||||
| Total securities held to maturity |
$ | 578,331 | $ | 587,440 | $ | 817,750 | $ | 820,047 | $ | 823,815 | $ | 825,342 | ||||||
25
Table of Contents
Portfolio Maturities and Yields. The composition and maturities of the investment securities portfolio and the mortgage-backed securities portfolio at September 30, 2009 are summarized in the following table. Maturities are based on the final contractual payment dates, and do not reflect the impact of prepayments or early redemptions that may occur. All of our securities at September 30, 2009 were taxable securities.
| One Year or Less | More than One Year Through Five years |
More than Five Years Through Ten Years |
More than Ten Years |
Total Securities | |||||||||||||||||||||||||||||
| Amortized Cost |
Weighted Average Yield |
Amortized Cost |
Weighted Average Yield |
Amortized Cost |
Weighted Average Yield |
Amortized Cost |
Weighted Average Yield |
Amortized Cost |
Fair Value |
Weighted Average Yield |
|||||||||||||||||||||||
| (Dollars in thousands) | |||||||||||||||||||||||||||||||||
| Investments available-for-sale: |
|||||||||||||||||||||||||||||||||
| U.S. Government and agency obligations |
$ | 2,000 | 4.15 | % | $ | 7,000 | 4.50 | % | $ | — | — | $ | — | — | $ | 9,000 | $ | 9,333 | 4.42 | % | |||||||||||||
| REMICs |
— | — | — | — | 3,820 | 2.87 | % | 1,197 | 1.25 | % | 5,017 | 5,053 | 2.48 | % | |||||||||||||||||||
| Other |
— | — | — | — | — | — | 9,048 | 0.74 | % | 9,048 | 9,048 | 0.74 | % | ||||||||||||||||||||
| Total investment securities available-for-sale |
$ | 2,000 | 4.15 | % | $ | 7,000 | 4.50 | % | $ | 3,820 | 2.87 | % | $ | 10,245 | 0.80 | % | $ | 23,065 | $ | 23,434 | 2.56 | % | |||||||||||
| Investments held-to-maturity: |
|||||||||||||||||||||||||||||||||
| Freddie Mac certificates |
— | — | — | — | — | — | 8,023 | 5.38 | % | 8,023 | 8,445 | 5.38 | % | ||||||||||||||||||||
| Ginnie Mae certificates |
— | — | — | — | 2,989 | 4.66 | % | 4,172 | 1.52 | % | 7,161 | 7,490 | 2.83 | % | |||||||||||||||||||
| REMICs |
— | — | 22,175 | 5.35 | % | 123,702 | 3.06 | % | 406,915 | 3.53 | % | 552,792 | 560,408 | 3.50 | % | ||||||||||||||||||
| Fannie Mae certificates |
— | — | 305 | 6.36 | % | 919 | 6.51 | % | 9,131 | 6.51 | % | 10,355 | 11,097 | 6.51 | % | ||||||||||||||||||
| Total Investment securities held-to-maturity: |
$ | — | — | $ | 22,480 | 5.36 | % | $ | 127,610 | 3.13 | % | $ | 428,241 | 3.61 | % | $ | 578,331 | $ | 587,440 | 3.57 | % | ||||||||||||
Sources of Funds
General. Deposits traditionally have been the primary source of funds for the Association’s lending and investment activities. The Association also borrows, primarily from the FHLB of Cincinnati and the Federal Reserve Discount Window, to supplement cash flow, to lengthen the maturities of liabilities for interest rate risk management purposes and to manage its cost of funds. Additional sources of funds are the proceeds of loan sales, scheduled loan payments, maturing investments, loan prepayments, collateralized wholesale borrowings, retained earnings and income on other earning assets.
Deposits. The Association generates deposits primarily from the areas in which its branch offices are located, as well as from its telephone call center and its internet website. It relies on its competitive pricing, convenient locations and customer service to attract and retain deposits. It offers a variety of deposit accounts with a range of interest rates and terms. Its deposit accounts consist of savings accounts (primarily high-yield savings), NOW accounts (primarily high-yield checking accounts), certificates of deposit and individual retirement accounts and other qualified plan accounts. It currently does not accept brokered deposits.
Interest rates paid, maturity terms, service fees and withdrawal penalties are established on a periodic basis. Deposit rates and terms are based primarily on current operating strategies and market interest rates, liquidity requirements, interest rates paid by competitors and our deposit growth goals.
At September 30, 2009, deposits totaled $8.57 billion, NOW accounts totaled $987.5 million (including $923.9 million of high-yield checking accounts) and savings accounts totaled $1.23 billion (including $1.07 billion of high-yield savings accounts). At September 30, 2009, the Association had a total of $6.35 billion in certificates of deposit, of which $3.19 billion had remaining maturities of one year or less. Based on historical experience and its current pricing strategy, management believes the Association will retain a large portion of these accounts upon maturity.
26
Table of Contents
The following table sets forth the distribution of the Association’s average total deposit accounts, by account type, for the fiscal years indicated.
| For the Years Ended September 30, | |||||||||||||||||||||||||||
| 2009 | 2008 | 2007 | |||||||||||||||||||||||||
| Average Balance |
Percent | Weighted Average Rate |
Average Balance |
Percent | Weighted Average Rate |
Average Balance |
Percent | Weighted Average Rate |
|||||||||||||||||||
| (Dollars in thousands) | |||||||||||||||||||||||||||
| Deposit type: |
|||||||||||||||||||||||||||
| NOW |
$ | 1,046,640 | 12.5 | % | 0.87 | % | $ | 1,283,387 | 15.7 | % | 2.43 | % | $ | 1,621,548 | 20.9 | % | 4.08 | % | |||||||||
| Savings |
1,139,916 | 13.6 | % | 1.42 | % | 1,261,396 | 15.4 | % | 2.98 | % | 649,414 | 8.4 | % | 2.71 | % | ||||||||||||
| Certificates of deposit |
6,200,984 | 73.9 | % | 3.70 | % | 5,638,716 | 68.9 | % | 4.61 | % | 5,495,449 | 70.7 | % | 4.73 | % | ||||||||||||
| Total deposits |
$ | 8,387,540 | 100.0 | % | 3.04 | % | $ | 8,183,499 | 100.0 | % | 4.02 | % | $ | 7,766,411 | 100.0 | % | 4.43 | % | |||||||||
As of September 30, 2009, the aggregate amount of the Association’s outstanding certificates of deposit in amounts greater than or equal to $100,000 was approximately $1.98 billion. The following table sets forth the maturity of those certificates as of September 30, 2009.
| At September 30, 2009 | |||
| (In thousands) | |||
| Three months or less |
$ | 534,696 | |
| Over three months through six months |
165,724 | ||
| Over six months through one year |
251,839 | ||
| Over one year to three years |
522,285 | ||
| Over three years |
502,746 | ||
| Total |
$ | 1,977,290 | |
The following table sets forth, by interest rate ranges, information concerning the Association’s certificates of deposit at September 30, 2009.
| Period to Maturity | ||||||||||||||||||
| Less Than or Equal to One Year |
More Than One to Two Years |
More Than Two to Three years |
More Than Three Years |
Total | Percent of Total |
|||||||||||||
| (In thousands) | ||||||||||||||||||
| Interest Rate Range: |
||||||||||||||||||
| 2.99% and below |
$ | 2,598,355 | $ | 406,945 | $ | 104,341 | $ | 56,826 | $ | 3,166,467 | 49.85 | % | ||||||
| 3.00% to 3.99% |
223,481 | 155,026 | 41,645 | 611,444 | 1,031,596 | 16.24 | % | |||||||||||
| 4.00% to 4.99% |
316,735 | 94,313 | 148,890 | 575,886 | 1,135,824 | 17.89 | % | |||||||||||
| 5.00% to 5.99% |
29,019 | 241,924 | 481,252 | 238,018 | 990,213 | 15.59 | % | |||||||||||
| 6.00% to 6.99% |
21,713 | 5,666 | — | 83 | 27,462 | 0.43 | % | |||||||||||
| 7.00% and above |
— | — | 99 | — | 99 | 0.00 | % | |||||||||||
| Total |
$ | 3,189,303 | $ | 903,874 | $ | 776,227 | $ | 1,482,257 | $ | 6,351,661 | 100.00 | % | ||||||
27
Table of Contents
The following table sets forth the Association’s time deposits classified by interest rate at the dates indicated.
| At September 30, | |||||||||
| 2009 | 2008 | 2007 | |||||||
| (In thousands) | |||||||||
| Interest Rate |
|||||||||
| 2.99% and below |
$ | 3,166,467 | $ | 402,293 | $ | 45,738 | |||
| 3.00% to 3.99% |
1,031,596 | 1,841,322 | 391,880 | ||||||
| 4.00% to 4.99% |
1,135,824 | 2,135,540 | 1,842,377 | ||||||
| 5.00% to 5.99% |
990,213 | 1,531,962 | 3,346,746 | ||||||
| 6.00% to 6.99% |
27,462 | 29,957 | 31,651 | ||||||
| 7.00% and above |
99 | 92 | 86 | ||||||
| Total |
$ | 6,351,661 | $ | 5,941,166 | $ | 5,658,478 | |||
Borrowings. At September 30, 2009, the Association had $70.2 million of borrowings from the FHLB of Cincinnati. During the fiscal year ended September 30, 2009, the Association’s third party borrowings consisted of loans, commonly referred to as “advances,” from the FHLB of Cincinnati and borrowings from the Federal Reserve Bank of Cleveland. Borrowings from the FHLB Cincinnati are secured by the Association’s investment in the common stock of the FHLB Cincinnati as well as by a blanket pledge of its mortgage portfolio not otherwise pledged. Our current additional borrowing capacity with the FHLB Cincinnati is $899.5 million as limited by the amount of FHLB Cincinnati common stock that we own. From the perspective of the value of collateral securing advances, our capacity limit for additional borrowings from the FHLB Cincinnati at September 30, 2009 was $1.54 billion, subject to satisfaction of the FHLB Cincinnati common stock ownership requirement. To satisfy the common stock ownership requirement, we would have to increase our ownership of FHLB Cincinnati common stock by an additional $30.8 million. Borrowings from the Federal Reserve Discount Window are also secured by a pledge of specific loans in the Association’s mortgage portfolio. At September 30, 2009, the Association had no borrowings from the Federal Reserve with the capacity to borrow up to $399.9 million.
The following table sets forth information concerning balances and interest rates on the Association’s borrowings at and for the periods shown:
| At or for the fiscal years ended September 30, |
||||||||||||
| 2009 | 2008 | 2007 | ||||||||||
| (Dollars in thousands) | ||||||||||||
| Balance at end of year |
$ | 70,158 | $ | 498,028 | $ | — | ||||||
| Average balance during year |
$ | 289,911 | $ | 70,218 | $ | 20,274 | ||||||
| Maximum outstanding at any month end |
$ | 558,060 | $ | 498,028 | $ | 25,106 | ||||||
| Weighted average interest rate at end of year |
2.75 | % | 2.00 | % | — | |||||||
| Average interest rate during year |
2.22 | % | 2.12 | % | 4.99 | % | ||||||
Federal Taxation
General. The Company and the Association are subject to federal income taxation in the same general manner as other corporations, with certain exceptions. Prior to the completion of our initial public stock offering on April 20, 2007, the Company and the Association were included as part of Third Federal Savings, MHC’s consolidated tax group. However, upon completion of the offering, the Company and the Association are no longer a part of Third Federal Savings, MHC’s consolidated tax group because Third Federal Savings, MHC no longer owns at least 80% of the common stock of the Company. For the period ended September 30, 2009 and prospectively, the Company intends to file consolidated tax returns with the Association, its wholly-owned subsidiary. Third Federal Savings, MHC’s and the Company’s consolidated federal tax returns are not currently
28
Table of Contents
under audit, and have not been audited during the past five years. The following discussion of federal taxation is intended only to summarize certain pertinent federal income tax matters and is not a comprehensive description of the tax rules applicable to the Company or the Association.
Bad Debt Reserves. Historically, the Third Federal Savings, MHC consolidated group used the specific charge off method to account for bad debt deductions for income tax purposes, and the Company intends to use the specific charge off method to account for tax bad debt deductions in the future.
Taxable Distributions and Recapture. Prior to 1996, bad debt reserves created prior to 1988 were subject to recapture into taxable income if the Association failed to meet certain thrift asset and definitional tests or made certain distributions. Tax law changes in 1996 eliminated thrift-related recapture rules. However, under current law, pre-1988 tax bad debt reserves remain subject to recapture if the Association makes certain non-dividend distributions, repurchases any of its common stock, pays dividends in excess of earnings and profits, or fails to qualify as a bank for tax purposes.
At September 30, 2009, the total federal pre-base year bad debt reserve of the Association was approximately $105.0 million.
Charitable Contribution Carryovers. Federal income tax regulations limit charitable contribution deductions to 10% of taxable income. Unused charitable contribution deductions may be carried forward to the succeeding five taxable years. At September 30, 2009, the Company has a charitable contribution carryover for federal income tax purposes of approximately $31.8 million, which expires September 30, 2012.
State Taxation
Following its initial public stock offering in 2007, the Company converted from a qualified passive investment company domiciled in the State of Delaware to a qualified holding company in Ohio and is subject to Ohio tax levied on income. A significant majority of state taxes paid by the remaining entities in our corporate structure are also paid to the State of Ohio. The Association is subject to Ohio franchise tax based on equity capital plus certain reserve amounts. Total equity capital for this purpose is reduced by certain exempted assets. The resulting net taxable value of capital is taxed at a rate of 1.3%. The other Ohio subsidiaries of the Company are taxed on the greater of a tax based on net income or net worth.
SUPERVISION AND REGULATION
General
The Company is a savings and loan holding company, and is required to file certain reports with, and is subject to examination by, and otherwise must comply with the rules and regulations of the OTS. The Company is also subject to the rules and regulations of the Securities and Exchange Commission under the federal securities laws.
The Association is examined and supervised by the OTS and is subject to examination by the Federal Deposit Insurance Corporation (“FDIC”). This regulation and supervision establishes a comprehensive framework of activities in which an institution may engage and is intended primarily for the protection of the FDIC’s deposit insurance fund and depositors. Under this system of federal regulation, financial institutions are periodically examined to ensure that they satisfy applicable standards with respect to their capital adequacy, assets, management, earnings, liquidity and sensitivity to market interest rates. Following completion of its examination, the federal agency critiques the institution’s operations and assigns its rating (known as an institution’s CAMELS rating). Under federal law, an institution may not disclose its CAMELS rating to the public. Third Federal Savings and Loan also is a member of and owns stock in the FHLB of Cincinnati, which is one of the twelve regional banks in the Federal Home Loan Bank System. The Association also is regulated to a
29
Table of Contents
lesser extent by the Board of Governors of the Federal Reserve System, governing reserves to be maintained against deposits and other matters. The OTS will examine the Association and prepare reports for the consideration of the Association’s board of directors on any operating deficiencies. The Association’s relationship with its depositors and borrowers also is regulated to a great extent by federal law and, to a much lesser extent, state law, especially in matters concerning the ownership of deposit accounts and the form and content of the Association’s mortgage documents.
Any change in these laws or regulations, whether by the FDIC, the OTS or Congress, could have a material adverse impact on the Company, the Association and their operations.
Certain of the regulatory requirements that are applicable to the Association and the Company are described below. This description of statutes and regulations is not intended to be a complete explanation of such statutes and regulations and their effects on the Association and the Company and is qualified in its entirety by reference to the actual statutes and regulations.
Please refer to section “Proposed Financial Reform Legislation”, which is presented later in this “Item 1, Business”, for a discussion of proposed changes under consideration in connection with current financial reform legislation.
Federal Banking Regulation
Business Activities. A federal savings association derives its lending and investment powers from the Home Owners’ Loan Act, as amended, and the regulations of the OTS. Under these laws and regulations, the Association may invest in mortgage loans secured by residential real estate without limitations as a percentage of assets, and may invest in non-residential real estate loans up to 400% of capital in the aggregate, commercial business loans up to 20% of assets in the aggregate and consumer loans up to 35% of assets in the aggregate, and in certain types of debt securities and certain other assets. An association also may establish subsidiaries that may engage in activities not otherwise permissible for an association, including real estate investment and securities and insurance brokerage.
Capital Requirements. OTS regulations require savings associations to meet three minimum capital standards: a 1.5% tangible capital ratio, a 4% leverage ratio (3% for savings associations receiving the highest rating on the CAMELS rating system) and an 8% risk-based capital ratio.
The risk-based capital standard for savings associations requires the maintenance of Tier 1 (core) and total capital (which is defined as core capital and supplementary capital) to risk-weighted assets of at least 4% and 8%, respectively. In determining the amount of risk-weighted assets, all assets, including certain off-balance sheet assets, are multiplied by a risk-weight factor of 0% to 100%, assigned by the OTS, based on the risks believed inherent in the type of asset. Core capital is defined as common shareholders’ equity (including retained earnings), certain non-cumulative perpetual preferred stock and related surplus and minority interests in equity accounts of consolidated subsidiaries, less intangibles other than certain mortgage servicing rights and credit card relationships. The components of supplementary capital currently include cumulative preferred stock, long-term perpetual preferred stock, mandatory convertible securities, subordinated debt and intermediate preferred stock, the allowance for loan and lease losses limited to a maximum of 1.25% of risk-weighted assets and up to 45% of net unrealized gains on available-for-sale equity securities with readily determinable fair market values. Overall, the amount of supplementary capital included as part of total capital cannot exceed 100% of core capital. Additionally, a savings association that retains credit risk in connection with an asset sale may be required to maintain additional regulatory capital because of the recourse back to the savings association.
At September 30, 2009, the Association’s capital exceeded all applicable requirements.
30
Table of Contents
Loans-to-One Borrower. Generally, a federal savings association may not make a loan or extend credit to a single or related group of borrowers in excess of 15% of unimpaired capital and surplus. An additional amount may be loaned, equal to 10% of unimpaired capital and surplus, if the loan is secured by readily marketable collateral, which generally does not include real estate. As of September 30, 2009, the Association was in compliance with the loans-to-one borrower limitations.
Qualified Thrift Lender Test. As a federal savings association, the Association must satisfy the qualified thrift lender, or “QTL”, test. Under the QTL test, the Association must maintain at least 65% of its “portfolio assets” in “qualified thrift investments” (primarily residential mortgages and related investments, including mortgage-backed securities) in at least nine months of the most recent 12-month period. “Portfolio assets” generally means total assets of a savings institution, less the sum of specified liquid assets up to 20% of total assets, goodwill and other intangible assets, and the value of property used in the conduct of the savings association’s business.
The Association also may satisfy the QTL test by qualifying as a “domestic building and loan association” as defined in the Internal Revenue Code.
A savings association that fails the qualified thrift lender test must either convert to a bank charter or operate under specified restrictions. At September 30, 2009, the Association satisfied this test.
Capital Distributions. OTS regulations govern capital distributions by a federal savings association, which include cash dividends, stock repurchases and other transactions charged to the capital account. A savings association must file an application for approval of a capital distribution if:
| • | the total capital distributions for the applicable calendar year exceed the sum of the savings association’s net income for that year to date plus the savings association’s retained net income for the preceding two years; |
| • | the savings association would not be at least adequately capitalized following the distribution; |
| • | the distribution would violate any applicable statute, regulation, agreement or OTS-imposed condition; or |
| • | the savings association is not eligible for expedited treatment of its filings. |
Even if an application is not otherwise required, every savings association that is a subsidiary of a holding company must still file a notice with the OTS at least 30 days before the board of directors declares a dividend or approves a capital distribution.
The OTS may disapprove a notice or application if:
| • | the savings association would be undercapitalized following the distribution; |
| • | the proposed capital distribution raises safety and soundness concerns; or |
| • | the capital distribution would violate a prohibition contained in any statute, regulation or agreement. |
In addition, the Federal Deposit Insurance Act provides that an insured depository institution shall not make any capital distribution, if after making such distribution the institution would be undercapitalized.
There were no dividends paid to the Company by the Association during the years ended September 30, 2009 and 2007 and no dividends paid to the Company by Third Capital during the years ended September 30, 2009, 2008, and 2007. On September 29, 2008, having complied with all regulatory stipulations and notification requirements, the Association paid a $100 million dividend to the Company.
Liquidity. A federal savings association is required to maintain a sufficient amount of liquid assets to ensure its safe and sound operation.
31
Table of Contents
Community Reinvestment Act and Fair Lending Laws. All savings associations have a responsibility under the Community Reinvestment Act and related regulations of the OTS to help meet the credit needs of their communities, including low- and moderate-income neighborhoods. In connection with its examination of a federal savings association, the OTS is required to assess the savings association’s record of compliance with the Community Reinvestment Act. In addition, the Equal Credit Opportunity Act and the Fair Housing Act prohibit lenders from discriminating in their lending practices on the basis of characteristics specified in those statutes. A savings association’s failure to comply with the provisions of the Community Reinvestment Act could, at a minimum, result in denial of certain corporate applications such as branches or mergers, or in restrictions on its activities. The failure to comply with the Equal Credit Opportunity Act and the Fair Housing Act could result in enforcement actions by the OTS, as well as other federal regulatory agencies and the Department of Justice.
The Association received a satisfactory Community Reinvestment Act rating in its most recent federal examination.
Transactions with Related Parties. A federal savings association’s authority to engage in transactions with its affiliates is limited by OTS regulations and by Sections 23A and 23B of the Federal Reserve Act and its implementing Regulation W. An affiliate is a company that controls, is controlled by, or is under common control with an insured depository institution such as the Association. The Company is an affiliate of the Association. In general, loan transactions between an insured depository institution and its affiliates are subject to certain quantitative and collateral requirements. In this regard, transactions between an insured depository institution and its affiliates are limited to 10% of the institution’s unimpaired capital and unimpaired surplus for transactions with any one affiliate and 20% of unimpaired capital and unimpaired surplus for transactions in the aggregate with all affiliates. Collateral in specified amounts ranging from 100% to 130% of the amount of the transaction must usually be provided by affiliates in order to receive loans from the savings association. In addition, OTS regulations prohibit a savings association from lending to any of its affiliates that are engaged in activities that are not permissible for bank holding companies and from purchasing the securities of any affiliate, other than a subsidiary. Finally, transactions with affiliates must be consistent with safe and sound banking practices, not involve low-quality assets and be on terms that are as favorable to the institution as comparable transactions with non-affiliates. The OTS requires savings associations to maintain detailed records of all transactions with affiliates.
The Association’s authority to extend credit to its directors, executive officers and 10% shareholders, as well as to entities controlled by such persons, is currently governed by the requirements of Sections 22(g) and 22(h) of the Federal Reserve Act and Regulation O of the Federal Reserve Board. Among other things, these provisions require that extensions of credit to insiders:
| (i) | be made on terms that are substantially the same as, and follow credit underwriting procedures that are not less stringent than, those prevailing for comparable transactions with unaffiliated persons and that do not involve more than the normal risk of repayment or present other unfavorable features, and |
| (ii) | not exceed certain limitations on the amount of credit extended to such persons, individually and in the aggregate, which limits are based, in part, on the amount of the Association’s capital. |
In addition, extensions of credit in excess of certain limits must be approved by the Association’s board of directors.
Enforcement. The OTS has primary enforcement responsibility over federal savings institutions and has the authority to bring enforcement action against all “institution-affiliated parties,” including shareholders, and attorneys, appraisers and accountants who knowingly or recklessly participate in wrongful action likely to have an adverse effect on an insured institution. Formal enforcement action by the OTS may range from the issuance of a capital directive or cease and desist order, to removal of officers and/or directors of the institution and the appointment of a receiver or conservator. Civil penalties cover a wide range of violations and actions, and range up to $25,000 per day, unless a finding of reckless disregard is made, in which case penalties may be as high as
32
Table of Contents
$1 million per day. The FDIC also has the authority to terminate deposit insurance or to recommend to the Director of the OTS (“Director”) that enforcement action be taken with respect to a particular savings institution. If action is not taken by the Director, the FDIC has authority to take action under specified circumstances.
Standards for Safety and Soundness. Federal law requires each federal banking agency to prescribe certain standards for all insured depository institutions. These standards relate to, among other things, internal controls, information systems and audit systems, loan documentation, credit underwriting, interest rate risk exposure, asset growth, compensation, and other operational and managerial standards as the agency deems appropriate. The federal banking agencies adopted Interagency Guidelines Prescribing Standards for Safety and Soundness to implement the safety and soundness standards required under federal law. The guidelines set forth the safety and soundness standards that the federal banking agencies use to identify and address problems at insured depository institutions before capital becomes impaired. If the appropriate federal banking agency determines that an institution fails to meet any standard prescribed by the guidelines, the agency may require the institution to submit to the agency an acceptable plan to achieve compliance with the standard. If an institution fails to meet these standards, the appropriate federal banking agency may require the institution to submit a compliance plan.
Prompt Corrective Action Regulations. Under the prompt corrective action regulations, the OTS is required and authorized to take supervisory actions against undercapitalized savings associations. For this purpose, a savings association is placed in one of the following five categories based on the savings association’s capital:
| • | well-capitalized (at least 5% leverage capital, 6% Tier 1 risk-based capital and 10% total risk-based capital); |
| • | adequately capitalized (at least 4% leverage capital, 4% Tier 1 risk-based capital and 8% total risk-based capital); |
| • | undercapitalized (less than 3% leverage capital, 4% Tier 1 risk-based capital or 8% total risk-based capital); |
| • | significantly undercapitalized (less than 3% leverage capital, 3% Tier 1 risk-based capital or 6% total risk-based capital); and |
| • | critically undercapitalized (less than 2% tangible capital). |
Generally, the banking regulator is required to appoint a receiver or conservator for a savings association that is “critically undercapitalized” within specific time frames. The regulations also provide that a capital restoration plan must be filed with the OTS within 45 days of the date a savings association receives notice that it is “undercapitalized,” “significantly undercapitalized” or “critically undercapitalized.” The criteria for an acceptable capital restoration plan include, among other things, the establishment of the methodology and assumptions for attaining adequately capitalized status on an annual basis, procedures for ensuring compliance with restrictions imposed by applicable federal regulations, the identification of the types and levels of activities the savings association will engage in while the capital restoration plan is in effect, and assurances that the capital restoration plan will not appreciably increase the current risk profile of the savings association. Any holding company for a savings association required to submit a capital restoration plan must guarantee the lesser of an amount equal to 5% of the savings association’s assets at the time it was notified or deemed to be undercapitalized by the OTS, or the amount necessary to restore the savings association to adequately capitalized status. This guarantee remains in place until the OTS notifies the savings association that it has maintained adequately capitalized status for each of four consecutive calendar quarters, and the OTS has the authority to require payment and collect payment under the guarantee. Failure by a holding company to provide the required guarantee will result in certain operating restrictions on the savings association, such as restrictions on the ability to declare and pay dividends, pay executive compensation and management fees, and increase assets or expand operations. The OTS may also take any one of a number of discretionary supervisory actions against undercapitalized associations, including the issuance of a capital directive and the replacement of senior executive officers and directors.
At September 30, 2009, the Association met the criteria for being considered “well-capitalized.”
33
Table of Contents
Insurance of Deposit Accounts. As of September 30, 2009, deposit accounts in the Association were insured by the FDIC, up to a maximum of $250,000 per separately insured depositor. The basic limit on federal deposit insurance coverage was raised from $100,000 to $250,000 per depositor, effective October 3, 2008, with the passage of the Emergency Economic Stabilization Act of 2008 (“EESA of 2008”). The increase in the maximum coverage under EESA of 2008 was designated as temporary, with an expiration date of December 31, 2009. Subsequently, on May 20, 2009, under authority provided by the Helping Families Save Their Homes Act, the temporary increase in coverage was extended through December 31, 2013. The Association’s deposits are subject to FDIC deposit insurance assessments.
In November 2008, the FDIC adopted the Temporary Liquidity Guarantee Program that provided full deposit insurance coverage for non-interest bearing deposit transaction accounts, regardless of the dollar amount. The temporary guarantee was initially scheduled to expire on December 31, 2009, but was subsequently extended until June 30, 2010. As permitted under the program, the Association opted out of such additional coverage.
Previously, on November 2, 2006, the FDIC adopted final regulations that assess deposit insurance premiums based on risk. This enabled the FDIC to more closely tie each financial institution’s deposit insurance premiums to the risk it poses to the deposit insurance fund. Under this risk-based assessment system, the FDIC evaluated the risk of each financial institution based on its supervisory rating, its financial ratios, and its long-term debt issuer rating. Following the signing of EESA of 2008, on October 7, 2008 the Board of Directors of the FDIC adopted a restoration plan that included higher assessments on insured banks as well as adjustments to improve the risk-based assessment system. The assessment adjustments consider the status of unsecured debt (which can reduce the assessment), as well as secured liabilities and brokered deposits (both of which can increase the assessment). Under current regulations, the base assessment rates for financial institutions that have offered insured deposits for at least five years can vary between 7 and 77.5 cents for every $100 of domestic deposits. As a part of the regulations, in general, institutions that contributed to the recapitalization of the Savings Association Insurance Fund in 1996 were eligible to receive a one-time assessment credit. For the Association, the “one-time” credit totaled $6.3 million; of which $2.6 million was utilized during the fiscal year ended September 30, 2007 to fully offset the levied assessment. The remainder of the Association’s credit was utilized during the fiscal year ended September 30, 2008 to partially offset the otherwise required assessment payment.
On May 22, 2009, the FDIC adopted a final rule imposing a 5 basis point special assessment on each insured depository institution’s assets minus Tier 1 capital as of June 30, 2009. As a result, our expense for deposit insurance for the fiscal year ended September 30, 2009 includes approximately $4.8 million for this emergency assessment which was levied as of June 30, 2009 and collected on September 30, 2009. The May 22nd final rule also permitted the Board to impose up to two additional special assessments of up to 5 basis points later in 2009 if necessary to maintain public confidence in federal deposit insurance. However, on September 30, 2009, the FDIC filed a notice of proposed rulemaking, which was adopted as a final rule on November 12, 2009 and amended its assessment regulations to require insured institutions to prepay, on December 30, 2009, their estimated quarterly risk-based assessments for the fourth quarter of calendar 2009 and for all of the calendar years 2010, 2011 and 2012. The amount of the prepayment will generally be determined based upon an institution’s assessment rate in effect on September 30, 2009 and will reflect a 5% annualized growth factor applied to the institution’s assessment base as well as an assessment rate increase of three cents per $100 of deposits effective January 1, 2011. Under the rule, the Association’s expected prepayment amount is estimated to be approximately $52 million. In recognition of the industry’s current weakened condition, the prepayment is intended to preclude any additional special assessments during 2009; however, such a prepayment requirement does not necessarily preclude the FDIC from changing assessment rates or from revising the risk-based assessment system, pursuant to the existing notice-and-comment rulemaking framework.
All FDIC-insured institutions are required to pay a pro rata portion of the interest due on obligations issued by the Financing Corporation (“FICO”) for anticipated payments, issuance costs and custodial fees on bonds issued by the FICO in the 1980s to recapitalize the Federal Savings and Loan Insurance Corporation. The bonds
34
Table of Contents
issued by the FICO are due to mature in 2017 through 2019. For the quarter ended September 30, 2009, the annualized FICO assessment was equal to 1.02 cents for each $100 in domestic deposits maintained at an institution. Assessments related to the FICO bond obligations are not subject to the prepayment requirements of the November 12, 2009 rulemaking.
For the fiscal year ended September 30, 2009, the Association paid $905 thousand related to the FICO bonds and $14.0 million pertaining to deposit insurance assessments. Deposit insurance assessments were paid on a delayed basis, one quarter in arrears while FICO bond payments were prepaid, one quarter in advance.
Prohibitions Against Tying Arrangements. Federal savings associations are prohibited, subject to some exceptions, from extending credit to or offering any other service, or fixing or varying the consideration for such extension of credit or service, on the condition that the customer obtain some additional service from the institution or its affiliates or not obtain services of a competitor of the institution.
Federal Home Loan Bank System. The Association is a member of the Federal Home Loan Bank System, which consists of 12 regional Federal Home Loan Banks. The Federal Home Loan Bank System provides a central credit facility primarily for member institutions. As a member of the FHLB of Cincinnati, the Association is required to acquire and hold shares of capital stock in the Federal Home Loan Bank in an amount at least equal to 1% of the aggregate principal amount of its unpaid residential mortgage loans and similar obligations at the beginning of each year, 1/20th of its borrowings from the Federal Home Loan Bank, or 0.3% of assets, whichever is greater.
As of September 30, 2009, outstanding borrowings (including accrued interest) from the FHLB of Cincinnati were $70.2 million and the Association was in compliance with the stock investment requirement.
Please refer to “Proposed Financial Reform Legislation”, which is presented later in this “Item 1, Business”, for a discussion of proposed changes under consideration in connection with current financial reform legislation.
Other Regulations
Interest and other charges collected or contracted for by the Association are subject to state usury laws and federal laws concerning interest rates. The Association’s operations are also subject to federal laws applicable to credit transactions, such as the:
| • | Truth-In-Lending Act, governing disclosures of credit terms to consumer borrowers; |
| • | Home Mortgage Disclosure Act, requiring financial institutions to provide information to enable the public and public officials to determine whether a financial institution is fulfilling its obligation to help meet the housing needs of the community it serves; |
| • | Equal Credit Opportunity Act, prohibiting discrimination on the basis of race, creed or other prohibited factors in extending credit; |
| • | Fair Credit Reporting Act, governing the use and provision of information to credit reporting agencies; |
| • | Fair Debt Collection Act, governing the manner in which consumer debts may be collected by collection agencies; and |
| • | rules and regulations of the various federal agencies charged with the responsibility of implementing such federal laws. |
The operations of the Association also are subject to:
| • | The Right to Financial Privacy Act, which imposes a duty to maintain confidentiality of consumer financial records and prescribes procedures for complying with administrative subpoenas of financial records; |
35
Table of Contents
| • | The Electronic Funds Transfer Act and Regulation E promulgated thereunder, which govern automatic deposits to and withdrawals from deposit accounts and customers’ rights and liabilities arising from the use of automated teller machines and other electronic banking services; |
| • | The Check Clearing for the 21st Century Act (also known as “Check 21”), which gives “substitute checks,” such as digital check images and copies made from those images, the same legal standing as the original paper check; |
| • | Title III of The Uniting and Strengthening America by Providing Appropriate Tools Required to Intercept and Obstruct Terrorism Act of 2001 (referred to as the “USA PATRIOT Act”), which significantly expanded the responsibilities of financial institutions, including savings and loan associations, in preventing the use of the U.S. financial system to fund terrorist activities. Among other provisions, the USA PATRIOT Act and the related regulations of the OTS require savings associations operating in the United States to develop new anti-money laundering compliance programs, due diligence policies and controls to ensure the detection and reporting of money laundering. Such required compliance programs are intended to supplement existing compliance requirements, also applicable to financial institutions, under the Bank Secrecy Act and the Office of Foreign Assets Control Regulations; and |
| • | The Gramm-Leach-Bliley Act, which placed limitations on the sharing of consumer financial information by financial institutions with unaffiliated third parties. Specifically, the Gramm-Leach-Bliley Act requires all financial institutions offering financial products or services to retail customers to provide such customers with the financial institution’s privacy policy and provide such customers the opportunity to “opt out” of the sharing of certain personal financial information with unaffiliated third parties. |
Holding Company Regulation
General. Third Federal Savings, MHC, and the Company are non-diversified savings and loan holding companies within the meaning of the Home Owners’ Loan Act. As such, Third Federal Savings, MHC and the Company are registered with the OTS and subject to OTS regulations, examinations, supervision and reporting requirements. In addition, the OTS has enforcement authority over Third Federal Savings, MHC, the Company and the Association. Among other things, this authority permits the OTS to restrict or prohibit activities that are determined to be a serious risk to the Association. As federal corporations, Third Federal Savings, MHC and the Company are generally not subject to state business organization laws. Please refer to “Proposed Financial Reform Legislation”, which is presented later in this “Item 1. Business”, for a discussion of proposed changes under consideration in connection with current financial reform legislation.
Permitted Activities. Pursuant to Section 10(o) of the Home Owners’ Loan Act and OTS regulations, a mutual holding company, such as Third Federal Savings, MHC, may engage in the following activities:
| (i) | investing in the stock of a savings association; |
| (ii) | acquiring a mutual association through the merger of such association into a savings association subsidiary of such holding company or an interim savings association subsidiary of such holding company; |
| (iii) | merging with or acquiring another holding company, one of whose subsidiaries is a savings association; |
| (iv) | investing in a corporation, the capital stock of which is available for purchase by a savings association under federal law or under the law of any state where the subsidiary savings association has its home offices; |
| (v) | furnishing or performing management services for a savings association subsidiary of such company; |
| (vi) | holding, managing or liquidating assets owned or acquired from a savings association subsidiary of such company; |
36
Table of Contents
| (vii) | holding or managing properties used or occupied by a savings association subsidiary of such company; |
| (viii) | acting as trustee under deeds of trust; |
| (ix) | any other activity: |
| (A) | that the Federal Reserve Board, by regulation, has determined to be permissible for bank holding companies under Section 4(c) of the Bank Holding Company Act of 1956, unless the Director, by regulation, prohibits or limits any such activity for savings and loan holding companies; or |
| (B) | in which multiple savings and loan holding companies were authorized (by regulation) to directly engage on March 5, 1987; |
| (x) | any activity permissible for financial holding companies under Section 4(k) of the Bank Holding Company Act, including securities and insurance underwriting; and |
| (xi) | purchasing, holding, or disposing of stock acquired in connection with a qualified stock issuance if the purchase of such stock by such savings and loan holding company is approved by the Director. If a mutual holding company acquires or merges with another holding company, the holding company acquired or the holding company resulting from such merger or acquisition may only invest in assets and engage in activities listed in (i) through (x) above, and has a period of two years to cease any nonconforming activities and divest any nonconforming investments. |
The Home Owners’ Loan Act prohibits a savings and loan holding company, including the Company, directly or indirectly, or through one or more subsidiaries, from acquiring more than 5% of another savings institution or holding company thereof, without prior written approval of the OTS. It also prohibits the acquisition or retention of, with certain exceptions, more than 5% of a non-subsidiary company engaged in activities other than those permitted by the Home Owners’ Loan Act or acquiring or retaining control of an institution that is not federally insured. In evaluating applications by holding companies to acquire savings institutions, the OTS must consider the financial and managerial resources, future prospects of the company and institution involved, the effect of the acquisition on the risk to the federal deposit insurance fund, the convenience and needs of the community and competitive factors.
The OTS is prohibited from approving any acquisition that would result in a multiple savings and loan holding company controlling savings institutions in more than one state, subject to two exceptions:
| (i) | the approval of interstate supervisory acquisitions by savings and loan holding companies; and |
| (ii) | the acquisition of a savings institution in another state if the laws of the state of the target savings institution specifically permit such acquisition. |
The states vary in the extent to which they permit interstate savings and loan holding company acquisitions.
Waivers of Dividends by Third Federal Savings, MHC. OTS regulations require Third Federal Savings, MHC to notify the OTS of any proposed waiver of its receipt of dividends from the Company. The OTS reviews dividend waiver notices on a case-by-case basis, and, in general, does not object to any such waiver if:
| (i) | the waiver would not be detrimental to the safe and sound operation of the subsidiary savings association; and |
| (ii) | the mutual holding company’s board of directors determines that such waiver is consistent with such directors’ fiduciary duties to the mutual holding company’s members. |
In February 2008 the Company declared its first quarterly dividend and has continued to declare quarterly dividends since then. Pursuant to the OTS’s non-objection, Third Federal Savings, MHC has waived its right to receive each dividend. The OTS’s non-objection, which is generally applicable for one year, was initially issued in November 2007 and has been renewed annually since then. We anticipate that prospectively, on an annual basis, Third Federal Savings, MHC will continue to adhere to the regulatory requirements, including the filing of
37
Table of Contents
a waiver notice and will continue to waive any dividends paid by the Company. Under OTS regulations, our public shareholders would not be diluted because of any dividends waived by Third Federal Savings, MHC (and waived dividends would not be considered in determining an appropriate exchange ratio) in the event Third Federal Savings, MHC converts to stock form. Please refer to section “Proposed Financial Reform Legislation”, which is presented later in this “Item 1, Business”, for a discussion of proposed changes under consideration in connection with current financial reform legislation.
Conversion of Third Federal Savings, MHC to Stock Form. OTS regulations permit Third Federal Savings, MHC to convert from the mutual form of organization to the capital stock form of organization. There can be no assurance when, if ever, a conversion transaction will occur, and Third Federal Savings, MHC’s board of directors has no current intention or plan to undertake a conversion transaction. In a conversion transaction a new stock holding company would be formed as the successor to the Company, Third Federal Savings, MHC’s corporate existence would end, and certain depositors and borrowers (“Members”) of the Association would receive the right to subscribe for additional shares of the new holding company. In a conversion transaction, each share of common stock held by shareholders other than Third Federal Savings, MHC would be automatically converted into a number of shares of common stock of the new holding company determined pursuant to an exchange ratio that ensures that shareholders other than Third Federal Savings, MHC own the same percentage of common stock in the new holding company as they owned in the Company immediately prior to the conversion transaction, subject to adjustment for any assets held by Third Federal Savings, MHC. Any such conversion transaction would require approval by the Members of the Association as well as approval by a majority of the Company’s shareholders, other than Third Federal Savings, MHC. Please refer to “Proposed Financial Reform Legislation”, which is presented later in this “Item 1. Business”, for a discussion of proposed changes under consideration in connection with current financial reform legislation.
Sarbanes-Oxley Act of 2002
The Sarbanes-Oxley Act of 2002 addresses, among other issues, corporate governance, auditing and accounting, executive compensation, and enhanced and timely disclosure of corporate information. As directed by the Sarbanes-Oxley Act, our Chief Executive Officer and Chief Financial Officer are required to certify that our quarterly and annual reports do not contain any untrue statement of a material fact. The rules adopted by the Securities and Exchange Commission under the Sarbanes-Oxley Act have several requirements, including having these officers certify that: they are responsible for establishing, maintaining and regularly evaluating the effectiveness of our internal control over financial reporting; they have made certain disclosures to our auditors and the audit committee of the board of directors about our internal control over financial reporting; and they have included information in our quarterly and annual reports about their evaluation and whether there have been changes in our internal control over financial reporting or in other factors that could materially affect internal control over financial reporting. We have prepared policies, procedures and systems designed to ensure compliance with these regulations.
Emergency Economic Stabilization Act of 2008
In accordance with its stated purpose of restoring liquidity and stability to the financial system of the United States, EESA of 2008 established the Troubled Asset Relief Program (“TARP”), under which the United States Department of the Treasury (“UST”) is authorized to purchase preferred stock from qualified financial institutions. The Company meets the requirements to be considered a qualified financial institution. Under TARP, for organizations like the Company, the federal government’s purchase limitation is generally defined as 3% of risk-weighted assets, or about $225 million for the Company.
We considered several factors in deliberating the appropriateness of applying under UST’s capital purchase plan. These factors included the following: (1) the Company’s initial public offering was completed in April 2007, raising $886 million, further increasing our already high capital ratios, and creating our current business
38
Table of Contents
challenge of prudently deploying excess capital; (2) the announcement during fiscal 2008 of common stock repurchase programs totaling 20.8 million shares, of which repurchases totaling 16.1 million shares at a cost of $192.7 million had been completed as of September 30, 2008; and (3) complications specific to our capital structure as a mutual holding company. In light of these factors, we deemed it not appropriate to apply for funding under the UST’s capital purchase program and accordingly, we neither applied for, nor received, any TARP funding.
Proposed Financial Reform Legislation
In response to the recent and continuing severe financial crisis, the UST prepared a document, released in June 2009 and titled, “FINANCIAL REGULATORY REFORM—A NEW FOUNDATION: Rebuilding Financial Supervision and Regulation”, that proposed a sweeping overhaul of the financial regulatory system. The proposed changes are intended to restore confidence in the integrity of our financial system, and identify the attainment of five key objectives to accomplish this goal. The objectives are to:
| • | promote robust supervision and regulation of financial firms; |
| • | establish comprehensive regulation of financial markets; |
| • | protect consumers and investors from financial abuse; |
| • | provide the government with the tools it needs to manage financial crises; and |
| • | raise international regulatory standards and improve international cooperation. |
Among the numerous recommendations and proposals included in the UST’s document, many have the potential to directly and significantly impact the operations and prospects of the Company, the Association and Third Federal Savings, MHC. The most significant to us include:
| • | Elimination of the federal thrift charter and thereby potentially eliminating the mutual holding company structure (including the dividend waiver provision) so as to close a perceived loophole in bank regulation; |
| • | Elimination of the OTS as a separate Federal regulator by rolling it into a new federal agency, the National Bank Supervisor; and |
| • | Establishment of a new agency dedicated solely and specifically to consumer financial protection, including authority over the design and structure of financial products offered to the public. |
Following release of the UST’s proposal, legislation in various forms, has been introduced in bills currently under consideration in committees of both Houses of Congress. These draft bills are expected to undergo intense scrutiny, negotiation and debate, and the form of the bills that may emerge from the congressional committees assuredly remains uncertain. Further, once the bills emerge from committee they will then be subject to amendment, revision and/or change on the floors of the House and Senate as well as in any joint session and finally to approval by the President. Accordingly, inasmuch as the final form of regulation that may ultimately result, if any, is currently unknown, the impact that such regulation may have on the Company, the Association and Third Federal Savings, MHC is also unknown.
39
Table of Contents
| Item 1A. | Risk Factors |
Future Changes in Interest Rates Could Reduce Our Net Income.
Our net income largely depends on our net interest income, which could be negatively affected by changes in interest rates. Net interest income is the difference between the interest income we earn on our interest-earning assets, such as loans and securities, and the interest we pay on our interest-bearing liabilities, such as deposits and borrowings.
The vast majority of our assets and liabilities are financial in nature, and as a result, changes in market and competitive interest rates can impact our customers’ actions as well as the types and amount of business opportunities that are available to us. In general, when changes occur in interest rates that prompt our customers to pursue strategies that are beneficial to them, the results are generally unfavorable for us.
For example, if mortgage interest rates decline, our customers may seek to refinance, without penalty, their mortgage loans with us or repay their mortgage loans with us and go to another lender. When that happens, either the yield that we earn on the customer’s loan is reduced (if the customer refinances with us) or the mortgage is paid off and we are faced with the challenge of reinvesting the cash received to repay the mortgage in a lower interest rate environment. This is frequently referred to as reinvestment risk, which is the risk that we may not be able to reinvest the proceeds of loan prepayments at rates that are comparable to the rates we earned on the loans prior to receipt of the repayment. This risk exists in our mortgage loan portfolio as well as in the securities in our investment portfolio that are backed by mortgage loans.
Another example of changes in interest rates that can have an unfavorable impact on our net interest income occurs in situations where interest rates paid on certificates of deposit experience a significant increase. In this circumstance, a certificate of deposit customer may determine that it is in his/her best interest to incur the existing penalty for early withdrawal, tender the certificate for cash and either reinvest the proceeds in a new certificate of deposit with us, or withdraw the funds and leave us. As a result, we either end up with a new, higher rate certificate (if the customer stays with us) or we must fund the customer’s withdrawal by: (1) reducing our cash reserves; (2) selling assets to generate cash to fund the withdrawal; (3) attracting deposits from another customer at the then higher interest rate; or (4) borrowing from a wholesale lender like the FHLB of Cincinnati, again at the then-higher interest rate. Each of these alternatives can have an unfavorable impact on us.
Our net interest income can also be negatively impacted when assets and funding sources with seemingly similar repricing characteristics react differently to changing interest rates. An example of this phenomenon is our equity lines of credit loans and our high yield checking and high yield savings deposit products. Interest rates charged on our equity lines of credit loans are linked to the prime rate of interest which generally adjusts in a direct relationship to changes in the Federal Reserve’s Federal Funds target rate. Similarly, our High Yield Checking and High Yield Savings deposit products are generally expected to adjust when changes are made to the Federal Funds target rate. However, to the extent that reductions are made to the Federal Funds target rate, and those reductions translate into reductions of the prime rate and the rate charged on our equity lines of credit loans, but do not extend to equivalent adjustments to our High Yield Checking and High Yield Savings deposit products, we will experience a reduction in our net interest income. At September 30, 2009, we held $2.81 billion of equity lines of credit loans and $1.99 billion of High Yield Checking and High Yield Savings deposits.
Our net income can be reduced by the impact that changes in interest rates can have on the value of our capitalized mortgage servicing rights. As of September 30, 2009, we were servicing $7.50 billion of loans sold to third parties, and the mortgage servicing rights associated with such loans had an amortized cost of $41.4 million and an estimated fair value, at that date, of $56.2 million. Because the estimated life and estimated income from the underlying mortgage loans generally increase with rising interest rates and decrease with falling interest rates, the value of mortgage servicing rights increases as interest rates rise and decreases as interest rates fall.
40
Table of Contents
In general, changes in market and competitive interest rates result from events that we do not control and over which we generally have little or no influence. As a result, mitigation of the risk of the adverse affects of changing interest rates is generally limited to controlling the composition of the assets and liabilities that we hold. To monitor our positions, we maintain an interest rate risk modeling system which is designed to measure our interest rate risk sensitivity. Additionally, the results of a model to measure interest rate sensitivity are made available to us by the OTS. These models estimate the change in the Association’s net portfolio value over a range of interest rate scenarios. Net portfolio value is the discounted present value of expected cash flows from assets, liabilities and off-balance sheet contracts. At September 30, 2009, in the event of an immediate 200 basis point increase in all interest rates, the OTS model projects that we would experience a $75.2 million, or 5%, decrease in net portfolio value, and our internal model projects that we would experience a $210.5 million, or 14%, decrease in net portfolio value. Our internal calculations further project that, at September 30, 2009, in the event of an immediate 200 basis point increase in all interest rates, we would expect our projected net interest income for the twelve months ended September 30, 2010 to decrease by 7%. See “Item 7A. Quantitative and Qualitative Disclosures about Market Risk.”
Negative Developments in the Financial Industry and the Domestic and International Credit Markets May Adversely Affect Our Operations and Results.
Since the latter half of 2007, negative developments in the global credit and securitization markets have resulted in uncertainty in the financial markets and a general economic downturn which has continued into 2009. Loan portfolio quality has deteriorated at many institutions. In addition, the value of real estate collateral supporting many home mortgages has declined and may continue to decline. Bank and bank holding company stock prices have been negatively affected, as has the ability of banks and bank holding companies to raise capital or borrow in the debt markets. As a result, the potential exists for new federal or state laws and regulations regarding lending and funding practices and liquidity standards, and bank regulatory agencies are expected to continue to be active in responding to concerns and trends identified in examinations. Negative developments in the financial industry and the domestic and international credit markets, and the impact of new legislation in response to those developments, may negatively impact our operations by restricting our business operations, including our ability to originate or sell loans, and adversely impact our financial performance. In addition, these risks could affect the value of our loan portfolio as well as the value of our investment portfolio, which would also negatively affect our financial performance.
Difficult Market Conditions Have Already Affected Us and Our Industry and May Continue to Do So.
Our performance is significantly impacted by the general economic conditions in the States of Ohio and Florida, and surrounding areas, which have been severely impacted by the current downturn. The continuation of difficult market conditions is likely to result in increased unemployment, which will further weaken an already distressed local economy and could result in additional defaults of mortgage loans. Most of the loans in our loan portfolio are secured by real estate located in our primary market areas. Negative conditions, such as layoffs, in the markets where collateral for a mortgage loan is located could adversely affect a borrower’s ability to repay the loan and the value of the collateral securing the loan. Declines in the U.S. housing market manifested by falling home prices and increasing foreclosures, as well as unemployment and under-employment, have all negatively impacted the credit performance of mortgage loans and resulted in significant write-downs of asset values by financial institutions. These write-downs, initially of mortgage-backed securities but spreading to derivative and cash securities, in turn, have caused many financial institutions to seek additional capital from private and government entities, to merge with larger and stronger financial institutions and, in some cases, fail. Our business, financial condition and results of operations could be adversely affected by recessionary conditions that are longer or deeper than expected.
Reflecting concern about the stability of the financial markets generally, many lenders and institutional investors have reduced or ceased providing funding to borrowers, including other financial institutions. This market turmoil and tightening of credit have led to an increased level of commercial and consumer delinquencies, lack of consumer confidence, increased market volatility and widespread reduction of business
41
Table of Contents
activity generally. The resulting economic pressure on consumers and lack of confidence in the financial markets may adversely affect our business, financial condition and results of operations. We do not expect that the difficult conditions in the financial markets are likely to improve in the near future. A worsening of these conditions would likely exacerbate the adverse effects of these difficult market conditions on us and others in the financial institutions industry. In particular, we may face the following risks in connection with these events:
| • | We expect to face increased regulation of our industry and compliance with such regulation may increase our costs and limit our ability to pursue business opportunities. |
| • | Our ability to assess the creditworthiness of our customers may be impaired if the models and approaches we use to select, manage, and underwrite our customers become less predictive of future behaviors. |
| • | The processes we use to estimate losses inherent in our credit exposure require difficult, subjective, and complex judgments, including forecasts of economic conditions and how these economic predictions might impair the ability of our borrowers to repay their loans, which may no longer be capable of accurate estimation and which may, in turn, impact the reliability of the processes. |
| • | Our ability to engage in sales of mortgage loans to third parties (including mortgage loan securitization transactions with governmental entities) on favorable terms or at all could be adversely affected by further disruptions in the capital markets or other events, including deteriorating investor expectations. |
| • | Competition in our industry could intensify as a result of increasing consolidation of financial services companies in connection with current market conditions. |
A Legislative Proposal Has Been Introduced That Would Eliminate our Primary Federal Regulator, Require the Association to Convert to a National Bank or State Bank, and Require Third Federal, MHC and the Holding Company to Become Bank Holding Companies.
The U.S. Treasury Department recently released a legislative proposal that would implement sweeping changes to the current bank regulatory structure. The proposal would create a new federal banking regulator, the National Bank Supervisor, and merge our current primary federal regulator, the OTS, as well as the Office of the Comptroller of the Currency (the primary federal regulator for national banks) into this new federal bank regulator. The proposal would also eliminate federal savings associations and require all federal savings associations, such as the Association, to elect, within six months of the effective date of the legislation, to convert to either a national bank, state bank or state savings association. A federal savings association that does not make the election would, by operation of law, be converted into a national bank within one year of the effective date of the legislation.
If the Association is required to convert to a national bank, Third Federal Savings, MHC and the Company would become bank holding companies subject to supervision by the Board of Governors of the Federal Reserve System (the “Federal Reserve”) as opposed to the OTS. The Federal Reserve has historically looked to OTS regulations in its regulation of mutual holding companies and processing of mutual holding company applications; however, it is not obligated to follow such regulations. One important OTS regulation that the Federal Reserve does not follow relates to the ability of mutual holding companies to waive the receipt of dividends declared on the common stock of their stock holding company or savings bank subsidiaries. While OTS regulations permit mutual holding companies to waive the receipt of dividends, subject to filing a notice with the OTS and receiving its non-objection, the Federal Reserve’s current policy is to prohibit mutual holding companies from waiving the receipt of dividends so long as the subsidiary savings bank is well capitalized. Moreover, OTS regulations provide that it will not take into account the amount of waived dividends in determining an appropriate exchange ratio for minority shares in the event of the conversion of a mutual holding company to stock form. If the OTS is eliminated, the Federal Reserve becomes the exclusive regulator of mutual holding companies, and the Federal Reserve retains its current policy regarding dividend waivers by mutual holding companies, Third Federal Savings, MHC would not be permitted to waive the receipt of dividends declared by the Company. This would have an adverse impact on our ability to pay dividends and, consequently, the value of our common stock.
42
Table of Contents
Loans Originated Through Our Home Today Program Have Higher Delinquency Rates than the Remainder of Our Loan Portfolio.
Prior to March 27, 2009, we offered loans through our Home Today program with our standard terms to borrowers who might not otherwise qualify for such loans. To qualify for our Home Today program, a borrower must complete financial management education and counseling and must be referred to us by a sponsoring organization with which we have partnered as part of the program and must meet a minimum credit score threshold. Because we applied less stringent underwriting and credit standards to these loans, loans originated under the Home Today program prior to March 27, 2009 have greater credit risk than traditional residential real estate mortgage loans. As of September 30, 2009, we had $291.7 million of outstanding loans that were originated through our Home Today program, 37.9% of which were delinquent 30 days or more, compared to 2.2% for our portfolio of non-Home Today loans as of that date. During the fiscal year ended September 30, 2009, we incurred net charge-offs of $4.0 million, (1.35% of the average balance of Home Today loans) on loans originated through our Home Today program, compared to $6.7 million, (0.11% of the average balance of non-Home Today loans) of net charge-offs for our non-Home Today portfolio. Effective March 27, 2009, the Home Today underwriting guidelines are substantially the same as our traditional mortgage product.
Any Future Increases in FDIC Insurance Premiums or FDIC Special Assessments Will Adversely Impact Our Earnings.
On May 22, 2009, the FDIC adopted a final rule levying a five basis point special assessment on each insured depository institution’s assets minus Tier 1 capital as of June 30, 2009. The special assessment was paid on September 30, 2009. We recorded an expense of $4.8 million during the quarter ended June 30, 2009, to reflect the special assessment. While the final rule permits the FDIC’s Board of Directors to levy up to two additional special assessments of up to five basis points each during 2009 if the FDIC estimates that the Deposit Insurance Fund reserve ratio will fall to a level that the FDIC’s Board of Directors believes would adversely affect public confidence or to a level that will be close to or below zero, such additional special assessments are not currently considered likely. This is because, on September 30, 2009, the FDIC published a notice of proposed rulemaking which was adopted as a final rule on November 12, 2009 imposing a prepayment of deposit insurance assessments that institutions would otherwise be expected to pay for calendar years 2010 through 2012. Included with this prepayment requirement is a 3 basis point increase in the assessment rate for calendar years 2011 and 2012. The FDIC has indicated that with the proceeds of the prepayment, additional special assessments will not be necessary in 2009, however, the prepayment requirement does not necessarily preclude the FDIC from imposing a special assessment, from changing assessment rates or from revising the risk-based assessment system, pursuant to the existing notice-and-comment rulemaking framework. Should the FDIC find it necessary to impose any further special assessments or further increase assessment rates, our FDIC general insurance premium expense will increase substantially compared to prior periods.
Hurricanes or Other Adverse Weather Events Could Negatively Affect the Economy in Our Florida Market Area or Cause Disruptions to Our Branch Office Locations, Which Could Have an Adverse Effect on Our Business or Results of Operations.
A significant portion of our operations are conducted in the State of Florida, a geographic region with coastal areas that are susceptible to hurricanes and tropical storms. Such weather events can disrupt our operations, result in damage to our branch office locations and negatively affect the local economy in which we operate. We cannot predict whether or to what extent damage caused by future hurricanes or tropical storms will affect our operations or the economy in our market area, but such weather events could result in fewer loan originations and greater delinquencies, foreclosures or loan losses. These and other negative effects of future hurricanes or tropical storms may adversely affect our business or results of operations.
43
Table of Contents
Strong Competition Within Our Market Areas May Limit Our Growth and Profitability.
Competition in the banking and financial services industry is intense. In our market areas, we compete with commercial banks, savings institutions, mortgage brokerage firms, credit unions, finance companies, mutual funds, money market funds, insurance companies, and brokerage and investment banking firms operating locally and elsewhere. Some of our competitors have greater name recognition and market presence that benefit them in attracting business, and offer certain services that we do not or cannot provide. In addition, larger competitors may be able to price loans and deposits more aggressively than we do. Troubled financials institutions may significantly increase the interest rates paid to depositors in pursuit of retail deposits when wholesale funding sources are not available to them. Our profitability depends upon our continued ability to successfully compete in our market areas. For additional information see “Business—Third Federal Savings and Loan Association of Cleveland—Competition.”
| Item 1B. | Unresolved Staff Comments |
None.
| Item 2. | Properties |
We operate from our main office in Cleveland, Ohio, our 39 branch offices located in Ohio and Florida and our eight loan production offices located in Ohio. Our branch offices are located in the Ohio counties of Cuyahoga, Lake, Lorain, Medina and Summit and in the Florida counties of Broward, Collier, Hillsborough, Lee, Palm Beach, Pasco, Pinellas and Sarasota. Our loan production offices are located in the Ohio counties of Franklin, Butler and Hamilton. The Company owns the building in which its home office and executive offices are located, and four other office locations. The net book value of our land, premises, equipment and software was $65.1 million at September 30, 2009. Included in the net book value are two commercial buildings located in Canton, Massachusetts, valued at $17.8 million, which are owned by our Hazelmere entity and leased to third parties in net lease transactions.
| Item 3. | Legal Proceedings |
On June 13, 2006, Dr. Gary Greenspan filed a putative class action lawsuit against Third Federal, captioned Gary A. Greenspan v. Third Federal Savings & Loan, Case No. CV 06 593882 in the Cuyahoga County, Ohio Court of Common Pleas. The plaintiff sought to represent a class of Ohio residents in connection with mortgage loans that the Company provided to the plaintiff and the putative class members. The plaintiff alleges that the Company impermissibly charged a “document preparation fee” that included the cost of preparing legal documents in connection with the mortgages. The plaintiff alleges that the Company should disgorge the document preparation fee because the document preparation constituted the practice of law and was performed by Company employees who are not licensed to practice law in Ohio. The plaintiff sought to certify a class of individuals who were charged such a fee “anytime after June 13, 2001.” The Company vigorously disputes these allegations.
The Company answered the plaintiff’s complaint and moved for judgment on the pleadings. The trial court granted the Company’s motion and dismissed the action. The plaintiff appealed to the Eighth District Court of Appeals. On June 25, 2008, the appellate court reversed the trial court’s dismissal of the plaintiff’s complaint as to claims arising before September 15, 2004, the date that the relevant statute was amended to expressly give the Ohio Supreme Court exclusive jurisdiction over claims for the unauthorized practice of law.
On August 8, 2008, the Company appealed the decision of the Eighth District Court of Appeals to the Supreme Court of Ohio which then accepted the appeal on December 3, 2008. The record was then filed with the Ohio Supreme Court on January 2, 2009. The Company filed its Appellant Brief in February 2009 and the Appellee filed its Brief in April 2009. Oral argument was held on June 2, 2009.
44
Table of Contents
On July 23, 2009, the Ohio Supreme Court reversed the appellate court’s decision and reinstated the trial court’s order granting the Company’s Motion for Judgment on the Pleadings which held that the Plaintiff, Greenspan, has no private right of action. The favorable decision to the Company on this matter is final.
| Item 4. | Submission of Matters to a Vote of Security Holders |
No matters were submitted to a vote of our security holders during the fourth quarter of our fiscal year.
45
Table of Contents
PART II
| Item 5. | Market for Registrant’s Common Equity, Related Stockholder Matters and Issuer Purchases of Equity Securities |
(a) Our common stock is listed and traded on the NASDAQ Global Select Market under the symbol “TFSL”. As of November 23, 2009, we had 10,159 shareholders of record, which number does not include persons or entities holding shares in “nominee” or “street” name through brokerage firms. Shares of our common stock began trading on April 23, 2007 following the completion of our initial public offering. Quarterly trading information for the periods indicated are provided by NASDAQ and included in the following table.
| Traded Market Prices | |||||||||
| High | Low | Dividends | |||||||
| Quarter ended December 31, 2007 |
$ | 13.20 | $ | 11.58 | $ | 0.00 | |||
| Quarter ended March 31, 2008 |
12.75 | 10.43 | 0.05 | ||||||
| Quarter ended June 30, 2008 |
12.59 | 10.48 | 0.05 | ||||||
| Quarter ended September 30, 2008 |
13.50 | 9.39 | 0.05 | ||||||
| Quarter ended December 31, 2008 |
13.59 | 12.02 | 0.05 | ||||||
| Quarter ended March 31, 2009 |
13.09 | 11.13 | 0.07 | ||||||
| Quarter ended June 30, 2009 |
12.50 | 10.62 | 0.07 | ||||||
| Quarter ended September 30, 2009 |
11.99 | 10.31 | 0.07 | ||||||
Payment of dividends is subject to declaration by our board of directors and is dependent on a number of factors, including:
| • | our capital requirements and, to the extent that funds for any such dividend are provided by the Association, the regulatory capital requirements imposed by the Office of Thrift Supervision; |
| • | our financial position and results of operations; |
| • | tax considerations; |
| • | statutory and regulatory limitations; and |
| • | general economic conditions. |
No assurances can be given that the Company will continue to pay dividends, nor can assurances be given that, if paid, such dividends will not be reduced or eliminated in the future. Special cash dividends, stock dividends or returns of capital, to the extent permitted by Office of Thrift Supervision policy and regulations, may be paid in addition to, or in lieu of, regular cash dividends, but no assurances can be given that such dividends will be paid.
Pursuant to Office of Thrift Supervision regulations, any payment of dividends by the Association to the Company that would be deemed to be drawn from the Association’s bad debt reserves would require a payment of taxes at the then-current tax rate by the Association on the amount of earnings deemed to be removed from the reserves for such distribution. The Association does not intend to make any distribution to the Company that would create such a federal tax liability.
Additionally, pursuant to Office of Thrift Supervision regulations, during the three-year period following our initial public stock offering, we may not take any action to declare an extraordinary dividend to shareholders that would be treated by recipients as a tax-free return of capital for federal income tax purposes.
Through September 30, 2009, Third Federal Savings, MHC, has waived its right to receive dividends. The waivers comply with regulatory authorizations (in the form of non-objection) obtained by Third Federal Savings, MHC. Such regulatory non-objection is subject to periodic regulatory review and no assurances can be given regarding future regulatory non-objection.
46
Table of Contents
In the table and graph that follow, we have provided summary information regarding the performance of the cumulative total return of our common stock from our first trading date (April 23, 2007) through September 30, 2009, relative to the cumulative total return on stocks included in the (a) SNL Bank and Thrift Index; (b) SNL Thrift Index and (3) S&P 500 in each case for the same period. The cumulative return data are presented in dollars, based on starting investments of $100 and assuming the reinvestment of dividends.
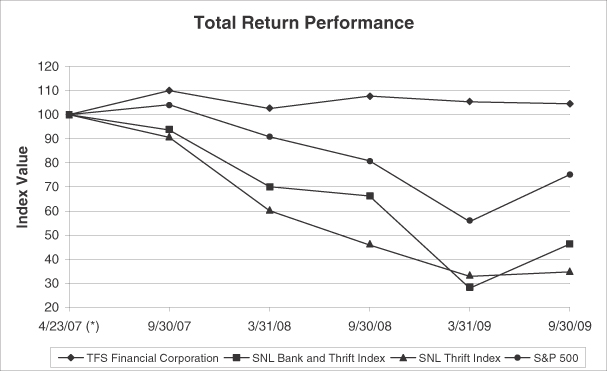
| Measurement Date | ||||||||||||
| Index (with base price at 4/23/2007) |
4/23/2007(*) | 9/30/07 | 3/31/08 | 9/30/08 | 3/31/09 | 9/30/09 | ||||||
| TFS Financial Corporation |
100.00 | 109.75 | 102.44 | 107.51 | 105.14 | 104.39 | ||||||
| SNL Bank and Thrift Index |
100.00 | 93.70 | 70.52 | 66.75 | 29.16 | 47.19 | ||||||
| SNL Thrift Index |
100.00 | 90.71 | 60.73 | 46.72 | 33.96 | 35.78 | ||||||
| S&P 500 |
100.00 | 103.96 | 91.01 | 81.11 | 56.34 | 75.51 | ||||||
| (a) | We did not sell any unregistered securities during the fiscal year ended September 30, 2009. |
| (b) | Not applicable |
| (c) | The following table summarizes our stock repurchase activity during the three months ended September 30, 2009 and the stock repurchase plans approved by our Board of Directors. |
47
Table of Contents
| Period |
Total Number of Shares Purchased(1) |
Average Price Paid per Share |
Total Number of Shares Purchased as Part of Publicly Announced Plans |
Maximum Number of Shares that May Yet Be Purchased Under the Plans | |||||
| July 1, 2009 through July 31, 2009 |
436,500 | $ | 10.75 | 436,500 | 2,452,650 | ||||
| August 1, 2009 through August 31, 2009 |
69,000 | 11.43 | 69,000 | 2,383,650 | |||||
| September 1, 2009 through September 30, 2009 |
66,000 | 11.23 | 66,000 | 2,317,650 | |||||
| Total |
571,500 | $ | 10.89 | 571,500 | |||||
On March 12, 2009, the Company announced its fourth stock repurchase program, which authorizes the repurchase of up to an additional 3,300,000 shares of the Company’s outstanding common stock. Purchases under the program will be subject to the availability of stock, general market conditions, the trading price of the stock, alternative uses of capital, and our financial performance. Repurchased shares will be held as treasury stock and be available for general corporate use. The program has 2,317,650 shares yet to be purchased as of September 30, 2009.
48
Table of Contents
| Item 6. | Selected Financial Data |
| At September 30, | ||||||||||||||||
| 2009 | 2008 | 2007 | 2006 | 2005 | ||||||||||||
| (in thousands, except per share amounts) | ||||||||||||||||
| Selected Financial Condition Data: |
||||||||||||||||
| Total assets |
$ | 10,598,840 | $ | 10,786,451 | $ | 10,278,029 | $ | 8,595,567 | $ | 8,913,820 | ||||||
| Cash and cash equivalents |
307,046 | 132,379 | 829,715 | 252,927 | 120,320 | |||||||||||
| Investment securities: |
||||||||||||||||
| Available for sale |
23,434 | 31,102 | 56,681 | 63,655 | 94,498 | |||||||||||
| Held to maturity |
578,331 | 817,750 | 823,815 | 67,319 | 93,314 | |||||||||||
| Loans held for sale |
61,170 | 200,670 | 107,962 | 314,956 | 542,480 | |||||||||||
| Loans, net |
9,219,585 | 9,208,736 | 8,073,707 | 7,477,041 | 7,620,721 | |||||||||||
| Bank owned life insurance |
157,864 | 151,294 | 144,498 | 139,260 | 133,650 | |||||||||||
| Prepaid expenses and other assets |
53,183 | 38,783 | 38,420 | 35,962 | 77,602 | |||||||||||
| Deposits |
8,570,506 | 8,261,101 | 8,141,215 | 7,401,077 | 7,054,248 | |||||||||||
| Borrowed funds |
70,158 | 498,028 | — | 25,103 | 717,378 | |||||||||||
| Shareholders’ equity |
1,745,865 | 1,843,652 | 1,986,201 | 1,012,594 | 973,874 | |||||||||||
| Cash dividends declared per share |
$ | 0.26 | $ | 0.15 | $ | — | $ | — | $ | — | ||||||
| For the Years Ended September 30, | ||||||||||||||||
| 2009 | 2008 | 2007 | 2006 | 2005 | ||||||||||||
| (in thousands, except per share amounts) | ||||||||||||||||
| Selected Data: |
||||||||||||||||
| Interest income |
$ | 487,222 | $ | 550,183 | $ | 537,725 | $ | 485,804 | $ | 418,757 | ||||||
| Interest expense |
257,147 | 330,321 | 344,523 | 289,137 | 227,620 | |||||||||||
| Net interest income |
230,075 | 219,862 | 193,202 | 196,667 | 191,137 | |||||||||||
| Provision for loan losses |
115,000 | 34,500 | 9,600 | 6,050 | 6,000 | |||||||||||
| Net interest income after provision for loan losses |
115,075 | 185,362 | 183,602 | 190,617 | 185,137 | |||||||||||
| Non-interest income (loss)(1) |
67,384 | 47,780 | 51,389 | (6,393 | ) | 35,081 | ||||||||||
| Non-interest expenses(2) |
162,388 | 151,447 | 191,109 | 122,515 | 123,208 | |||||||||||
| Earnings before income tax expense |
20,071 | 81,695 | 43,882 | 61,709 | 97,010 | |||||||||||
| Income tax expense |
5,676 | 27,205 | 18,271 | 18,170 | 32,502 | |||||||||||
| Net earnings |
$ | 14,395 | $ | 54,490 | $ | 25,611 | $ | 43,539 | $ | 64,508 | ||||||
| Earnings per share—basic and diluted |
$ | 0.05 | $ | 0.17 | $ | 0.10 | $ | 0.19 | $ | 0.28 | ||||||
| (1) | Non-interest income in fiscal 2006 includes $47.1 million of losses on sales of loans incurred principally to improve our interest rate risk profile. |
| (2) | Non-interest expenses in fiscal 2007 include our $55 million charitable contribution to the Third Federal Foundation. |
49
Table of Contents
| At September 30, | |||||||||||||||
| 2009 | 2008 | 2007 | 2006 | 2005 | |||||||||||
| Selected Financial Ratios and Other Data: |
|||||||||||||||
| Performance Ratios: |
|||||||||||||||
| Return on average assets |
0.13 | % | 0.52 | % | 0.27 | % | 0.50 | % | 0.77 | % | |||||
| Return on average equity |
0.80 | % | 2.74 | % | 1.76 | % | 4.34 | % | 6.83 | % | |||||
| Interest rate spread(1) |
1.70 | % | 1.45 | % | 1.51 | % | 2.01 | % | 2.09 | % | |||||
| Net interest margin(2) |
2.20 | % | 2.18 | % | 2.13 | % | 2.37 | % | 2.38 | % | |||||
| Efficiency ratio(3) |
54.59 | % | 56.59 | % | 78.13 | % | 64.39 | % | 54.46 | % | |||||
| Noninterest expense to average total assets |
1.51 | % | 1.45 | % | 2.03 | % | 1.41 | % | 1.47 | % | |||||
| Average interest-earning assets to average interest-bearing liabilities |
120.57 | % | 122.38 | % | 116.47 | % | 110.12 | % | 110.23 | % | |||||
| Dividend payout ratio(4) |
520.00 | % | 88.24 | % | — | — | — | ||||||||
| Asset Quality Ratios: |
|||||||||||||||
| Non-performing assets as a percent of total assets |
2.58 | % | 1.73 | % | 1.20 | % | 1.01 | % | 0.76 | % | |||||
| Non-performing loans as a percent of total loans |
2.73 | % | 1.86 | % | 1.39 | % | 1.05 | % | 0.78 | % | |||||
| Allowance for loan losses as a percent of non-performing loans |
37.24 | % | 25.33 | % | 22.12 | % | 25.98 | % | 30.42 | % | |||||
| Allowance for loan losses as a percent of total loans |
1.02 | % | 0.47 | % | 0.31 | % | 0.27 | % | 0.24 | % | |||||
| Capital Ratios: |
|||||||||||||||
| Third Federal Savings and Loan |
|||||||||||||||
| Total risk-based capital (to risk weighted assets) |
18.19 | % | 17.55 | % | 20.72 | % | 15.00 | % | 14.61 | % | |||||
| Tier 1 core capital (to adjusted tangible assets) |
12.48 | % | 12.05 | % | 13.09 | % | 10.35 | % | 9.60 | % | |||||
| Tangible capital (to tangible assets) |
12.48 | % | 12.05 | % | 13.09 | % | 10.35 | % | 14.34 | % | |||||
| Tier 1 risk-based capital (to risk weighted assets) |
17.30 | % | 17.27 | % | 20.35 | % | 14.69 | % | 11.26 | % | |||||
| Average equity to average total assets |
16.69 | % | 19.06 | % | 15.51 | % | 11.52 | % | 11.26 | % | |||||
| Other Data: |
|||||||||||||||
| Third Federal Savings and Loan |
|||||||||||||||
| Number of full service offices |
39 | 38 | 37 | 40 | 40 | ||||||||||
| Loan production offices |
8 | 8 | 8 | 8 | 8 | ||||||||||
| (1) | Represents the difference between the weighted-average yield on interest-earning assets and the weighted-average cost of interest-bearing liabilities for the year. |
| (2) | The net interest margin represents net interest income as a percent of average interest-earning assets for the year. |
| (3) | The efficiency ratio represents non-interest expense divided by the sum of net interest income and non-interest income. |
| (4) | Represents dividends paid per share divided by diluted earnings per share. Receipt of dividends on shares owned by Third Federal Savings, MHC has been waived and dividends are not paid on unallocated shares of the ESOP. |
50
Table of Contents
| Item 7. | Management’s Discussion and Analysis of Financial Condition and Results of Operation |
Overview
Our business strategy is to operate as a well-capitalized and profitable financial institution dedicated to providing exceptional personal service to our customers. We cannot assure you that we will successfully implement our business strategy.
Since being organized in 1938, we grew to become, prior to our initial public offering of stock in April 2007, the nation’s largest mutually-owned savings and loan association based on total assets. We credit our success to our continued emphasis on our primary values: “Love, Trust, Respect, and a Commitment to Excellence, along with some Fun.” Our values are reflected in our pricing of loan and deposit products, as well as our Home Today program, as described below. Our values are further reflected in the Broadway Redevelopment Initiative (a long-term revitalization program encompassing the three-mile corridor of the Broadway-Slavic Village neighborhood in Cleveland, Ohio where our main office is located) and the education programs we have established and/or supported. We intend to continue to support our customers.
The financial services industry continues to suffer high volatility and adverse financial conditions. Regionally high unemployment, widespread sub-prime mortgage lending, slumping residential real estate values, illiquid capital and credit markets, and a general lack of confidence in the financial service sector of the economy as a result of recent bank failures present challenges for us.
Management believes that the following matters are those most critical to our success: (1) controlling our interest rate risk exposure; (2) monitoring and limiting our credit risk; (3) maintaining access to adequate liquidity and alternative funding sources; and (4) monitoring and controlling operating expenses.
Controlling Our Interest Rate Risk Exposure. Although followers of today’s economic environment are intensely focused on housing and credit issues, historically our greatest risk has been interest rate risk exposure. When we hold long-term, fixed-rate assets, funded by liabilities with shorter repricing characteristics, we are exposed to the potentially adverse impact of rising interest rates. Generally, and particularly over extended periods of time that encompass full economic cycles, interest rates associated with longer terms have been higher than interest rates associated with shorter terms. This difference has been an important factor in the generation of net interest income for us and is fundamental to our operations. We manage the risk of holding long-term, fixed-rate mortgage assets by moderating the attractiveness of our loan offerings, thereby controlling the level of additions (new originations) to our portfolio, and by periodically selling long-term, fixed-rate mortgage loans in the secondary market to reduce the amount of those assets held in our portfolio. During the fiscal year ended September 30, 2009, we sold $2.22 billion of long-term, fixed-rate mortgage loans compared to $744.7 million and $894.5 million, during the fiscal years ended September 30, 2008 and 2007, respectively. At September 30, 2009, we retained approximately $5.63 billion of long-term, fixed-rate mortgage loans in our mortgage loans held for investment portfolio. While there is no current evidence to indicate that interest rate increases are imminent, should a rapid and substantial increase occur in general market interest rates, it is probable that prospectively, the level of our net interest income would be adversely impacted. We can also manage interest rate risk with our equity lines of credit which had a net increase of $542 to million during the fiscal year ended 2009. While equity lines of credit help manage interest rate risk there is an incremental credit risk associated with them which is described below.
Monitoring and Limiting Our Credit Risk. While, historically, we had been successful in limiting our credit risk exposure by generally imposing high credit standards with respect to lending, the recent confluence of dramatically unfavorable regional and macro-economic events, coupled with our expanded participation in the second lien mortgage lending markets, has significantly refocused our attention with respect to credit risk. In response to the evolving economic landscape, we have continuously revised and updated our quarterly analysis and evaluation procedures for each category of our lending with the objective of identifying and recognizing all appropriate credit impairments. At September 30, 2009, more than 88 % of our assets consisted of residential real
51
Table of Contents
estate loans and equity loans and lines of credit, the overwhelming majority of which were originated to borrowers in the states of Ohio and Florida. Our analytic procedures and evaluations include specific reviews of all equity lines of credit that become 90 or more days past due as well as specific reviews of all first mortgage loans and equity loans that become 180 or more days past due.
In response to current market conditions, and in an effort to limit our credit risk exposure and improve the credit performance of new customers, we have tightened our credit criteria in evaluating a borrower’s ability to successfully fulfill his or her repayment obligation and we have revised the design of many of our loan products to require higher borrower down-payments, limited the products available for condominiums, and eliminated certain product features (such as interest-only adjustable-rate loans, and loans above certain loan-to-value ratios).
One aspect of our credit risk concern relates to the high percentage of our loans that are secured by residential real estate in the states of Ohio and Florida, particularly in light of the highly publicized difficulties that have arisen with respect to the real estate markets in those states. At September 30, 2009, approximately 76.9% and 21.1% of our residential, non-Home Today and construction loans were secured by properties in Ohio and Florida, respectively. The percentage of those loans delinquent 30 days or more at September 30, 2009 were 2.0% and 3.7%, respectively, compared to 2.35% for the non-Home Today portfolio as a whole. Also, at September 30, 2009, approximately 40.0% and 27.9% of our equity loans and lines of credit were secured by properties in Ohio and Florida, respectively. At September 30, 2009, the percentages of those loans delinquent 30 days or more were 2.4% and 4.0%, respectively, compared to 2.87% for the equity loans and lines of credit portfolio as a whole. While we focus our attention on, and are concerned with respect to the resolution of all loan delinquencies, as these ratios illustrate, our highest concern is centered on loans that are secured by properties in Florida. As described in earlier sections of Item 1. Business (including “Non-performing Assets”, “Delinquent Loans”, “Allowance for Loan Losses” and “Allocation of Allowance for Loan Losses”) and as further described in the “Allowance for Loan Losses” portion of the “Critical Accounting Policies” section that immediately follows this Overview, additional details are provided regarding our loan portfolio composition, delinquency statistics, our methodology in evaluating our loan loss provisions and the adequacy of our allowance for loan losses. Information presented in those sections generally indicates that across our portfolio, delinquency amounts and ratios will continue to increase. As additional job losses are announced and unemployment levels continue to rise, particularly in Ohio and Florida, and as Florida housing values continue to remain depressed due to prior overbuilding and speculation, which has resulted in considerable inventory on the market, we recognize that each of these factors is likely to result in increased delinquencies. These factors are also indicative of additional credit risk, and in response we have continued to provide more loan loss provisions. For the fiscal year ended September 30, 2009 our provision for loan losses was $115.0 million compared to $34.5 million and $9.6 million for the fiscal years ended September 30, 2008 and 2007, respectively. Similarly, our allowance for loan losses has increased from $25.1 million, or 0.31% of loans, at September 30, 2007 to $43.8 million, or 0.47% of loans, at September 30, 2008 and to $95.2 million, or 1.02% of loans, at September 30, 2009.
Our residential Home Today loans are another area of credit risk concern. Although these loans total $291.7 million at September 30, 2009 and comprise only 3.1% of our total loan portfolio balance, they comprise 32.5% of our total delinquencies and 33.1% of our 90 days or greater delinquencies. At September 30, 2009, approximately 95.9% and 3.8% of our residential, Home Today loans were secured by properties in Ohio and Florida, respectively. At September 30, 2009, the percentages of those loans delinquent 30 days or more were 38.3% and 30.2%, respectively. The disparity between the portfolio composition ratio and delinquency ratio reflects the nature of the Home Today loans. Prior to March 27, 2009 these loans were made to customers who, generally because of poor credit scores, would not have otherwise qualified for our loan products. We do not offer, and have not offered, loan products frequently considered to be designed to target sub-prime borrowers containing features such as higher fees or higher rates, interest only or negative amortization, or low initial payment features with adjustable interest rates. Our Home Today loan products, which prior to March 27, 2009 were made to borrowers whose credit profiles might be described as sub-prime, generally contain the same features as loans offered to our non-Home Today borrowers. The overriding objective of our Home Today lending, just as it is with our non-Home Today lending, is to create successful homeowners. We have attempted
52
Table of Contents
to manage our Home Today credit risk by requiring that borrowers attend pre- and post-borrowing financial management education and counseling and that the borrowers be referred to us by a sponsoring organization with which we have partnered. Further, to manage the credit aspect of these loans, inasmuch as the majority of these buyers do not have sufficient funds for downpayments, some loans include private mortgage insurance. At September 30, 2009, 57.1% of Home Today loans include private mortgage insurance coverage. From a peak balance of $308.3 million at December 31, 2007, the total balance of the Home Today portfolio has slowly, but steadily, declined to $291.7 million at September 30, 2009. This trend generally reflects the evolving conditions in the mortgage real estate market and the tightening of standards imposed by issuers of private mortgage insurance. As part of our effort to manage credit risk, effective March 27, 2009, the Home Today underwriting guidelines are substantially the same as our traditional mortgage product. Inasmuch as most potential Home Today customers do not have sufficient funds for downpayments, the lack of available private mortgage insurance restricts our ability to extend credit. Unless and until lending standards and private mortgage insurance requirements loosen, we expect the Home Today portfolio to continue to decline in balance.
Maintaining Access to Adequate Liquidity and Alternative Funding Sources. For most insured depositories, customer and community confidence are critical to their ability to maintain access to adequate liquidity and to conduct business in an orderly fashion. The Company believes that maintaining high levels of capital is one of the most important factors in nurturing customer and community confidence. Accordingly, we have managed the pace of our growth in a manner that reflects our emphasis on high capital levels. At September 30, 2009, the Association’s ratio of core capital to adjusted tangible assets (a basic industry measure under which 5.00% is deemed to represent a “well capitalized” status) was 12.48%. Also, at September 30, 2009, the Company’s ratio of total shareholders’ equity to total assets was 16.47%. We expect to continue to maintain a high capital ratio.
In managing its level of liquidity, the Company monitors available funding sources, which include attracting new deposits, borrowing from others, the conversion of assets to cash and the generation of funds through profitable operations. The Company has traditionally relied on retail deposits as its primary means in meeting its funding needs. At September 30, 2009, deposits totaled $8.57 billion, while borrowings totaled $70.2 million and borrowers’ advances and servicing escrows totaled $48.2 million, combined. In evaluating funding sources, we consider many factors, including cost, duration, current availability, expected sustainability, impact on operations and capital levels.
To attract deposits, we offer our customers attractive rates of return on our deposit products. Our deposit products typically offer rates that are highly competitive with the rates on similar products offered by other financial institutions. We intend to continue this practice.
We preserve the availability of alternative funding sources through various mechanisms. First, by maintaining high capital levels, we retain the flexibility to increase our balance sheet size without jeopardizing our capital adequacy. Effectively, this permits us to increase the rates that we offer on our deposit products thereby attracting more potential customers. Second, we pledge available real estate mortgage loans and investment securities with the Federal Home Bank of Cincinnati (“FHLB”) and the Federal Reserve Bank of Cleveland (“Federal Reserve”). At September 30, 2009, these collateral pledges support arrangements with the FHLB that provide for additional borrowing capacity of up to $1.54 billion (provided an additional investment in FHLB capital stock of up to $30.8 million is made) and up to $399.9 million at the Federal Reserve. Third, we invest in high quality marketable securities that exhibit limited market price variability, and to the extent that they are not needed as collateral for borrowings, can be immediately and efficiently sold in the institutional market and converted to cash. At September 30, 2009 our investment securities portfolio totaled $601.8 million. Fourth, a portion of the residential first mortgage loans that we originate are highly liquid as they can be sold/delivered to Fannie Mae. At September 30, 2009, our mortgage loans held for sale totaled $61.2 million. Finally, cash flows from operating activities have been a regular source of funds. During the fiscal years ended September 30, 2009, 2008 and 2007, cash flows from operations totaled $272.0 million, $29.0 million and $273.4 million, respectively.
Overall, while customer and community confidence can never be assured, the Company believes that our liquidity is adequate and that we have adequate access to alternative funding sources.
53
Table of Contents
Monitoring and Controlling Operating Expenses. We continue to focus on managing operating expenses. Our annualized ratio of non-interest expense to average assets was 1.51% for the fiscal year ending 2009. As of September 30, 2009, our average assets per full-time employee and our average deposits per full-time employee were $10.9 million and $8.8 million, respectively. Based on industry statistics published by the Office of Thrift Supervision, we believe that each of these measures compares favorably with the averages for our peer group. Our average deposits held at our branch offices ($214.3 million per branch office as of September 30, 2009) contribute to our expense management efforts by limiting the overhead costs of serving our deposit customers. We will continue our efforts to control operating expenses as we use a portion of the capital we received in our April 2007 stock offering to grow our business.
Our current focus is in Broward County, Florida, where we opened a full-service branch in Plantation in September 2008 followed by the relocation of the former North Miami branch to Hallandale in January 2009. We recently added two locations in Broward County (Pembroke Pines and Coral Springs), which reduce gaps in our footprint in that market area. We also expect to continue to evaluate the effectiveness of our existing branch structure, particularly in Northeast Ohio, seeking opportunities to simultaneously improve our efficiency and the level of service to our customers. We recently relocated one branch within Cleveland’s western-most suburbs and consolidated two existing branches within Cuyahoga County into one new, larger branch located within a mile or two of the consolidated branches.
While we devote a great deal of our attention to managing our operating expenses, certain costs are largely outside of our control. One expense that has increased dramatically has been our Federal deposit insurance premium and assessments, which increased from $3.7 million during the fiscal year ended September 30, 2008 to $17.1 million during the fiscal year ended September 30, 2009. On May 22, 2009, the FDIC adopted a final rule imposing a five basis point special assessment on each insured depository institution’s assets minus Tier 1 capital as of June 30, 2009. Approximately $4.8 million of the increase reflects this emergency assessment levied as of June 30, 2009 and collected on September 30, 2009. The final rule also permits the Board to impose an additional special assessment of up to 5 basis points later in 2009 if necessary to maintain public confidence in federal deposit insurance. However, on September 30, 2009 the FDIC filed a notice of proposed rulemaking which was adopted as a final rule on November 12, 2009 and amended its assessment regulations to require insured institutions to prepay, on December 30, 2009, their estimated quarterly risk-based assessments for the fourth quarter of calendar 2009 and for all of the calendar years 2010, 2011 and 2012. The amount of the prepayment will generally be determined based upon an institution’s assessment rate in effect on September 30, 2009 and will reflect a 5% annualized growth factor applied to the institution’s assessment base as well as an assessment rate increase of three cents per $100 of deposits effective January 1, 2011. In recognition of the industry’s current weakened condition, the prepayment is intended to preclude any additional special assessments during 2009; however, such a prepayment requirement does not necessarily preclude the FDIC from changing assessment rates or from revising the risk-based assessment system, pursuant to the existing notice-and-comment rulemaking framework.
Critical Accounting Policies
Critical accounting policies are defined as those that involve significant judgments and uncertainties, and could potentially result in materially different results under different assumptions and conditions. We believe that the most critical accounting policies upon which our financial condition and results of operations depend, and which involve the most complex subjective decisions or assessments, are our policies with respect to our allowance for loan losses, mortgage servicing rights, income taxes, pension benefits and stock-based compensation.
Allowance for Loan Losses. The allowance for loan losses is the amount estimated by management as necessary to absorb credit losses incurred in the loan portfolio that are both probable and reasonably estimable at the balance sheet date. The amount of the allowance is based on significant estimates and the ultimate losses may vary from such estimates as more information becomes available or conditions change. The methodology for determining the allowance for loan losses is considered a critical accounting policy by management due to the
54
Table of Contents
high degree of judgment involved, the subjectivity of the assumptions used and the potential for changes in the economic environment that could result in changes to the amount of the recorded allowance for loan losses. At September 30, 2009, the allowance for loan losses was $95.2 million or 1.02% of total loans. An increase or decrease of 10% in the allowance would result in a $9.5 million charge or credit, respectively, to income before income taxes.
As a substantial percentage of our loan portfolio is collateralized by real estate, appraisals of the underlying value of property securing loans are critical in determining the amount of the allowance required for specific loans. Assumptions are instrumental in determining the value of properties. Overly optimistic assumptions or negative changes to assumptions could significantly affect the valuation of a property securing a loan and the related allowance determined. Management carefully reviews the assumptions supporting such appraisals to determine that the resulting values reasonably reflect amounts realizable on the related loans.
Management performs a quarterly evaluation of the adequacy of the allowance for loan losses. We consider a variety of factors in establishing this estimate including, but not limited to, current economic conditions, delinquency statistics, geographic concentrations, the adequacy of the underlying collateral, the financial strength of the borrower, results of internal loan reviews and other relevant factors. This evaluation is inherently subjective as it requires material estimates by management that may be susceptible to significant change based on changes in economic and real estate market conditions.
The evaluation has a specific and general component. The specific component relates to loans that are delinquent or otherwise identified as a problem loan through the application of our loan review process and our loan grading system. All such loans are evaluated individually, with principal consideration given to the value of the collateral securing the loan. Specific allowances are established as required by this analysis. The general component is determined by segregating the remaining loans by type of loan, risk weighting (if applicable) and payment history. We also analyze historical loss experience, delinquency trends, general economic conditions and geographic concentrations. Historic loss factors used in determining an appropriate allowance level have been supplemented in the current fiscal year by a market valuation allowance that addresses more qualitative factors that impact potential losses. The conditions evaluated include a combination of various market conditions, mainly a decrease in home values and an increase in unemployment rates, which have caused higher delinquencies and charge-offs in the loan portfolio, increased foreclosure rates. This analysis establishes factors that are applied to the loan groups to determine the amount of the general component of the allowance for loan losses.
Actual loan losses may be significantly more than the allowances we have established which could have a material negative effect on our financial results.
Mortgage Servicing Rights. Mortgage servicing rights represent the present value of the estimated future servicing fees expected to be received pursuant to the right to service loans in our loan servicing portfolio. Mortgage servicing rights are recognized as assets for both purchased rights and for the allocated value of retained servicing rights on loans sold. The most critical accounting policy associated with mortgage servicing is the methodology used to determine the fair value of capitalized mortgage servicing rights. A number of estimates affect the capitalized value and include: (1) the mortgage loan prepayment speed assumption; (2) the estimated prospective cost expected to be incurred in connection with servicing the mortgage loans; and (3) the discount factor used to compute the present value of the mortgage servicing right. The mortgage loan prepayment speed assumption is significantly affected by interest rates. In general, during periods of falling interest rates, mortgage loans prepay faster and the value of our mortgage servicing assets decreases. Conversely, during periods of rising rates, the value of mortgage servicing rights generally increases due to slower rates of prepayments. The estimated prospective cost expected to be incurred in connection with servicing the mortgage loans is deducted from the retained (gross mortgage loan interest rate less amounts remitted to third parties—investor pass-thru rate, guarantee fee, mortgage insurance fee, etc.) servicing fee to determine the net servicing fee for purposes of capitalization computations. To the extent that prospective actual costs incurred to service the mortgage loans differ from the estimate, our future results will be adversely (or favorably) impacted. The discount factor selected to compute the present value of the servicing right reflects expected market place yield requirements.
55
Table of Contents
The amount and timing of mortgage servicing rights amortization is adjusted monthly based on actual results. In addition, on a quarterly basis, we perform a valuation review of mortgage servicing rights for potential decreases in value. This quarterly valuation review entails applying current assumptions to the portfolio classified by interest rates and, secondarily, by prepayment characteristics. At September 30, 2009, the capitalized value of our right to service $7.50 billion of loans for others was $41.4 million, or 0.55% of the serviced loan portfolio.
Income Taxes. We consider accounting for income taxes a critical accounting policy due to the subjective nature of certain estimates that are involved in the calculation. We use the asset/liability method of accounting for income taxes in which deferred tax assets and liabilities are established for the temporary differences between the financial reporting basis and the tax basis of our assets and liabilities. We must assess the realization of the deferred tax asset and, to the extent that we believe that recovery is not likely, a valuation allowance is established. Adjustments to increase or decrease the valuation allowance are charged or credited, respectively, to income tax expense. During the fiscal year ended September 30, 2009, we increased the required deferred tax valuation allowance with respect to the expected carry forward portion of our $55 million charitable contribution expense incurred in conjunction with the formation of the Third Federal Foundation from $3.2 million to $4.0 million. Although we have determined a valuation allowance is not required for any other deferred tax assets, there is no guarantee that those assets, nor the portion of deferred tax asset associated with the carryforward of our charitable contribution not subject to a valuation allowance, will be recognizable in the future.
Pension Benefits. The determination of our obligations and expense for pension benefits is dependent upon certain assumptions used in calculating such amounts. Key assumptions used in the actuarial valuations include the discount rate, expected long-term rate of return on plan assets and rates of increase in compensation. Actual results could differ from the assumptions and market driven rates may fluctuate. Significant differences in actual experience or significant changes in the assumptions could materially affect future pension obligations and expense.
Stock-based Compensation. We recognize the cost of associate and director services received in exchange for awards of equity instruments based on the grant date fair value of those awards in accordance with FASB ASC 718, “Compensation—Stock Compensation”.
We estimate the per share value of option grants using the Black-Scholes option pricing model using assumptions for expected dividend yield, expected stock price volatility, risk-free interest rate and expected option term. These assumptions are subjective in nature, involve uncertainties, and: therefore, cannot be determined with precision.
The per share value of options is highly sensitive to changes in assumptions. In general, the per share fair value of options will move in the same direction from changes in the expected stock price volatility, risk-free interest rate and expected option term, and in the opposite direction as changes in expected dividend yield. For example, the per share fair value of options will generally increase as expected stock volatility increases, risk-free interest rate increases, expected option term increases and expected dividend yield decreases. The use of different assumptions or different option pricing models could result in materially different per share fair values of options.
Comparison of Financial Condition at September 30, 2009 and 2008
Total assets decreased $187.6 million, or 2%, to $10.60 billion at September 30, 2009 from $10.79 billion at September 30, 2008. The reduction in assets was the result of decreases in the Mortgage loans held for sale portfolio and Investment securities which were offset by an increase in Other interest earning cash equivalents.
Cash and cash equivalents increased $174.7 million, or 132%, to $307.0 million at September 30, 2009 from $132.4 million at September 30, 2008, as we have retained our most liquid assets for subsequent reinvestment in investment securities and/or loan products that provide higher yields along with longer maturities. This increase
56
Table of Contents
is the result of successful deposit gathering programs combined with the cash flows from maturing investment securities and loan sales in the secondary market.
Investment securities held to maturity decreased $239.4 million, or 29%, to $578.3 million at September 30, 2009 from $817.8 million at September 30, 2008. This decrease is a result of cash flows from securities repayments and maturities during the twelve-month period being used to fund the retirement of short term debt and the repurchase of common stock as part of our stock repurchase program. There were $36.8 million in purchases of investment securities in the twelve-month period ended September 30, 2009, which were only partially offset by principal paydowns. There were no sales of investment securities. Paydowns on mortgage-backed securities increased due to the historically low mortgage interest rates and can be expected to continue, although at perhaps a slower pace, as borrowers continue to take advantage of lower rates. Paydowns may, absent an increase in investment securities purchases, result in additional decreases in the balance of investment securities.
Mortgage loans held for sale decreased $139.5 million or 70%, to $61.2 million at September 30, 2009 from $200.7 million at September 30, 2008. This change can be attributed to the volume of loan sales keeping pace (due to favorable market conditions) with the loans originated during the current fiscal year ended September 30, 2009.
Loans held for investment, net, increased $10.8 million, or less than 1%, to $9.22 billion at September 30, 2009 from $9.21 billion at September 30, 2008. Mortgage loans in our investment portfolio increased $58.7 million to $9.32 billion at September 30, 2009 from $9.26 billion at September 30, 2008. The increase in mortgage loans was offset by a $51.5 million increase to $95.2 million from $43.8 million in our allowance for loan losses. The increased allowance reflects the continued increase in the unprecedented level of net charge-offs over the past few quarters and the uncertain economic times that face many of our loan customers. A combination of various market conditions, mainly a decrease in home values and an increase in unemployment rates, have caused higher delinquencies and charge-offs in the loan portfolio. In an effort to manage interest rate risk, we continued to focus on increased equity line of credit originations, which had a net increase of $494.9 million during the current fiscal year. These equity line of credit originations do incrementally affect credit risk because the security received is a second lien. Residential mortgage loans decreased $420.7 million during the current fiscal period, which reflected $2.22 billion in sales during that time period. Through the sales of loans in the secondary market we can improve our interest rate risk position in the event of increases in market interest rates.
Our portfolio of real estate owned increased $3.6 million, or 26%, to $17.7 million at September 30, 2009, from $14.1 million at September 30, 2008. While the balance of real estate owned continues to comprise less than 0.2% of both our $10.60 billion of total assets as well as our $9.22 billion loan portfolio, the increase is nevertheless indicative of the current challenging economic environment and its negative impact on the residential housing market, which has been evidenced by increases in the balances of non-performing loans and loan charge-offs. Foreclosed properties are recorded at the lower of carrying value or fair value with charge-offs, if any, charged to the allowance for loan losses upon transfer to real estate owned. Fair value is monitored quarterly and any subsequent decline in fair value of real estate owned is recorded as a loss and reported in other non-interest expense. If unemployment in Ohio continues to rise in the future we expect the current high level of foreclosures will continue. As a result, it is possible the balance of real estate owned will increase.
Deposits increased $309.4 million, or 4%, to $8.57 billion at September 30, 2009 from $8.26 billion at September 30, 2008. The increase in deposits was primarily the result of a $410.5 million increase in certificates of deposit combined with $36.6 million increase in high-yield savings accounts (a subcategory of our savings accounts), offset by a $138.6 million decrease in our high yield-checking accounts. Other deposit products (other savings accounts and other NOW accounts) saw a net decrease in the current fiscal year. We have focused on promoting the high-yield savings accounts as well as high-yield checking accounts as we believe that these types of deposit products provide a stable source of funds. In addition, our high-yield checking and high-yield savings accounts are expected to reprice in a manner similar to our equity loan products, and; therefore, assist us in managing interest rate risk.
57
Table of Contents
Borrowed funds decreased $427.9 million, or 86%, to $70.2 million at September 30, 2009 from $498.0 at September 30, 2008. The $70.2 million in borrowed funds consists of fixed rate FHLB advances with an average maturity of 3.4 years. Using longer term advances helps reduce the Company’s exposure to interest rate risk. The success of our deposit gathering, use of cash flows from the maturing investments in our securities portfolio, cash flows from the sale of loans in the secondary market and the net cash provided by our operating activities can be attributed to the decrease in borrowed funds.
The $25.0 million increase in principal, interest and related escrows owed on loans serviced, to $105.7 million at September 30, 2009 from $80.7 million at September 30, 2008, is related to the timing of when payments have been collected from borrowers for loans we service for other investors and when those funds are remitted to the investors and to the appropriate taxing agencies. The change can be attributed to an increase of $21.2 million in principal and interest payments as resulting from increased prepayments and a $3.9 million increase in retained tax payments collected from borrowers.
Accrued expenses and other liabilities increased $3.8 million to $58.4 million at September 30, 2009 from $54.6 million at September 30, 2008. This change primarily reflects a $15.9 million increase in the accruals related to our retirement and pension plans along with a $2.3 million increase in a payable to the FDIC as a result of the higher deposit insurance rates and to a lesser extent higher balances. These were offset by decreases in: (1) a $6.6 million payable related to the repurchase of common stock; (2) the in-transit status of $3.6 million of real estate tax payments that have been collected from borrowers and are being remitted to various taxing agencies; and (3) $3.4 million in accrued expenses.
Shareholders’ equity decreased $97.8 million, to $1.75 billion at September 30, 2009 from $1.84 billion at September 30, 2008. This reflects $14.4 million of net income during the current fiscal year reduced by $96.5 million of repurchases of outstanding common stock and $19.7 million in dividends paid on our shares of common stock (other than the shares held by Third Federal Savings, MHC and unallocated ESOP shares) in the current fiscal year. The remainder reflects adjustments related to the allocation of shares of our common stock related to the ESOP and stock compensation plans and adjustments to our accumulated other comprehensive loss attributable primarily to the change in our pension obligation.
58
Table of Contents
Analysis of Net Interest Income
Net interest income represents the difference between income we earn on our interest-earning assets and the expense we pay on interest-bearing liabilities. Net interest income depends on the volume of interest-earning assets and interest-bearing liabilities and the rates earned on such assets and paid on such liabilities.
Average balances and yields. The following table sets forth average balance sheets, average yields and costs, and certain other information at and for the fiscal years indicated. No tax-equivalent yield adjustments were made, as the effect thereof was not material. All average balances for the fiscal years 2009 and 2008 are daily average balances while fiscal year 2007 average balances are monthly average balances. Non-accrual loans were included in the computation of average balances, but have been reflected in the table as loans carrying a zero yield. The yields set forth below include the effect of deferred fees, discounts and premiums that are amortized or accreted to interest income or interest expense.
| For the Fiscal Years Ended September 30, | |||||||||||||||||||||||||||||||||
| 2009 | 2008 | 2007 | |||||||||||||||||||||||||||||||
| Average Balance |
Interest Income/ Expense |
Yield/ Cost |
Average Balance |
Interest Income/ Expense |
Yield/ Cost |
Average Balance |
Interest Income/ Expense |
Yield/ Cost |
|||||||||||||||||||||||||
| (Dollars in thousands) | |||||||||||||||||||||||||||||||||
| Interest-earning assets: |
|||||||||||||||||||||||||||||||||
| Federal funds sold |
$ | 350 | $ | 1 | 0.29 | % | $ | 386,892 | $ | 14,485 | 3.74 | % | $ | 736,711 | $ | 38,352 | 5.21 | % | |||||||||||||||
| Other interest-bearing cash equivalents |
96,026 | 213 | 0.22 | % | 51,606 | 1,797 | 3.48 | % | 20,795 | 1,087 | 5.23 | % | |||||||||||||||||||||
| Investment securities |
17,910 | 465 | 2.60 | % | 37,925 | 1,333 | 3.51 | % | 54,365 | 2,191 | 4.03 | % | |||||||||||||||||||||
| Mortgage-backed securities |
711,756 | 28,926 | 4.06 | % | 883,795 | 43,635 | 4.94 | % | 429,244 | 23,161 | 5.40 | % | |||||||||||||||||||||
| Loans |
9,600,665 | 455,933 | 4.75 | % | 8,706,421 | 486,940 | 5.59 | % | 7,775,810 | 469,755 | 6.04 | % | |||||||||||||||||||||
| Federal Home Loan Bank stock |
35,620 | 1,684 | 4.73 | % | 34,575 | 1,993 | 5.76 | % | 52,334 | 3,179 | 6.07 | % | |||||||||||||||||||||
| Total interest-earning assets |
10,462,327 | 487,222 | 4.66 | % | 10,101,214 | 550,183 | 5.45 | % | 9,069,259 | 537,725 | 5.93 | % | |||||||||||||||||||||
| Noninterest-earning assets |
320,039 | 344,725 | 332,323 | ||||||||||||||||||||||||||||||
| Total assets |
$ | 10,782,366 | $ | 10,445,939 | $ | 9,401,582 | |||||||||||||||||||||||||||
| Interest-bearing liabilities: |
|||||||||||||||||||||||||||||||||
| NOW accounts |
$ | 1,046,640 | 9,145 | 0.87 | % | $ | 1,283,387 | 31,231 | 2.43 | % | $ | 1,621,548 | 66,221 | 4.08 | % | ||||||||||||||||||
| Passbook savings |
1,139,916 | 16,135 | 1.42 | % | 1,261,396 | 37,571 | 2.98 | % | 649,414 | 17,605 | 2.71 | % | |||||||||||||||||||||
| Certificates of deposit |
6,200,984 | 229,211 | 3.70 | % | 5,638,716 | 259,997 | 4.61 | % | 5,495,449 | 259,685 | 4.73 | % | |||||||||||||||||||||
| Borrowed funds |
289,911 | 2,656 | 0.92 | % | 70,218 | 1,522 | 2.17 | % | 20,274 | 1,012 | 4.99 | % | |||||||||||||||||||||
| Total interest-bearing liabilities |
8,677,451 | 257,147 | 2.96 | % | 8,253,717 | 330,321 | 4.00 | % | 7,786,685 | 344,523 | 4.42 | % | |||||||||||||||||||||
| Noninterest-bearing liabilities |
305,878 | 201,287 | 156,930 | ||||||||||||||||||||||||||||||
| Total liabilities |
8,983,329 | 8,455,004 | 7,943,615 | ||||||||||||||||||||||||||||||
| Shareholders’ equity |
1,799,037 | 1,990,935 | 1,457,967 | ||||||||||||||||||||||||||||||
| Total liabilities and shareholders’ equity |
$ | 10,782,366 | $ | 10,445,939 | $ | 9,401,582 | |||||||||||||||||||||||||||
| Net interest income |
$ | 230,075 | $ | 219,862 | $ | 193,202 | |||||||||||||||||||||||||||
| Interest rate spread(1) |
1.70 | % | 1.45 | % | 1.51 | % | |||||||||||||||||||||||||||
| Net interest-earning assets(2) |
$ | 1,784,876 | $ | 1,847,497 | $ | 1,282,574 | |||||||||||||||||||||||||||
| Net interest margin(3) |
2.20 | % | 2.18 | % | 2.13 | % | |||||||||||||||||||||||||||
| Average interest-earning assets to average interest-bearing liabilities |
120.57 | % | 122.38 | % | 116.47 | % | |||||||||||||||||||||||||||
| (1) | Interest rate spread represents the difference between the yield on average interest-earning assets and the cost of average interest-bearing liabilities. |
| (2) | Net interest-earning assets represent total interest-earning assets less total interest-bearing liabilities. |
| (3) | Net interest margin represents net interest income divided by total interest-earning assets. |
59
Table of Contents
Rate/Volume Analysis. The following table presents the effects of changing rates and volumes on our net interest income for the fiscal years indicated. The rate column shows the effects attributable to changes in rate (changes in rate multiplied by prior volume). The volume column shows the effects attributable to changes in volume (changes in volume multiplied by prior rate). The net column represents the sum of the prior columns. For purposes of this table, changes attributable to both rate and volume, which cannot be segregated, have been allocated proportionately, based on the changes due to rate and the changes due to volume.
| For the Fiscal Years Ended September 30, 2009 vs. 2008 |
For the Fiscal Years Ended September 30, 2008 vs. 2007 |
|||||||||||||||||||||||
| Increase (Decrease) Due to |
Increase (Decrease) Due to |
|||||||||||||||||||||||
| Volume | Rate | Net | Volume | Rate | Net | |||||||||||||||||||
| (In thousands) | ||||||||||||||||||||||||
| Interest-earning assets: |
||||||||||||||||||||||||
| Federal funds sold |
$ | (7,605 | ) | $ | (6,879 | ) | $ | (14,484 | ) | $ | (14,997 | ) | $ | (8,870 | ) | $ | (23,867 | ) | ||||||
| Other interest-bearing cash equivalents |
18,048 | (19,632 | ) | (1,584 | ) | 917 | (207 | ) | 710 | |||||||||||||||
| Investment securities |
(581 | ) | (287 | ) | (868 | ) | (603 | ) | (255 | ) | (858 | ) | ||||||||||||
| Mortgage-backed securities |
(7,707 | ) | (7,002 | ) | (14,709 | ) | 22,260 | (1,786 | ) | 20,474 | ||||||||||||||
| Loans |
66,102 | (97,109 | ) | (31,007 | ) | 45,237 | (28,052 | ) | 17,185 | |||||||||||||||
| Federal Home Loan Bank stock |
62 | (371 | ) | (309 | ) | (1,031 | ) | (155 | ) | (1,186 | ) | |||||||||||||
| Total interest-earning assets |
68,319 | (131,280 | ) | (62,961 | ) | 51,783 | (39,325 | ) | 12,458 | |||||||||||||||
| Interest-bearing liabilities: |
||||||||||||||||||||||||
| NOW accounts |
(4,936 | ) | (17,150 | ) | (22,086 | ) | (11,910 | ) | (23,080 | ) | (34,990 | ) | ||||||||||||
| Passbook savings |
(3,324 | ) | (18,112 | ) | (21,436 | ) | 18,073 | 1,893 | 19,966 | |||||||||||||||
| Certificates of deposit |
31,125 | (61,911 | ) | (30,786 | ) | 4,437 | (4,125 | ) | 312 | |||||||||||||||
| Borrowed funds |
1,391 | (257 | ) | 1,134 | 662 | (152 | ) | 510 | ||||||||||||||||
| Total interest-bearing liabilities |
24,256 | (97,430 | ) | (73,174 | ) | 11,262 | (25,464 | ) | (14,202 | ) | ||||||||||||||
| Net change in interest income |
$ | 44,063 | $ | (33,850 | ) | $ | 10,213 | $ | 40,521 | $ | (13,861 | ) | $ | 26,660 | ||||||||||
Comparison of Operating Results for the Fiscal Years Ended September 30, 2009 and 2008
General. Net income decreased $40.1 million, or 74%, to $14.4 million for the fiscal year ended September 30, 2009 compared to $54.5 million for the fiscal year ended September 30, 2008. This change was attributed to increases in the provision for loan losses and non-interest expenses partially offset by increases in both net interest income and non-interest income.
Interest Income. Interest income decreased $63.0 million or 11%, to $487.2 million for the fiscal year ended September 30, 2009 compared to $550.2 million for the same period in the prior fiscal year. The decrease in interest income resulted primarily from decreases in interest income from loans and mortgage-backed securities along with a decrease in the interest received on federal funds.
During the current fiscal year there was $1 thousand of interest income from federal funds sold compared to $14.5 million in the fiscal year ended September 30, 2008. This was attributed to: (1) use of the Federal Reserve Bank to hold overnight cash; and (2) our cash position during the current fiscal year during which we were more frequently a borrower versus the prior fiscal year during which we were more frequently a lender. Excess cash was available to invest in the prior fiscal year due primarily to the remaining proceeds of our April 2007 initial public offering.
Interest income on mortgage-backed securities decreased $14.7 million, or 34%, to $28.9 million from $43.6 million during the prior fiscal year. The average yield on mortgage-backed securities decreased 87 basis points to 4.06% compared to 4.94% in the prior fiscal year as interest rates on adjustable rate securities reset to lower current rates and higher, fixed-rate securities experienced accelerated paydowns. The average balance of mortgage-backed securities decreased $172.0 million to $711.8 million compared to $883.8 million during the
60
Table of Contents
prior fiscal year. There were $36.8 million in purchases which partially offset principal paydowns in this portfolio. Paydowns on mortgage-backed securities increased during the current fiscal year due to the historically low mortgage interest rates. There were no sales of mortgage-backed securities during the current fiscal year.
Interest income on loans decreased $31.0 million, or 6%, to $455.9 million from $486.9 million when compared to the prior fiscal year. This change can be attributed to an 84 basis point decrease in the yield to 4.75% from 5.59% as historically low interest rates have increased the amount of refinance activity. The decrease in the yield was partially offset by an $894.2 million increase in the average balance of loans to $9.60 billion compared to $8.71 billion in the prior fiscal year as new loan production exceeded repayments and sales.
Interest Expense. Interest expense decreased $73.2 million, or 22%, to $257.1 million during the fiscal year ended 2009 from $330.3 during the fiscal year ended 2008. The change resulted primarily from a decrease in interest expense on NOW accounts, savings accounts and certificates of deposit offset by a small increase in interest expense on borrowed funds.
Interest expense on NOW accounts, which include our high yield checking accounts, decreased $22.1 million, or 71%, to $9.1 million from $25.8 million during the prior fiscal year. The decrease was caused primarily by a 156 basis point decrease in the average rate we paid on NOW accounts to 0.87% during the fiscal year ended 2009 compared to 2.43% during the fiscal year ended 2008. We decreased rates on deposits in response to decreases in short-term market interest rates. In addition, the average balance of NOW accounts decreased $236.7 million, or 18%, to $1.05 billion compared to $1.28 billion as existing customers continue to convert NOW accounts to certificates of deposit.
Interest expense on savings accounts decreased $21.4 million, or 57%, to $16.1 million from $37.6 million during the prior fiscal year. The decrease was primarily the result of a 156 basis point decrease in the yield to 1.42% compared to 2.98%. In addition, the average balance of savings accounts decreased $121.5 million, or 10%, to $1.14 billion during the current fiscal year, again reflecting customer preference for certificates of deposit in the current interest rate environment.
Interest expense on certificates of deposit decreased $30.8 million, or 12%, to $229.2 million from $260.0 million during the prior fiscal year. The change was attributed to an 91 basis point decrease in the average rate we paid on certificates of deposit to 3.70% from 4.61% partially offset by a $562.3 million, or 10% increase in the average balance to $6.20 billion from $5.64 billion as customers were attracted to the certainty of yields provided by certificates of deposit. Rates were adjusted on deposits in response to changes in general market rates as well as to changes in the rates paid by our competition on short-term certificates of deposit.
Net Interest Income. Net interest income increased $10.2 million, or 5%, to $230.1 million for the fiscal year ended September 30, 2009 compared to $219.9 million for the same period in the prior fiscal year. As net interest income increased, we experienced an improvement of our interest rate spread, which increased 25 basis points to 1.70% compared 1.45%. Our net interest margin increased two basis points to 2.20% compared to 2.18% for fiscal year 2008. Our average net interest-earning assets decreased $62.7 million, to $1.78 billion during the current fiscal year compared to $1.85 billion during the prior fiscal year, primarily as a result of our using cash to fund stock repurchase programs and to pay stock dividends.
Provision for Loan Losses. We establish provisions for loan losses, which are charged to operations, in order to maintain the allowance for loan losses at a level we consider necessary to absorb credit losses incurred in the loan portfolio that are both probable and reasonably estimable at the balance sheet date. In determining the level of the allowance for loan losses, we consider past and current loss experience, evaluations of real estate collateral, current economic conditions, volume and type of lending, adverse situations that may affect a borrower’s ability to repay a loan and the levels of non-performing and other classified loans. The amount of the allowance is based on estimates and the ultimate losses may vary from such estimates as more information becomes available or conditions change. We assess the allowance for loan losses on a quarterly basis and make provisions for loan losses in order to maintain the allowance.
61
Table of Contents
We recorded a provision for loan losses of $115.0 million during the current fiscal year ended September 30, 2009 and a provision of $34.5 million during the prior fiscal year. The provisions recorded exceeded net charge-offs of $63.5 million and $15.8 million for the fiscal years ended September 30, 2009 and 2008, respectively. The increased provisions reflect the continued increase in the unprecedented level of net charge-offs over the past few quarters and the uncertain economic times that face many of our loan customers. A combination of various market conditions, mainly a decrease in home values and an increase in unemployment rates, have caused higher delinquencies and charge-offs in the loan portfolio.
Non-Interest Income. Non-interest income increased $19.6 million, or 41%, to $67.4 million during the current fiscal year period compared to $47.8 million during the prior fiscal year.
Fees and service charges, net of amortization decreased $3.9 million, or 15%, to $21.6 million compared to $25.5 million during the prior fiscal year. This change was attributed to increased amortization on the mortgage servicing asset related to our sold loan portfolio. Increased amortization is the result of: (1) additions to the balance of the servicing asset; and (2) increased paydowns due to increased refinancing activity as result of lower interest rates during the current fiscal year.
Gains on the sale of loans increased $29.0 million, to $32.9 million from $3.9 million during the prior fiscal year. This was attributed to $2.22 billion in loan sales (compared to $774.7 million in the twelve-month period ended September 30, 2008) combined with falling interest rates in the current fiscal year. Declining interest rates generally result in higher gains on sales of loans. Loan sales are used by the Company as a means of managing interest rate risk.
Income (loss) on private equity funds decreased $4.3 million to a loss of $821 thousand during the current fiscal year, compared to income of $3.5 million during the prior fiscal year. This decrease primarily reflects the recognition of realized gains from disposition of private equity funds during the prior period versus the recognition of unrealized losses on remaining private equity fund investments during the current year.
Non-Interest Expense. Non-interest expense increased $10.9 million, or 7%, to $162.4 million during the fiscal year ended September 30, 2009 compared to $151.5 million during the fiscal year ended September 30, 2009.
Marketing services decreased $7.0 million, or 50%, to $7.0 million during the current fiscal year from $14.1 million during the prior fiscal year. The change in media services resulted from a reduction in the amount and the cost of advertising used in the current fiscal year as the voracity of promotional programs targeting equity lending products was moderated, particularly during the latter portion of the current fiscal year, pending the attainment of a more stable economic environment.
Federal insurance premiums increased $13.5 million, or 252%, to $18.9 million from $5.4 million when compared to the prior fiscal year. Increased assessment rates, an emergency five basis point assessment, and to a lesser extent, increased deposit balances during the current fiscal year along with the use of available credits during the prior fiscal year resulted in the increased premium expense.
Income Tax Expense. The provision for income tax was $5.7 million in the current fiscal year when compared to $27.2 million during the prior fiscal year, reflecting a $61.6 million decrease in pre-tax income between the two years. The provision for the current fiscal year included $5.6 million of federal income tax provision and $89 thousand of state income tax provision. The $27.2 million provision for income taxes for the prior fiscal year includes a $1.2 million provision for state income tax. State income tax expense in the current fiscal year decreased $1.1 million when compared to the prior fiscal year as a result of lower pre-tax income combined with the reversal of a prior fiscal year state tax accrual. The state income tax provision is subtracted from income before income taxes when calculating the federal income tax provision. Our effective federal tax
62
Table of Contents
rate was 28% for the current fiscal year when compared to 32.3% for the prior fiscal year. Each of these rates is lower than the federal statutory rate of 35% due to the tax exempt income related to bank-owned life insurance. The difference in the effective federal statutory tax rates this fiscal year when compared to the prior fiscal year is due to lower pretax income. Our effective tax rate is below the federal statutory rate primarily because of our ownership of bank-owned life insurance.
Comparison of Operating Results for the Fiscal Years Ended September 30, 2008 and 2007
General. Net income increased $28.9 million to $54.5 million in the twelve months ended September 30, 2008 as compared to $25.6 million in the twelve months ended September 30, 2007. This increase is attributed primarily to the $55 million pre-tax contribution expense in the prior year related to the formation of the Third Federal Foundation. Other factors that significantly impacted our earnings for the twelve month periods are described below.
Interest Income. Interest income increased $12.5 million, or 2%, to $550.2 million in the twelve months ended September 30, 2008 from $537.7 million in the same twelve month period ended September 30, 2007. The increase in interest income resulted from increases in interest income on loans and mortgage-backed securities partially offset by a decrease in interest income on federal funds.
Interest income on federal funds sold was $14.5 million in the fiscal year ended 2008, compared to $38.4 million in the prior fiscal year. The decrease resulted from a $349.8 million decrease in the average balance to $386.9 million from $736.7 million and lower market yields which were led by the actions of the Federal Reserve’s Open Market Committee, which lowered its federal funds target rate through a series of adjustments beginning in September 2007 and continuing through April 2008. The average yield on federal funds decreased 147 basis points to 3.74% from 5.21%. The lower average balance of federal funds reflects our deployment of lower yielding federal funds into higher yielding loan products and securities.
Interest income on mortgage-backed securities increased $20.5 million, to $43.6 million from $23.2 million in the prior fiscal year. The average balance of mortgage-backed securities increased $454.6 million to $883.8 million from $429.2 million in the prior fiscal year. The increase in the average balance resulted primarily from reinvestment of the proceeds from our public stock offering. The average yield on mortgage-backed securities decreased 46 basis points to 4.94% compared to 5.40% in the prior fiscal year.
Interest income on loans increased $17.2 million, or 4%, to $486.9 million from $469.8 million when compared to the prior fiscal year. The increase can be attributed to a $930.6 million increase in the average balance of loans to $8.71 billion when compared to $7.78 billion in the prior fiscal year as we have deployed cash balances of federal funds into higher yielding loan products and have also reinvested net cash inflows from deposits and borrowings into loan products. This increase in interest income on loans was partially offset by a 45 basis point decrease in the yield during the current fiscal year to 5.59% from 6.04% in the prior fiscal year which resulted primarily from the reduction in the prime rate of interest that benchmarks the yield on our equity lines of credit loans.
Dividend income on Federal Home Loan Bank stock decreased $1.2 million to $2.0 million in the current fiscal year when compared to $3.2 million in the prior fiscal year. The average balance of Federal Home Loan Bank stock was $34.6 million, compared to $52.3 million in prior fiscal year. The $17.8 million decrease in the average balance of Federal Home Loan Bank stock was the result of a redemption of excess shares in March 2007.
Interest Expense. Interest expense decreased $14.2 million, or 4%, to $330.3 million in fiscal year 2008 from $344.5 million in the fiscal year 2007. The decrease in interest expense resulted primarily from a decrease in interest expense on NOW accounts which was partially offset by an increase in interest expense on savings accounts.
63
Table of Contents
Interest expense on NOW accounts which includes our high yield checking accounts decreased $35.0 million, or 53%, to $31.2 million from $66.2 million in the prior fiscal year. The decrease was caused by a 165 basis point decrease in the average rate we paid on NOW accounts to 2.43% from 4.08% in the prior fiscal year. We decreased rates on deposits in response to decreases in short-term market interest rates. In addition, the average balance of NOW accounts decreased $338.1 million, or 21%, to $1.28 billion from $1.62 billion in the prior fiscal year as many customers converted their accounts to our new high-yield savings products.
Interest expense on savings accounts increased $20.0 million, to $37.6 million in fiscal year 2008 from $17.6 million in the prior fiscal year. The increase was caused primarily by a $612.0 million increase in the average balance to $1.26 billion from $649.4 million along with a 27 basis point increase in the average rate we paid to 2.98% in the current fiscal year. The increases in both average rate and average balance resulted primarily from the introduction in early March 2007 of a new high-yield savings account that offers depositors a competitive yield.
Net Interest Income. Net interest income increased by $26.7 million, or 14%, to $219.9 million for the twelve months ended September 30, 2008 from $193.2 million for the twelve months ended September 30, 2007. The increase resulted primarily from the increase of $564.9 million in average net interest earning assets, to $1.85 billion in the current fiscal year from $1.28 billion during the prior fiscal year, growth which was made possible by the capital raised from our initial public offering which was completed in April 2007. The increase in the average balance of net interest earning assets also favorably impacted our interest rate margin which increased to 2.18% during the current fiscal year from 2.13% during the last fiscal year. Moving in a contradictory manner however, was our net interest rate spread which decreased six basis points to 1.45% for the current fiscal year from 1.51% in the prior fiscal year. That decrease resulted primarily from the turmoil in the financial markets related to the impact that losses on sub-prime loans had on the ability of certain financial institutions to generate funding sources. The challenges that those institutions faced in maintaining their funding sources, particularly in the wholesale markets, caused them to become extremely aggressive participants in the retail deposit gathering marketplace, and that aggression resulted in higher interest rates, particularly in shorter terms, offered to deposit customers. In order to compete, retain customers and attract new customers, the Company offered higher rates on its deposit products, and those higher rates had the net effect of preventing our cost of funds from decreasing as quickly as our yield on interest earning assets.
Provision for Loan Losses. We recorded a provision for loan losses of $34.5 million for the twelve months ended September 30, 2008 and a provision of $9.6 million for twelve months ended September 30, 2007. Beginning as of June 30, 2008, with quarterly updates thereafter, the provision for loan losses reflect the results of our expanded loan level evaluation of equity lines of credit which are delinquent 90 or more days. The provisions recorded exceeded net charge-offs of $15.8 million and $5.2 million for the fiscal years ended September 30, 2008 and 2007, respectively. The allowance for loan losses was $43.8 million or 0.47% of total loans receivable at September 30, 2008, compared to $25.1 million, or 0.31% of total loans receivable, at September 30, 2007. We increased the allowance for loan losses to address the increased risk related to an increase in non-performing loans, higher foreclosure rates, slumping residential housing values and in response to the results of our expanded evaluation of equity lines of credit delinquent 90 days or more. Non-performing loans increased by $59.3 million to $172.9 million, or 1.86% of total loans, at September 30, 2008 from $113.5 million, or 1.39% of total loans, at September 30, 2007.
Non-Interest Income. Non-interest income decreased $3.6 million to $47.8 million for the twelve months ended September 30, 2008 from $51.4 million for the twelve months ended September 30, 2007. We had net gains of $3.9 million on loan sales in the current fiscal year, compared to $15 thousand of gains in the prior fiscal year. Net income on private equity investments decreased $1.9 million, to $3.5 million from $5.4 million in the prior fiscal year. This decrease primarily reflected the change in gains from the disposition of private equity fund investments in the current and prior fiscal years. Additionally, other non-interest income decreased $5.9 million, to $6.7 million in the current fiscal year, from $12.5 million in the prior fiscal year. This decrease was due to a $3.2 million gain recognized in connection with the sale, during fiscal year 2007, of a commercial office building owned by our Hazelmere subsidiary, a company that invests in commercial office buildings and leases them to
64
Table of Contents
unaffiliated parties. Rental income in the current fiscal year decreased $1.2 million due to the sale of the aforementioned office building. We also experienced a decrease of $1.7 million due to the reduction in rebates from our official check provider when compared to the prior fiscal year.
Non-Interest Expense. Non-interest expense decreased $39.7 million, or 21%, to $151.4 million for the twelve months ended September 30, 2008 from $191.1 million for the twelve months ended September 30, 2007. The decrease resulted primarily from the $55 million, pre-tax charitable contribution to the Foundation made in conjunction with our public stock offering in April 2007 offset by increases in salaries and employee benefit expense, in federal insurance premiums, state franchise tax and in other operating expenses.
Federal insurance premiums increased $3.0 million to $5.4 million for the twelve months ended September 30, 2008 from $2.4 million for the twelve months ended September 30, 2007. The use of available credits in the prior year kept the premiums paid lower when compared to the current year.
State franchise tax increased $2.3 million, or 74% to $5.4 million from $3.1 million in the same period last year. State franchise tax in Ohio, where our principal subsidiary operates, is calculated based on equity. Equity increased significantly as a result of the initial public stock offering and as a result our franchise tax liability increased.
Real estate owned expense, net increased $3.7 million, or 145%, to $6.3 million from $2.6 million in the prior fiscal year. This change can be attributed to the expenses, disposition costs and losses associated with real estate owned parcels acquired through foreclosure. The foreclosure rate was higher, consistent with delinquency trends. Costs and losses were greater due to deteriorating property conditions and slumping housing values, linked we believe to wholesale dumping of housing stock by troubled national mortgage lenders.
Other operating expenses increased $3.2 million, or 15%, to $25.0 million from $21.8 million in the prior fiscal year. Costs associated with being a public company increased $956 thousand, the provision for mortgage reinsurance claims at our captive insurance subsidiary increased $788 thousand, expense to order credit reports increased $606 thousand, and postage/courier fees increased $529 thousand.
Income Tax Expense. The provision for income taxes was $27.2 million for the twelve months ended September 30, 2008, compared to $18.3 million for the twelve months ended September 30, 2007, reflecting a $37.8 million increase in pre-tax income between the twelve month periods. Our effective tax rate was 33.3% for the twelve months ended September 30, 2008 as compared to 41.6% for the prior fiscal year. Our effective tax rate was below the federal statutory rate of 35.0% in 2008 largely because of the beneficial effect of owning bank-owned life insurance. Our effective tax rate was higher than the federal statutory rate in 2007 because we established a deferred tax asset valuation allowance of $4.0 million related to the utilization of our charitable contribution deduction carryforward which arose in connection with our $55.0 million contribution to Third Federal Foundation.
Liquidity and Capital Resources
Liquidity is the ability to meet current and future financial obligations of a short-term nature. Our primary sources of funds consist of deposit inflows, loan sales, loan repayments, advances from the FHLB of Cincinnati, borrowings from the Federal Reserve Discount Window and maturities and sales of securities. In addition, we have the ability to obtain collateralized borrowings in the wholesale markets. Of course, in April 2007, access to the equity capital markets had a dramatic impact on our liquidity as evidenced by the $886 million net proceeds from our stock offering. While maturities and scheduled amortization of loans and securities are predictable sources of funds, deposit flows and mortgage prepayments are greatly influenced by general interest rates, economic conditions and competition. The Association’s Asset/Liability Management Committee is responsible for establishing and monitoring our liquidity targets and strategies in order to ensure that sufficient liquidity exists for meeting the borrowing needs and deposit withdrawals of our customers as well as unanticipated contingencies. We seek to maintain a minimum liquidity ratio of 2% or greater (which we compute as the sum of cash and cash equivalents plus unpledged investment securities for which ready markets exist, divided by total assets). For the fiscal year ended September 30, 2009, our liquidity ratio averaged 7.6%. We believe that we have enough sources of liquidity to satisfy our short- and long-term liquidity needs as of September 30, 2009.
65
Table of Contents
We regularly adjust our investments in liquid assets based upon our assessment of expected loan demand, expected deposit flows, yields available on interest-earning deposits and securities and the objectives of our asset/liability management program.
Excess liquid assets are generally invested in interest-earning deposits and short- and intermediate-term securities.
Our most liquid assets are cash and cash equivalents. The levels of these assets are dependent on our operating, financing, lending and investing activities during any given period. At September 30, 2009, cash and cash equivalents totaled $307.0 million. Because we originate a significant amount of loans that qualify for sale in the secondary market, our loans held for sale represent highly liquid assets. At September 30, 2009, we had $61.2 million of loans classified as held for sale. During the fiscal year ended September 30, 2009, we sold $2.22 billion of long-term, fixed rate loans. The placement of Fannie Mae and Freddie Mac under the control of the U.S. Treasury Department in 2008 restored order and liquidity to that market and we expect to continue to be able to sell fixed-rate loans. Investment securities classified as available-for-sale, which provide additional sources of liquidity, totaled $23.4 million at September 30, 2009. Also, at September 30, 2009 we had borrowed $70.2 million from the FHLB of Cincinnati.
Our cash flows are derived from operating activities, investing activities and financing activities as reported in our Consolidated Statements of Cash Flows included in the Consolidated Financial Statements.
At September 30, 2009, we had $254.5 million in loan commitments outstanding. In addition to commitments to originate loans, we had $2.35 billion in unused lines of credit to borrowers. Certificates of deposit due within one year of September 30, 2009 totaled $3.19 billion, or 37.2% of total deposits. If these deposits do not remain with us, we will be required to seek other sources of funds, including loan sales, sales of investment securities, other deposit products, including certificates of deposit, Federal Home Loan Bank advances, borrowings from the Federal Reserve Discount Window or other collateralized borrowings. Depending on market conditions, we may be required to pay higher rates on such deposits or other borrowings than we currently pay on the certificates of deposit due on or before September 30, 2010. We believe, however, based on past experience, that a significant portion of such deposits will remain with us. Generally, we have the ability to attract and retain deposits by adjusting the interest rates offered.
Our primary investing activity is originating residential mortgage loans. During the fiscal year ended September 30, 2009, we originated $2.54 billion of loans, and during the fiscal year ended September 30, 2008, we originated $2.03 billion of loans. We purchased $36.8 million of securities during the fiscal year ended September 30, 2009, and $229.5 million during the fiscal year ended September 30, 2008.
Financing activities consist primarily of changes in deposit accounts and, to a lesser extent, Federal Home Loan Bank advances and borrowings from the Federal Reserve Discount Window. We experienced a net increase in total deposits of $309.4 million during the fiscal year ended September 30, 2009 compared to a net increase of $119.9 million during the fiscal year ended September 30, 2008. Deposit flows are affected by the overall level of interest rates, the interest rates and products offered by us and our local competitors, and by other factors.
Liquidity management is both a daily and long-term function of business management. If we require funds beyond our ability to generate them internally, borrowing agreements exist with the FHLB of Cincinnati and the Federal Reserve Discount Window, each of which provides an additional source of funds. At September 30, 2009 we had $70.2 million of FHLB of Cincinnati advances and no outstanding borrowings from the Federal Reserve Discount Window, while at September 30, 2008 our borrowings, which again were only from the FHLB of Cincinnati, totaled $498.0 million. During the fiscal year ended September 30, 2009, we had average outstanding advances with the FHLB of Cincinnati of $195.7 million and average outstanding borrowings from the Federal Reserve Discount Window of $94.2 million as compared to average borrowings of $70.2 million, all from the FHLB of Cincinnati, during fiscal year 2008. At September 30, 2009 we had the ability to immediately borrow
66
Table of Contents
an additional $898.5 million from the FHLB of Cincinnati and $399.9 million from the Federal Reserve Discount Window. From the perspective of collateral value securing FHLB of Cincinnati advances, our capacity limit for additional borrowings at September 30, 2009 was $1.54 billion, subject to satisfaction of the FHLB Cincinnati common stock ownership requirement. To satisfy the common stock ownership requirement we would have to increase our ownership of FHLB Cincinnati common stock by an additional $30.8 million.
Third Federal Savings and Loan is subject to various regulatory capital requirements, including a risk-based capital measure. The risk-based capital guidelines include both a definition of capital and a framework for calculating risk-weighted assets by assigning balance sheet assets and off-balance sheet items to broad risk categories. At September 30, 2009, Third Federal Savings and Loan exceeded all regulatory capital requirements. Third Federal Savings and Loan is considered “well capitalized” under regulatory guidelines.
The net proceeds from the stock offering significantly increased our liquidity and capital resources during fiscal 2007. Our financial condition and results of operations have been enhanced by the net proceeds from the stock offering, and have resulted in increased net interest-earning assets and net interest income during the periods following completion of the offering in April 2007. However, due to the increase in equity that resulted from the net proceeds of our stock offering, our return on equity ratios have been adversely affected and can be expected to continue to be so affected prospectively.
Off-Balance Sheet Arrangements and Aggregate Contractual Obligations
Commitments. As a financial services provider, we routinely are a party to various financial instruments with off-balance-sheet risks, such as commitments to extend credit and unused lines of credit. While these contractual obligations represent our future cash requirements, a significant portion of commitments to extend credit may expire without being drawn upon. Such commitments are subject to the same credit policies and approval process accorded to loans we make. In addition, we routinely enter into commitments to securitize and sell mortgage loans. For additional information, see Note 15 of the Notes to our Consolidated Financial Statements.
Contractual Obligations. In the ordinary course of our operations, we enter into certain contractual obligations. Such obligations include operating leases for premises and equipment, agreements with respect to borrowed funds and deposit liabilities and agreements with respect to investments.
The following table summarizes our significant fixed and determinable contractual obligations and other funding needs by payment date at September 30, 2009. The payment amounts represent those amounts due to the recipient and do not include any unamortized premiums or discounts or other similar carrying amount adjustments.
| Payments due by period | ||||||||||||||||
| Contractual Obligations |
Less than One year |
One to Three years |
Three to Five years |
More than Five years |
Total | |||||||||||
| (In thousands) | ||||||||||||||||
| Federal Home Loan Bank advances |
$ | — | $ | 18,000 | $ | 39,000 | $ | 13,000 | $ | 70,000 | ||||||
| Operating leases |
4,534 | 7,636 | 5,757 | 7,153 | 25,080 | |||||||||||
| Purchase obligations |
4,824 | — | — | — | 4,824 | |||||||||||
| Certificates of deposit(1) |
3,184,330 | 1,689,069 | 1,023,177 | 459,079 | 6,355,655 | |||||||||||
| Private equity investments |
13,913 | — | — | — | 13,913 | |||||||||||
| Total |
$ | 3,207,601 | $ | 1,714,705 | $ | 1,067,934 | $ | 479,232 | $ | 6,469,472 | ||||||
| Commitments to extend credit |
$ | 2,937,149 | (2) | $ | 6,957 | $ | — | $ | — | $ | 2,944,106 | |||||
| (1) | Includes accrued interest payable at September 30, 2009. |
| (2) | Includes the unused portion of equity lines of credit of $2.35 billion. |
67
Table of Contents
The Company provides mortgage reinsurance on certain mortgage loans in its own portfolio, including Home Today loans, and loans in its servicing portfolio through contracts with two primary mortgage insurance companies. Under these contracts, the Company absorbs mortgage insurance losses in excess of a specified percentage of the principal balance of a given pool of loans, subject to a contractual limit, in exchange for a portion of the pools’ mortgage insurance premiums. As of September 30, 2009, approximately $569.3 million of mortgage loans in our portfolios was covered by such mortgage reinsurance contracts. At September 30, 2009, the maximum losses under the reinsurance contracts were limited to $16.3 million. The Company has incurred $322 thousand in losses under these reinsurance contracts and provided a liability for estimated losses totaling $5.8 million as of September 30, 2009. Management believes it has made adequate provision for estimated losses.
Impact of Inflation and Changing Prices
Our consolidated financial statements and related notes have been prepared in accordance with GAAP. GAAP generally requires the measurement of financial position and operating results in terms of historical dollars without consideration for changes in the relative purchasing power of money over time due to inflation. The impact of inflation is reflected in the increased cost of our operations. Unlike industrial companies, our assets and liabilities are primarily monetary in nature. As a result, changes in market interest rates have a greater impact on performance than the effects of inflation.
Recent Accounting Pronouncements
FASB ASC 105 “Generally Accepted Financial Accounting Principles” Standards Board (“FASB”) ASC 105 establishes the Codification as the single source of authoritative generally accepted accounting principles (“GAAP”) in the United States except for rules and interpretive releases of the SEC, which are sources of authoritative GAAP for SEC registrants. The provisions of FASB ASC 105 were adopted for the period ending September 30, 2009 and did not have a material effect on the Company’s consolidated financial statements.
FASB ASU 2009-05 “Measuring Liabilities at Fair Value” provides additional guidance on how to measure the fair value of a liability. When a quoted price in an active market for an identical liability is not available, an entity is required to measure fair value using a valuation technique that uses the quoted price of an identical liability when traded as an asset, the quoted price for a similar liability or a similar liability when traded as an asset, or another valuation technique that is consistent with the principles of FASB ASC 820. This update is effective for interim or annual periods beginning after August 28, 2009. The Company will adopt the provisions of ASU 2009-05 on October 1, 2009 and does not expect the adoption to have a material effect on its consolidated financial statements.
FASB ASC 810-10-25, the consolidation guidance related to variable interest entities (“VIEs”) was amended to modify the approach used to evaluate VIEs and add disclosure requirements about an enterprise’s involvement with VIEs. These provisions are effective at the beginning of an entity’s annual reporting period that begins after November 15, 2009 and for interim periods within that period. The Company does not expect the adoption of this consolidation guidance to have a material effect on its consolidated financial statements.
FASB ASC 860 “Transfers and Servicing” was amended to eliminate the concept of a “qualifying special-purpose entity” and change the requirements for derecognizing financial assets. The amendment requires additional disclosures intended to provide greater transparency about transfers of financial assets, including securitization transactions, and an entity’s continuing involvement in and exposure to the risks related to transferred financial assets. This updated guidance is effective for fiscal years beginning after November 15, 2009. The Company does not expect the adoption of this guidance to have a material effect on its consolidated financial statements.
FASB ASC 855-10 “Subsequent Events” establishes general standards of accounting and disclosure for subsequent events, those events that occur after the balance sheet date but before financial statements are issued or are available to be issued. FASB ASC 855-10 defines the period during which management shall evaluate
68
Table of Contents
events or transactions for potential recognition or disclosure in the financial statements and the circumstances under which an entity shall recognize or disclose subsequent events in the financial statements. Additionally, entities are required to disclose the date through which it has evaluated subsequent events and the basis for determining that date. The recent accounting guidance in this FASB ASC was adopted for the reporting period ending June 30, 2009 and did not have a material effect on the Company’s consolidated financial statements.
FASB ASC 825-10-65 “Financial Instruments”, FASB ASC 320-10-65 “Investments-debt and Equity Securities”, and FASB ASC 820-10-65, “Fair Value Measurements and Disclosures provide additional guidance on fair value measurements and impairments of securities. FASB ASC 825-10-65 requires that the fair value of all financial instruments be disclosed in both interim and annual reporting periods. FASB ASC 320-10-65 modifies the criteria used to assess other-than-temporary impairment (“OTTI”) of debt securities and collectability of cash flows, bifurcate the recognition of OTTI between earnings and other comprehensive income, and require expanded and more frequent disclosures about OTTI. FASB ASC 820-10-65 permits adjustments to estimated fair values of assets and liabilities when, due to a significant decrease in the volume and level of market activity or evidence that a market is not orderly, the valuation technique used does not fairly represent the price at which willing market participants would transact at the measurement date under current market conditions. In addition, FASB ASC 820-10 -65 requires disclosures about inputs and valuation techniques used to measure fair values for both interim and annual reporting periods. The recent accounting guidance in the preceding three FASB ASC’s was adopted for the reporting period ending June 30, 2009 and did not have a material effect on the Company’s consolidated financial statements.
FASB ASC 715-20-65 “Compensation—Retirement Benefits” expands the disclosure requirements for plan assets of defined benefit pensions or other postretirement plans. For plans subject to this statement, entities are required to provide more detailed information about (1) investment policies and strategies, (2) categories of plan assets, (3) fair value measurements of plan assets, and (4) significant concentrations of risk. FASB ASC 715-20-65 is effective for fiscal years ending after December 15, 2009. The Company will adopt the provisions of this FASB ASC on October 1, 2009 and does not expect the adoption to have a material effect on the Company’s consolidated financial statements.
FASB ASC 260-10-45 “Earnings per Share” clarifies that unvested share-based payment awards that contain nonforfeitable rights to dividends or dividend equivalents are participating securities, and; therefore, need to be included in the earnings allocation in computing earnings per share under the two-class method. FASB ASC 260-10-45 is effective for financial statements issued for fiscal years beginning after December 15, 2008, and interim periods within those periods. The Company will adopt the provisions of FASB ASC 260-10-45 on October 1, 2009 and does not expect the adoption to have a material effect on its consolidated financial statements.
FASB ASC 815-10-65 “Derivatives and Hedging” expands the disclosure requirements for derivative instruments and hedging activities. For instruments subject to this FASB ASC, entities are required to disclose how and why such instruments are being used, where values, gains and losses are reported within financial statements, and the existence and nature of credit-risk-related contingent features. Additionally, entities are required to provide more specific disclosures about the volume of their derivative activity. FASB ASC 815-10-65 is effective for fiscal years and interim periods beginning after November 15, 2008. The accounting guidance in this ASC was adopted on January 1, 2009 and did not have a material effect on the Company’s consolidated financial statements.
FASB ASC 820-10-65-1, “Fair Value Measurements and Disclosures” delays the effective date of FASB ASC 820 for non-recurring fair value measurements of nonfinancial assets and nonfinancial liabilities until fiscal years beginning after November 15, 2008. Pursuant to this provision, the Company will apply the provisions of FASB ASC 820 to nonfinancial assets and nonfinancial liabilities measured at fair value on a non-recurring basis beginning on October 1, 2009. The application is not expected to have a material effect on its consolidated financial statements.
69
Table of Contents
FASB ASC 810-10 “Consolidation” requires that a noncontrolling interest in a subsidiary be reported as equity and the amount of consolidated net income specifically attributable to the noncontrolling interest be identified in the consolidated financial statements. It also calls for consistency in the manner of reporting changes in the parent’s ownership interest and requires fair value measurement of any noncontrolling equity investment retained in a deconsolidation. FASB ASC 810-10 is effective for fiscal years, and interim periods within those fiscal years, beginning on or after December 15, 2008. The Company will adopt the provisions of FASB ASC 810-10 on October 1, 2009 and does not expect the adoption to have a material effect on its consolidated financial statements.
FASB ASC 805, “Business Combinations” was amended to extend its applicability to all transactions and other events in which one entity obtains control over one or more other businesses. It broadens the fair value measurement and recognition of assets acquired, liabilities assumed, and interests transferred as a result of business combinations and expands required disclosures to improve the statement users’ abilities to evaluate the nature and financial effects of business combinations. The amendments to FASB ASC 805 are effective for the first annual reporting period beginning on or after December 15, 2008. The Company adopted these provisions on October 1, 2009 and does not expect the adoption to have a material effect on its consolidated financial statements.
70
Table of Contents
| Item 7A. | Quantitative and Qualitative Disclosures About Market Risk |
General. The majority of our assets and liabilities are monetary in nature. Consequently, our most significant form of market risk has historically been interest rate risk. In general, our assets, consisting primarily of mortgage loans, have longer maturities than our liabilities, consisting primarily of deposits. As a result, a principal part of our business strategy is to manage interest rate risk and limit the exposure of our net interest income to changes in market interest rates. Accordingly, our board of directors has established an Asset/Liability Management Committee which is responsible for evaluating the interest rate risk inherent in our assets and liabilities, for determining the level of risk that is appropriate, given our business strategy, operating environment, capital, liquidity and performance objectives, and for managing this risk consistent with the guidelines approved by the board of directors.
We have sought to manage our interest rate risk in order to control the exposure of our earnings and capital to changes in interest rates. As part of our ongoing asset-liability management, we currently use the following strategies to manage our interest rate risk:
| (i) | securitizing and selling long-term, fixed-rate residential real estate mortgage loans; |
| (ii) | marketing adjustable-rate loan products, including equity lines of credit; |
| (iii) | lengthening the weighted average remaining term of major funding sources, primarily by offering attractive interest rates on deposit products, particularly longer-term certificates of deposit; |
| (iv) | investing in shorter- to medium-term investments and mortgage-backed securities; and |
| (v) | maintaining high levels of capital. |
During 2009, 2008 and 2007, $2.22 billion, $744.7 million and $894.5 million, respectively, of long-term, fixed rate mortgage loans were securitized and sold. These sales were undertaken to improve our interest rate risk position in the event that market interest rates increased.
Shortening the average maturity of our interest-earning assets by increasing our investments in shorter-term loans and investments, as well as loans and investments with variable rates of interest, helps to better match the maturities and interest rates of our assets and liabilities, thereby reducing the exposure of our net interest income to changes in market interest rates. By following these strategies, we believe that we are better-positioned to react to increases in market interest rates.
Net Portfolio Value. The Office of Thrift Supervision requires the computation of amounts by which the net present value of an institution’s cash flow from assets, liabilities and off balance sheet items (the institution’s net portfolio value or “NPV”) would change in the event of a range of assumed changes in market interest rates. The Office of Thrift Supervision provides all institutions that file a Consolidated Maturity/Rate Schedule as a part of their quarterly Thrift Financial Report with an interest rate sensitivity report of NPV. The Office of Thrift Supervision simulation model uses a discounted cash flow analysis and an option-based pricing approach to measuring the interest rate sensitivity of NPV. Historically, the Office of Thrift Supervision model estimated the economic value of each type of asset, liability and off-balance sheet contract under the assumption that the United States Treasury yield curve increases or decreases instantaneously by 100 to 300 basis points in 100 basis point increments. However, in recent years, an NPV calculation for an interest rate decrease of greater than 200 basis points has not been prepared. A basis point equals one-hundredth of one percent, and 100 basis points equals one percent. An increase in interest rates from 3% to 4% would mean, for example, a 100 basis point increase in the “Change in Interest Rates” column below. The Office of Thrift Supervision provides us the results of the interest rate sensitivity model, which is based on information we provide to the Office of Thrift Supervision to estimate the sensitivity of our NPV.
71
Table of Contents
The table below sets forth, as of September 30, 2009, the Office of Thrift Supervision’s calculation of the estimated changes in the NPV of the Association that would result from the designated instantaneous changes in the United States Treasury yield curve. Computations of prospective effects of hypothetical interest rate changes are based on numerous assumptions, including relative levels of market interest rates, loan prepayments and deposit decay, and should not be relied upon as indicative of actual results.
| Change in |
Estimated NPV(2) | Estimated Increase (Decrease) in NPV |
NPV as a Percentage of Present Value of Assets(3) | |||||||||||
| NPV Ratio(4) |
Increase (Decrease) (basis points) | |||||||||||||
| Amount | Percent | |||||||||||||
| (Dollars in thousands) | ||||||||||||||
| +300 | $ | 1,253,942 | $ | (191,067 | ) | -13% | 11.91 | % | -117 | |||||
| +200 | 1,369,819 | (75,190 | ) | -5% | 12.74 | % | -34 | |||||||
| +100 | 1,448,680 | 3,671 | 0% | 13.24 | % | 16 | ||||||||
| — | 1,445,009 | — | — | 13.08 | % | — | ||||||||
| -100 | 1,347,171 | (97,838 | ) | -7% | 12.16 | % | -92 | |||||||
| (1) | Assumes an instantaneous uniform change in interest rates at all maturities. |
| (2) | NPV is the discounted present value of expected cash flows from assets, liabilities and off-balance sheet contracts. |
| (3) | Present value of assets represents the discounted present value of incoming cash flows on interest-earning assets. |
| (4) | NPV Ratio represents NPV divided by the present value of assets. |
The table above indicates that at September 30, 2009, in the event of an increase of 200 basis points in all interest rates, the Association would experience a 5% decrease in NPV. In the event of a 100 basis point decrease in interest rates, the Association would experience a 7% decrease in NPV.
The following table is based on the calculations contained in the previous table, and sets forth the change in the NPV (by regulation the Association must measure and manage its interest rate risk for an interest rate shock of +/-200 basis points, whichever produces the largest decline in NPV but because current short-term interest rates are so low, only measurements at -100 basis points are available) that result from the applicable rate shock, which is -100 basis points at September 30, 2009 and +200 basis points at September 30, 2008.
| At September 30, | ||||||
| Risk Measure (-100 bp Rate Shock in 2009 and +200 bp Rate Shock in 2008) | 2009 | 2008 | ||||
| Pre-Shock NPV Ratio |
13.08 | % | 12.12 | % | ||
| Post-Shock NPV Ratio |
12.16 | % | 9.76 | % | ||
| Sesitivity Measure in basis points |
(92 | ) | (236 | ) | ||
72
Table of Contents
The following table presents our internal calculations of the estimated changes in the Association’s NPV at September 30, 2009 and 2008 that would result from the designated instantaneous changes in the United States Treasury yield curve.
| Change in Interest Rates (basis points)(1) |
NPV as a Percentage of Present Value of Assets(2) |
|||||||
| NPV Ratio(3) at September 30, | ||||||||
| 2009 | 2008 | |||||||
| +300 |
11.45 | % | 9.53 | % | ||||
| +200 |
12.69 | % | 11.24 | % | ||||
| +100 |
13.78 | % | 12.89 | % | ||||
| — |
14.14 | % | 14.39 | % | ||||
| -100 |
13.55 | % | 15.03 | % | ||||
| (1) | Assumes an instantaneous uniform change in interest rates at all maturities. |
| (2) | Present value of assets represents the discounted present value of incoming cash flows on interest-earning assets. |
| (3) | NPV Ratio represents NPV divided by the present value of assets. |
Certain shortcomings are inherent in the methodologies used in determining interest rate risk through changes in NPV. Modeling changes in NPV require making certain assumptions that may or may not reflect the manner in which actual yields and costs respond to changes in market interest rates. In this regard, the NPV tables presented assume that the composition of our interest-sensitive assets and liabilities existing at the beginning of a period remains constant over the period being measured and assume that a particular change in interest rates is reflected uniformly across the yield curve regardless of the duration or repricing of specific assets and liabilities. Accordingly, although the NPV tables provide an indication of our interest rate risk exposure at a particular point in time, such measurements are not intended to and do not provide a precise forecast of the effect of changes in market interest rates on our net interest income and will differ from actual results.
Additionally, both the estimates prepared by the OTS as well as our internal estimates are significantly impacted by the numerous assumptions used in preparing the NPV calculations. In general, the assumptions used by the OTS are, by necessity, more generic as their modeling framework must fit and be adaptable to all institutions subject to its regulation. Our internal model on the other hand, is tailored specifically to our organization which, we believe, improves the accuracy of our internally prepared NPV estimates.
Net Interest Income. In addition to NPV calculations, we analyze our sensitivity to changes in interest rates through our internal net interest income model. Net interest income is the difference between the interest income we earn on our interest-earning assets, such as loans and securities, and the interest we pay on our interest-bearing liabilities, such as deposits and borrowings. In our model, we estimate what our net interest income would be for a twelve-month period using Office of Thrift Supervision Pricing Tables for assumptions such as loan prepayment rates and deposit decay rates, and the Bloomberg forward yield curve for assumptions as to projected interest rates. We then calculate what the net interest income would be for the same period in the event of an instantaneous 200 basis point increase in market interest rates. As of September 30, 2009, we estimated that our net interest income for the twelve months ending September 30, 2010 would decrease by 15.7% in the event of an instantaneous 200 basis point increase in market interest rates.
Certain shortcomings are inherent in the methodologies used in determining interest rate risk through changes in net interest income. Modeling changes in net interest income require making certain assumptions that may or may not reflect the manner in which actual yields and costs respond to changes in market interest rates. In this regard, the interest rate risk information presented assumes that the composition of our interest-sensitive assets and liabilities existing at the beginning of a period remains constant over the period being measured and
73
Table of Contents
assumes that a particular change in interest rates is reflected uniformly across the yield curve regardless of the duration or repricing of specific assets and liabilities. Accordingly, although interest rate risk calculations provide an indication of our interest rate risk exposure at a particular point in time, such measurements are not intended to and do not provide a precise forecast of the effect of changes in market interest rates on our net interest income and will differ from actual results.
| Item 8. | Financial Statements and Supplementary Data |
The Financial Statements are included in Part IV, Item 15 of this Form 10-K.
| Item 9. | Changes in and Disagreements with Accountants on Accounting and Financial Disclosure |
Not applicable.
| Item 9A. | Controls and Procedures |
Disclosure Controls and Procedures
Under the supervision of and with the participation of our management, including our principal executive officer and principal financial officer, we have evaluated the effectiveness of the design and operation of our disclosure controls and procedures (as defined in Rule 13a-15(e) and 15d-15(e) under the Exchange Act) as of the end of the period covered by this report. Disclosure controls and procedures include, without limitation, controls and procedures designed to ensure that information required to be disclosed by an issuer in the reports that it files or submits under the Act is accumulated and communicated to the issuer’s management, including its principal executive and principal financial officers, or persons performing similar functions, as appropriate to allow timely decisions regarding required disclosure. Based upon that evaluation, our principal executive officer and principal financial officer concluded that, as of the end of the period covered by this report, our disclosure controls and procedures were effective to ensure that information required to be disclosed in the reports that we file or submit under the Exchange Act is recorded, processed, summarized and reported, within the time periods specified in the SEC’s rules and forms.
Changes in Internal Control Over Financial Reporting
No change in our internal control over financial reporting (as defined in Rules 13a-15(f) and 15d-15(f) under the Exchange Act) occurred during the most recent fiscal quarter that has materially affected, or is reasonably likely to materially affect, our internal control over financial reporting.
Management’s Report Regarding Internal Control Over Financial Reporting
The Company’s management team is responsible for establishing and maintaining adequate internal control over financial reporting as such terms are defined in Rule 13a-15(f) of the Exchange Act of 1934. Our system of internal controls is designed to provide reasonable assurance that the financial statements that we provide to the public are fairly presented.
Our internal control over financial reporting includes policies and procedures that pertain to the maintenance of records that, in reasonable detail, accurately and fairly reflect transactions and dispositions of assets; provide reasonable assurances that transactions are recorded as necessary to permit preparation of financial statements in accordance with accounting principles generally accepted in the United States of America, and that receipts and expenditures are being made only in accordance with authorizations of management and the directors of the Company; and provide reasonable assurance regarding prevention or timely detection of unauthorized acquisition, use or disposition of the Company’s assets that could have a material effect on our financial statements.
74
Table of Contents
All internal control systems, no matter how well designed, have inherent limitations. Therefore, even those systems determined to be effective can provide only reasonable assurance with respect to financial statement preparation and presentation. Accordingly, absolute assurance cannot be provided that the effectiveness of the internal control systems may become inadequate in future periods because of changes in conditions, or because the degree of compliance with the policies or procedures may deteriorate.
Management assessed the effectiveness of the Company’s internal control over financial reporting as of September 30, 2009. In making this assessment, the criteria set forth by the Committee of Sponsoring Organizations of the Treadway Commission in Internal Control-Integrated Framework was utilized. Based on this assessment, management believes that, as of September 30, 2009, the Company’s internal control over financial reporting is effective.
The Company’s independent registered public accounting firm has issued an attestation report on the Company’s internal control over financial reporting.
The Sarbanes-Oxley Act Section 302 Certifications have been filed as Exhibit 31.1 and Exhibit 31.2 to this Annual Report on Form 10-K.
75
Table of Contents
REPORT OF INDEPENDENT REGISTERED PUBLIC ACCOUNTING FIRM
To the Board of Directors and Shareholders of
TFS Financial Corporation
Cleveland, OH
We have audited the internal control over financial reporting of TFS Financial Corporation and subsidiaries (the “Company”) as of September 30, 2009, based on criteria established in Internal Control—Integrated Framework issued by the Committee of Sponsoring Organizations of the Treadway Commission. The Company’s management is responsible for maintaining effective internal control over financial reporting and for its assessment of the effectiveness of internal control over financial reporting, included in the accompanying Management’s Report Regarding Internal Control Over Financial Reporting. Our responsibility is to express an opinion on the Company’s internal control over financial reporting based on our audit.
We conducted our audit in accordance with the standards of the Public Company Accounting Oversight Board (United States). Those standards require that we plan and perform the audit to obtain reasonable assurance about whether effective internal control over financial reporting was maintained in all material respects. Our audit included obtaining an understanding of internal control over financial reporting, assessing the risk that a material weakness exists, testing and evaluating the design and operating effectiveness of internal control based on the assessed risk, and performing such other procedures as we considered necessary in the circumstances. We believe that our audit provides a reasonable basis for our opinion.
A company’s internal control over financial reporting is a process designed by, or under the supervision of, the company’s principal executive and principal financial officers, or persons performing similar functions, and effected by the company’s board of directors, management, and other personnel to provide reasonable assurance regarding the reliability of financial reporting and the preparation of financial statements for external purposes in accordance with generally accepted accounting principles. A company’s internal control over financial reporting includes those policies and procedures that (1) pertain to the maintenance of records that, in reasonable detail, accurately and fairly reflect the transactions and dispositions of the assets of the company; (2) provide reasonable assurance that transactions are recorded as necessary to permit preparation of financial statements in accordance with generally accepted accounting principles, and that receipts and expenditures of the company are being made only in accordance with authorizations of management and directors of the company; and (3) provide reasonable assurance regarding prevention or timely detection of unauthorized acquisition, use, or disposition of the company’s assets that could have a material effect on the financial statements.
Because of the inherent limitations of internal control over financial reporting, including the possibility of collusion or improper management override of controls, material misstatements due to error or fraud may not be prevented or detected on a timely basis. Also, projections of any evaluation of the effectiveness of the internal control over financial reporting to future periods are subject to the risk that the controls may become inadequate because of changes in conditions, or that the degree of compliance with the policies or procedures may deteriorate.
In our opinion, the Company maintained, in all material respects, effective internal control over financial reporting as of September 30, 2009, based on the criteria established in Internal Control—Integrated Framework issued by the Committee of Sponsoring Organizations of the Treadway Commission.
We have also audited, in accordance with the standards of the Public Company Accounting Oversight Board (United States), the consolidated financial statements as of and for the year ended September 30, 2009 of the Company and our report dated November 25, 2009, expressed an unqualified opinion on those financial statements.
/s/ Deloitte & Touche LLP
Cleveland, OH
November 25, 2009
76
Table of Contents
| Item 9B. | Other Information |
Not applicable.
PART III
| Item 10. | Directors, Executive Officers and Corporate Governance |
Incorporated by reference from the Notice of Annual Meeting and Proxy Statement for the 2010 Annual Meeting of Shareholders (the “Proxy Statement”) sections entitled “Proposal One: Election of Directors,” “Executive Compensation,” “Section 16(a) Beneficial Ownership Reporting Compliance” and “Corporate Governance.” Such information will be filed with the SEC no later than 120 days after the end of the fiscal year covered by this report.
The table below sets forth information, as of September 30, 2009, regarding our executive officers other than Messrs. Stefanski and Kobak, and Ms. Piterans.
| Name |
Title |
Age | ||
| Ralph M. Betters |
Chief Information Officer | 58 | ||
| David S. Huffman |
Chief Financial Officer | 57 | ||
| Paul J. Huml |
Chief Accounting Officer Chief Operating Officer, The Company |
50 | ||
| John P. Ringenbach |
Chief Operating Officer, The Association | 60 |
The executive officers of the Company and the Association are elected annually and hold office until their respective successors are elected or until death, resignation, retirement or removal by the board of directors.
The Business Background of Our Executive Officers
The business experience for the past five years of each of our executive officers other than Messrs. Stefanski and Kobak, and Ms. Piterans is set forth below. Unless otherwise indicated, executive officers have held their positions for the past five years.
Ralph M. Betters is the Chief Information Officer for the Association, a position he has held since 1991. Prior to joining the Association, he was an information technology principal in the consulting practice of KPMG Peat Marwick, where he was employed from 1980 until 1991. Mr. Betters has more than 30 years of experience in the technology industry.
David S. Huffman joined the Association in 1993, and has served as the Chief Financial Officer since 2000. Mr. Huffman has more than 30 years experience in the financial institutions industry, including serving as Chief Financial Officer of First American Savings Bank of Canton, Ohio, from 1989 to 1993.
Paul J. Huml joined the Association as a Vice President in 1998 and was appointed Chief Operating Officer of the Company in 2002 and Chief Accounting Officer in June 2009. Prior to joining the Association, Mr. Huml spent 10 years in the hotel industry, focusing on the areas of finance, real estate development and risk management. Mr. Huml is a certified public accountant in the state of Ohio.
John P. Ringenbach joined the Association in 1993 and serves as Chief Operating Officer. Prior to joining the Association, Mr. Ringenbach was President of Commerce Exchange Bank, where he was employed from 1987 until 1993. Mr. Ringenbach has more than 30 years experience in the financial institutions industry.
| Item 11. | Executive Compensation |
Incorporated by reference from the sections of the Proxy Statement entitled “Executive Compensation,” “Compensation Committee Report,” and “Director Compensation.” Such information will be filed with the SEC no later than 120 days after the end of the fiscal year covered by this report.
77
Table of Contents
| Item 12. | Security Ownership of Certain Beneficial Owners and Management and Related Stockholder Matters |
Incorporated by reference from the section of the Proxy Statement entitled “Security Ownership of Certain Beneficial Owners and Management.” Such information will be filed with the SEC no later than 120 days after the end of the fiscal year covered by this report.
The Company’s only equity compensation program that was not approved by shareholders is its employee stock ownership plan which was established in conjunction with our initial stock offering completed in April 2007.
The following table provides information as of September 30, 2009 regarding our 2008 Equity Incentive Plan that was approved by shareholders on May 29, 2008:
| Plan Category |
Number of Shares to be Issued Upon Exercise of Outstanding Options, Rights and Warrants |
Weighted-Average Exercise Price of Outstanding Options, Rights and Warrants |
Number of Shares Remaining Available for Future Issuance Under the Plan | |||||
| Equity Compensation Plans |
||||||||
| Approved by Stockholders |
6,309,325 | $ | 8.59 | (1) | 16,550,675 | |||
| Equity Compensation Plans |
||||||||
| Not Approved by Stockholders |
N/A | N/A | N/A | |||||
| Total |
6,309,325 | $ | 8.59 | (1) | 16,550,675 | |||
| (1) | Weighted–Average Exercise Price of Outstanding Options, Rights and Warrants is calculated using 1,701,150 shares of restricted stock awards at $0.00 and 4,608,175 shares of stock option awards at $11.76. |
| Item 13. | Certain Relationships and Related Transactions, and Director Independence |
Incorporated by reference from the sections of the Proxy Statement entitled “Certain Relationships and Related Transactions” and “Corporate Governance.” Such information will be filed with the SEC no later than 120 days after the end of the fiscal year covered by this report.
| Item 14. | Principal Accounting Fees and Services |
Incorporated by reference from the section of the Proxy Statement entitled “Fees Paid to Deloitte & Touche LLP.” Such information will be filed with the SEC no later than 120 days after the end of the fiscal year covered by this report.
PART IV
| Item 15. | Exhibits and Financial Statement Schedules |
(a)(1) Financial Statements
78
Table of Contents
REPORT OF INDEPENDENT REGISTERED PUBLIC ACCOUNTING FIRM
To the Board of Directors and Shareholders of
TFS Financial Corporation
Cleveland, OH
We have audited the accompanying consolidated statements of condition of TFS Financial Corporation and subsidiaries (the “Company”) as of September 30, 2009 and 2008, and the related consolidated statements of income, stockholders’ equity, and cash flows for each of the three years in the period ended September 30, 2009. These financial statements are the responsibility of the Company’s management. Our responsibility is to express an opinion on these financial statements based on our audits.
We conducted our audits in accordance with the standards of the Public Company Accounting Oversight Board (United States). Those standards require that we plan and perform the audit to obtain reasonable assurance about whether the financial statements are free of material misstatement. An audit includes examining, on a test basis, evidence supporting the amounts and disclosures in the financial statements. An audit also includes assessing the accounting principles used and significant estimates made by management, as well as evaluating the overall financial statement presentation. We believe that our audits provide a reasonable basis for our opinion.
In our opinion, such consolidated financial statements present fairly, in all material respects, the financial position of TFS Financial Corporation and subsidiaries as of September 30, 2009 and 2008, and the results of their operations and their cash flows for each of the three years in the period ended September 30, 2009, in conformity with accounting principles generally accepted in the United States of America.
We have also audited, in accordance with the standards of the Public Company Accounting Oversight Board (United States), the Company’s internal control over financial reporting as of September 30, 2009, based on the criteria established in Internal Control—Integrated Framework issued by the Committee of Sponsoring Organizations of the Treadway Commission and our report dated November 25, 2009 expressed an unqualified opinion on the Company’s internal control over financial reporting.
/s/ Deloitte & Touche LLP
Cleveland, OH
November 25, 2009
79
Table of Contents
TFS FINANCIAL CORPORATION AND SUBSIDIARIES
CONSOLIDATED STATEMENTS OF CONDITION
As of September 30, 2009 and 2008
(In thousands, except share data)
| 2009 | 2008 | |||||||
| ASSETS |
||||||||
| Cash and due from banks |
$ | 20,823 | $ | 57,888 | ||||
| Other interest-bearing cash equivalents |
286,223 | 74,491 | ||||||
| Cash and cash equivalents |
307,046 | 132,379 | ||||||
| Investment securities: |
||||||||
| Available for sale (amortized cost $23,065 and $30,861, respectively) |
23,434 | 31,102 | ||||||
| Held to maturity (fair value $587,440 and $820,047, respectively) |
578,331 | 817,750 | ||||||
| 601,765 | 848,852 | |||||||
| Mortgage loans held for sale (includes $40,436 measured at fair value at September 30, 2009) |
61,170 | 200,670 | ||||||
| Loans held for investment, net: |
||||||||
| Mortgage loans |
9,318,189 | 9,259,529 | ||||||
| Other loans |
7,107 | 7,599 | ||||||
| Deferred loan fees, net |
(10,463 | ) | (14,596 | ) | ||||
| Allowance for loan losses |
(95,248 | ) | (43,796 | ) | ||||
| Loans, net |
9,219,585 | 9,208,736 | ||||||
| Mortgage loan servicing assets, net |
41,375 | 41,526 | ||||||
| Federal Home Loan Bank stock, at cost |
35,620 | 35,620 | ||||||
| Real estate owned |
17,733 | 14,108 | ||||||
| Premises, equipment, and software, net |
65,134 | 68,112 | ||||||
| Accrued interest receivable |
38,365 | 46,371 | ||||||
| Bank owned life insurance contracts |
157,864 | 151,294 | ||||||
| Other assets |
53,183 | 38,783 | ||||||
| TOTAL ASSETS |
$ | 10,598,840 | $ | 10,786,451 | ||||
| LIABILITIES AND SHAREHOLDERS’ EQUITY |
||||||||
| Deposits |
$ | 8,570,506 | $ | 8,261,101 | ||||
| Borrowed funds |
70,158 | 498,028 | ||||||
| Borrowers’ advances for insurance and taxes |
48,192 | 48,439 | ||||||
| Principal, interest, and related escrow owed on loans serviced |
105,719 | 80,675 | ||||||
| Accrued expenses and other liabilities |
58,400 | 54,556 | ||||||
| Total liabilities |
8,852,975 | 8,942,799 | ||||||
| Commitments and contingent liabilities |
||||||||
| Preferred stock, $0.01 par value, 100,000,000 shares authorized, none issued and outstanding |
— | — | ||||||
| Common stock, $0.01 par value, 700,000,000 shares authorized; 332,318,750 shares issued; 308,476,400 and 316,233,550 outstanding
at September 30, 2009 and |
3,323 | 3,323 | ||||||
| Paid-in capital |
1,679,000 | 1,672,953 | ||||||
| Treasury Stock, at cost; 23,842,350 and 16,085,200 shares at September 30, 2009 and September 30, 2008, respectively |
(287,514 | ) | (192,662 | ) | ||||
| Unallocated ESOP shares |
(87,896 | ) | (93,545 | ) | ||||
| Retained earnings—substantially restricted |
456,875 | 462,190 | ||||||
| Accumulated other comprehensive loss |
(17,923 | ) | (8,607 | ) | ||||
| Total shareholders’ equity |
1,745,865 | 1,843,652 | ||||||
| TOTAL LIABILITIES AND SHAREHOLDERS’ EQUITY |
$ | 10,598,840 | $ | 10,786,451 | ||||
See accompanying notes to consolidated financial statements.
80
Table of Contents
TFS FINANCIAL CORPORATION AND SUBSIDIARIES
CONSOLIDATED STATEMENTS OF INCOME
For each of the three years in the period ended September 30, 2009
(In thousands, except share and per share data)
| 2009 | 2008 | 2007 | ||||||||
| INTEREST AND DIVIDEND INCOME: |
||||||||||
| Loans, including fees |
$ | 455,933 | $ | 486,940 | $ | 469,755 | ||||
| Investment securities available for sale |
790 | 1,721 | 2,575 | |||||||
| Investment securities held to maturity |
28,601 | 43,247 | 22,777 | |||||||
| Federal funds sold |
1 | 14,485 | 38,352 | |||||||
| Other interest and dividend earning assets |
1,897 | 3,790 | 4,266 | |||||||
| Total interest and dividend income |
487,222 | 550,183 | 537,725 | |||||||
| INTEREST EXPENSE: |
||||||||||
| Deposits |
254,491 | 328,799 | 343,511 | |||||||
| Borrowed funds |
2,656 | 1,522 | 1,012 | |||||||
| Total interest expense |
257,147 | 330,321 | 344,523 | |||||||
| NET INTEREST INCOME |
230,075 | 219,862 | 193,202 | |||||||
| PROVISION FOR LOAN LOSSES |
115,000 | 34,500 | 9,600 | |||||||
| NET INTEREST INCOME AFTER PROVISION FOR LOAN LOSSES |
115,075 | 185,362 | 183,602 | |||||||
| NON-INTEREST INCOME |
||||||||||
| Fees and service charges, net of amortization |
21,591 | 25,445 | 25,314 | |||||||
| Net gain on the sale of loans |
32,850 | 3,896 | 15 | |||||||
| Increase in and death benefits from bank owned life insurance contracts |
6,591 | 8,297 | 8,090 | |||||||
| Income (loss) on private equity investments |
(821 | ) | 3,490 | 5,431 | ||||||
| Other |
7,173 | 6,652 | 12,539 | |||||||
| Total non-interest income |
67,384 | 47,780 | 51,389 | |||||||
| NON-INTEREST EXPENSE: |
||||||||||
| Salaries and employee benefits |
78,050 | 75,919 | 72,996 | |||||||
| Marketing services |
7,116 | 14,147 | 13,528 | |||||||
| Office property, equipment, and software |
21,902 | 19,297 | 19,709 | |||||||
| Federal insurance premium |
18,918 | 5,377 | 2,401 | |||||||
| State franchise tax |
5,037 | 5,411 | 3,110 | |||||||
| Contribution to charitable foundation |
— | — | 55,000 | |||||||
| Real estate owned expense, net |
7,918 | 6,287 | 2,563 | |||||||
| Other operating expenses |
23,447 | 25,009 | 21,802 | |||||||
| Total non-interest expense |
162,388 | 151,447 | 191,109 | |||||||
| INCOME BEFORE INCOME TAXES |
20,071 | 81,695 | 43,882 | |||||||
| INCOME TAX EXPENSE |
5,676 | 27,205 | 18,271 | |||||||
| NET INCOME |
$ | 14,395 | $ | 54,490 | $ | 25,611 | ||||
| Earnings per share—basic and diluted |
$ | 0.05 | $ | 0.17 | $ | 0.10 | ||||
| Weighted average shares outstanding |
||||||||||
| Basic |
301,227,599 | 319,386,915 | 269,513,427 | |||||||
| Diluted |
301,592,405 | 319,502,094 | 269,513,427 | |||||||
See accompanying notes to consolidated financial statements.
81
Table of Contents
TFS FINANCIAL CORPORATION AND SUBSIDIARIES
CONSOLIDATED STATEMENTS OF SHAREHOLDERS’ EQUITY
For each of the three years in the period ended September 30, 2009
(In thousands)
| Accumulated other comprehensive income (loss) |
|||||||||||||||||||||||||
| Common stock |
Paid-in capital |
Treasury stock |
Unallocated common stock held by ESOP |
Retained earnings |
Unrealized gains/(losses) on securities |
Pension obligation |
Total shareholders’ equity |
||||||||||||||||||
| Balance at September 30, 2006 |
$ | — | 627,979 | — | — | 395,892 | (714 | ) | (10,563 | ) | $ | 1,012,594 | |||||||||||||
| Comprehensive income: |
|||||||||||||||||||||||||
| Net income |
— | — | — | — | 25,611 | — | — | 25,611 | |||||||||||||||||
| Change in unrealized losses on securities available for sale, net |
— | — | — | — | — | 491 | — | 491 | |||||||||||||||||
| Change in pension obligation, net |
— | — | — | — | — | — | 4,543 | 4,543 | |||||||||||||||||
| Total comprehensive income |
— | — | — | — | — | — | — | 30,645 | |||||||||||||||||
| Stock dividend of 227,118,132 shares to the mutual holding company |
2,271 | (2,271 | ) | — | — | — | — | — | — | ||||||||||||||||
| Issuance of 105,199,618 shares in the initial public offering |
1,052 | 1,041,867 | — | — | — | — | — | 1,042,919 | |||||||||||||||||
| Purchase of common stock by the ESOP |
— | — | — | (106,530 | ) | — | — | — | (106,530 | ) | |||||||||||||||
| ESOP shares committed to be released |
— | 640 | — | 5,933 | — | — | — | 6,573 | |||||||||||||||||
| Balance at September 30, 2007 |
3,323 | 1,668,215 | — | (100,597 | ) | 421,503 | (223 | ) | (6,020 | ) | 1,986,201 | ||||||||||||||
| Comprehensive Income |
|||||||||||||||||||||||||
| Net income |
— | — | — | — | 54,490 | — | — | 54,490 | |||||||||||||||||
| Change in unrealized losses on securities available for sale |
— | — | — | — | — | 380 | — | 380 | |||||||||||||||||
| Change in pension obligation |
— | — | — | — | — | — | (2,744 | ) | (2,744 | ) | |||||||||||||||
| Total comprehensive income |
— | — | — | — | — | — | — | 52,126 | |||||||||||||||||
| Purchase of treasury stock (16,085,200 shares) |
— | — | (192,662 | ) | — | — | — | — | (192,662 | ) | |||||||||||||||
| ESOP shares allocated or committed to be released |
— | 1,491 | — | 7,052 | — | — | — | 8,543 | |||||||||||||||||
| Compensation costs for stock-based plans |
— | 3,247 | — | — | — | — | — | 3,247 | |||||||||||||||||
| Dividends paid to common shareholders ($0.15 per common share) |
— | — | — | — | (13,803 | ) | — | — | (13,803 | ) | |||||||||||||||
| Balance at September 30, 2008 |
3,323 | 1,672,953 | (192,662 | ) | (93,545 | ) | 462,190 | 157 | (8,764 | ) | 1,843,652 | ||||||||||||||
| Comprehensive Income |
|||||||||||||||||||||||||
| Net income |
— | — | — | — | 14,395 | — | — | 14,395 | |||||||||||||||||
| Change in unrealized gains on securities available for sale |
— | — | — | — | — | 83 | — | 83 | |||||||||||||||||
| Change in pension obligation |
— | — | — | — | — | — | (9,399 | ) | (9,399 | ) | |||||||||||||||
| Total comprehensive income |
— | — | — | — | — | — | — | 5,079 | |||||||||||||||||
| Purchase of treasury stock (7,897,150 shares) |
— | — | (96,529 | ) | — | — | — | — | (96,529 | ) | |||||||||||||||
| ESOP shares allocated or committed to be released |
— | 1,121 | — | 5,649 | — | — | — | 6,770 | |||||||||||||||||
| Compensation costs for stock-based plans |
— | 6,399 | — | — | — | — | — | 6,399 | |||||||||||||||||
| Excess tax effect from stock-based compensation |
— | 171 | — | — | — | — | — | 171 | |||||||||||||||||
| Treasury stock allocated to restricted stock plan |
— | (1,644 | ) | 1,677 | — | (33 | ) | — | — | — | |||||||||||||||
| Dividends paid to common shareholders ($0.26 per common share) |
— | — | — | — | (19,677 | ) | — | — | (19,677 | ) | |||||||||||||||
| Balance at September 30, 2009 |
$ | 3,323 | 1,679,000 | (287,514 | ) | (87,896 | ) | 456,875 | 240 | (18,163 | ) | $ | 1,745,865 | ||||||||||||
See accompanying notes to consolidated financial statements.
82
Table of Contents
TFS FINANCIAL CORPORATION AND SUBSIDIARIES
CONSOLIDATED STATEMENTS OF CASH FLOWS
For each of the three years in the period ended September 30, 2009
(In thousands)
| 2009 | 2008 | 2007 | ||||||||||
| CASH FLOWS FROM OPERATING ACTIVITIES: |
||||||||||||
| Net income |
$ | 14,395 | $ | 54,490 | $ | 25,611 | ||||||
| Adjustments to reconcile net income to net cash provided by operating activities: |
||||||||||||
| Contribution of stock to charitable foundation |
— | — | 50,000 | |||||||||
| ESOP and stock-based compensation expense |
13,169 | 11,790 | 6,573 | |||||||||
| Depreciation and amortization |
18,504 | 8,846 | 6,878 | |||||||||
| Deferred income taxes |
(15,510 | ) | 1,106 | (22,966 | ) | |||||||
| Provision for loan losses |
115,000 | 34,500 | 9,600 | |||||||||
| Net gain on the sale of loans |
(32,850 | ) | (3,896 | ) | (15 | ) | ||||||
| Other net losses |
15,786 | 12,245 | 507 | |||||||||
| Principal repayments on and proceeds from sales of loans held for sale |
896,106 | 368,506 | 603,855 | |||||||||
| Loans originated for sale |
(754,728 | ) | (461,253 | ) | (400,331 | ) | ||||||
| Increase in and death benefits for bank owned life insurance contracts |
(6,588 | ) | (6,659 | ) | (6,368 | ) | ||||||
| Net (increase) decrease in interest receivable and other assets |
11,578 | 2,495 | (11,909 | ) | ||||||||
| Net increase (decrease) in accrued expenses and other liabilities |
(4,197 | ) | 11,487 | 14,815 | ||||||||
| Other |
1,352 | (4,654 | ) | (2,809 | ) | |||||||
| Net cash provided by operating activities |
272,017 | 29,003 | 273,441 | |||||||||
| CASH FLOWS FROM INVESTING ACTIVITIES: |
||||||||||||
| Loans originated |
(4,027,882 | ) | (2,947,333 | ) | (2,357,269 | ) | ||||||
| Principal repayments on loans |
2,550,830 | 1,377,465 | 1,449,452 | |||||||||
| Proceeds from sales, principal repayments and maturities of: |
||||||||||||
| Securities available for sale |
8,948 | 27,964 | 13,730 | |||||||||
| Securities held to maturity |
274,995 | 235,477 | 91,273 | |||||||||
| Proceeds from sale of: |
||||||||||||
| Loans |
1,339,799 | 373,634 | 283,478 | |||||||||
| Real estate owned |
12,880 | 10,708 | 8,998 | |||||||||
| Private equity investments |
— | — | 5,009 | |||||||||
| FHLB stock |
— | — | 40,000 | |||||||||
| Premises and equipment |
— | — | 17,549 | |||||||||
| Purchases of: |
||||||||||||
| Securities available for sale |
(1,155 | ) | (1,821 | ) | (951 | ) | ||||||
| Securities held to maturity |
(35,602 | ) | (229,456 | ) | (847,732 | ) | ||||||
| Premises and equipment |
(4,244 | ) | (5,168 | ) | (9,131 | ) | ||||||
| Death benefits on bank owned life insurance contracts |
673 | 804 | ||||||||||
| Other |
399 | 2,729 | 1,410 | |||||||||
| Net cash provided by (used in) investing activities |
118,968 | (1,155,128 | ) | (1,303,380 | ) | |||||||
| CASH FLOWS FROM FINANCING ACTIVITIES: |
||||||||||||
| Net increase in deposits |
309,405 | 119,886 | 740,138 | |||||||||
| Net proceeds from the sale of common stock |
— | — | 992,919 | |||||||||
| Loan to ESOP |
— | — | (106,530 | ) | ||||||||
| Net (decrease) increase in borrowers’ advances for insurance and taxes |
(247 | ) | 7,958 | 2,202 | ||||||||
| Net increase in principal and interest owed on loans serviced |
25,044 | 2,767 | 2,998 | |||||||||
| Net (decrease) increase in short term borrowed funds |
(497,870 | ) | 498,028 | — | ||||||||
| Borrowings (repayments) in long-term borrowed funds |
70,000 | — | (25,000 | ) | ||||||||
| Purchase of treasury shares |
(103,144 | ) | (186,047 | ) | — | |||||||
| Excess tax benefit related to stock-based compensation |
171 | — | — | |||||||||
| Dividends paid to common shareholders |
(19,677 | ) | (13,803 | ) | — | |||||||
| Net cash provided by (used in) financing activities |
(216,318 | ) | 428,789 | 1,606,727 | ||||||||
| NET INCREASE (DECREASE) IN CASH AND CASH EQUIVALENTS |
174,667 | (697,336 | ) | 576,788 | ||||||||
| CASH AND CASH EQUIVALENTS—Beginning of year |
132,379 | 829,715 | 252,927 | |||||||||
| CASH AND CASH EQUIVALENTS—End of year |
$ | 307,046 | $ | 132,379 | $ | 829,715 | ||||||
| SUPPLEMENTAL DISCLOSURE OF CASH FLOW INFORMATION: |
||||||||||||
| Cash paid for interest on deposits |
$ | 255,163 | $ | 328,133 | $ | 342,437 | ||||||
| Cash paid for interest on borrowed funds |
2,525 | 1,707 | 1,114 | |||||||||
| Cash paid for income taxes |
19,400 | 25,000 | 42,000 | |||||||||
| SUPPLEMENTAL SCHEDULES OF NONCASH INVESTING AND FINANCING ACTIVITIES: |
||||||||||||
| Transfer of loans to real estate owned |
32,412 | 26,729 | 13,955 | |||||||||
See accompanying notes to consolidated financial statements.
83
Table of Contents
TFS FINANCIAL CORPORATION AND SUBSIDIARIES
NOTES TO CONSOLIDATED FINANCIAL STATEMENTS
As of and for the years ended September 30, 2009, 2008, and 2007
(Dollars in thousands unless otherwise indicated)
1. SUMMARY OF SIGNIFICANT ACCOUNTING POLICIES
The accounting and reporting policies of TFS Financial Corporation and its subsidiaries (collectively, the Company) conform to accounting principles generally accepted in the United States of America (GAAP) and to general practices within the thrift industry. The following is a description of the significant accounting and reporting policies, which the Company follows in preparing and presenting its consolidated financial statements:
Business—TFS Financial Corporation (the Holding Company), a federally chartered stock holding company, conducts its principal activities through its wholly owned subsidiaries. The principal line of business of the Company is retail consumer banking, including mortgage lending, deposit gathering, and other insignificant financial services. Third Federal Savings and Loan Association of Cleveland, MHC (Third Federal Savings, MHC), its federally chartered mutual holding company parent, currently owns 73.63% of the outstanding shares of common stock of the Company.
The Company’s primary operating subsidiaries include Third Federal Savings and Loan Association of Cleveland (the Association or Third Federal Savings and Loan) and Third Capital, Inc. (“Third Capital”). The Association is a federal savings association, which provides retail loan and savings products to its customers in Ohio and Florida through its 39 full-service branches and 8 loan production offices. The Association also provides savings products in all 50 states and offers secured lines of credit in 18 states through its internet site. Third Capital was formed to hold non-thrift investments and subsidiaries, which include a limited liability company the purpose of which is to acquire and manage commercial real estate, a Vermont captive reinsurance company, an entity that pursues merger and acquisition opportunities for the holding companies and investments in private equity investment funds.
Principles of Consolidation—The consolidated financial statements of the Company include the accounts of the Holding Company and its wholly owned subsidiaries. Intercompany balances and transactions have been eliminated in consolidation.
Cash and Cash Equivalents—Cash and cash equivalents consist of working cash on hand, and demand and interest bearing deposits at other financial institutions with maturities of three months or less. For purposes of reporting cash flows, cash and cash equivalents also includes federal funds sold. The Company has acknowledged informal agreements with banks where it maintains deposits. Under these agreements, service fees charged to the Company are waived provided certain average compensating balances are maintained throughout each month.
Earnings per Share—Basic earnings per share is computed by dividing net income (loss) by the weighted average shares of common stock outstanding. Outstanding shares include shares sold to subscribers, shares held by the Third Federal Foundation, shares of the Employee Stock Ownership Plan which have been allocated or committed to be released for allocation to participants, and shares held by Third Federal Savings, MHC.
Diluted earnings per share is computed using the same method as basic earnings per share, but reflects the potential dilution, if any, of unexercised stock options and unvested shares of restricted stock units that could occur if stock options were exercised and restricted stock units were issued and converted into common stock. These potentially dilutive shares would then be included in the weighted average number of shares outstanding for the period using the treasury stock method. At September 30, 2009 and 2008, potentially dilutive shares include stock options and restricted stock units issued through stock-based compensation plans. At September 30, 2007, no dilutive securities were outstanding.
84
Table of Contents
Investment Securities—Securities held to maturity are securities that the Company has the positive intent and the ability to hold to maturity; these securities are reported at amortized cost and adjusted for unamortized premiums and discounts. Securities held for trading are securities that are bought and held principally for the purpose of selling in the near term; these securities are reported at fair value, with unrealized gains and losses reported in current earnings. All other securities are classified as available for sale. Securities held as available for sale are reported at fair value, with unrealized gains and losses, net of tax, reported as a component of accumulated other comprehensive income (“AOCI”). Management determines the appropriate classification at the time of purchase.
Gains and losses on the sale of investment and mortgage-backed securities available for sale and trading are computed on a specific identification basis. Purchases and sales of securities are accounted for on a trade-date or settlement-date, depending on the settlement terms.
A decline in the fair value of any available for sale or held to maturity security below cost that is deemed to be other than temporary results in a reduction in the carrying amount to fair value. The impairment loss is recorded in Non-interest income as a securities loss and a new cost basis is established. To determine whether an impairment is other than temporary, the Company considers, among other things, the duration and extent to which the fair value of an investment is less than its cost, changes in value subsequent to year end, forecasted performance of the issuer, and whether the Company has the ability and intent to hold the investment until market price recovery.
Premiums and discounts are amortized using the level-yield method.
Premises, Equipment, and Software—Depreciation and amortization of premises, equipment and software is computed on a straight-line basis over the estimated useful lives of the related assets. Estimated lives are 20 to 50 years for office facilities and 3 to 10 years for equipment and software. Amortization of leasehold improvements is computed on a straight-line basis over the lesser of the lease term or the life of the related asset.
Impairment of Long-Lived Assets—Long-lived assets, consisting of premises, equipment and software, are reviewed for impairment whenever events or changes in circumstances indicate that the carrying amount of an asset may not be recoverable. Recoverability of assets to be held and used is measured by a comparison of the carrying amount of an asset to future net cash flows expected to be generated by the asset. If such assets are considered to be impaired, the impairment to be recognized is measured by the amount by which the carrying amount of the assets exceeds the recovery amount or estimated fair value of the assets. No events or changes in circumstances have occurred causing management to evaluate the recoverability of the Company’s long-lived assets.
Taxes on Income—Deferred tax assets and liabilities are recognized for the future tax consequences attributable to differences between the financial statement carrying amounts of existing assets and liabilities and their respective tax bases. Deferred tax assets and liabilities are measured using enacted tax rates expected to apply to taxable income in the years in which those temporary differences are expected to be recovered or settled. The effect on deferred tax assets and liabilities of a change in tax rates is recognized in income in the period that includes the enactment date.
Allowance for Loan Losses—The adequacy of the allowance for loan losses is evaluated periodically by management based upon the overall portfolio composition, a review of individual loans, historical and anticipated loss experience, and general market conditions. While management uses the best information available to make these evaluations, future adjustments to the allowance may be necessary if economic conditions change substantially from the assumptions used in making the evaluations. Future adjustments to the allowance may also be required by regulatory examiners based on their judgments about information available to them at the time of their examination. The allowance for loan losses is increased by charges to income and decreased by charge-offs (net of recoveries). Management believes the allowance is adequate.
85
Table of Contents
A loan is considered impaired, and individually evaluated for impairment, when, based on current information and events, it is probable that the Company will be unable to collect the scheduled payments of principal and interest according to the contractual terms of the original loan agreement. Impairment is measured based on the fair value of the collateral less costs to sell when, due to the delinquency status or other adverse condition, it is probable that the sole source of repayment for the loan is the underlying collateral. Impairment is measured based on the present value of expected future cash flows at a loan’s effective interest rate when the terms of a loan have been modified in a troubled debt restructuring. If a loan is impaired, a portion of the allowance is allocated to that loan, equal to the excess of the loan’s carrying value over the fair value of the collateral or the excess of the loan’s carrying value over the present value of expected future cash flows.
Beginning June 30, 2008 and at each quarter end thereafter, the Company expanded the population of loans that it individually evaluates for impairment to include equity lines of credit 90 or more days past due. Beginning September 30, 2008, the Company expanded the loan level evaluation to include all other residential loans and equity loans 180 or more days past due. Loans that are not individually evaluated for impairment are included in large groups of smaller balance homogenous loans which are collectively evaluated by portfolio for impairment. As more delinquent loans are subjected to individual evaluation, the portion of the allowance for loan losses allocated to specific loans increases.
Loans are placed in nonaccrual status when they are contractually 90 days or more past due. Accrued interest on these past-due loans is reversed by a charge to interest income and income is subsequently recognized only to the extent cash payments are received. The loan is returned to accrual status, when, in management’s judgment, the borrower’s ability to make periodic interest and principal payments is back to normal.
Real estate secured loans are charged off when: 1) we accept less than full payment as satisfaction for a loan; 2) a foreclosure action is completed and the fair value of the collateral received is not sufficient to satisfy the loan; or 3) management concludes the costs of foreclosure exceed the potential recovery. Equity lines of credit are charged off in a manner similar to real estate loans except that management may not wait until a foreclosure action brought by a third party is complete before determining that the collateral is not sufficient to satisfy the loan.
Real Estate Owned—Real estate owned represents real estate acquired through foreclosure or deed in lieu of foreclosure and is initially recorded at the lower of cost (carrying value of former mortgage loan) or fair value less estimated selling costs. Management performs periodic valuations, and a charge to operations is recorded if the carrying value of a property subsequently exceeds its estimated fair value less estimated selling costs. Costs related to holding and maintaining the property are charged to expense.
Loans and Related Fees—Loans originated with the intent to hold into the foreseeable future are carried at unpaid principal balances less the allowance for loan losses and net deferred origination fees. Interest on loans is accrued and credited to income as earned.
Loan fees and certain direct loan origination costs are deferred and recognized as an adjustment to interest income using the level-yield method over the contractual lives of related loans, if the loans are held for investment. If the loans are held for sale, net deferred fees (costs) are not amortized, but rather are recognized when the related loans are sold.
Mortgage Banking Activity—Mortgage loans originated and intended for sale in the secondary market are carried at the lower of cost or estimated fair value in the aggregate. Mortgage loans included in pending securitization contracts are carried at fair value. Fair value is based on quoted secondary market pricing for loan portfolios with similar characteristics and includes consideration of deferred fees (costs). Net unrealized gains, on loans carried at fair value, and losses are recognized in a valuation allowance by charges to income.
The Company retains servicing on loans that are sold and recognizes an asset for mortgage loan servicing rights based on the fair value of the servicing rights. Mortgage loan servicing rights are reported net of
86
Table of Contents
accumulated amortization, which is recorded in proportion to, and over the period of, estimated net servicing revenues. The impairment analysis is based on predominant risk characteristics of the loans serviced, such as type, fixed and adjustable rate loans, original terms and interest rates. Fair values are estimated using discounted cash flows based on current interest rates and prepayment assumptions, and impairment is monitored periodically. The amount of impairment recognized is the amount by which the mortgage loan servicing assets exceed their fair value. The Company monitors prepayments and changes amortization of mortgage servicing assets accordingly. Mortgage loan servicing rights are recorded at the lower of cost or fair value.
Servicing fee income net of amortization and other loan fees collected on loans serviced for others are included in Fees and service charges, net of amortization on the financial statements.
Derivative Instruments—The Company enters into certain transactions, referred to as, forward commitments, for the sale of mortgage loans principally to protect against the risk of adverse interest rate movements on the value of those assets. The Company recognizes the fair value of the contracts when the characteristics of those contracts meet the definition of a derivative. These derivatives are not designated in a hedging relationship; therefore, gains and losses are recognized immediately in the statement of income.
The Company enters into commitments to originate loans, which when funded, will be classified as held for sale. Such commitments meet the definition of a derivative and are not designated in a hedging relationship; therefore, gains and losses are recognized immediately in the statement of income.
Private Equity Investments—Private equity investments are funds managed by third parties. Each fund is diversified according to the terms of the fund’s agreement and the general partner’s direction. These investments, which are not publicly traded, are initially valued at cost and subsequent changes are recorded at fair value. Fair value estimates are based upon currently available information and may not represent amounts that will ultimately be realized, which will depend on future events and circumstances. At September 30, 2009 and 2008, the fair value of private equity investments included in Other Assets was $4,706 and $6,292, respectively. The income (loss) related to these investments and changes in fair value estimates of $(821), $3,490, and $6,295 for 2009, 2008, and 2007, respectively, are reported in Non-interest Income.
Deposits—Interest on deposits is accrued and charged to expense monthly and is paid or credited in accordance with the terms of the accounts.
Accumulated Other Comprehensive Loss—Accumulated other comprehensive loss consists of pension liability adjustments and gains (losses) on securities available for sale, net of the related tax effects.
Goodwill—The excess of purchase price over the fair value of net assets of acquired companies is classified as goodwill and reported in Other Assets. Goodwill was $9,732 at September 30, 2009 and 2008. Goodwill is reviewed for impairment on an annual basis as of September 30. No impairment was identified as of September 30, 2009.
Treasury Stock—Acquisitions of treasury stock are recorded at cost using the cost method of accounting. Repurchases may be made through open market purchases, block trades, and in negotiated private transactions, subject to the availability of stock, general market conditions, the trading price of the stock, alternative uses for capital, and the Company’s financial performance. Repurchased shares will be available for general corporate purposes.
Share-Based Compensation—Compensation expense for awards of equity instruments is recognized on a straight-line basis over the requisite service period based on the grant date fair value estimated in accordance with the provisions of Financial Accounting Standards Board (“FASB”) Accounting Standards Codification (“ASC”) 718 “Compensation—Stock Compensation”. Share-based compensation expense is included in Salaries and employee benefits in the consolidated statements of income.
87
Table of Contents
The grant date fair value of stock options is estimated using the Black-Scholes option-pricing model using assumptions for the expected option term, expected stock price volatility, risk-free interest rate, and expected dividend yield. Due to limited historical data on exercise of share options, the simplified method is used to estimate expected option term.
Reclassification—Certain reclassifications have been made in the consolidated financial statements for 2008 and 2007 to conform to the classification presented in 2009.
Use of Estimates—The preparation of financial statements in conformity with GAAP requires management to make estimates and assumptions that affect the reported amounts of assets and liabilities at the date of the financial statements and the reported amounts of revenues and expenses during the reporting period. Actual results could differ from these estimates.
Subsequent Events—Management has evaluated the events and transactions through November 25, 2009, the date the consolidated financial statements were issued, for potential recognition or disclosure herein.
2. STOCK TRANSACTIONS
The Holding Company completed its initial public stock offering on April 20, 2007 and sold 100,199,618 shares, or 30.16% of its post-offering outstanding common stock, to subscribers in the offering. Third Federal Savings, MHC, the Company’s mutual holding company parent, holds 227,119,132 shares of the Holding Company’s outstanding common stock. Additionally, the Association contributed $5,000 in cash and the Holding Company issued 5,000,000 shares of common stock, or 1.50% of its post-offering outstanding common stock, to Third Federal Foundation, resulting in a pre-tax Non-interest expense charge of $55,000, which was recorded in the quarter ended June 30, 2007. Net proceeds from the initial offering, after the loan to ESOP, were $886,388.
On December 15, 2008, the Board of Directors approved a third share repurchase program which authorized the repurchase of up to 2,200,000 shares of the Company’s outstanding common stock. The third repurchase program was completed on March 9, 2009. On March 12, 2009, the Board of Directors approved a fourth repurchase program authorizing the repurchase of up to an additional 3,300,000 shares of the Company’s outstanding common stock. During the year ended September 30, 2009, the Company purchased 7,897,150 shares at a cost of $96,529, or approximately $12.22 per share. Of the shares purchased through September 30, 2009, 140,000 shares were allocated to fund the restricted stock portion of the Company’s 2008 Equity Incentive Plan. At September 30, 2009, there are 2,317,650 shares remaining to be purchased under the fourth repurchase program. The Company previously repurchased 20,800,000 shares of the Company’s common stock as part of the first and second, Board of Directors approved, share repurchase programs.
3. REGULATORY CAPITAL
The Association is subject to various regulatory capital requirements administered by the federal banking agencies. Failure to meet minimum capital requirements can initiate certain mandatory and possibly additional discretionary actions by regulators that, if undertaken, could have a direct material effect on the financial statements of the Association. Under capital adequacy guidelines and the regulatory framework for prompt corrective action, the Association must meet specific capital guidelines that involve quantitative measures of its assets, liabilities, and certain off-balance-sheet items as calculated under regulatory accounting practices. The capital amounts and classifications are also subject to qualitative judgments by the regulators about components, risk weightings, and other factors.
Quantitative measures established by regulation to ensure capital adequacy require the Association to maintain minimum amounts and ratios (set forth in the table below) of total and Tier I capital (as defined in the regulations) to risk-weighted assets (as defined), Core capital (as defined) to adjusted assets (as defined), and Tangible capital (as defined) to tangible assets. Management believes that, as of September 30, 2009, the Association met all capital adequacy requirements to which it is subject.
88
Table of Contents
The most recent notification from the Office of Thrift Supervision categorized the Association as well capitalized under the regulatory framework for prompt corrective action. To be categorized as well capitalized, an institution must maintain minimum total risk-based, Tier I risk-based and Core capital leverage ratios as set forth in the table. There are no conditions or events since that notification that management believes have changed the categories of the Association.
The following table summarizes the actual capital amounts and ratios of the Association as of September 30, 2009 and 2008, compared to the minimum capital adequacy requirements and the requirements for classification as a well capitalized institution.
| Actual | Minimum Requirements | |||||||||||||||||
| For Capital Adequacy Purposes |
To be “Well Capitalized” Under Prompt Corrective Action Provision |
|||||||||||||||||
| Amount | Ratio | Amount | Ratio | Amount | Ratio | |||||||||||||
| September 30, 2009: |
||||||||||||||||||
| Total Capital to Risk-Weighted Assets |
$ | 1,383,896 | 18.19 | % | $ | 608,514 | 8.00 | % | $ | 760,643 | 10.00 | % | ||||||
| Core Capital to Adjusted Tangible Assets |
1,315,583 | 12.48 | 421,651 | 4.00 | 527,064 | 5.00 | ||||||||||||
| Tangible Capital to Tangible Assets |
1,315,583 | 12.48 | 158,119 | 1.50 | N/A | N/A | ||||||||||||
| Tier 1 Capital to Risk-Weighted Assets |
1,315,583 | 17.30 | N/A | N/A | 456,386 | 6.00 | ||||||||||||
| September 30, 2008: |
||||||||||||||||||
| Total Capital to Risk-Weighted Assets |
$ | 1,314,121 | 17.55 | % | $ | 599,091 | 8.00 | % | $ | 748,864 | 10.00 | % | ||||||
| Core Capital to Adjusted Tangible Assets |
1,293,161 | 12.05 | 429,258 | 4.00 | 536,572 | 5.00 | ||||||||||||
| Tangible Capital to Tangible Assets |
1,293,161 | 12.05 | 160,972 | 1.50 | N/A | N/A | ||||||||||||
| Tier 1 Capital to Risk-Weighted Assets |
1,293,161 | 17.27 | N/A | N/A | 449,318 | 6.00 | ||||||||||||
The following table reconciles the Association’s total capital under GAAP to regulatory capital amounts as of September 30, 2009 and 2008.
| 2009 | 2008 | |||||||
| Total capital as reported under GAAP |
$ | 1,306,643 | $ | 1,293,384 | ||||
| Goodwill |
(4,848 | ) | (4,848 | ) | ||||
| Reduction to mortgage loan servicing assets |
(4,138 | ) | (4,153 | ) | ||||
| AOCI related to pension obligation |
18,163 | 8,763 | ||||||
| Other |
(237 | ) | 15 | |||||
| Total core, tangible and tier 1 capital |
1,315,583 | 1,293,161 | ||||||
| Allowable allowance for loan losses |
68,313 | 20,960 | ||||||
| Total risk based capital |
$ | 1,383,896 | $ | 1,314,121 | ||||
There were no dividends paid to the Company during the year ended September 30, 2009. On September 29, 2008, the Association paid a dividend of $100,000 to the Company, which immediately reduced the Association’s Total, Core, Tangible and Tier 1 capital by that amount. No dividends were paid to the Company by Third Capital during the years ended September 30, 2009 and 2008.
89
Table of Contents
4. INVESTMENT SECURITIES
Investments available for sale are summarized as follows:
| September 30, 2009 | |||||||||||||
| Amortized Cost |
Gross Unrealized |
Fair Value | |||||||||||
| Gains | Losses | ||||||||||||
| U.S. government and agency obligations |
$ | 9,000 | $ | 333 | $ | — | $ | 9,333 | |||||
| Real estate mortgage investment conduits (REMICs) |
5,017 | 41 | (5 | ) | 5,053 | ||||||||
| Other |
9,048 | — | — | 9,048 | |||||||||
| $ | 23,065 | $ | 374 | $ | (5 | ) | $ | 23,434 | |||||
| September 30, 2008 | |||||||||||||
| Amortized Cost |
Gross Unrealized |
Fair Value | |||||||||||
| Gains | Losses | ||||||||||||
| U.S. government and agency obligations |
$ | 8,997 | $ | 216 | $ | — | $ | 9,213 | |||||
| Fannie Mae Certificates |
483 | — | (5 | ) | 478 | ||||||||
| REMICs |
13,488 | 49 | (19 | ) | 13,518 | ||||||||
| Other |
7,893 | — | — | 7,893 | |||||||||
| $ | 30,861 | $ | 265 | $ | (24 | ) | $ | 31,102 | |||||
Investment securities held to maturity are summarized as follows:
| September 30, 2009 | |||||||||||||
| Amortized Cost |
Gross Unrealized |
Fair Value | |||||||||||
| Gains | Losses | ||||||||||||
| Freddie Mac certificates |
$ | 8,023 | $ | 422 | $ | — | $ | 8,445 | |||||
| Ginnie Mae certificates |
7,161 | 329 | — | 7,490 | |||||||||
| REMICs |
552,792 | 8,947 | (1,331 | ) | 560,408 | ||||||||
| Fannie Mae certificates |
10,355 | 742 | — | 11,097 | |||||||||
| $ | 578,331 | $ | 10,440 | $ | (1,331 | ) | $ | 587,440 | |||||
| September 30, 2008 | |||||||||||||
| Amortized Cost |
Gross Unrealized | Fair Value | |||||||||||
| Gains | Losses | ||||||||||||
| Freddie Mac certificates |
$ | 9,826 | $ | 36 | $ | — | $ | 9,862 | |||||
| Ginnie Mae certificates |
8,366 | 116 | (1 | ) | 8,481 | ||||||||
| REMICs |
787,699 | 7,582 | (5,719 | ) | 789,562 | ||||||||
| Fannie Mae certificates |
11,859 | 326 | (43 | ) | 12,142 | ||||||||
| $ | 817,750 | $ | 8,060 | $ | (5,763 | ) | $ | 820,047 | |||||
There were no sales from the investment securities available for sale portfolio or the investment securities held-to-maturity portfolio during the years ended September 30, 2009, 2008 and 2007.
90
Table of Contents
Gross unrealized losses on securities and the estimated fair value of the related securities, aggregated by investment category and length of time the individual securities have been in a continuous loss position, at September 30, 2009 and 2008, were as follows:
| September 30, 2009 | ||||||||||||||||||
| Less Than 12 Months | 12 Months or More | Total | ||||||||||||||||
| Estimated Fair Value |
Unrealized Loss |
Estimated Fair Value |
Unrealized Loss |
Estimated Fair Value |
Unrealized Loss | |||||||||||||
| Available for sale— |
||||||||||||||||||
| REMICs |
$ | 1,017 | $ | 2 | $ | 909 | $ | 3 | $ | 1,926 | $ | 5 | ||||||
| Held to maturity— |
||||||||||||||||||
| REMICs |
57,326 | 196 | 120,423 | 1,135 | 177,749 | 1,331 | ||||||||||||
| Total |
$ | 58,343 | $ | 198 | $ | 121,332 | $ | 1,138 | $ | 179,675 | $ | 1,336 | ||||||
| September 30, 2008 | |||||||||||||||||||||
| Less Than 12 Months | 12 Months or More | Total | |||||||||||||||||||
| Estimated Fair Value |
Unrealized Loss |
Estimated Fair Value |
Unrealized Loss |
Estimated Fair Value |
Unrealized Loss |
||||||||||||||||
| Available for sale— |
|||||||||||||||||||||
| Fannie Mae certificates |
$ | 478 | $ | (5 | ) | $ | — | $ | — | $ | 478 | $ | (5 | ) | |||||||
| REMICs |
3,981 | (14 | ) | 1,680 | (5 | ) | 5,661 | (19 | ) | ||||||||||||
| Held to maturity— |
|||||||||||||||||||||
| Ginnie Mae certificates |
296 | (1 | ) | — | — | 296 | (1 | ) | |||||||||||||
| Fannie Mae certificates |
826 | — | 1,765 | (43 | ) | 2,591 | (43 | ) | |||||||||||||
| REMICs |
200,783 | (3,161 | ) | 71,428 | (2,558 | ) | 272,211 | (5,719 | ) | ||||||||||||
| Total |
$ | 206,364 | $ | (3,181 | ) | $ | 74,873 | $ | (2,606 | ) | $ | 281,237 | $ | (5,787 | ) | ||||||
The unrealized losses on investment securities were attributable to market rate increases. The contractual terms of U.S government and agency obligations do not permit the issuer to settle the security at a price less than the par value of the investment. The contractual cash flows of mortgage-backed securities are guaranteed by Fannie Mae, Freddie Mac and Ginnie Mae. REMICs are issued by or backed by securities issued by these governmental agencies. It is expected that the securities would not be settled at a price substantially less than the amortized cost of the investment. During the financial market upheaval of 2008, concern arose about the financial health of Fannie Mae and Freddie Mac and; therefore, the viability of the payment guarantees issued by the agencies. This market was preserved when, in September 2008, the Federal Housing Finance Agency placed Fannie Mae and Freddie Mac into conservatorship. Shortly after taking control, the U.S. Treasury Department established financing agreements to ensure Fannie Mae and Freddie Mac meet their obligations to holders of mortgage-backed securities that they have issued or guaranteed.
Since the decline in value is attributable to changes in interest rates and not credit quality and because the Association has both the intent and ability to hold such securities for the time periods necessary to recover the amortized cost, these investments are not considered other-than-temporarily impaired.
At September 30, 2009 and 2008, the carrying amount of U.S. government agency obligations pledged to secure public deposits totaled $1,650 and $1,350, respectively.
The contractual maturities of mortgage-backed securities generally exceed 20 years; however, the effective lives are expected to be shorter due to anticipated prepayments. At September 30, 2009, the amortized cost and fair value of other investment securities available for sale due in one year or less are $2,000 and $2,004, respectively. The amortized cost and fair value of other investment securities available for sale due in one year to five years at September 30, 2009 are $7,000 and $7,328, respectively. There are no other investment securities held to maturity at September 30, 2009.
91
Table of Contents
5. LOANS AND ALLOWANCE FOR LOAN LOSS
Loans held for investment consist of the following:
| September 30 | ||||||||
| 2009 | 2008 | |||||||
| Real estate loans: |
||||||||
| Residential non-Home Today |
$ | 5,990,283 | $ | 6,399,492 | ||||
| Residential Home Today |
291,692 | 303,153 | ||||||
| Equity loans and lines of credit |
2,983,003 | 2,488,054 | ||||||
| Construction |
94,287 | 115,323 | ||||||
| Real estate loans |
9,359,265 | 9,306,022 | ||||||
| Consumer loans: |
||||||||
| Auto |
35 | 1,044 | ||||||
| Loans on savings |
5,295 | 6,071 | ||||||
| Other |
1,777 | 484 | ||||||
| Consumer loans |
7,107 | 7,599 | ||||||
| Less: |
||||||||
| Deferred loan fees—net |
(10,463 | ) | (14,596 | ) | ||||
| Loans-in-process |
(41,076 | ) | (46,493 | ) | ||||
| Allowance for loan losses |
(95,248 | ) | (43,796 | ) | ||||
| Loans held for investment, net |
$ | 9,219,585 | $ | 9,208,736 | ||||
A large concentration of the Company’s lending is in Ohio. As of September 30, 2009 and 2008, the percentage of residential real estate loans held in Ohio were 78% and 81%, and the percentage held in Florida were 20% and 16%, respectively. As of September 30, 2009 and 2008, equity loans and lines of credit were concentrated in the states of Ohio, 40% and 44%, Florida, 28% and 29%, and California, 12% and 12%, respectively. The economic conditions and market for real estate in those states have a significant impact on the ability of borrowers in those areas to repay their loans.
Home Today is an affordable housing program targeted to benefit low- and moderate-income home buyers. Through this program, prior to March 27, 2009, the Association provided loans to borrowers who would not otherwise qualify for our loan products, generally because of low credit scores. Although the credit profiles of borrowers in the Home Today program prior to March 27, 2009 might be described as sub-prime, Home Today loans generally contain the same features as loans offered to our non-Home Today borrowers. Borrowers in the Home Today program must complete financial management education and counseling and must be referred to the Association by a sponsoring organization with which the Association has partnered as part of the program. Borrowers must also meet a minimum credit score threshold. Because prior to March 27, 2009 the Association applied less stringent underwriting and credit standards to these loans, loans originated under the Home Today program prior to that date have greater credit risk than its traditional residential real estate mortgage loans. Effective March 27, 2009, the Home Today underwriting guidelines are substantially the same as our traditional first mortgage product. The Association does not offer, and has not offered, loan products frequently considered to be designed to target sub-prime borrowers containing features such as higher fees or higher rates, interest only or negative amortization, a loan-to-value ratio greater than 100%, or option adjustable-rate mortgages.
92
Table of Contents
The Company offers equity line products and, prior to March 11, 2009, offered residential mortgage loan products where the borrower pays only interest for a portion of the loan term. These interest only loans are comprised of the following:
| September 30 | ||||||
| 2009 | 2008 | |||||
| Residential non-Home Today |
$ | 150,235 | $ | 188,643 | ||
| Equity lines of credit |
2,664,985 | 2,123,224 | ||||
| Total |
$ | 2,815,220 | $ | 2,311,867 | ||
Equity lines of credit are interest only for a maximum of ten years and convert to fully amortizing for the remaining term up to 20 years at which time they are included in the equity loan balance. Residential loans are interest only for a maximum of five years and convert to fully amortizing for the remaining term up to 30 years.
Activity in the allowance for loan losses is summarized as follows:
| Year Ended September 30 | ||||||||||||
| 2009 | 2008 | 2007 | ||||||||||
| Balance—beginning of year |
$ | 43,796 | $ | 25,111 | $ | 20,705 | ||||||
| Provision charged to income |
115,000 | 34,500 | 9,600 | |||||||||
| Charge-offs |
(63,970 | ) | (16,075 | ) | (5,738 | ) | ||||||
| Recoveries |
422 | 260 | 544 | |||||||||
| Balance—end of year |
$ | 95,248 | $ | 43,796 | $ | 25,111 | ||||||
At September 30, 2009 and 2008, nonaccrual loans, which consisted of residential real estate loans and equity lines of credit amounted to $255,745 and $172,886, respectively. The amount of interest that would have been recorded under the original terms for the loans classified nonaccrual was $4,641, $2,849 and $561 for 2009, 2008, and 2007, respectively. Amounts actually collected and recorded as interest income for these loans were not material.
We assess the allowance for loan losses on a quarterly basis and make provisions for loan losses in order to maintain the allowance at a level we feel is sufficient to absorb credit losses in the portfolio. In light of the recent housing market deterioration, the further unfavorable trending of our delinquency statistics and the current instability in employment and economic prospects, beginning in June 2008 and at each quarter end thereafter, we have conducted an expanded loan level evaluation of our equity lines of credit which were delinquent 90 days or more and residential real estate loans and equity loans which were delinquent 180 days or more. This expanded evaluation supplemented, and was in addition to, our traditional evaluation procedures. Previously, these loans were part of large groups of homogenous loans which were collectively evaluated by portfolio for impairment in accordance with U.S. GAAP. Loans are charged off when we accept less than full payment as satisfaction for a loan; a foreclosure action is completed and the fair value of the collateral received is insufficient to satisfy the loan; management concludes the costs of foreclosure exceed the potential recovery; or, in the case of equity loans and lines of credit, management determines the collateral is not sufficient to satisfy the loan. As delinquencies in our portfolio identified in 2009 and 2008 have been resolved, we have experienced an increase in net charge-offs that have been applied against the allowance. We expect that, as current delinquencies in our portfolio are resolved, net charge-offs will continue at elevated levels.
In addition to loans separately evaluated for impairment based on delinquency status, loans identified by management as having significant weaknesses, such that a loss is probable, are also separately evaluated for impairment. A specific reserve is recorded to adjust each loan to its fair value based on the underlying collateral or the present value of expected future cash flows, as appropriate. The valuation is based on the fair value of the collateral when it is probable that repayment will not come from the borrower but from liquidation of the
93
Table of Contents
collateral, including but not limited to foreclosure and repossession. The average recorded investment in impaired loans, including those loans whose terms have been modified in troubled debt restructurings, was $167,578, $58,172 and $1,893 for 2009, 2008, and 2007, respectively. Interest income recognized on these loans during the time within the period that the loans were impaired was $498 for 2009 and not material for 2008 and 2007. The recorded balance of impaired loans, including those whose terms have been modified in troubled debt restructurings, is summarized as follows:
| September 30, | |||||||||
| 2009 | 2008 | 2007 | |||||||
| With specific reserves assigned to the loan balance |
$ | 109,659 | $ | 73,176 | $ | 298 | |||
| With no specific reserves assigned to the loan balance |
109,451 | 42,870 | — | ||||||
| Total |
$ | 219,110 | $ | 116,046 | $ | 298 | |||
| Average balance of impaired loans for the year |
$ | 167,578 | $ | 58,172 | $ | 1,893 | |||
| Allowance for loan losses on impaired loans |
$ | 26,904 | $ | 22,804 | $ | 283 | |||
6. MORTGAGE LOAN SERVICING ASSETS
The Company sells certain types of loans through whole loan sales and through securitizations. In each case, the Company retains a servicing interest in the loans or securitized loans. Certain assumptions and estimates are used to determine the fair value allocated to these retained interests at the date of transfer and at subsequent measurement dates. These assumptions and estimates include loan repayment rates and discount rates.
Changes in interest rates can affect the average life of loans and mortgage-backed securities and the related servicing assets. A reduction in interest rates normally results in increased prepayments, as borrowers refinance their debt in order to reduce their borrowing costs. This creates reinvestment risk, which is the risk that we may not be able to reinvest the proceeds of loan and securities prepayments at rates that are comparable to the rates we earned on the loans or securities prior to receipt of the repayment.
During 2009, 2008 and 2007, $2,224,211, $744,712 and $894,544, respectively, of mortgage loans were securitized and/or sold including accrued interest thereon. In these transactions, the Company retained residual interests in the form of mortgage loan servicing assets. During the current fiscal year, primary economic assumptions used to measure the value of the Company’s retained interests at the date of sale resulting from the completed transactions were as follows:
| Primary prepayment speed assumptions (weighted average annual rate) |
54.2 | % | |
| Weighted average life (years) |
24.8 | ||
| Amortized cost to service loans (weighted average) |
0.12 | % | |
| Weighted average discount rate |
12 | % |
94
Table of Contents
Key economic assumptions and the sensitivity of the current fair value of mortgage loan servicing assets to immediate 10% and 20% adverse changes in those assumptions are as follows:
| At September 30, 2009 |
||||
| Fair value of mortgage loan servicing assets |
$ | 56,240 | ||
| Prepayment speed assumptions (weighted average annual rate) |
24.8 | % | ||
| Impact on fair value of 10% adverse change |
$ | (2,560 | ) | |
| Impact on fair value of 20% adverse change |
$ | (4,866 | ) | |
| Estimated prospective annual cost to service loans (weighted average) |
0.12 | % | ||
| Impact on fair value of 10% adverse change |
$ | (6,005 | ) | |
| Impact on fair value of 20% adverse change |
$ | (12,010 | ) | |
| Discount rate |
12.0 | % | ||
| Impact on fair value of 10% adverse change |
$ | (1,961 | ) | |
| Impact on fair value of 20% adverse change |
$ | (3,783 | ) | |
These sensitivities are hypothetical and should be used with caution. As indicated in the table above, changes in fair value based on a 10% variation in assumptions generally cannot be extrapolated because the relationship in the change in assumption to the change in fair value may not be linear. Also, the effect of a variation in a particular assumption on the fair value of the retained interest is calculated without changing any other assumption. In reality, changes in one factor may result in changes in another (for example, increases in market interest rates may result in lower prepayments), which could magnify or counteract the sensitivities.
Servicing assets are evaluated periodically for impairment based on the fair value of those rights. Eighteen risk tranches are used in evaluating servicing rights for impairment, segregated primarily by interest rate stratum within original term to maturity categories with additional stratum for less uniform account types.
Activity in mortgage servicing assets is summarized as follows:
| Year Ended September 30, | ||||||||||||
| 2009 | 2008 | 2007 | ||||||||||
| Balance—beginning of year |
$ | 41,526 | $ | 41,064 | $ | 40,366 | ||||||
| Additions from loan securitizations/sales |
9,876 | 5,312 | 5,123 | |||||||||
| Amortization |
(9,976 | ) | (4,882 | ) | (4,410 | ) | ||||||
| Net change in valuation allowance |
(51 | ) | 32 | (15 | ) | |||||||
| Balance—end of year |
$ | 41,375 | $ | 41,526 | $ | 41,064 | ||||||
| Fair value of capitalized amounts |
$ | 56,240 | $ | 84,739 | $ | 64,500 | ||||||
The Company receives annual servicing fees ranging from 0.12% to 0.31% of the outstanding loan balances. Servicing income, net of amortization of capitalized servicing assets, included in Non-interest income, amounted to $16,504 in 2009, $21,524 in 2008 and $22,338 in 2007. The unpaid principal balance of mortgage loans serviced for others was approximately $7,497,165, $6,932,111 and $6,919,651 at September 30, 2009, 2008 and 2007, respectively.
95
Table of Contents
7. PREMISES, EQUIPMENT AND SOFTWARE, NET
Premises, equipment and software at cost are summarized as follows:
| September 30, | ||||||||
| 2009 | 2008 | |||||||
| Land |
$ | 7,459 | $ | 7,459 | ||||
| Office buildings |
70,397 | 69,578 | ||||||
| Furniture, fixtures and equipment |
32,160 | 31,959 | ||||||
| Software |
14,536 | 15,861 | ||||||
| Leasehold improvements |
9,645 | 9,395 | ||||||
| 134,197 | 134,252 | |||||||
| Less accumulated depreciation and amortization |
(69,063 | ) | (66,140 | ) | ||||
| Total |
$ | 65,134 | $ | 68,112 | ||||
During the years ended September 30, 2009, 2008 and 2007, depreciation and amortization expense on premises, equipment, and software was $6,961, $6,270 and $7,179, respectively.
The Company leases certain of its branches under renewable operating lease agreements. Future minimum payments under non-cancelable operating leases with initial or remaining terms of one year or more consisted of the following at September 30, 2009:
| Years Ending September 30, |
|||
| 2010 |
$ | 4,534 | |
| 2011 |
3,967 | ||
| 2012 |
3,669 | ||
| 2013 |
3,409 | ||
| 2014 |
2,348 | ||
| Thereafter |
7,153 | ||
During the years ended September 30, 2009, 2008 and 2007, rental expense was $5,540, $4,974 and $5,331, respectively.
The Company, as lessor, leases certain commercial office buildings. The Company anticipates receiving future minimum payments of the following as of September 30, 2009:
| Years Ending September 30, |
|||
| 2010 |
$ | 2,569 | |
| 2011 |
2,568 | ||
| 2012 |
325 | ||
During the years ended September 30, 2009, 2008, and 2007, rental income was $2,569, $2,554 and $3,768, respectively. This income appears in other Non-interest income in the accompanying statements.
8. ACCRUED INTEREST RECEIVABLE
Accrued interest receivable is summarized as follows:
| September 30, | ||||||
| 2009 | 2008 | |||||
| Investment securities |
$ | 1,856 | $ | 3,098 | ||
| Loans |
36,509 | 43,258 | ||||
| Other |
— | 15 | ||||
| Total |
$ | 38,365 | $ | 46,371 | ||
96
Table of Contents
9. DEPOSITS
Deposit account balances are summarized by interest rate as follows:
| September 30, | |||||||||||||||
| Stated Interest Rate |
2009 | 2008 | |||||||||||||
| Amount | Percent | Amount | Percent | ||||||||||||
| Negotiable order of withdrawal accounts |
0.00–1.98 | % | $ | 987,525 | 11.5 | % | $ | 1,124,572 | 13.6 | % | |||||
| Savings accounts |
0.00–2.97 | 1,227,326 | 14.3 | 1,190,698 | 14.4 | ||||||||||
| Subtotal |
2,214,851 | 25.8 | 2,315,270 | 28.0 | |||||||||||
| Certificates of deposit |
0.00–2.99 | 3,166,467 | 37.0 | 402,293 | 4.9 | ||||||||||
| 3.00–3.99 |
1,031,596 | 12.0 | 1,841,322 | 22.3 | |||||||||||
| 4.00–4.99 |
1,135,824 | 13.3 | 2,135,540 | 25.9 | |||||||||||
| 5.00–5.99 |
990,213 | 11.6 | 1,531,962 | 18.5 | |||||||||||
| 6.00–6.99 |
27,462 | 0.3 | 29,957 | 0.4 | |||||||||||
| 7.00–7.99 |
99 | 0.0 | 92 | 0.0 | |||||||||||
| 6,351,661 | 74.2 | 5,941,166 | 72.0 | ||||||||||||
| Subtotal |
8,566,512 | 100.0 | 8,256,436 | 100.0 | |||||||||||
| Accrued interest |
3,994 | 0.0 | 4,665 | 0.0 | |||||||||||
| Total deposits |
$ | 8,570,506 | 100.0 | % | $ | 8,261,101 | 100.0 | % | |||||||
At September 30, 2009 and 2008, the weighted average interest rate was 1.0% and 2.4% on savings accounts, respectively; 0.6% and 1.8% on negotiable order of withdrawal accounts, respectively; 3.3% and 4.4% on certificates of deposit, respectively; and 2.7% and 3.8% on total deposits, respectively.
The aggregate amount of certificates of deposit in denominations of $100 or more totaled approximately $1,978,476 and $1,704,667 at September 30, 2009 and 2008, respectively. Prior to October 3, 2008, amounts over $100 were not insured by the Federal Deposit Insurance Corporation except that effective April 1, 2006, federal law expanded the coverage for self-directed retirement accounts up to $250. On October 3, 2008, the Emergency Economic Stabilization Act of 2008 temporarily (until December 31, 2013) raised the base limit on federal deposit insurance coverage from $100 to $250 per depositor. The Company does not have any brokered deposits.
The scheduled maturity of certificates of deposit is as follows:
| September 30, 2009 | ||||||
| Amount | Percent | |||||
| 12 months or less |
$ | 3,189,303 | 50.3 | % | ||
| 13 to 24 months |
903,874 | 14.2 | % | |||
| 25 to 36 months |
776,227 | 12.2 | % | |||
| 37 to 48 months |
773,484 | 12.2 | % | |||
| 49 to 60 months |
249,694 | 3.9 | % | |||
| Over 60 months |
459,079 | 7.2 | % | |||
| Total |
$ | 6,351,661 | 100.0 | % | ||
97
Table of Contents
Interest expense on deposits is summarized as follows:
| Year Ended September 30, | |||||||||
| 2009 | 2008 | 2007 | |||||||
| Certificates of deposit |
$ | 229,211 | $ | 259,997 | $ | 259,685 | |||
| Negotiable order of withdrawal accounts |
9,145 | 31,231 | 66,221 | ||||||
| Savings accounts |
16,135 | 37,571 | 17,605 | ||||||
| Total |
$ | 254,491 | $ | 328,799 | $ | 343,511 | |||
10. BORROWED FUNDS
Federal Home Loan Bank (FHLB) borrowings at September 30, 2009 are summarized in the table below:
| September 30, | ||||||||||||
| 2009 | 2008 | |||||||||||
| Amount | Weighted Average Rate |
Amount | Weighted Average Rate |
|||||||||
| Maturing in: |
||||||||||||
| 2010 |
$ | 6,000 | 2.24 | % | $ | 498,000 | 2.00 | % | ||||
| 2011 |
9,000 | 1.81 | % | |||||||||
| 2012 |
7,000 | 2.53 | % | |||||||||
| 2013 |
7,000 | 2.77 | % | |||||||||
| 2014 |
31,000 | 2.99 | % | |||||||||
| 2016 |
10,000 | 3.27 | % | |||||||||
| Total FHLB Advances |
70,000 | 2.75 | % | 498,000 | 2.00 | % | ||||||
| Accrued interest |
158 | 28 | ||||||||||
| Total |
$ | 70,158 | $ | 498,028 | ||||||||
The Association’s maximum borrowing capacity at the FHLB, under the most restrictive measure, was $898,455 and $997,827 respectively, at September 30, 2009 and 2008. Pursuant to collateral agreements with FHLB, advances are secured by a blanket lien on qualifying first mortgage loans. Our capacity limit for additional borrowings from the FHLB Cincinnati was $1,542,326 and $2,204,692 at September 30, 2009 and September 30, 2008, respectively, subject to satisfaction of the FHLB Cincinnati common stock ownership requirement. The terms of the advances include various restrictive covenants including limitations on the acquisition of additional debt in excess of specified levels. As of September 30, 2009, the Association was in compliance with all such covenants. The Association’s borrowing capacity at the Federal Reserve Discount Window was $399,886 at September 30, 2009.
98
Table of Contents
11. OTHER COMPREHENSIVE LOSS
The following table represents the components of other comprehensive income (loss) and the related tax effect allocated to component:
| Before Tax Amount |
Tax Effect |
Net of Tax |
||||||||||
| 2007 |
||||||||||||
| Unrealized gain/(loss) from available-for-sale securities: |
||||||||||||
| Net unrealized gain/(loss) arising during the year |
$ | 2,326 | $ | (814 | ) | $ | 1,512 | |||||
| Reclassification adjustment for realized (gains)/losses included in net income |
(1,571 | ) | 550 | (1,021 | ) | |||||||
| Net unrealized gain/(loss) from securities, net of reclassification adjustment |
755 | (264 | ) | 491 | ||||||||
| Defined benefit plan: |
||||||||||||
| Newly established net gain (loss) and prior service cost (credit) |
5,934 | (2,077 | ) | 3,857 | ||||||||
| Reclassification adjustment of prior service costs and actuarial loss included in income |
1,055 | (369 | ) | 686 | ||||||||
| Newly established net gain (loss) and prior service cost (credit), net of reclassification adjustment |
6,989 | (2,446 | ) | 4,543 | ||||||||
| Other comprehensive income |
$ | 7,744 | $ | (2,710 | ) | $ | 5,034 | |||||
| 2008 |
||||||||||||
| Unrealized gain/(loss) from available-for-sale securities: |
||||||||||||
| Net unrealized gain/(loss) arising during the year |
$ | 2,986 | $ | (1,045 | ) | $ | 1,941 | |||||
| Reclassification adjustment for realized (gains)/losses included in net income |
(2,401 | ) | 840 | (1,561 | ) | |||||||
| Net unrealized gain/(loss) from securities, net of reclassification adjustment |
585 | (205 | ) | 380 | ||||||||
| Defined benefit plan: |
||||||||||||
| Newly established net gain (loss) and prior service cost (credit) |
(4,595 | ) | 1,608 | (2,987 | ) | |||||||
| Reclassification adjustment of prior service costs and actuarial loss included in income |
374 | (131 | ) | 243 | ||||||||
| Newly established net gain (loss) and prior service cost (credit), net of reclassification adjustment |
(4,221 | ) | 1,477 | (2,744 | ) | |||||||
| Other comprehensive loss |
$ | (3,636 | ) | $ | 1,272 | $ | (2,364 | ) | ||||
| 2009 |
||||||||||||
| Unrealized gain/(loss) from available-for-sale securities: |
||||||||||||
| Net unrealized gain/(loss) arising during the year |
$ | 128 | $ | (45 | ) | $ | 83 | |||||
| Reclassification adjustment for realized (gains)/losses included in net income |
— | — | — | |||||||||
| Net unrealized gain/(loss) from securities, net of reclassification adjustment |
128 | (45 | ) | 83 | ||||||||
| Defined benefit plan: |
||||||||||||
| Newly established net gain (loss) and prior service cost (credit) |
(15,275 | ) | 5,346 | (9,929 | ) | |||||||
| Reclassification adjustment of prior service costs and actuarial loss included in income |
815 | (285 | ) | 530 | ||||||||
| Newly established net gain (loss) and prior service cost (credit), net of reclassification adjustment |
(14,460 | ) | 5,061 | (9,399 | ) | |||||||
| Other comprehensive loss |
$ | (14,332 | ) | $ | 5,016 | $ | (9,316 | ) | ||||
99
Table of Contents
12. INCOME TAXES
The components of the income tax provision are as follows:
| Year Ended September 30, | |||||||||||
| 2009 | 2008 | 2007 | |||||||||
| Current tax expense: |
|||||||||||
| Federal |
$ | 21,097 | $ | 24,863 | $ | 39,497 | |||||
| State |
89 | 1,236 | 1,740 | ||||||||
| Deferred tax expense: |
|||||||||||
| Federal |
(15,510 | ) | 1,106 | (22,966 | ) | ||||||
| State |
— | — | — | ||||||||
| Income tax provision |
$ | 5,676 | $ | 27,205 | $ | 18,271 | |||||
Reconciliation from tax at the statutory rate to the income tax provision is as follows:
| Year Ended September 30, | |||||||||
| 2009 | 2008 | 2007 | |||||||
| Tax at statutory rate |
35.0 | % | 35.0 | % | 35.0 | % | |||
| State tax, net |
0.3 | 1.0 | 2.6 | ||||||
| Insurance related amounts |
(11.4 | ) | (3.5 | ) | (6.4 | ) | |||
| Change in valuation allowance for deferred tax assets |
4.0 | (0.9 | ) | 9.1 | |||||
| General business credits |
(0.2 | ) | (0.1 | ) | (0.1 | ) | |||
| Other |
0.6 | 1.8 | 1.4 | ||||||
| Income tax provision |
28.3 | % | 33.3 | % | 41.6 | % | |||
Deferred income tax expense results from temporary differences in the recognition of revenue and expenses for tax and financial statement purposes. The sources of these differences and the tax effect of each were as follows:
| Year Ended September 30, | ||||||||||||
| 2009 | 2008 | 2007 | ||||||||||
| Charitable contribution carryforward, net |
$ | 3,118 | $ | 1,979 | $ | (12,214 | ) | |||||
| Loan loss reserve |
(17,200 | ) | 1,343 | (2,052 | ) | |||||||
| Deferred loan fees |
284 | 1,185 | 1,183 | |||||||||
| FHLB stock basis difference |
— | 486 | (10,289 | ) | ||||||||
| Mortgage servicing rights |
1,037 | 308 | 881 | |||||||||
| Property basis difference |
340 | 132 | (944 | ) | ||||||||
| ESOP plan |
(374 | ) | 4 | 811 | ||||||||
| Pending REIT dividend |
(638 | ) | (3,591 | ) | (84 | ) | ||||||
| Deferred compensation |
(1,646 | ) | (1,393 | ) | (300 | ) | ||||||
| Private equity funds |
(476 | ) | (95 | ) | (178 | ) | ||||||
| Other |
45 | 748 | 220 | |||||||||
| Deferred Income tax provision (benefit) |
$ | (15,510 | ) | $ | 1,106 | $ | (22,966 | ) | ||||
100
Table of Contents
Temporary differences between the financial statement carrying amounts and tax basis of assets and liabilities that gave rise to significant portions of net deferred taxes relate to the following:
| September 30, | ||||||||
| 2009 | 2008 | |||||||
| Deferred tax assets: |
||||||||
| Charitable contribution carryforward |
$ | 11,117 | $ | 13,435 | ||||
| Loan loss reserve |
24,547 | 7,347 | ||||||
| Deferred compensation |
4,212 | 2,565 | ||||||
| Pension liability |
9,780 | 4,719 | ||||||
| Property, equipment and software basis difference |
1,730 | 2,070 | ||||||
| Other |
1,034 | 1,496 | ||||||
| Gross deferred tax assets |
52,420 | 31,632 | ||||||
| Valuation allowance—charitable contribution carryforward |
(4,000 | ) | (3,200 | ) | ||||
| Total deferred tax assets |
48,420 | 28,432 | ||||||
| Deferred tax liabilities: |
||||||||
| FHLB stock basis difference |
7,695 | 7,695 | ||||||
| Pending REIT dividend |
6,488 | 7,126 | ||||||
| Mortgage servicing rights |
4,205 | 3,168 | ||||||
| Goodwill |
2,044 | 1,751 | ||||||
| Other |
4,458 | 5,689 | ||||||
| Total deferred tax liabilities |
24,890 | 25,429 | ||||||
| Net deferred tax asset |
$ | 23,530 | $ | 3,003 | ||||
In the accompanying statement of condition the net deferred tax asset is included in Other assets.
A valuation allowance is established to reduce the deferred tax assets if it is more likely than not that the related tax benefits will not be realized. The ultimate realization of the deferred tax assets is dependent upon the generation of future taxable income during the periods in which those temporary differences become deductible. At September 30, 2009, the Company had a charitable contribution carryforward of approximately $31,762 which expires September 30, 2012. Based upon projections of future taxable income for the periods in which the temporary difference is expected to remain deductible, management believes it is more likely than not that the Company will utilize the deferred tax asset, net of the valuation allowance of $4,000 at September 30, 2009.
Retained earnings at September 30, 2009 and 2008 includes approximately $104,861 for which no provision for federal income tax has been made. This amount represents allocations of income during years prior to 1988 to bad debt deductions for tax purposes only. These qualifying and nonqualifying base year reserves and supplemental reserves will be recaptured into income in the event of certain distributions and redemptions. Such recapture would create income for tax purposes only, which would be subject to the then current corporate income tax rate. However, recapture would not occur upon the reorganization, merger, or acquisition of the Company, nor if the Company is merged or liquidated tax-free into a bank or undergoes a charter change. If the Company fails to qualify as a bank or merges into a nonbank entity, these reserves will be recaptured into income.
The Company adopted the provisions of Accounting for Uncertainty in Income Taxes, codified within as FASB ASC 740 “Income Taxes”, on October 1, 2007. FASB ASC 740 prescribes a recognition threshold and measurement attribute for the financial statement recognition and measurement for a tax position taken or expected to be taken in a tax return. FASB ASC 740 also provides guidance on derecognition, classification, interest and penalties, accounting in interim periods, disclosure and transition. The provisions of FASB ASC 740
101
Table of Contents
are to be applied to all tax positions upon initial adoption of the standard. Tax positions must meet a more-likely-than-not recognition threshold at the effective date in order for the related tax benefit to be recognized or continue to be recognized upon adoption of FASB ASC 740. The implementation of FASB ASC 740 did not have an effect on the Company’s financial statements. As of September 30, 2009, there were no unrecognized tax benefits. The Company does not anticipate the total amount of unrecognized tax benefits to significantly change within the next 12 months. The Company recognizes interest and penalties on income tax assessments or income tax refunds, where applicable, in the financial statements as a component of its provision for income taxes. There were no amounts for interest and penalties for the years ended September 30, 2009, 2008 and 2007 and no amounts accrued at September 30, 2009 and 2008.
The Company and its subsidiaries file income tax returns in the U.S. federal jurisdiction and various state and city jurisdictions. With few exceptions we are no longer subject to federal and state income tax examinations for tax years prior to 2004. The State of Ohio has examined the Association through 2006 with no adjustment.
| 13. | EMPLOYEE BENEFIT PLANS |
Defined Benefit Plan—Third Federal Savings Retirement Plan (the Plan) is a defined benefit pension plan. Effective December 31, 2002, the Plan was amended to limit participation to employees who met the Plan’s eligibility requirements on that date. After December 31, 2002, employees not participating in the Plan, upon meeting the applicable eligibility requirements, participate in the third tier of the 401(k) Savings Plan described below. Benefits under the Plan are based on years of service and the employee’s average annual compensation. The funding policy of the Plan is consistent with the funding requirements of U.S. Federal and other governmental laws and regulations.
The following table sets forth the change in projected benefit obligation for the defined benefit plan:
| September 30, | ||||||||
| 2009 | 2008 | |||||||
| Projected benefit obligation at beginning of year |
$ | 51,735 | $ | 53,081 | ||||
| Service cost |
3,214 | 3,791 | ||||||
| Interest cost |
3,450 | 3,017 | ||||||
| Actuarial (gain)/loss |
11,212 | (6,492 | ) | |||||
| Benefits paid |
(602 | ) | (1,662 | ) | ||||
| Projected benefit obligation at end of year |
$ | 69,009 | $ | 51,735 | ||||
Changes in certain actuarial assumptions, including a lower discount rate, increased the projected benefit obligation at September 30, 2009 by $11,792.
The following table reconciles the beginning and ending balances of the fair value of plan assets and presents the funded status of the Plan recognized in the statement of condition at the September 30 measurement date:
| September 30, | ||||||||
| 2009 | 2008 | |||||||
| Fair value of plan assets at beginning of the year |
$ | 37,797 | $ | 41,096 | ||||
| Actual return on plan assets |
(1,170 | ) | (7,854 | ) | ||||
| Employer contributions |
3,100 | 6,217 | ||||||
| Benefits paid |
(602 | ) | (1,662 | ) | ||||
| Fair value of plan assets at end of year |
$ | 39,125 | $ | 37,797 | ||||
| Funded status of the plan—asset/(liability) |
$ | (29,884 | ) | $ | (13,938 | ) | ||
102
Table of Contents
At September 30, 2009 and 2008, the accumulated benefit obligation under the Plan was $55,872 and $42,875, respectively. At September 30, 2009, the fair value of plan assets was deficient by $16,747 while at September 30, 2008, the fair value of plan assets was deficient by $5,078.
The components of net periodic benefit cost recognized in the statement of income are as follows:
| September 30, | ||||||||||||
| 2009 | 2008 | 2007 | ||||||||||
| Service cost |
$ | 3,214 | $ | 3,791 | $ | 4,065 | ||||||
| Interest Cost |
3,450 | 3,017 | 2,881 | |||||||||
| Expected return on plan assets |
(2,893 | ) | (3,233 | ) | (2,898 | ) | ||||||
| Amortization of net loss |
876 | 435 | 1,115 | |||||||||
| Amortization of prior service cost |
(61 | ) | (61 | ) | (61 | ) | ||||||
| Net periodic benefit cost |
$ | 4,586 | $ | 3,949 | $ | 5,102 | ||||||
The following table sets forth the percentage of fair value of plan assets by category at the measurement date:
| September 30, | ||||||
| 2009 | 2008 | |||||
| Equity securities |
58.8 | % | 57.4 | % | ||
| Debt securities |
35.0 | 33.4 | ||||
| Real estate |
6.2 | 9.2 | ||||
| Total |
100.0 | % | 100.0 | % | ||
Asset allocation ranges have been established by broad asset categories. The ranges are designed to provide an appropriate balance between risk and return, while positioning Plan assets, over extended economic cycles, in a manner consistent with the long-term return assumptions used in measurements and valuations. For equity securities the target is 55–60% while the target for debt and real estate securities (including cash equivalents) is 40–45%.
The following additional information is provided with respect to the Plan:
| September 30, | |||||||||
| 2009 | 2008 | 2007 | |||||||
| Assumptions and dates used to determine benefit obligations: |
|||||||||
| Discount rate |
5.40 | % | 7.00 | % | 6.10 | % | |||
| Rate of compensation increase |
4.66 | 4.66 | 4.62 | ||||||
| Census date |
1/1/2009 | 1/1/2008 | 1/1/2007 | ||||||
| Assumptions used to determine net periodic benefit cost |
|||||||||
| Discount rate |
7.00 | % | 6.10 | % | 5.75 | % | |||
| Long-term rate of return on plan assets |
8.00 | 8.00 | 8.00 | ||||||
| Rate of compensation increase (graded scale) |
4.66 | 4.62 | 4.69 | ||||||
The overall expected long-term return on assets assumption has been derived based upon the average rates of earnings expected on the funds invested to provide for plan benefits. Management evaluates the historical performance of the various asset categories, as well as current expectations in determining the adequacy of the assumed rates of return in meeting Plan obligations. If warranted, the assumption is modified.
103
Table of Contents
The following table provides estimates of expected future benefit payments during each of the next five fiscal years, as well as in the aggregate for years six through ten. Additionally, the table includes the expected employer contribution during the next fiscal year:
| Expected Benefit Payments During the Fiscal Years Ending September 30: |
|||
| 2010 |
$ | 5,560 | |
| 2011 |
3,510 | ||
| 2012 |
4,180 | ||
| 2013 |
3,400 | ||
| 2014 |
4,220 | ||
| Aggregate expected benefit payments during the five fiscal year period beginning October 1, 2015, and ending September 30, 2019 |
$ | 22,610 | |
| Minimum employer contributions expected to be paid during the fiscal year ending September 30, 2010 |
$ | 3,494 | |
Effective September 30, 2006, the Company adopted the provisions of FASB ASC 715 “Compensation—Retirement Benefits” which require an employer to recognize the funded status of its Plan in the statement of financial condition by a charge to AOCI. AOCI includes the following items that have not yet been recognized as components of net periodic benefit cost as of the measurement date (There was no transition obligation at any date):
| September 30, | ||||||||||||
| 2009 | 2008 | 2007 | ||||||||||
| Net actuarial loss |
$ | 28,347 | $ | 13,947 | $ | 9,787 | ||||||
| Prior service cost (benefit) |
(404 | ) | (465 | ) | (526 | ) | ||||||
| Net amount recognized in AOCI |
$ | 27,943 | $ | 13,482 | $ | 9,261 | ||||||
The Company expects that $(61) of prior service cost (benefit) and $2,149 of net actuarial losses will be recognized as components of net periodic benefit cost during the fiscal year ended September 30, 2010.
401(k) Savings Plan—The Company maintains a 401(k) savings plan that is comprised of three tiers. The first tier allows eligible employees to contribute up to 75% of their compensation to the plan, subject to limitations established by the Internal Revenue Service, with the Company matching 100% of up to 4% on funds contributed. The second tier permits the Company to make a profit-sharing contribution at its discretion. The first and second tiers cover substantially all employees who have reached age 21 and have worked 1,000 hours in one year of service. The third tier permits the Company to make discretionary contributions allocable to eligible employees (who are not eligible for the Company’s defined benefit pension plan). Voluntary contributions made by employees are vested at all times whereas Company contributions and Company matching contributions are subject to various vesting periods which range from immediately vested to fully vesting upon five years of service.
The total of the Company’s matching and discretionary contributions related to the plan for the years ended September 30, 2009, 2008 and 2007 was $1,894, $1,814 and $1,703, respectively.
Other Deferred Compensation—The Company also maintains an Executive Retirement Benefit Plan, which provides additional retirement benefits to certain key associates, as designated by the board of directors. The total cost related to the Executive Retirement Benefit Plan was $29 in 2009, $400 in 2008, and $385 in 2007. Future contributions will consist of interest on the vested balance.
The Company also maintains several other non-qualified defined contribution plans for certain key associates. Awards granted and participation in these plans are at the discretion of the board of directors. The total expense relating to these plans amounted to $271 in 2009, $317 in 2008, and $345 in 2007.
104
Table of Contents
Employee (Associate) Stock Ownership Plan (ESOP)—The Company established an ESOP for its employees effective January 1, 2006. The ESOP is a tax-qualified plan designed to invest primarily in the Company’s common stock and provides employees with an opportunity to receive a funded retirement benefit, based primarily on the value of the Company’s common stock. The ESOP covers all eligible employees of the Company and its wholly-owned subsidiaries. Employees are eligible to participate in the ESOP after attainment of age 18, completion of 1,000 hours of service, and employment on the last day of the plan’s calendar year. Company contributions to the plan are at the discretion of the board of directors. The ESOP is accounted for in accordance with the provisions for stock compensation in FASB ASC 718. Compensation expense for the ESOP is based on the market price of the Company’s stock and is recognized as shares are committed to be released to participants. The total compensation expense related to this plan in the 2009, 2008 and 2007 fiscal year was $6,770, $8,543 and $9,092, respectively.
The ESOP was authorized to purchase, and did purchase, 11,605,824 shares of the Company’s common stock at a price of $10 per share with a 2006 plan year cash contribution and the proceeds of a loan from the Company to the ESOP. The outstanding loan principal balance as of September 30, 2009 and 2008 was $89,936 and $95,061, respectively. Shares of the Company’s common stock pledged as collateral for the loan are released from the pledge for allocation to participants as loan payments are made. At September 30, 2009, 2,409,929 shares have been allocated to participants and 406,313 shares were committed to be released. Shares that are committed to be released will be allocated to participants at the end of the plan year (December 31). ESOP shares that are unallocated or not yet committed to be released totaled 8,789,582 at September 30, 2009, and had a fair market value of $104,596.
14. EQUITY INCENTIVE PLAN
At a special meeting of shareholders held on May 29, 2008, shareholders of the Company approved the TFS Financial Corporation 2008 Equity Incentive Plan (the Equity Plan). On August 11, 2008, certain officers and employees of the Company were granted an aggregate of 4,133,575 options to purchase our common stock and certain officers, employees and directors of the Company received an aggregate of 1,780,950 shares of restricted stock units. The Company adopted the provisions related to share-based compensation in FASB ASC 718 and FASB ASC 505, upon approval of the Equity Plan, and began to expense the fair value of all share-based compensation granted over the requisite service periods.
During the year ended September 30, 2009, the Compensation and Benefits Committee approved the issuance of an additional 474,600 stock options and 60,200 restricted stock units to certain officers and an employee of the Company. The awards were made pursuant to the shareholder approved 2008 Equity Incentive Plan.
FASB ASC 718 requires the Company to report as a financing cash flow the benefits of realized tax deductions in excess of the deferred tax benefits previously recognized for compensation expense. The excess tax benefit for 2009 was $171. There were no such excess tax benefits in fiscal 2008.
The stock options have a contractual term of ten years and vest over a three to seven year service period. The Company recognizes compensation expense for the fair values of these awards, which have installment vesting, on a straight-line basis over the requisite service period of the awards.
Restricted stock units vest over a one to ten year service period. The product of the number of units granted and the grant date market price of the Company’s common stock determines the fair value of restricted stock units under the Equity Plan. The Company recognizes compensation expense for the fair value of restricted stock units on a straight-line basis over the requisite service period.
During the years ended September 30, 2009 and 2008, the Company recorded $6,399 and $3,247, respectively, of share-based compensation expense, comprised of stock option expense of $2,257 and $523, respectively and restricted stock units expense of $4,142 and $2,721 respectively. The tax benefit recognized related to share-based compensation expense was $2,240 and $1,136 respectively.
105
Table of Contents
The following is a summary of the status of the Company’s restricted stock units as of September 30, 2009 and changes therein during the year then ended:
| Number of Shares Awarded |
Weighted Average Grant Date Fair Value | |||||
| Non-vested at October 1, 2008 |
1,780,950 | $ | 11.74 | |||
| Granted |
60,200 | 11.96 | ||||
| Vested |
(140,000 | ) | 11.74 | |||
| Forfeited |
— | — | ||||
| Non-vested at September 30, 2009 |
1,701,150 | $ | 11.75 | |||
The total fair value of restricted stock units vested during the years ended September 30, 2009 and 2008 was $1,693 and $0 respectively. Expected future compensation expense relating to the non-vested restricted stock units at September 30, 2009 is $14,557 over a weighted average period of 6.0 years.
The following is a summary of the Company’s stock option activity and related information for the Equity Plan for the year ended September 30, 2009:
| Number of Stock Options |
Weighted Average Exercise Price |
Weighted Average Remaining Contractual Life |
Aggregate Intrinsic Value | |||||||
| Outstanding at October 1, 2008 |
4,133,575 | $ | 11.74 | 9.8 | $ | 3,224 | ||||
| Granted |
474,600 | 11.96 | ||||||||
| Exercised |
— | — | ||||||||
| Forfeited |
— | — | ||||||||
| Outstanding at September 30, 2009 |
4,608,175 | $ | 11.76 | 8.9 | $ | 633 | ||||
| Exercisable at September 30, 2009 |
— | — | — | — | ||||||
| Vested or expected to vest at September 30, 2009 |
4,540,863 | $ | 11.76 | 8.9 | $ | 623 | ||||
The fair value of the option grants was estimated on the date of grant using the Black-Scholes option-pricing model with the following weighted average assumptions:
| 2009 | 2008 | |||||
| Expected dividend yield |
2.34 | % | 1.70 | % | ||
| Expected volatility |
23.00 | % | 23.22 | % | ||
| Risk-free interest rate |
2.69 | % | 3.92 | % | ||
| Expected option term |
6.5 years | 7.6 years |
The expected dividend yield was estimated based on the current annualized dividend payout of $0.28 per share, which is not expected to change. Since there is limited historical information on the volatility of the Company’s stock, management also considered the average volatilities of similar entities for an appropriate period in determining the expected volatility used in the estimation of fair value. Management estimated the expected life of the options using the simplified method allowed under SEC Staff Accounting Bulletin (SAB) 110, which expresses the views of the SEC regarding the use of a “simplified” method, as discussed in SAB No. 107. The five and six year and seven and eight year Treasury yield in effect at the time of the grant provides the risk-free rate of return for periods within the expected term of the options.
The weighted average grant date fair value of options granted during the years ended September 30, 2009 and 2008 were $2.38 and $3.10 per share, respectively. Expected future compensation expense relating to the
106
Table of Contents
non-vested options outstanding as of September 30, 2009 is $10,965 over a weighted average period of 5.21 years. Upon exercise of vested options, management expects to draw on treasury stock as the source of the shares. At September 30, 2009, the number of common shares authorized for award under the Equity Plan was 23,000,000, of which 16,550,675 shares remain available for future award.
15. COMMITMENTS AND CONTINGENT LIABILITIES
In the normal course of business, the Company enters into commitments with off-balance-sheet risk to meet the financing needs of its customers. Commitments to extend credit involve elements of credit risk and interest rate risk in excess of the amount recognized in the consolidated statements of condition. The Company’s exposure to credit loss in the event of nonperformance by the other party to the commitment is represented by the contractual amount of the commitment. The Company uses the same credit policies in making commitments as it does for on-balance-sheet instruments. Interest rate risk on commitments to extend credit results from the possibility that interest rates may have moved unfavorably from the position of the Company since the time the commitment was made.
Commitments to extend credit are agreements to lend to a customer as long as there is no violation of any condition established in the contract. Commitments generally have fixed expiration dates of 60 to 360 days or other termination clauses and may require payment of a fee. Since some of the commitments may expire without being drawn upon, the total commitment amounts do not necessarily represent future cash requirements. At September 30, 2009, the Company had commitments to originate loans as follows:
| Fixed-rate mortgage loans |
$ | 227,624 | |
| Adjustable-rate mortgage loans |
4,907 | ||
| Equity line of credit loans |
21,942 | ||
| Total |
$ | 254,473 | |
At September 30, 2009, the Company had unfunded commitments outstanding as follows:
| Equity lines of credit |
$ | 2,354,736 | |
| Construction loans |
43,136 | ||
| Private equity investments |
13,913 | ||
| Total |
$ | 2,411,785 | |
The Company provides mortgage reinsurance on certain mortgage loans in its own portfolio, including Home Today loans and loans in its servicing portfolio through contracts with two primary mortgage insurance companies. Under these contracts, the Company absorbs mortgage insurance losses in excess of a specified percentage of the principal balance of a given pool of loans, subject to a contractual limit, in exchange for a portion of the pools’ mortgage insurance premiums. At September 30, 2009, the maximum losses under the reinsurance contracts were limited to $16,285. The Company has incurred $322 of losses under these reinsurance contracts and has provided a liability for the remaining estimated losses totaling $5,846 as of September 30, 2009. Management believes it has made adequate provision for estimated losses.
In management’s opinion, the above commitments will be funded through normal operations.
At September 30, 2009 and 2008, the Company had commitments to securitize and sell mortgage loans of $40,000 and $181,095, respectively.
16. FAIR VALUE
On October 1, 2008, the Company adopted FASB ASC 820, “Fair Value Measurements” and FASB ASC 825, “The Fair Value Option for Financial Assets and Financial Liabilities,” except, as permitted under FASB ASC 820, the Company has not yet applied the provisions of FASB ASC 820 to its non-financial assets, such as
107
Table of Contents
goodwill, real estate owned, and other non-financial assets measured at fair value on a non-recurring basis. The Company will adopt the provisions for those items to which the deferral applies effective October 1, 2009 and does not expect the adoption to have a material impact on its consolidated results of operations or financial position.
FASB ASC 820 establishes a framework for measuring fair value and expands disclosure requirements related to fair value measurements. Assets and liabilities at fair value are grouped into three levels, based on the transparency of inputs and the reliability of assumptions used to estimate fair value. The three levels of inputs are defined as follows:
| Level 1 – |
quoted prices (unadjusted) for identical assets or liabilities in active markets. | |
| Level 2 – |
quoted prices for similar assets or liabilities in active markets, quoted prices for identical or similar assets or liabilities in markets with few transactions, or model-based valuation techniques using assumptions that are observable in the market. | |
| Level 3 – |
a company’s own assumptions about how market participants would price an asset or liability. |
FASB ASC 825 provides an option to elect fair value as an alternative measurement for selected financial assets and financial liabilities not previously recorded at fair value. The Company elected the fair value option for mortgage loans classified as held for sale that are subject to pending loan securitization contracts entered into on or after October 1, 2008. The election is expected to reduce volatility in earnings related to timing issues on loan securitization contracts. No transition adjustment was required to the opening balance of retained earnings because the Company, as permitted under FASB ASC 825, applied the election prospectively.
At September 30, 2009, loans held for sale subject to pending securitization contracts had a fair value of $40,436 and an aggregate outstanding principal balance of $40,000. For the twelve months ended September 30, 2009, net gain on the sale of loans includes $204 of net gains related to changes in the fair value of loans held for sale subject to pending securitization contracts that are fully offset by equal amounts of losses on the derivative securitization contracts and $509 of expected gains on these loans that would have been recorded at the time of contract settlement, in the subsequent quarter, had the fair value election not been made. Interest income on mortgage loans held for sale is recorded in interest income on loans. Mortgage loans held for sale not included in securitization contracts continue to be recorded at the lower of cost or fair value. At September 30, 2009, these loans were reported at cost of $20,734.
Presented below is a discussion of the methods and significant assumptions used by the Company to estimate fair value.
Investment Securities Available for Sale—Investment securities available for sale are recorded at fair value on a recurring basis. Fair value measurement is based on quoted prices, if available. If quoted prices are not available, management will use as part of their estimation process fair values which are obtained from third party independent nationally recognized pricing services using pricing models, quoted prices of securities with similar characteristics, or discounted cash flows. Money market accounts are classified within Level 1 of the hierarchy. Level 2 securities include U.S. Government and federal agency obligations, mortgage-backed securities guaranteed by Fannie Mae, Freddie Mac or Ginnie Mae, and REMICs.
Mortgage Loans Held for Sale—The fair value of mortgage loans held for sale is based on quoted secondary market pricing for loan portfolios with similar characteristics. Mortgage loans held for sale consist of mortgage loans subject to pending securitization contracts and mortgage loans classified as held for sale not included in securitization contracts as of the reporting date. Pursuant to FASB ASC 825, the Company elected the fair value measurement option for mortgage loans held for sale subject to pending securitization contracts. These loans are included in Level 2 of the hierarchy.
Loans Held for Investment—Loans held for investment are only subject to a fair value measurement under US GAAP when they are individually evaluated for impairment and that impairment is measured using the
108
Table of Contents
observable market price of the loan or the fair value of the collateral. Loans held for investment that have been restructured in troubled debt restructurings are individually evaluated for impairment using the present value of future cash flows based on the loan’s effective rate, which is not a fair value measurement. Impairment is measured based on the fair value of the collateral for loans the Company considers to be collateral-dependent due to a delinquency status or other adverse condition severe enough to indicate that the borrower is unable to be relied upon as the continued source of repayment. The fair value of a collateral-dependent loan is based on a recent property valuation. Property valuations are obtained from various sources, including automated valuation models, drive-by exterior appraisals, and broker price opinions. A valuation allowance is recorded by a charge to income for the excess of the carrying amount over fair value. When the fair value exceeds a loan’s carrying amount, the carrying amount is considered to approximate the fair value of that loan to the Company because contractually that is the maximum recovery the Company can expect. Loans individually evaluated for impairment based on the fair value of the collateral are included in Level 3 of the hierarchy with assets measured at fair value on a non-recurring basis.
Derivatives—Derivative instruments include interest rate locks on commitments to originate loans for the held for sale portfolio and forward commitments on contracts to deliver mortgage-backed securities. Derivatives are reported at fair value in other assets or other liabilities on the Consolidated Statement of Condition with changes in value recorded in current earnings. Fair value is estimated using quoted secondary market pricing for loan portfolios with similar characteristics. The fair value of interest rate lock commitments is adjusted by a closure rate based on the estimated percentage of commitments that will result in closed loans. Because the closure rate is a significantly unobservable assumption, interest rate lock commitments are included in Level 3 of the hierarchy. Forward commitments on contracts to deliver mortgage-backed securities are included in Level 2 of the hierarchy.
Mortgage Loan Servicing Assets—Mortgage loan servicing assets are initially recorded at fair value and subsequently amortized over the estimated period of servicing income. The servicing assets are assessed for impairment, based on fair value, on a quarterly basis using a discounted cash flow model incorporating assumptions market participants would use including estimated prepayment speeds, discount factors, and estimated costs to service. For measurement purposes, servicing assets are separated into stratum segregated primarily by the predominant risk characteristics of the loans serviced, such as type, fixed and adjustable rates, original terms, and interest rates. When the carrying value of the servicing asset for an individual stratum exceeds the fair value, the stratum is considered impaired. The amount of impairment is recognized through a valuation allowance recorded in current earnings and the stratum is included in Level 3 of the hierarchy with assets measured at fair value on a non-recurring basis.
Assets and liabilities carried at fair value on a recurring basis on the Consolidated Statement of Condition as of September 30, 2009 are summarized below.
| Fair Value Measurements at Reporting Date Using | ||||||||||||
| September 30, 2009 |
Quoted Prices in Active Markets for Identical Assets (Level 1) |
Significant Other Observable Inputs (Level 2) |
Significant Unobservable Inputs (Level 3) | |||||||||
| Assets |
||||||||||||
| Investment securities available for sale |
$ | 23,434 | $ | 9,048 | $ | 14,386 | $ | — | ||||
| Mortgage loans held for sale |
40,436 | — | 40,436 | — | ||||||||
| Derivatives |
318 | — | — | 318 | ||||||||
| Total |
$ | 64,188 | $ | 9,048 | $ | 54,822 | $ | 318 | ||||
| Liabilities |
||||||||||||
| Derivatives |
$ | 204 | $ | — | $ | 204 | $ | — | ||||
| Total |
$ | 204 | $ | — | $ | 204 | $ | — | ||||
109
Table of Contents
At September 30, 2009, $318 of derivatives was classified within Level 3 of the hierarchy, with a net gain of $327 recorded in other income for the twelve-month period ended September 30, 2009. This resulted in a $327 increase to net assets for the twelve-month period ended September 30, 2009.
Summarized in the table below are those assets measured at fair value on a nonrecurring basis. This includes certain stratum of mortgage loan servicing assets which were found to have a fair value below amortized cost and loans held for investment, other than those restructured in a troubled debt restructuring, that were individually measured for impairment at the reporting date.
| Fair Value Measurements at Reporting Date Using | ||||||||||||
| September 30, 2009 |
Quoted Prices in Active Markets for Identical Assets (Level 1) |
Significant Other Observable Inputs (Level 2) |
Significant Unobservable Inputs (Level 3) | |||||||||
| Loans held for investment, net |
$ | 149,412 | $ | — | $ | — | $ | 149,412 | ||||
| Mortgage loan servicing assets |
406 | — | — | 406 | ||||||||
| Total |
$ | 149,818 | $ | — | $ | — | $ | 149,818 | ||||
The following table presents estimated fair value of the Company’s financial instruments. The estimated fair value amounts have been determined by the Company using available market information and appropriate valuation methodologies. However, considerable judgment is required to interpret market data to develop the estimates of fair value. Accordingly, the estimates presented herein are not necessarily indicative of the amounts the Company could realize in a current market exchange. The use of different market assumptions and/or estimation methodologies may have a material effect on the estimated fair value amounts.
| September 30, | ||||||||||||
| 2009 | 2008 | |||||||||||
| Carrying Amount |
Estimated Fair Value |
Carrying Amount |
Estimated Fair Value | |||||||||
| Assets: |
||||||||||||
| Cash on hand and in banks |
$ | 20,823 | $ | 20,823 | $ | 57,888 | $ | 57,888 | ||||
| Interest bearing deposits at other financial institutions |
286,223 | 286,223 | 74,491 | 74,491 | ||||||||
| Investment securities: |
||||||||||||
| Available for sale |
23,434 | 23,434 | 31,102 | 31,102 | ||||||||
| Held to maturity |
578,331 | 587,440 | 817,750 | 820,047 | ||||||||
| Mortgage loans held for sale |
61,170 | 61,790 | 200,670 | 200,670 | ||||||||
| Loans-net: |
||||||||||||
| Mortgage loans held for investment |
9,212,478 | 9,551,261 | 9,201,137 | 9,274,720 | ||||||||
| Other loans |
7,107 | 8,182 | 7,599 | 8,784 | ||||||||
| Federal Home Loan Bank stock |
35,620 | 35,620 | 35,620 | 35,620 | ||||||||
| Private equity funds |
4,706 | 4,706 | 6,292 | 6,292 | ||||||||
| Accrued interest receivable |
38,365 | 38,365 | 46,371 | 46,371 | ||||||||
| Derivatives |
318 | 318 | 1,195 | 1,195 | ||||||||
| Liabilities: |
||||||||||||
| NOW and passbook accounts |
$ | 2,214,851 | $ | 2,214,851 | $ | 2,315,270 | $ | 2,315,270 | ||||
| Certificates of deposit |
6,355,655 | 6,553,708 | 5,945,831 | 5,990,994 | ||||||||
| FHLB advances |
70,158 | 70,112 | 498,028 | 497,991 | ||||||||
| Borrowers’ advances for taxes and insurance |
48,192 | 48,192 | 48,439 | 48,439 | ||||||||
| Principal and interest owed on loans serviced |
105,719 | 105,719 | 80,675 | 80,675 | ||||||||
| Derivatives |
204 | 204 | 9 | 9 | ||||||||
110
Table of Contents
Cash and Due from Banks, Interest Bearing Deposits at Other Financial Institutions and Federal Funds Sold—The carrying amount is a reasonable estimate of fair value.
Investment and Mortgage-Backed Securities—Estimated fair value for investment and mortgage-backed securities is based on quoted market prices at the statement of condition date.
Mortgage Loans Held for Sale—Fair value of mortgage loans held for sale is based on quoted secondary market pricing for loan portfolios with similar characteristics.
Loans—For first mortgage loans and other loans, fair value is estimated by discounting contractual cash flows adjusted for prepayment estimates using the current rates at which similar loans would be made to borrowers with similar credit ratings and for the same remaining maturities.
Federal Home Loan Bank Stock—The fair value is estimated to be the carrying value, which is par. All transactions in capital stock of the FHLB of Cincinnati are executed at par.
Private Equity Investments—Private equity investments are initially valued upon transaction price. The carrying value is subsequently adjusted when it is considered necessary based on current performance and market conditions. Private equity investments are included in Other assets in the accompanying statements of condition at fair value.
Deposits—The fair value of demand deposit accounts is the amount payable on demand at the reporting date. The fair value of fixed-maturity certificates of deposit is estimated using discounted cash flows and rates currently offered for deposits of similar remaining maturities.
FHLB Advances—Estimated fair value for FHLB advances is estimated using discounted cash flows and rates currently charged for borrowings of similar remaining maturities.
Borrowers’ Advances for Insurance and Taxes and Principal and Interest Owed on Loans Serviced—The carrying amount is a reasonable estimate of fair value.
Derivatives—Forward commitments on contracts to deliver mortgage-backed securities and commitments to originate loans to be held for sale are considered derivative investments and are carried at fair value in the accompanying financial statements. Fair value is estimated using quoted secondary market pricing for loan portfolios with similar characteristics.
Off-Balance-Sheet Lending Commitments—Fair values for off-balance sheet lending commitments are based on fees currently charged to enter into similar agreements, taking into account the remaining terms of the agreements and the counterparties’ credit standings. For fixed-rate loan commitments, fair value also considers the difference between current levels of interest rates and the committed rates. The fair value of undisbursed lines of credit is based on fees currently charged for similar agreements or on estimated cost to terminate them or otherwise settle the obligations with the counterparties at the reporting date. The carrying amount and fair value of off-balance sheet instruments is not material as of September 30, 2009 and 2008.
17. DERIVATIVE INSTRUMENTS
The Company enters into forward commitments for the sale of mortgage loans principally to protect against the risk of adverse interest rate movements on net income. The Company recognizes the fair value of the contracts when the characteristics of those contracts meet the definition of a derivative. These derivatives are not designated in a hedging relationship; therefore, gains and losses are recognized immediately in the statement of income. In addition, the Company enters into commitments to originate loans, which when funded, will be classified as held for sale. Such commitments meet the definition of a derivative and are not designated in a hedging relationship; therefore, gains and losses are recognized immediately in the statement of income. The Company had no derivatives designated as hedging instruments under FASB ASC 815 at September 30, 2009 or 2008.
111
Table of Contents
The following table provides the location within the Consolidated Statements of Condition and fair values for derivatives not designated as hedging instruments.
| Asset Derivatives | ||||||||||
| At September 30, 2009 | At September 30, 2008 | |||||||||
| Location | Fair Value | Location | Fair Value | |||||||
| Interest rate lock commitments |
Other Assets | $ | 318 | Other Assets | $ | — | ||||
| Forward commitments for the sale of mortgage loans |
Other Assets | — | Other Assets | 1,195 | ||||||
| Total |
$ | 318 | $ | 1,195 | ||||||
| Liability Derivatives | ||||||||||
| At September 30, 2009 | At September 30, 2008 | |||||||||
| Location | Fair Value | Location | Fair Value | |||||||
| Interest rate lock commitments |
Other Liabilities | $ | — | Other Liabilities | $ | 9 | ||||
| Forward commitments for the sale of mortgage loans |
Other Liabilities | 204 | Other Liabilities | — | ||||||
| Total |
$ | 204 | $ | 9 | ||||||
The following table summarizes the effect of derivative instruments not designated as hedging instruments.
| Amount of Gain or (Loss) Recognized in Income on Derivative | |||||||||||||
| Year Ended September 30, | |||||||||||||
| Location of Gain or (Loss) Recognized in Income |
2009 | 2008 | 2007 | ||||||||||
| Interest rate lock commitments |
Other income | $ | 327 | $ | (9 | ) | $ | — | |||||
| Forward commitments for the sale of mortgage loans |
Net gain on the sale of loans | (204 | ) | — | — | ||||||||
| Total |
$ | 123 | $ | (9 | ) | $ | — | ||||||
112
Table of Contents
18. PARENT COMPANY ONLY FINANCIAL STATEMENTS
The following condensed financial statements for TFS Financial Corporation (parent company only) reflect the investments in, and transactions with, its wholly-owned subsidiaries. Intercompany activity is eliminated in the consolidated financial statements.
| September 30, | ||||||||
| 2009 | 2008 | |||||||
| Statements of Condition | ||||||||
| Assets: |
||||||||
| Cash and due from banks |
$ | 93 | $ | 151 | ||||
| Investment securities—available for sale |
2,004 | 2,018 | ||||||
| Mortgage loans held for investment |
50 | 81 | ||||||
| Other loans: |
||||||||
| Demand loan due from Third Federal Savings and Loan |
304,725 | 412,160 | ||||||
| Employee Stock Ownership Plan (ESOP) loan receivable |
89,936 | 95,061 | ||||||
| Accrued interest receivable |
292 | 3,726 | ||||||
| Investments in: |
||||||||
| Third Federal Savings and Loan |
1,306,484 | 1,293,383 | ||||||
| Non-thrift subsidiaries |
71,075 | 68,851 | ||||||
| Prepaid federal and state income taxes |
321 | 1,740 | ||||||
| Deferred income taxes |
7,275 | 10,306 | ||||||
| Other assets |
7,049 | 6,413 | ||||||
| Total assets |
$ | 1,789,304 | $ | 1,893,890 | ||||
| Liabilities and shareholders’ equity: |
||||||||
| Line of credit due non-thrift subsidiary |
$ | 42,871 | $ | 42,532 | ||||
| Accrued expenses and other liabilities |
568 | 7,706 | ||||||
| Total liabilities |
43,439 | 50,238 | ||||||
| Preferred stock |
||||||||
| Common stock |
3,323 | 3,323 | ||||||
| Paid-in capital |
1,679,000 | 1,672,953 | ||||||
| Treasury stock |
(287,514 | ) | (192,662 | ) | ||||
| Unallocated ESOP shares |
(87,896 | ) | (93,545 | ) | ||||
| Retained earnings—substantially restricted |
456,875 | 462,190 | ||||||
| Accumulated other comprehensive loss |
(17,923 | ) | (8,607 | ) | ||||
| Total shareholders’ equity |
1,745,865 | 1,843,652 | ||||||
| Total liabilities and shareholders’ equity |
$ | 1,789,304 | $ | 1,893,890 | ||||
113
Table of Contents
| Years Ended September 30, | |||||||||||
| 2009 | 2008 | 2007 | |||||||||
| Statements of Income | |||||||||||
| Interest income: |
|||||||||||
| Loans, including amortization of deferred costs |
$ | 7 | $ | 8 | $ | 9 | |||||
| Demand loan due from Third Federal Savings and Loan |
903 | 14,260 | 16,764 | ||||||||
| ESOP loan |
3,914 | 7,380 | 3,925 | ||||||||
| Mortgage backed securities—available for sale |
— | — | 3 | ||||||||
| Investment securities—available for sale |
83 | 83 | 83 | ||||||||
| Other interest earning assets |
— | 4 | 8 | ||||||||
| Total interest income |
4,907 | 21,735 | 20,792 | ||||||||
| Interest expense: |
|||||||||||
| Borrowed funds from non-thrift subsidiaries |
439 | 1,093 | 1,052 | ||||||||
| Stock subscriptions |
— | — | 722 | ||||||||
| Total interest expense |
439 | 1,093 | 1,774 | ||||||||
| Net interest income |
4,468 | 20,642 | 19,018 | ||||||||
| Non-interest income: |
|||||||||||
| Intercompany service charges |
600 | 678 | 915 | ||||||||
| Other |
— | — | 1 | ||||||||
| Total other income |
600 | 678 | 916 | ||||||||
| Non-interest expenses: |
|||||||||||
| Salaries and employee benefits |
4,655 | 4,663 | 1,448 | ||||||||
| Professional services |
704 | 1,644 | 1,070 | ||||||||
| Office property and equipment |
13 | 13 | 8 | ||||||||
| Contribution to charitable foundation |
— | 1 | 49,950 | ||||||||
| Other operating expenses |
399 | 382 | 48 | ||||||||
| Total non-interest expenses |
5,771 | 6,703 | 52,524 | ||||||||
| Income (loss) before income taxes |
(703 | ) | 14,617 | (32,590 | ) | ||||||
| Income tax expense (benefit) |
(1,129 | ) | 5,082 | (6,662 | ) | ||||||
| Income (loss) before undistributed earnings of subsidiaries |
426 | 9,535 | (25,928 | ) | |||||||
| Equity in undistributed earnings of subsidiaries: |
|||||||||||
| Third Federal Savings and Loan |
11,746 | 42,884 | 46,190 | ||||||||
| Non-thrift subsidiaries |
2,223 | 2,071 | 5,349 | ||||||||
| Net income |
$ | 14,395 | $ | 54,490 | $ | 25,611 | |||||
114
Table of Contents
| Years Ended September 30, | ||||||||||||
| 2009 | 2008 | 2007 | ||||||||||
| Cash flows from operating activities |
||||||||||||
| Net income |
$ | 14,395 | $ | 54,490 | $ | 25,611 | ||||||
| Adjustments to reconcile net income to net cash provided by operating activities: |
||||||||||||
| Equity in undistributed (earnings) loss of subsidiaries: |
||||||||||||
| Third Federal Savings and Loan |
(11,746 | ) | (42,884 | ) | (46,190 | ) | ||||||
| Non-thrift subsidiaries |
(2,223 | ) | (2,071 | ) | (5,350 | ) | ||||||
| Contribution of stock to charitable foundation |
— | — | 49,950 | |||||||||
| Deferred income taxes |
3,038 | 1,303 | (12,179 | ) | ||||||||
| Stock-based compensation expense |
2,508 | 2,181 | — | |||||||||
| Net (increase) decrease in interest receivable and other assets |
4,217 | (2,999 | ) | (3,267 | ) | |||||||
| Net increase (decrease) in accrued expenses and other liabilities |
(523 | ) | (4,799 | ) | 5,826 | |||||||
| Other |
(4 | ) | (2 | ) | (3 | ) | ||||||
| Net cash provided by operating activities |
9,662 | 5,219 | 14,398 | |||||||||
| Cash flows from investing activities |
||||||||||||
| Principal collected on loans, net of originations |
31 | 4 | 5 | |||||||||
| Proceeds from principal repayments and maturities of securities available for sale |
— | — | 225 | |||||||||
| Decrease (increase) in balances lent to Third Federal Savings and Loan |
107,435 | 80,087 | (538,630 | ) | ||||||||
| Dividends from (investments in) insured thrift institution subsidiaries |
— | 100,000 | (395,470 | ) | ||||||||
| Net cash provided by (used in) investing activities |
107,466 | 180,091 | (933,870 | ) | ||||||||
| Cash flows from financing activities |
||||||||||||
| Net proceeds from sale of common stock |
— | — | 992,969 | |||||||||
| Loan to ESOP |
— | — | (106,530 | ) | ||||||||
| Principal reduction of ESOP loan |
5,125 | 11,469 | — | |||||||||
| Purchase of treasury shares |
(103,144 | ) | (186,047 | ) | — | |||||||
| Dividends paid to common stockholders |
(19,677 | ) | (13,803 | ) | — | |||||||
| Excess tax benefit related to stock-based compensation |
171 | — | — | |||||||||
| Net increase in borrowings from non-thrift subsidiaries |
339 | 3,111 | 33,034 | |||||||||
| Net cash provided by (used in) financing activities |
(117,186 | ) | (185,270 | ) | 919,473 | |||||||
| Net increase (decrease) in cash and cash equivalents |
(58 | ) | 40 | 1 | ||||||||
| Cash and cash equivalents—beginning of year |
151 | 111 | 110 | |||||||||
| Cash and cash equivalents—end of year |
$ | 93 | $ | 151 | $ | 111 | ||||||
19. EARNINGS PER SHARE
In connection with the April 2007 initial public stock offering, the Holding Company declared and distributed to Third Federal Savings, MHC a stock dividend of 227,118,132 shares which, when added to the 1,000 shares of Holding Company stock previously owned by Third Federal Savings, MHC, resulted in a total of 227,119,132 shares owned by Third Federal Savings, MHC. For purposes of computing earnings per share amounts prior to the offering date, the 227,119,132 shares currently held by Third Federal Savings, MHC are assumed to have been outstanding in all prior periods. For periods subsequent to the offering date, outstanding shares include shares held by Third Federal Savings, MHC, shares held by the Third Federal Foundation, shares held by the ESOP, and shares sold to subscribers except that shares held by the ESOP that have not been
115
Table of Contents
allocated to participants or committed to be released for allocation to participants are excluded from the computations. As of September 30, 2009, the ESOP held 8,789,582 shares that were neither allocated to participants nor committed to be released to participants.
The following is a summary of the Company’s earnings per share calculations.
| For the year ended September 30, 2009 | ||||||||
| Income | Shares | Per share amount | ||||||
| (Dollars in thousands, except per share data) | ||||||||
| Net income |
$ | 14,395 | ||||||
| Basic earnings per share: |
||||||||
| Income available to common shareholders |
$ | 14,395 | 301,227,599 | $ | 0.05 | |||
| Effect of dilutive common stock equivalents |
— | 364,806 | ||||||
| Diluted earnings per share: |
||||||||
| Income available to common shareholders |
$ | 14,395 | 301,592,405 | $ | 0.05 | |||
| For the year ended September 30, 2008 | ||||||||
| Income | Shares | Per share amount | ||||||
| (Dollars in thousands, except per share data) | ||||||||
| Net income |
$ | 54,490 | ||||||
| Basic earnings per share: |
||||||||
| Income available to common shareholders |
$ | 54,490 | 319,386,915 | $ | 0.17 | |||
| Effect of dilutive common stock equivalents |
— | 115,179 | ||||||
| Diluted earnings per share: |
||||||||
| Income available to common shareholders |
$ | 54,490 | 319,502,094 | $ | 0.17 | |||
| For the year ended September 30, 2007 | ||||||||
| Income | Shares | Per share amount | ||||||
| (Dollars in thousands, except per share data) | ||||||||
| Net Income |
$ | 25,611 | ||||||
| Basic and fully diluted earnings per share: |
||||||||
| Income attributable to common shareholders |
$ | 25,611 | 269,513,427 | $ | 0.10 | |||
20. RELATED PARTY TRANSACTIONS
The Company, through an indirect, majority-owned subsidiary, receives real estate and management services from an entity under the control of a Director. Management fees of $693, $690, and $726 were paid to the entity under the control of the Director for the years ended September 30, 2009, 2008, and 2007, respectively. In addition, a sales commission of $173 and a distribution of operating cash of $612 related to these management services were paid in the year ended September 30, 2007.
The Company has made loans and extensions of credit, in the ordinary course of business, to certain Directors. These loans were under normal credit terms, including interest rate and collateralization, and do not represent more than the normal risk of collection. The aggregate amount of loans to such related parties at September 30, 2009 and 2008 was $1,382 and $1,432, respectively. None of these loans were past due, considered impaired or on nonaccrual at September 30, 2009.
116
Table of Contents
21. RECENT ACCOUNTING PRONOUNCEMENTS
FASB ASC 105 “Generally Accepted Accounting Principles” establishes the Codification as the single source of authoritative generally accepted accounting principles (“GAAP”) in the United States except for rules and interpretive releases of the SEC, which are sources of authoritative GAAP for SEC registrants. The provisions of FASB ASC 105 were adopted for the period ending September 30, 2009 and did not have a material effect on the Company’s consolidated financial statements.
FASB ASU 2009-05 “Measuring Liabilities at Fair Value” provides additional guidance on how to measure the fair value of a liability. When a quoted price in an active market for an identical liability is not available, an entity is required to measure fair value using a valuation technique that uses the quoted price of an identical liability when traded as an asset, the quoted price for a similar liability or a similar liability when traded as an asset, or another valuation technique that is consistent with the principles of FASB ASC 820. This update is effective for interim or annual periods beginning after August 28, 2009. The Company will adopt the provisions of ASU 2009-05 on October 1, 2009 and does not expect the adoption to have a material effect on its consolidated financial statements.
FASB ASC 810-10-25 the consolidation guidance related to variable interest entities (“VIEs”) was amended to modify the approach used to evaluate VIEs and add disclosure requirements about an enterprise’s involvement with VIEs. These provisions are effective at the beginning of an entity’s annual reporting period that begins after November 15, 2009 and for interim periods within that period. The company does not expect the adoption of this consolidation guidance to have a material effect on its consolidated financial statements.
FASB ASC 860 “Transfers and Servicing” was amended to eliminate the concept of a “qualifying special-purpose entity” and change the requirements for derecognizing financial assets. The amendment requires additional disclosures intended to provide greater transparency about transfers of financial assets, including securitization transactions, and an entity’s continuing involvement in and exposure to the risks related to transferred financial assets. This updated guidance is effective for fiscal years beginning after November 15, 2009. The Company does not expect the adoption of this guidance to have a material effect on its consolidated financial statements.
FASB ASC 855-10 “Subsequent Events” establishes general standards of accounting and disclosure for subsequent events, those events that occur after the balance sheet date but before financial statements are issued or are available to be issued. FASB ASC 855-10 defines the period during which management shall evaluate events or transactions for potential recognition or disclosure in the financial statements and the circumstances under which an entity shall recognize or disclose subsequent events in the financial statements. Additionally, entities are required to disclose the date through which it has evaluated subsequent events and the basis for determining that date. The recent accounting guidance in this FASB ASC was adopted for the reporting period ending June 30, 2009 and did not have a material effect on the Company’s consolidated financial statements.
FASB ASC 825-10-65 “Financial Instruments”, FASB ASC 320-10-65 “Investments-debt and Equity Securities”, and FASB ASC 820-10-65, “Fair Value Measurements and Disclosures provide additional guidance on fair value measurements and impairments of securities. FASB ASC 825-10-65 requires that the fair value of all financial instruments be disclosed in both interim and annual reporting periods. FASB ASC 320-10-65 modifies the criteria used to assess other-than-temporary impairment (“OTTI”) of debt securities and collectability of cash flows, bifurcate the recognition of OTTI between earnings and other comprehensive income, and require expanded and more frequent disclosures about OTTI. FASB ASC 820-10-65 permits adjustments to estimated fair values of assets and liabilities when, due to a significant decrease in the volume and level of market activity or evidence that a market is not orderly, the valuation technique used does not fairly represent the price at which willing market participants would transact at the measurement date under current market conditions. In addition, FASB ASC 820-10 -65 requires disclosures about inputs and valuation techniques used to measure fair values for both interim and annual reporting periods. The recent accounting guidance in the preceding three FASB ASC’s was adopted for the reporting period ending June 30, 2009 and did not have a material effect on the Company’s consolidated financial statements.
117
Table of Contents
FASB ASC 715-20-65 “Compensation – Retirement Benefits” expands the disclosure requirements for plan assets of defined benefit pensions or other postretirement plans. For plans subject to this statement, entities are required to provide more detailed information about (1) investment policies and strategies, (2) categories of plan assets, (3) fair value measurements of plan assets, and (4) significant concentrations of risk. FASB ASC 715-20-65 is effective for fiscal years ending after December 15, 2009. The Company will adopt the provisions of this FASB ASC on October 1, 2009 and does not expect the adoption to have a material effect on the Company’s consolidated financial statements.
FASB ASC 260-10-45 “Earnings per Share” clarifies that unvested share-based payment awards that contain nonforfeitable rights to dividends or dividend equivalents are participating securities, and; therefore, need to be included in the earnings allocation in computing earnings per share under the two-class method. FASB ASC 260-10-45 is effective for financial statements issued for fiscal years beginning after December 15, 2008, and interim periods within those periods. The Company will adopt the provisions of FASB ASC 260-10-45 on October 1, 2009 and does not expect the adoption to have a material effect on its consolidated financial statements.
FASB ASC 815-10-65 “Derivatives and Hedging” expands the disclosure requirements for derivative instruments and hedging activities. For instruments subject to this FASB ASC, entities are required to disclose how and why such instruments are being used, where values, gains and losses are reported within financial statements, and the existence and nature of credit-risk-related contingent features. Additionally, entities are required to provide more specific disclosures about the volume of their derivative activity. FASB ASC 815-10-65 is effective for fiscal years and interim periods beginning after November 15, 2008. The accounting guidance in this FASB ASC was adopted on January 1, 2009 and did not have a material effect on the Company’s consolidated financial statements.
FASB ASC 820-10-65-1, “Fair Value Measurements and Disclosures” delays the effective date of FASB ASC 820 for non-recurring fair value measurements of nonfinancial assets and nonfinancial liabilities until fiscal years beginning after November 15, 2008. Pursuant to this provision, the Company will apply the provisions of FASB ASC 820 to nonfinancial assets and nonfinancial liabilities measured at fair value on a non-recurring basis beginning on October 1, 2009. The application is not expected to have a material effect on its consolidated financial statements.
FASB ASC 810-10 “Consolidation” requires that a noncontrolling interest in a subsidiary be reported as equity and the amount of consolidated net income specifically attributable to the noncontrolling interest be identified in the consolidated financial statements. It also calls for consistency in the manner of reporting changes in the parent’s ownership interest and requires fair value measurement of any noncontrolling equity investment retained in a deconsolidation. FASB ASC 810-10 is effective for fiscal years, and interim periods within those fiscal years, beginning on or after December 15, 2008. The Company will adopt the provisions of FASB ASC 810-10 on October 1, 2009 and does not expect the adoption to have a material effect on its consolidated financial statements.
FASB ASC 805, “Business Combinations” was amended to extend its applicability to all transactions and other events in which one entity obtains control over one or more other businesses. It broadens the fair value measurement and recognition of assets acquired, liabilities assumed, and interests transferred as a result of business combinations and expands required disclosures to improve the statement users’ abilities to evaluate the nature and financial effects of business combinations. The amendments to FASB ASC 805 are effective for the first annual reporting period beginning on or after December 15, 2008. The Company adopted these provisions on October 1, 2009 and does not expect the adoption to have a material effect on its consolidated financial statements.
118
Table of Contents
22. SELECTED QUARTERLY DATA (UNAUDITED)
The following tables are a summary of certain quarterly financial date for the fiscal years ended September 30, 2009 and 2008.
| Fiscal 2009 Quarter Ended | |||||||||||||
| December 31 | March 31 | June 30 | September 30 | ||||||||||
| (In thousands, except per share data) | |||||||||||||
| Interest income |
$ | 131,404 | $ | 123,894 | $ | 117,870 | $ | 114,054 | |||||
| Interest expense |
75,852 | 63,898 | 59,517 | 57,880 | |||||||||
| Net interest income |
55,552 | 59,996 | 58,353 | 56,174 | |||||||||
| Provision for loan losses |
10,000 | 28,000 | 20,000 | 57,000 | |||||||||
| Net interest income after provision for loan losses |
45,552 | 31,996 | 38,353 | (826 | ) | ||||||||
| Non-interest income |
11,931 | 17,123 | 21,527 | 16,803 | |||||||||
| Non-interest expense |
40,219 | 40,745 | 45,822 | 35,602 | |||||||||
| Earnings (loss) before income tax expense |
17,264 | 8,374 | 14,058 | (19,625 | ) | ||||||||
| Income tax expense (benefit) |
5,776 | 2,613 | 4,022 | (6,735 | ) | ||||||||
| Net earnings (loss) |
$ | 11,488 | $ | 5,761 | $ | 10,036 | $ | (12,890 | ) | ||||
| Earnings (loss) per share—basic and diluted |
$ | 0.04 | $ | 0.02 | $ | 0.03 | $ | (0.04 | ) | ||||
| Fiscal 2008 Quarter Ended | |||||||||||||
| December 31 | March 31 | June 30 | September 30 | ||||||||||
| (In thousands, except per share data) | |||||||||||||
| Interest income |
$ | 145,668 | $ | 138,892 | $ | 131,564 | $ | 134,059 | |||||
| Interest expense |
92,696 | 85,832 | 75,263 | 76,530 | |||||||||
| Net interest income |
52,972 | 53,060 | 56,301 | 57,529 | |||||||||
| Provision for loan losses |
3,000 | 4,500 | 18,000 | 9,000 | |||||||||
| Net interest income after provision for loan losses |
49,972 | 48,560 | 38,301 | 48,529 | |||||||||
| Non-interest income |
12,933 | 10,820 | 11,946 | 12,081 | |||||||||
| Non-interest expense |
34,103 | 36,016 | 39,331 | 41,997 | |||||||||
| Earnings before income tax expense |
28,802 | 23,364 | 10,916 | 18,613 | |||||||||
| Income tax expense |
9,986 | 8,541 | 4,126 | 4,552 | |||||||||
| Net earnings |
$ | 18,816 | $ | 14,823 | $ | 6,790 | $ | 14,061 | |||||
| Earnings per share—basic and fully diluted |
$ | 0.06 | $ | 0.05 | $ | 0.02 | $ | 0.04 | |||||
119
Table of Contents
FORM 10-K EXHIBIT INDEX
| Exhibit |
Description of Exhibit |
If Incorporated by Reference, Documents with Which Exhibit was Previous Filed with SEC | ||
| 2.1 | TFS Financial Corporation Stock Issuance Plan, dated May 25, 2006 | Registration Statement on Form S-1 No. 333-139295 (filed with the SEC on December 13, 2006; Exhibit 2 therein) | ||
| 3.1 | Amended and Restated Charter of TFS Financial Corporation, dated January 16, 2007 | Amendment No. 2 to Registration Statement on Form S-1 No. 333-139295 (filed with the SEC on February 9, 2006; Exhibit 3.2 therein) | ||
| 3.2 | Amended and Restated Bylaws of TFS Financial Corporation | Current Report on Form 8K No. 001-33390 (filed with the SEC on April 28, 2008; Exhibit 3.2 therein) | ||
| 4.1 | Form of Common Stock Certificate of TFS Financial Corporation | Registration Statement on Form S-1 No. 333-139295 (filed with the SEC on December 13, 2006; Exhibit 4 therein) | ||
| 10.1 | Employee Stock Ownership Plan, dated January 1, 2006 | Registration Statement on Form S-1 No. 333-139295 (filed with the SEC on December 13, 2006; Exhibit 10.1 therein) | ||
| 10.2 | Financial, Retirement & Estate Planning Program as amended and restated January 1, 2006 | Registration Statement on Form S-1 No. 333-139295 (filed with the SEC on December 13, 2006; Exhibit 10.2 therein) | ||
| 10.3 | Resolution Regarding Executive Physical Program, dated May 16, 2002 | Registration Statement on Form S-1 No. 333-139295 (filed with the SEC on December 13, 2006; Exhibit 10.3 therein) | ||
| 10.4 | Company Car Program, dated February 24, 1995 | Registration Statement on Form S-1 No. 333-139295 (filed with the SEC on December 13, 2006; Exhibit 10.4 therein) | ||
| 10.5 | Executive Retirement Benefit Plan I, dated January 1, 2006 | Registration Statement on Form S-1 No. 333-139295 (filed with the SEC on December 13, 2006; Exhibit 10.5 therein) | ||
| 10.6 | Benefit Equalization Plan, dated January 1, 2005 | Registration Statement on Form S-1 No. 333-139295 (filed with the SEC on December 13, 2006; Exhibit 10.6 therein) | ||
| 10.7 | Split Dollar Agreement, dated January 29, 2002 | Registration Statement on Form S-1 No. 333-139295 (filed with the SEC on December 13, 2006; Exhibit 10.7 therein) | ||
| 10.8 | Resolution Regarding Supplemental Split Dollar Life Insurance Plan, dated August 22, 2002 | Registration Statement on Form S-1 No. 333-139295 (filed with the SEC on December 13, 2006; Exhibit 10.8 therein) | ||
| 10.9 | Amendment No. 1 to Employee Stock Ownership Plan, dated February 22, 2007 | Quarterly Report on Form 10-Q No. 001-33390 (filed with the SEC on May 15, 2007; Exhibit 10.9 therein) | ||
| 10.10 | 2008 Equity Incentive Plan | Current Report on Form 8K No. 001-33390 (filed with the SEC on May 30, 2008; Exhibit 10.1 therein) | ||
120
Table of Contents
| Exhibit |
Description of Exhibit |
If Incorporated by Reference, Documents with Which Exhibit was Previous Filed with SEC | ||
| 10.11 | Management Incentive Compensation Plan | Current Report on Form 8K No. 001-33390 (filed with the SEC on May 30, 2008; Exhibit 10.2 therein) | ||
| 21.1 | Subsidiaries of Registrant | Registration Statement on Form S-1 No. 333-139295 (filed with the SEC on December 13, 2006; Exhibit 21 therein) | ||
| 23.1 | Consent of Independent Registered Public Accounting Firm | Filed herewith | ||
| 31.1 | Certification of chief executive officer pursuant to Rule 13a-14(a) of the Securities Exchange Act of 1934 | Filed herewith | ||
| 31.2 | Certification of chief financial officer pursuant to Rule 13a-14(a) of the Securities Exchange Act of 1934 | Filed herewith | ||
| 32 | Certification of chief executive officer pursuant to Rule 13a-14(b) of the Securities Exchange Act of 1934 and 18 U.S.C. Section 1350 | Filed herewith | ||
121
Table of Contents
SIGNATURES
Pursuant to the requirements of Section 13 or 15(d) the Securities Exchange Act of 1934, the Registrant has duly caused this report to be signed on its behalf by the undersigned thereunto duly authorized.
TFS Financial Corporation
| Dated: November 25, 2009 | /s/ MARC A. STEFANSKI | |||
| Marc A. Stefanski Chairman of the Board, President and Chief Executive Officer (Principal Executive Officer) |
Pursuant to the requirements of the Securities Exchange Act of 1934, this report has been signed below by the following persons on behalf of the Registrant and in the capacities and on the dates indicated.
| Dated: November 25, 2009 |
/s/ MARC A. STEFANSKI | |||
| Marc A. Stefanski Chairman of the Board, President and Chief Executive Officer (Principal Executive Officer) | ||||
| Dated: November 25, 2009 |
/s/ DAVID S. HUFFMAN | |||
| David S. Huffman Chief Financial Officer (Principal Financial Officer) | ||||
| Dated: November 25, 2009 |
/s/ PAUL J. HUML | |||
| Paul J. Huml Chief Accounting Officer (Principal Accounting Officer) | ||||
| Dated: November 25, 2009 |
/s/ BERNARD S. KOBAK | |||
| Bernard S. Kobak Director and Secretary | ||||
| Dated: November 25, 2009 |
/s/ ANTHONY J. ASHER | |||
| Anthony J. Asher, Director | ||||
| Dated: November 25, 2009 |
/s/ THOMAS J. BAIRD | |||
| Thomas J. Baird, Director | ||||
| Dated: November 25, 2009 |
/s/ MARTIN J. COHEN | |||
| Martin J. Cohen, Director | ||||
| Dated: November 25, 2009 |
/s/ ROBERT A. FIALA | |||
| Robert A. Fiala, Director | ||||
| Dated: November 25, 2009 |
/s/ JOHN J. FITZPATRICK | |||
| John J. Fitzpatrick, Director | ||||
| Dated: November 25, 2009 |
/s/ JAMES S. GASCOIGNE | |||
| James S. Gascoigne, Director | ||||
| Dated: November 25, 2009 |
/s/ WILLIAM C. MULLIGAN | |||
| William C. Mulligan, Director | ||||
| Dated: November 25, 2009 |
/s/ MARIANNE PITERANS | |||
| Marianne Piterans, Director | ||||
| Dated: November 25, 2009 |
/s/ PAUL W. STEFANIK | |||
| Paul W. Stefanik, Director | ||||
122