Attached files
| file | filename |
|---|---|
| 8-K - FORM 8-K - REGIONS FINANCIAL CORP | d253357d8k.htm |
 2011 Bank of America Merrill Lynch Banking
and Financial Services Conference
November 15, 2011
David Turner
Chief Financial Officer
Exhibit 99.1 |
 Why
Regions? •
Strong Southeastern franchise with comprehensive line
of product offerings
•
Leading brand favorability and exceptional service
quality
•
Solid core business performance
•
Aggressively identifying and disposing of problem assets
•
Capital and liquidity remain solid
2 |
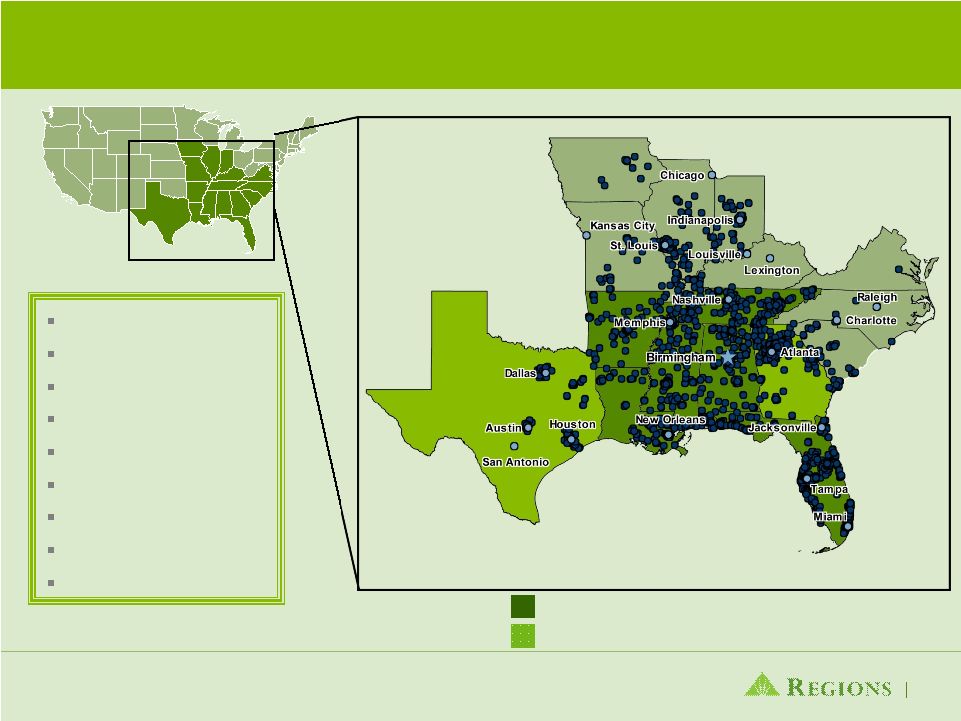 Regional Bank Focused in the Southeast
3
Ranked 4
th
or Better in Market Share
Targeted Growth Areas
Associates: 26,881
Assets: $130B
Loans: $79B
Deposits: $96B
Branches: 1,767
Morgan Keegan Offices: 303
Insurance Offices: 30
ATMs: 2,130
Market Cap: $5.3B*
* As of October 27, 2011 |
 Top
10 MSAs Deposits
Market
Share
Market
Rank
’10-’15 Population
Growth
Birmingham, AL
$11.0
37.6%
1
Nashville, TN
$6.6
17.3%
1
Miami, FL
$4.8
3.1%
7
Tampa, FL
$4.4
8.7%
4
Memphis, TN
$3.8
16.8%
2
Atlanta, GA
$3.4
3.0%
6
St. Louis, MO
$3.0
4.7%
4
Jackson, MS
$2.8
25.5%
2
New Orleans, LA
$2.4
8.3%
4
Mobile, AL
$2.3
38.2%
1
4
($ in billions)
National Average: 3.9%
Regions’
Footprint is Characterized by Either High
Market Shares, High Growth Markets or Both
Source: SNL Financial
Note: Core Markets include AL, FL, LA, MS, AR, TN
Weighted Average Deposit Market Share
in Regions’
Core Markets
Rank
Name
Market Share
1
Bank of America
11.5%
2
Regions
9.8%
3
Wells Fargo
9.4%
4
SunTrust
6.9%
5
JPMorgan Chase
3.3%
6
BB&T
2.5%
7
Capital One
2.3%
8
First Horizon
2.0%
9
Hancock
1.9%
10
PNC
1.4%
1.0%
8.8%
4.4%
2.0%
10.1
%
4.3%
3.7%
1.4%
9.6%
3.4% |
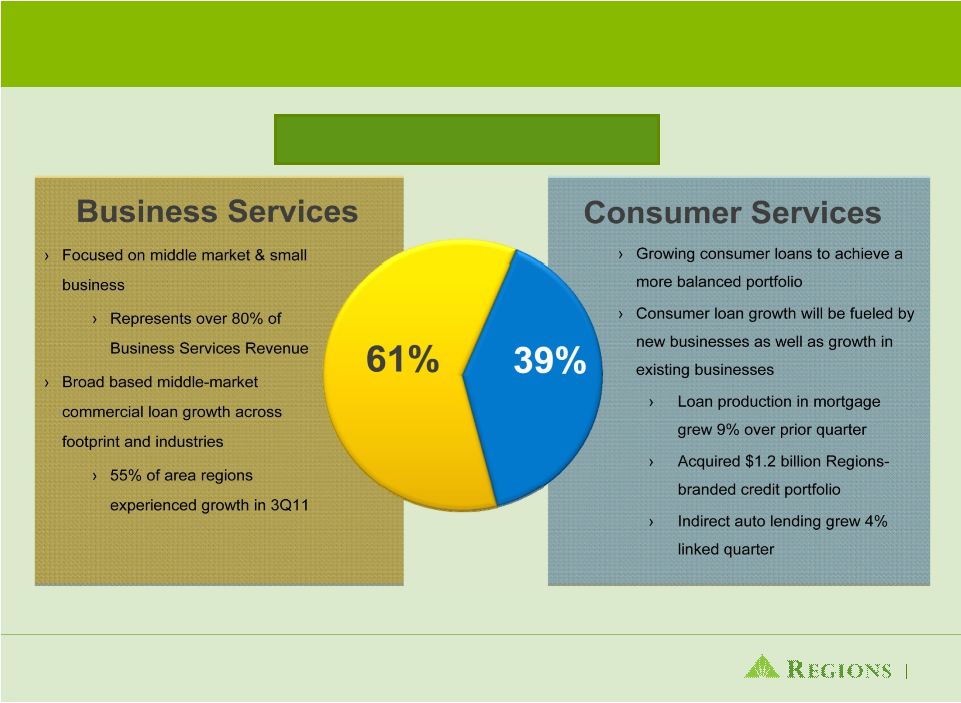
 Comprehensive and Diversified Line of
Product Offerings
Business Services
–
Small and mid-
sized C&I lending
–
Commercial Real
Estate
–
Equipment Finance
5
Consumer Services
–
Mortgage
–
Home Equity
–
Credit Card
–
Direct Lending
–
Indirect Auto
Wealth Management
–
Private Banking
–
Insurance
–
Trust Services |
 Competitive Advantage Driven by Customer
Loyalty
Regions continues to
perform in the top 10%
in customer loyalty and
top 20% for branch
service quality
(1)
(1)
Based on Gallup survey
(2)
Based on Prime Performance study
(3)
2010 Greenwich Excellence Award
#1 in Customer Service and
“Friendliest”
Bank
(2)
Regions received
Excellence Award
for Small Business
and Middle Market
Banking
(3)
6
Top Bank in
Customer
Service Study
Ranked 2
nd
in Satisfaction for
Mortgage Servicing
J.D. Power
AND ASSOCIATES |
 Excellent Service Quality and Brand Strength
Being Recognized
(1)
Based on 4 Quarter Rolling Average from TNS Consumer Banking Market Effectiveness
Study as of June 30, 2011 Note:
Banks in study include: Bank of America, BB&T, BBVA Compass, Citigroup, Capital
One, J.P. Morgan Chase, SunTrust, U.S. Bank, Wachovia/Wells Fargo
Regions
Ranks
Highest
in
Brand
Favorability
(1)
7 |
 Quality Loans Key to Profitable Growth
Portfolio Mix*
*Ending Balances
8 |
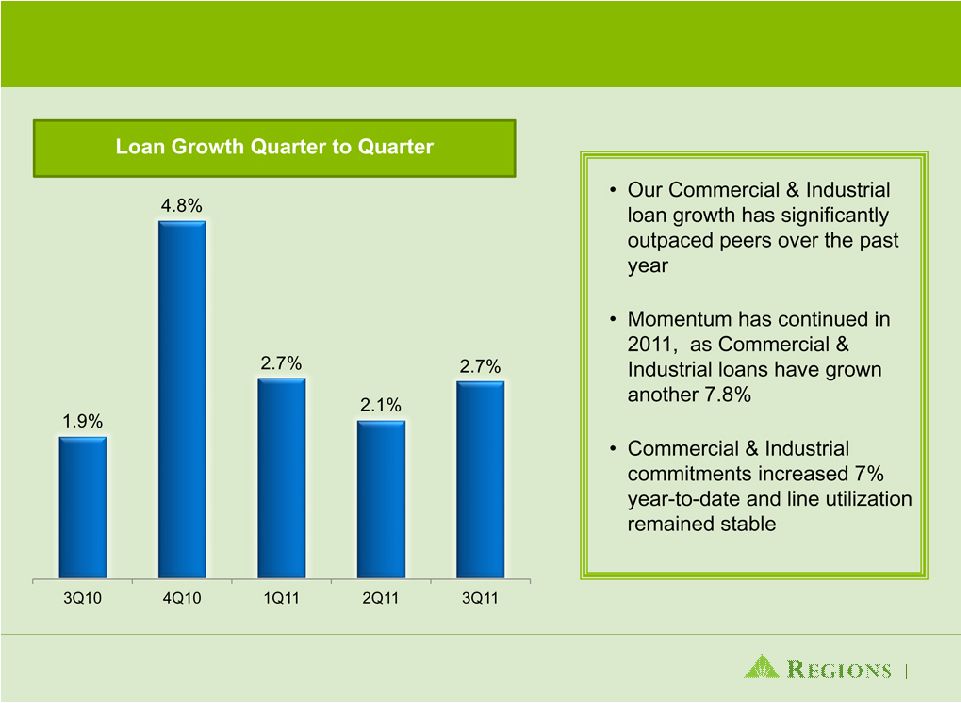 Regions has Continued to Grow C&I Loans
9 |
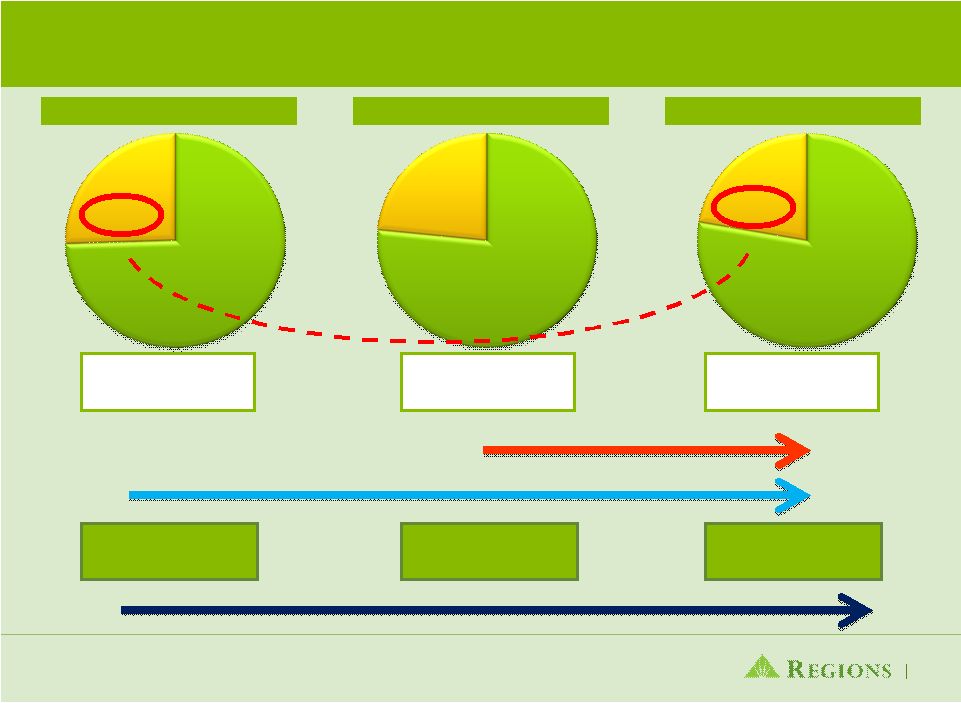       We have
made great strides in improving deposit mix and cost and funding costs
Deposit Cost
70 bps
Deposit Cost
53 bps
Deposit Cost
46 bps
7 bps Improvement
24 bps Improvement
3Q11
Low Cost
Deposits
74%
Time
Deposits
26%
Low Cost
Deposits
77%
Time
Deposits
23%
Low Cost
Deposits
78%
Time
Deposits
22%
2Q11
3Q10
Total Funding Cost
102 bps
Total Funding Cost
80 bps
Total Funding Cost
75 bps
27 bps Improvement
10 |
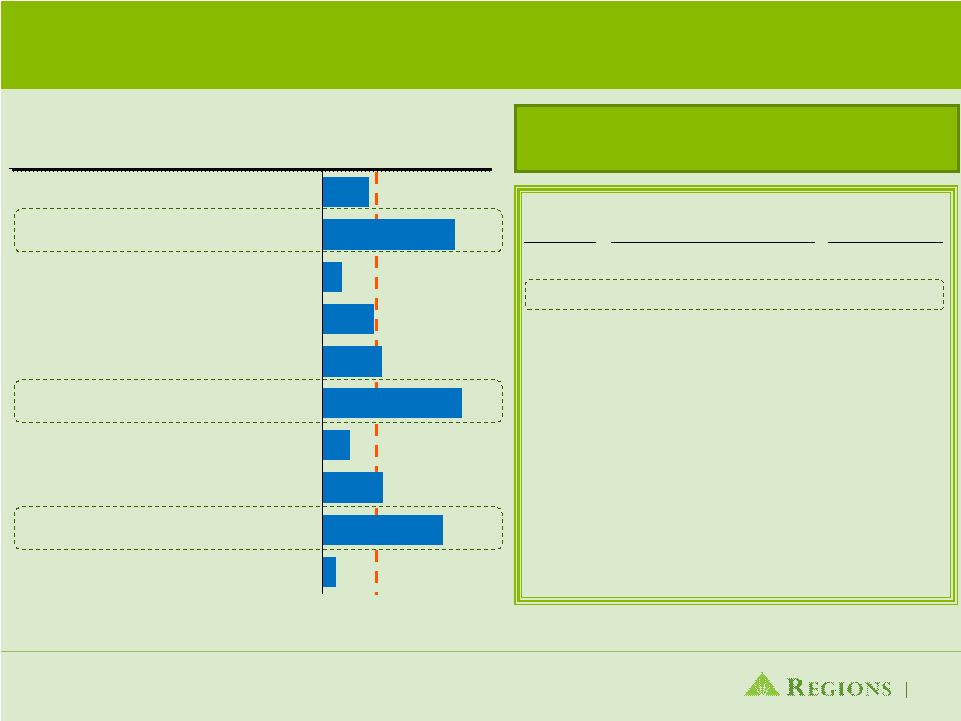
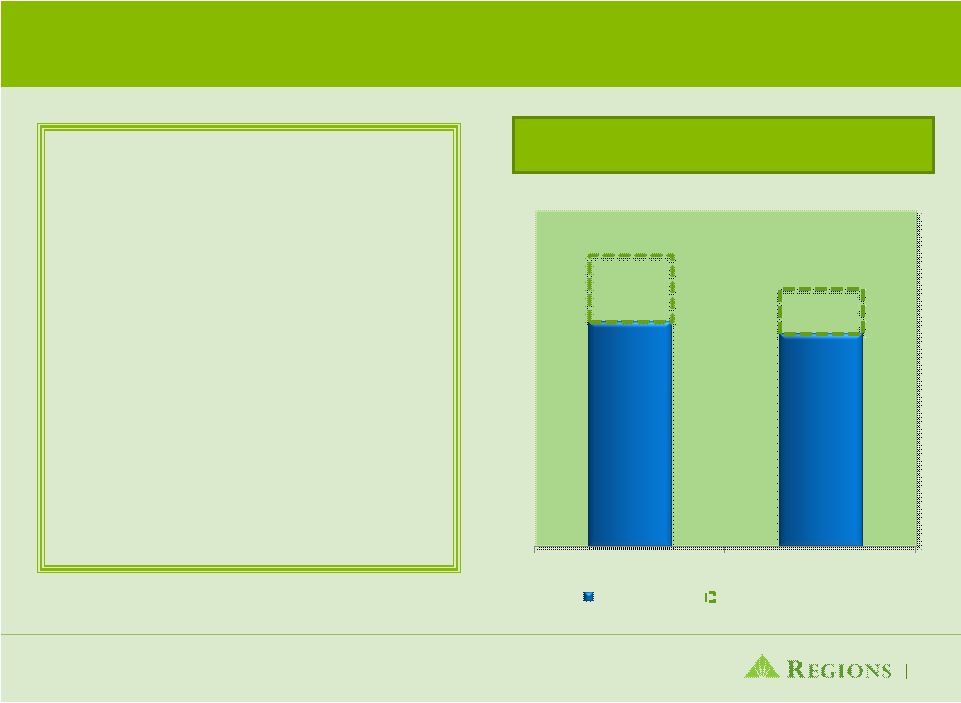 Balance Sheet Opportunities Remain
11
40
38
12
8
2Q11
3Q11
Peer Median
Regions Opportunity Gap
Deposit Cost Opportunity Gap
Note: Peer banks include BAC, BBT, CMA, FITB, KEY, MTB, PNC, STI, USB,
WFC •
Regions has additional room to reduce
deposit costs even further
•
Opportunity to reduce deposit costs,
most significantly through profitably re-
pricing maturing CDs
•
Higher cost CDs maturing
•
4Q11 -
$2.4 B at 1.32%
•
2012 -
$10.7 B at 1.59%
•
$6 billion of cash in Fed Funds at
September 30 |
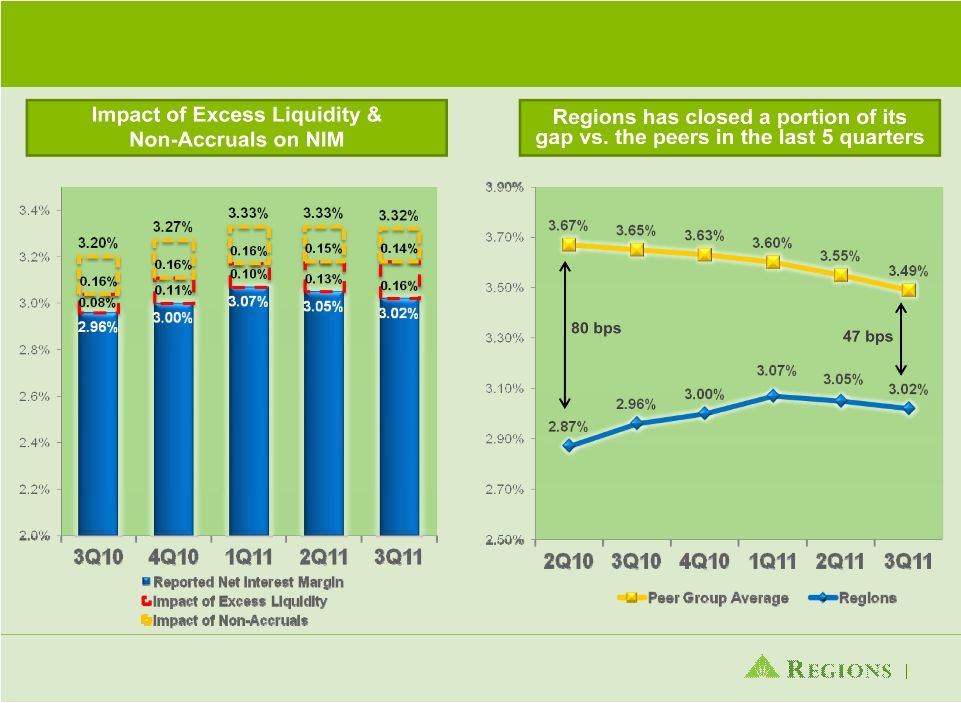 Net
Interest Margin Impacted by Cash Reserves and Non-Accrual Loans
12
Note: Peer banks include BAC, BBT, CMA, FITB, KEY, MTB, PNC, STI, USB,
WFC |
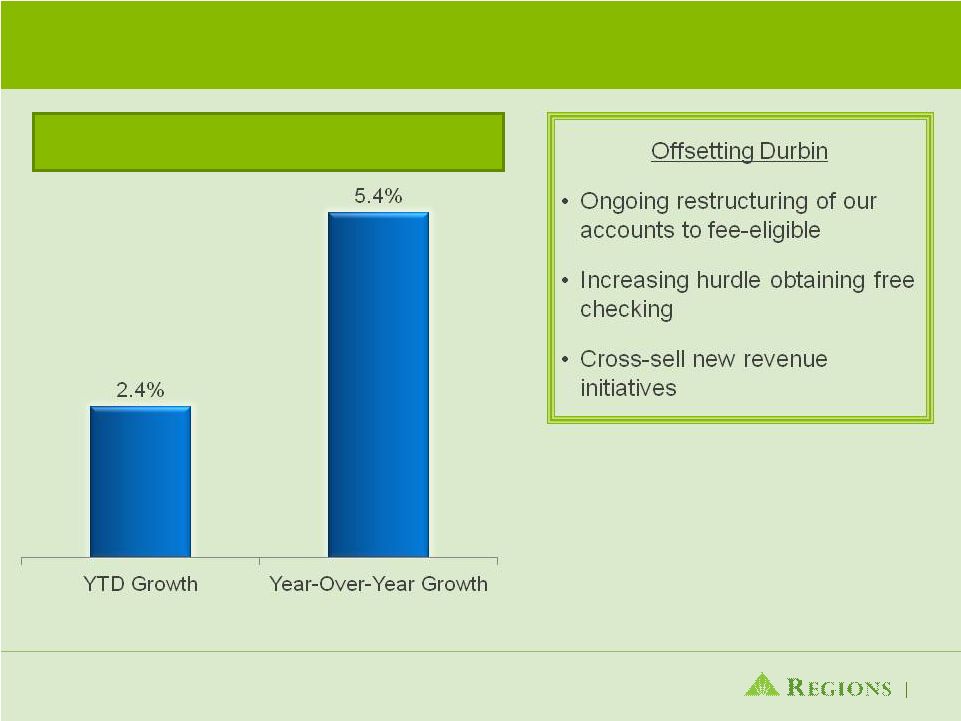 Service Charge Income Remains Strong
13
Service Charge Growth |
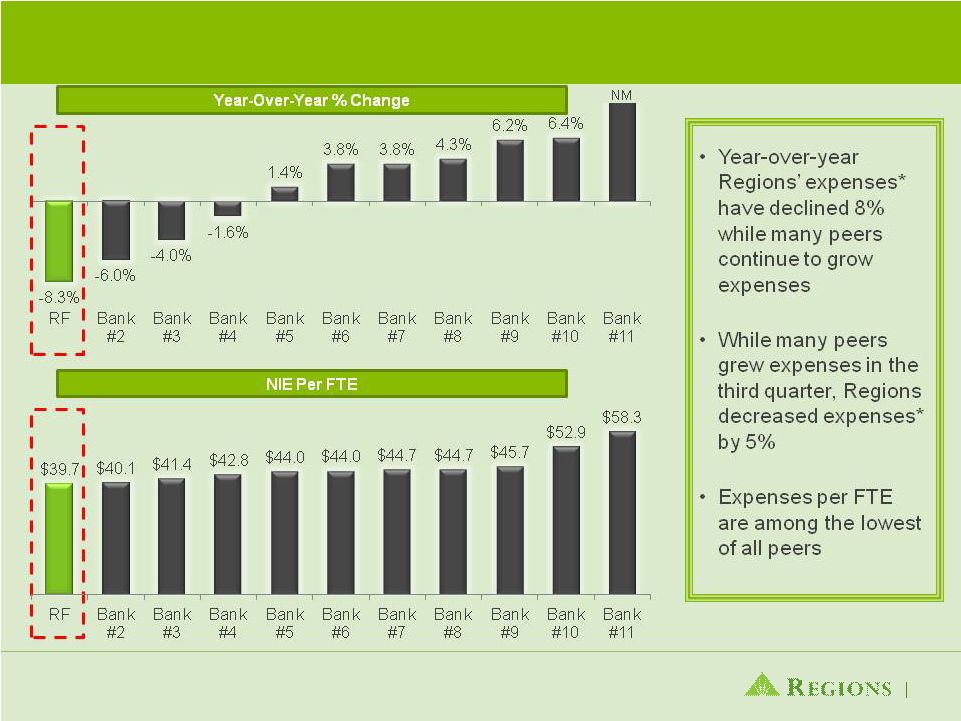 Expense control continues to be a focus
14
* On an adjusted basis, refer to appendix for non-GAAP reconciliation
Source: SNL Financial –
excludes nonrecurring expenses
Note: Peer banks include BAC, BBT, CMA, FITB, KEY, MTB, PNC, STI, USB,
WFC |
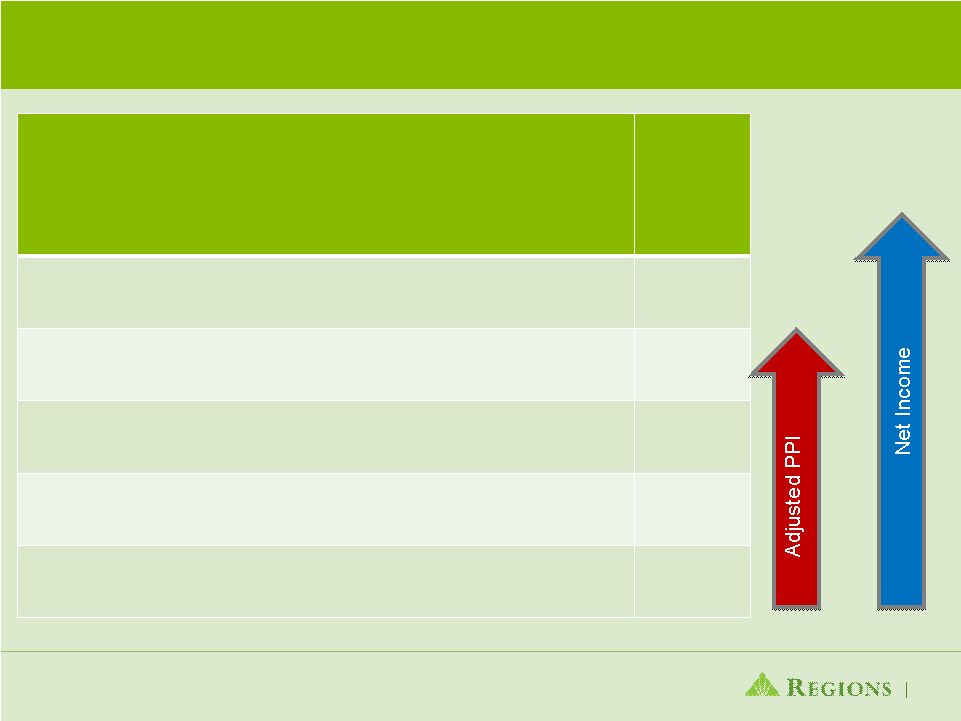     * Refer to appendix for reconciliation to GAAP
** Net income available to common shareholders
15
Strong Net Income and Adjusted Pre-tax
Pre-Provision Income Growth
($ in
millions)
Net
Interest
Income
Adjusted
Non-
Interest
Revenue*
Adjusted
Non-
Interest
Expense*
Adjusted
Pre-tax
Pre-
provision
Income*
Net
Income**
3Q11
858
+
748
-
1,066
=
540
$101
2Q11
864
+
757
-
1,121
=
500
$55
1Q11
863
+
764
-
1,167
=
460
$17
4Q10
877
+
795
-
1,211
=
461
$36
3Q10
868
+
748
-
1,162
=
454
($209)
+19%
+19%
+148
+148% |
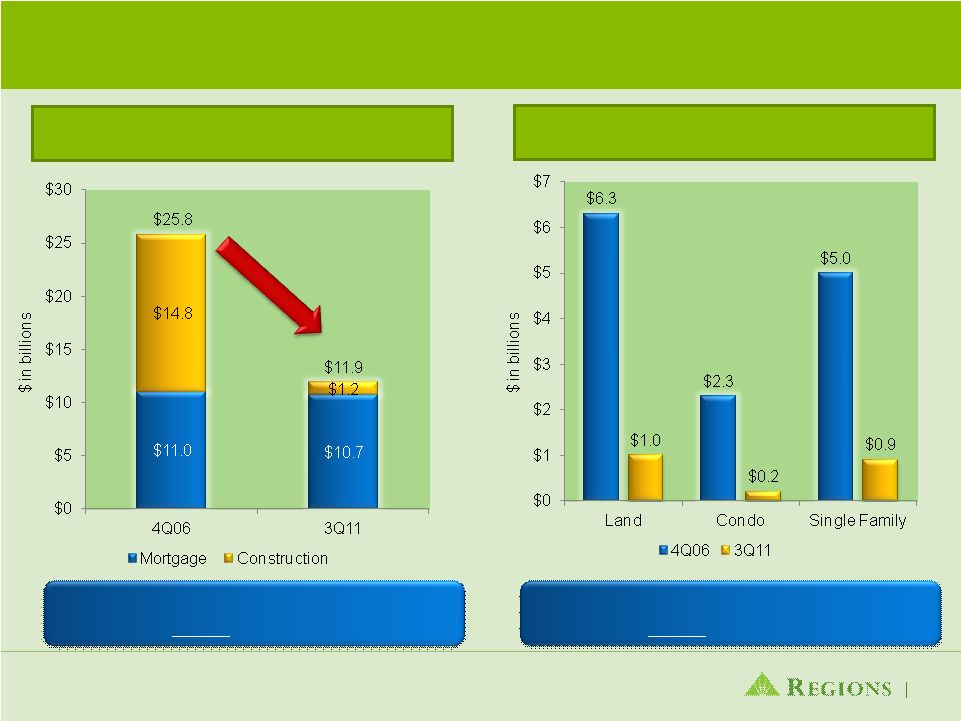 Significant Reduction in Highest Risk Portfolio
Segments
Reduced Investor Real Estate $13.9 B
or
54%
over 4 years
Reduced High Risk Segments $11.5 B
or
85%
over 4 years
Total Investor Real Estate
Higher Risk Investor Real Estate Segments
16 |
 17
Credit Quality Metrics Linked Quarter
Net charge-offs declined 7%
Provided
less
than
net
charge-offs
for
2
nd
straight
quarter
Non-performing loans declined 3%
Non-performing assets declined 6%
Business Services criticized loans declined 8%
Loan loss allowance to net loans declined 11bps to 3.73%
Delinquencies
improved
for
the
6
th
straight
quarter |
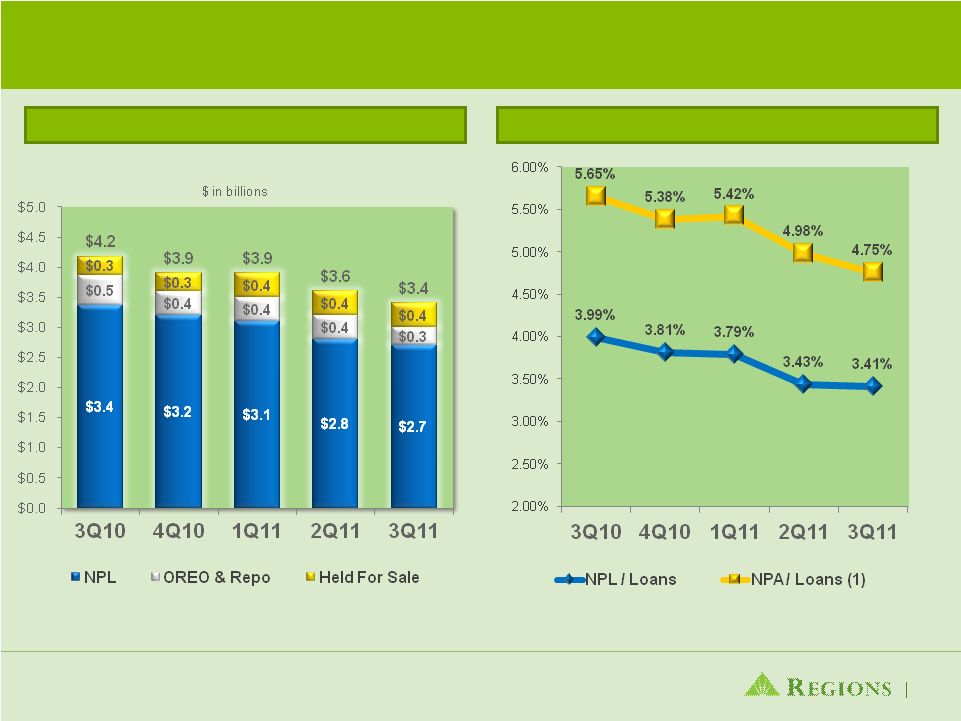 18
Non-Performing Assets Decline 6%
NPL and NPA to Loans
Non-Performing Assets
(1) NPAs (inc. 90+ past due) / Loans, foreclosed properties and non-performing
loans held for sale |
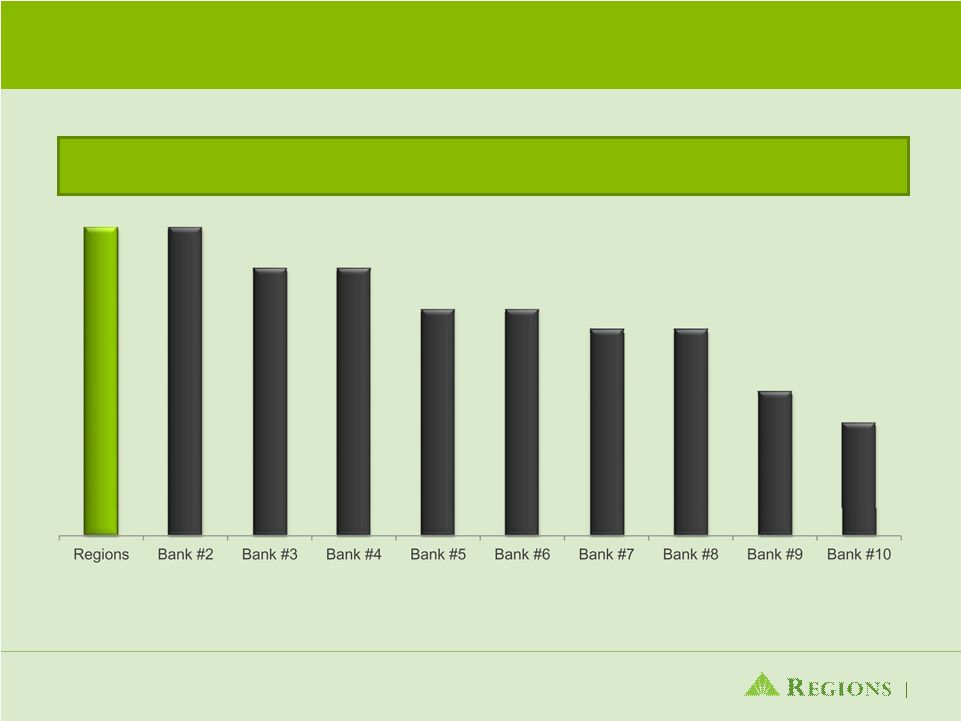
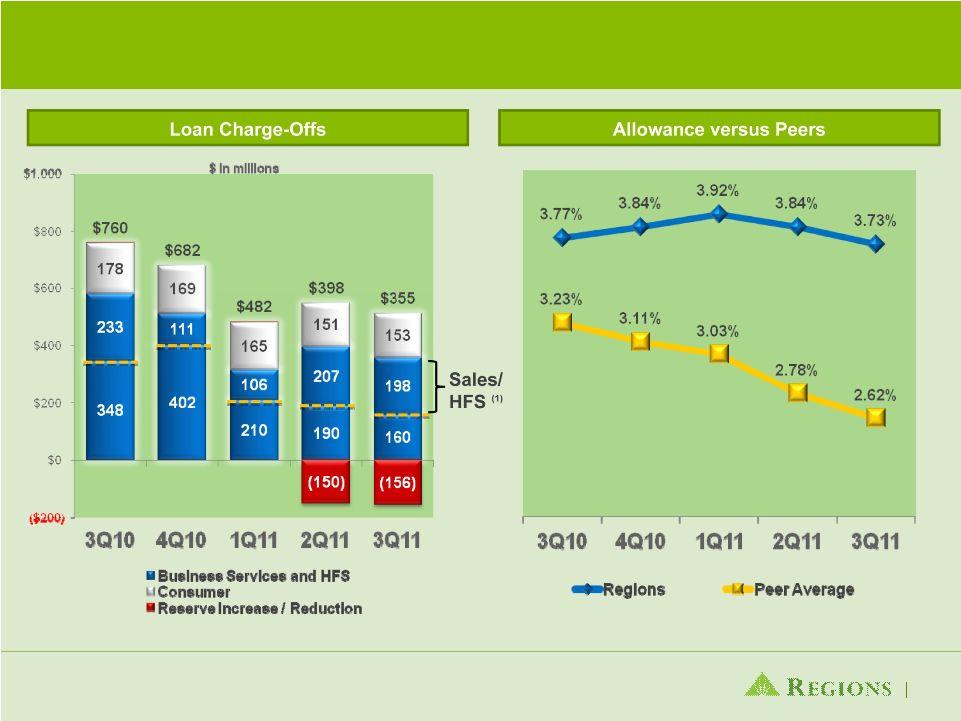 Substantial Improvement in Loan Loss Provision;
Allowance Well Above Peers
(1) Loan charge-offs related to Sales and Transfer to Held for Sale
Note: Peer banks include BAC, BBT, CMA, FITB, KEY, MTB, PNC, STI, USB,
WFC 19 |
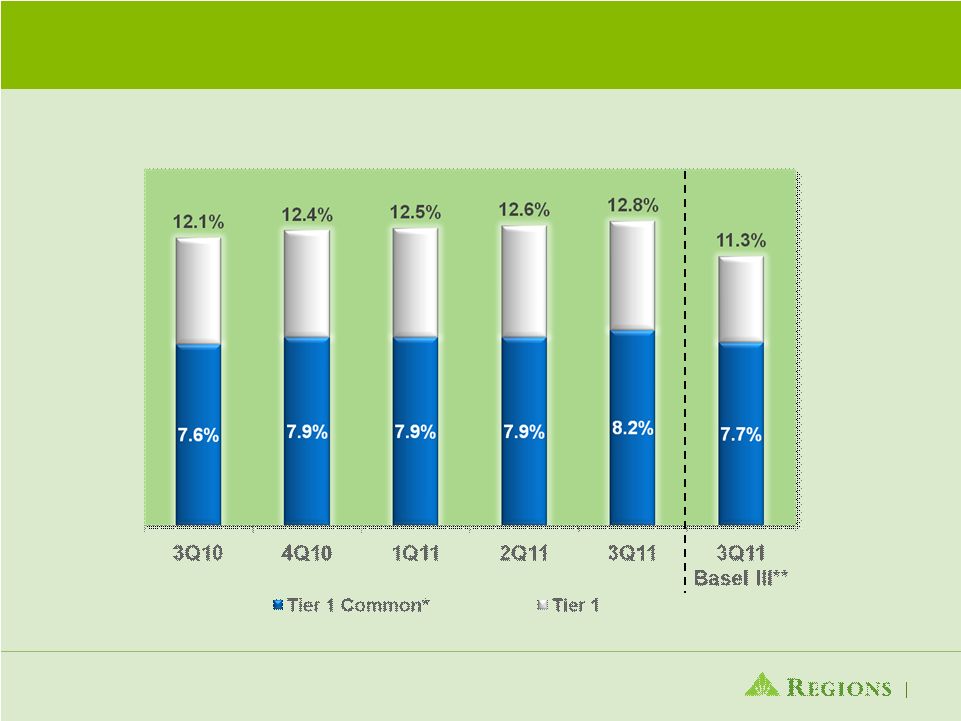 Strong Capital
20
* Non-GAAP –
see appendix for reconciliation
** Non-GAAP -
Subject to change as interpretation of Basel III rules is ongoing and dependent on
guidance from Basel and regulators; see appendix for
reconciliation |
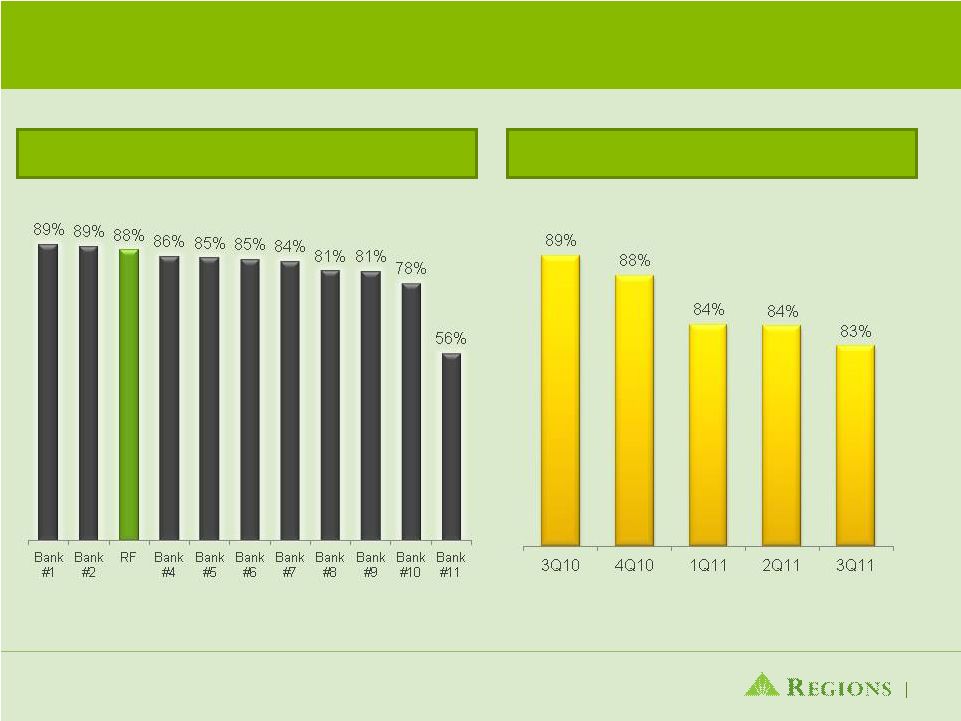 Loans / Deposits
21
Core Deposits as a % of Total Funding
Solid Liquidity
Note: Peer banks include BAC, BBT, CMA, FITB, KEY, MTB, PNC, STI, USB,
WFC |
  Regions’
Business Plan
is for all associates to
Focus on customers, build
relationships customers value
and manage risks.
Executing this
plan with excellence will result in a
high-performing financial institution.
Focus on the Customer
Build Sustainable Performance
Enhance Risk Management
Risk management will be built on our solid
foundation of trust and integrity. We will
clearly understand the risk we take, be paid
appropriately for that risk and prudently
manage our capital and
liquidity. Business
Plan 22
We will ensure sustainable
profitability by diversifying
and expanding our revenue
streams while exercising
disciplined pricing and
expense management.
We will focus on our
customers to build
relationships they value and
enhance our industry-
leading customer service. |
 Stronger Company Today
4Q07
3Q11
Change
Investor Real Estate
$23B
$12B
48% Reduction
Allowance for Loan Losses
$1.3B
$3.0B
More than
doubled
Tier 1 Common Ratio*
6.6%
8.2%
160 bps
improvement
Low Cost Deposits
$60.3B
$75.5B
25% Growth
Loan to Deposit
100%
83%
Strong Liquidity
23
*
Non-GAAP
–
see
appendix
for
reconciliation |
 Forward-Looking Statements
This
presentation
may
include
forward-looking
statements
which
reflect
Regions’
current
views
with
respect
to
future
events
and
financial
performance.
The
Private
Securities
Litigation
Reform
Act
of
1995
(“the
Act”)
provides
a
“safe
harbor”
for
forward-looking
statements
which
are
identified
as
such
and
are
accompanied
by
the
identification
of
important
factors
that
could
cause
actual
results
to
differ
materially
from
the
forward-looking
statements.
For
these
statements,
we,
together
with
our
subsidiaries,
claim
the
protection
afforded
by
the
safe
harbor
in
the
Act.
Forward-looking
statements
are
not
based
on
historical
information,
but
rather
are
related
to
future
operations,
strategies,
financial
results
or
other
developments.
Forward-looking
statements
are
based
on
management’s
expectations
as
well
as
certain
assumptions
and
estimates
made
by,
and
information
available
to,
management
at
the
time
the
statements
are
made.
Those
statements
are
based
on
general
assumptions
and
are
subject
to
various
risks,
uncertainties
and
other
factors
that
may
cause
actual
results
to
differ
materially
from
the
views,
beliefs
and
projections
expressed
in
such
statements.
These
risks,
uncertainties
and
other
factors
include,
but
are
not
limited
to,
those
described
below:
›
The
Dodd-Frank
Wall
Street
Reform
and
Consumer
Protection
Act
(the
“Dodd-Frank
Act”)
became
law
on
July
21,
2010,
and
a
number
of
legislative,
regulatory
and
tax
proposals
remain
pending.
Additionally,
the
U.S.
Treasury
and
federal
banking
regulators
continue
to
implement,
but
are
also
beginning
to
wind
down,
a
number
of
programs
to
address
capital
and
liquidity
in
the
banking
system.
Proposed
rules,
including
those
that
are
part
of
the
Basel
III
process,
could
require
banking
institutions
to
increase
levels
of
capital.
All
of
the
foregoing
may
have
significant
effects
on
Regions
and
the
financial
services
industry,
the
exact
nature
of
which
cannot
be
determined
at
this
time.
›
Regions'
ability
to
mitigate
the
impact
of
the
Dodd-Frank
Act
on
debit
interchange
fees
through
revenue
enhancements
and
other
revenue
measures,
which
will
depend
on
various
factors,
including
the
acceptance
by
our
customers
of
modified
fee
structures
for
Regions'
products
and
services.
›
The
impact
of
compensation
and
other
restrictions
imposed
under
the
Troubled
Asset
Relief
Program
(“TARP”)
until
Regions
repays
the
outstanding
preferred
stock
and
warrant
issued
under
the
TARP,
including
restrictions
on
Regions’
ability
to
attract
and
retain
talented
executives
and
associates.
›
Possible
additional
loan
losses,
impairment
of
goodwill
and
other
intangibles,
and
adjustment
of
valuation
allowances
on
deferred
tax
assets
and
the
impact
on
earnings
and
capital.
›
Possible
changes
in
interest
rates
may
increase
funding
costs
and
reduce
earning
asset
yields,
thus
reducing
margins.
Increases
in
benchmark
interest
rates
would
also
increase
debt
service
requirements
for
customers
whose
terms
include
a
variable
interest
rate,
which
may
negatively
impact
the
ability
of
borrowers
to
pay
as
contractually
obligated.
›
Possible
changes
in
general
economic
and
business
conditions
in
the
United
States
in
general
and
in
the
communities
Regions
serves
in
particular,
including
any
prolonging
or
worsening
of
the
current
unfavorable
economic
conditions
including
unemployment
levels.
›
Possible
changes
in
the
creditworthiness
of
customers
and
the
possible
impairment
of
the
collectability
of
loans.
›
Possible
changes
in
trade,
monetary
and
fiscal
policies,
laws
and
regulations
and
other
activities
of
governments,
agencies,
and
similar
organizations,
may
have
an
adverse
effect
on
business.
›
The
current
stresses
in
the
financial
and
real
estate
markets,
including
possible
continued
deterioration
in
property
values.
›
Regions'
ability
to
manage
fluctuations
in
the
value
of
assets
and
liabilities
and
off-balance
sheet
exposure
so
as
to
maintain
sufficient
capital
and
liquidity
to
support
Regions'
business.
›
Regions'
ability
to
expand
into
new
markets
and
to
maintain
profit
margins
in
the
face
of
competitive
pressures.
›
Regions'
ability
to
develop
competitive
new
products
and
services
in
a
timely
manner
and
the
acceptance
of
such
products
and
services
by
Regions'
customers
and
potential
customers.
›
Regions'
ability
to
keep
pace
with
technological
changes.
›
Regions'
ability
to
effectively
manage
credit
risk,
interest
rate
risk,
market
risk,
operational
risk,
legal
risk,
liquidity
risk,
and
regulatory
and
compliance
risk.
›
Regions’
ability
to
ensure
adequate
capitalization
which
is
impacted
by
inherent
uncertainties
in
forecasting
credit
losses.
›
The
cost
and
other
effects
of
material
contingencies,
including
litigation
contingencies,
and
any
adverse
judicial,
administrative
or
arbitral
rulings
or
proceedings.
›
The
effects
of
increased
competition
from
both
banks
and
non-banks.
›
The
effects
of
geopolitical
instability
and
risks
such
as
terrorist
attacks.
›
Possible
changes
in
consumer
and
business
spending
and
saving
habits
could
affect
Regions'
ability
to
increase
assets
and
to
attract
deposits.
›
The
effects
of
weather
and
natural
disasters
such
as
floods,
droughts,
wind,
tornados
and
hurricanes,
and
the
effects
of
man-made
disasters.
›
Possible
downgrades
in
ratings
issued
by
rating
agencies.
›
Potential
dilution
of
holders
of
shares
of
Regions’
common
stock
resulting
from
the
U.S.
Treasury’s
investment
in
TARP.
›
Possible
changes
in
the
speed
of
loan
prepayments
by
Regions’
customers
and
loan
origination
or
sales
volumes.
›
Possible acceleration of prepayments on mortgage-backed securities due to low
interest rates and the related acceleration of premium amortization on those securities.
›
The
effects
of
problems
encountered
by
larger
or
similar
financial
institutions
that
adversely
affect
Regions
or
the
banking
industry
generally.
›
Regions’
ability to receive dividends from its subsidiaries.
›
The effects of the failure of any component of Regions’
business infrastructure which is provided by a third party.
›
Changes in accounting policies or procedures as may be required by the Financial
Accounting Standards Board or other regulatory agencies. ›
The
effects
of
any
damage
to
Regions’
reputation
resulting
from
developments
related
to
any
of
the
items
identified
above.
The
foregoing
list
of
factors
is
not
exhaustive.
For
discussion
of
these
and
other
factors
that
may
cause
actual
results
to
differ
from
expectations,
look
under
the
captions
“Forward-Looking
Statements”
and
“Risk
Factors”
in
Regions’
Annual Report on Form 10-K for the year ended December 31, 2010 and quarterly
report on Forms 10-Q for the quarters ended September 30, 2011, June 30, 2011 and March 31, 2011, as on file with the Securities
and Exchange Commission.
The words "believe," "expect," "anticipate,"
"project," and similar expressions often signify forward-looking statements. You should not place undue reliance on any forward-looking statements, which speak only as of the date
made. We assume no obligation to update or revise any forward-looking statements
that are made from time to time. 24 |
 Non-GAAP Reconciliation
25
($ in millions)
3Q10
4Q10
1Q11
2Q11
3Q11
Net interest income (GAAP)
868
$
877
$
863
$
864
$
858
$
Non-interest income (GAAP)
750
1,213
843
781
745
Adjustments:
Securities (gains) losses, net
(2)
(333)
(82)
(24)
1
Leveraged lease termination (gains) / losses
-
(59)
-
-
2
Loss (gain) on sale of mortgage loans
-
(26)
3
-
-
Adjusted non-interest income (non-GAAP)
748
795
764
757
748
Adjusted total revenue (non-GAAP)
1,616
$
1,672
$
1,627
$
1,621
$
1,606
$
Non-interest expense (GAAP)
1,163
$
1,266
$
1,167
$
1,198
$
1,066
$
Adjustments:
Loss on extinguishment of debt
-
(55)
-
-
-
Securities impairment, net
(1)
-
-
-
-
Branch consolidation and property and equipment charges
-
-
-
(77)
-
Adjusted non-interest expense (non-GAAP)
1,162
$
1,211
$
1,167
$
1,121
$
1,066
$
Adjusted pre-tax pre-provision income
454
$
461
$
460
$
500
$
540
$ |
 Non-GAAP Reconciliation: Capital
26
($ amounts in millions, except per share data)
9/30/11
6/30/11
3/31/11
12/31/10
9/30/10
TIER 1 COMMON RISK-BASED RATIO
Stockholders' equity (GAAP)
17,263
$
16,888
$
16,619
$
16,734
$
17,163
$
Accumulated other comprehensive (income) loss
(93)
177
387
260
(208)
Non-qualifying goodwill and intangibles
(5,649)
(5,668)
(5,686)
(5,706)
(5,729)
Disallowed deferred tax assets
(506)
(498)
(463)
(424)
(427)
Disallowed servicing assets
(36)
(35)
(28)
(27)
(20)
Qualifying non-controlling interests
92
92
92
92
92
Qualifying trust preferred securities
846
846
846
846
846
Tier 1 capital (regulatory)
11,917
$
11,802
$
11,767
$
11,775
$
11,717
$
Qualifying non-controlling interests
(92)
(92)
(92)
(92)
(92)
Qualifying trust preferred securities
(846)
(846)
(846)
(846)
(846)
Preferred stock
(3,409)
(3,399)
(3,389)
(3,380)
(3,370)
Tier 1 common equity (non-GAAP)
K
7,570
$
7,465
$
7,440
$
7,457
$
7,409
$
Risk-weighted assets (regulatory)
L
92,786
93,865
93,929
94,966
97,088
Tier 1 common risk-based ratio (non-GAAP)
K/L
8.2%
7.9%
7.9%
7.9%
7.6%
As of and for Quarter Ended |
 27
Non-GAAP Reconciliation: Capital / Basel III
($ amounts in millions)
09/30/11
Stockholders' equity (GAAP)
17,262
Non-qualifying goodwill and intangibles
(1)
(5,820)
Adjustments, including other comprehensive income related to cash flow hedges,
disallowed deferred tax assets, threshold deductions and other
adjustments (809)
10,633
Qualifying non-controlling interests
4
Basel III Tier 1 Capital (non-GAAP)
10,637
Basel III Tier 1 Capital (non-GAAP)
10,637
Preferred Stock
(3,409)
Qualifying non-controlling interests
(4)
Basel III Tier 1 Common (non-GAAP)
7,224
Basel I risk-weighted assets
92,786
Basel III risk-weighted assets
(2)
94,384
Minimum
Basel III Tier 1 Capital Ratio
11.3%
8.5%
Basel III Tier 1 Common Ratio
7.7%
7.0% |
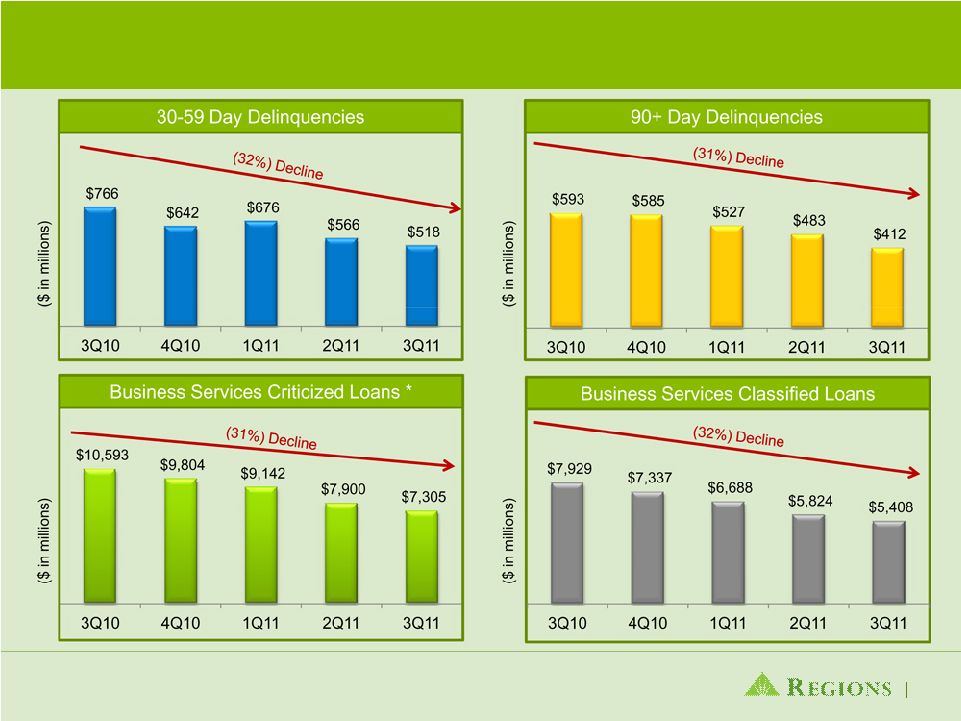 Continued Improvement in Early Stage Credit
Metrics
28
*Includes classified loans and special mention loans |
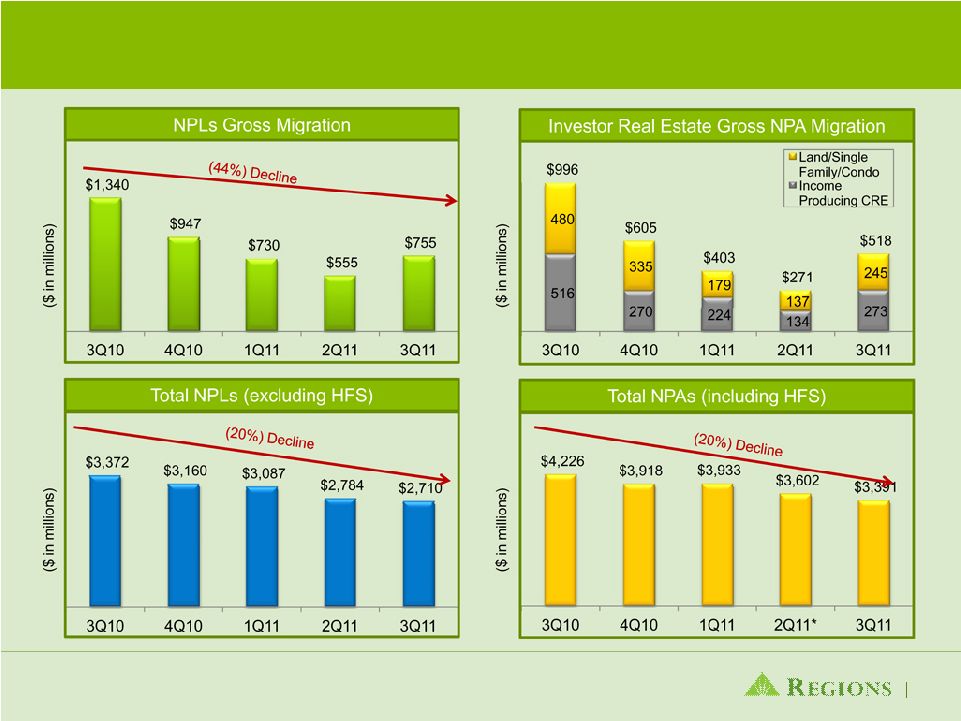 Credit Quality Metrics
29
* Previous presentation showed 2Q11 on a pro-forma basis to include completed
bulk sale after quarter-end. Current presentation shows actual 2Q11 and
3Q11 numbers as reported. |
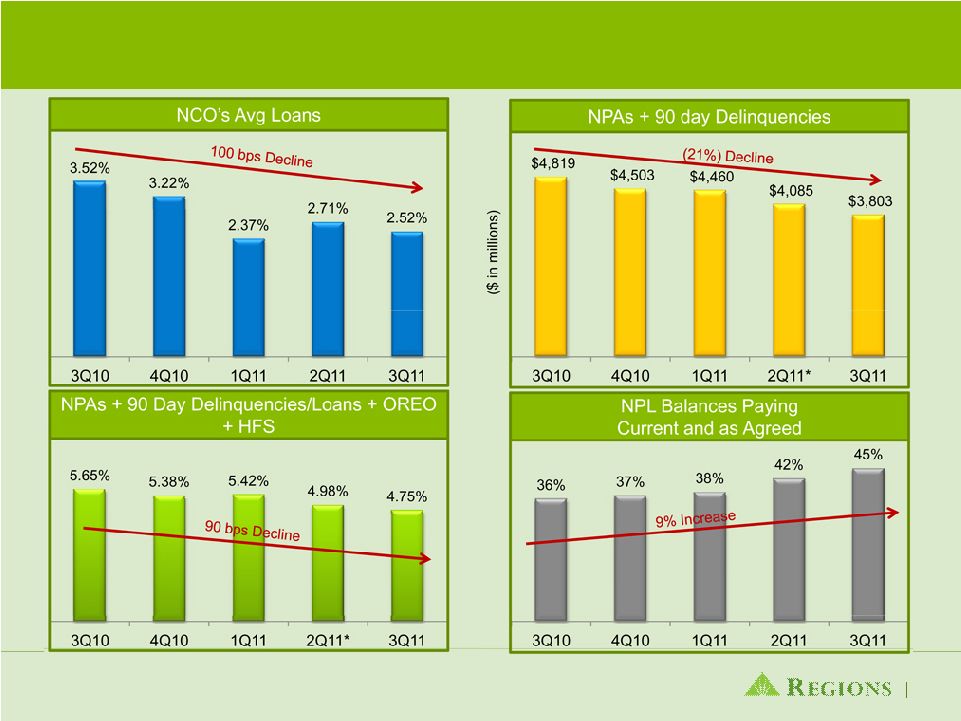 30
Credit Fundamentals
* Previous presentation showed 2Q11 on a pro-forma basis to include completed
bulk sale after quarter-end. Current presentation shows actual 2Q11 and
3Q11 numbers as reported. |
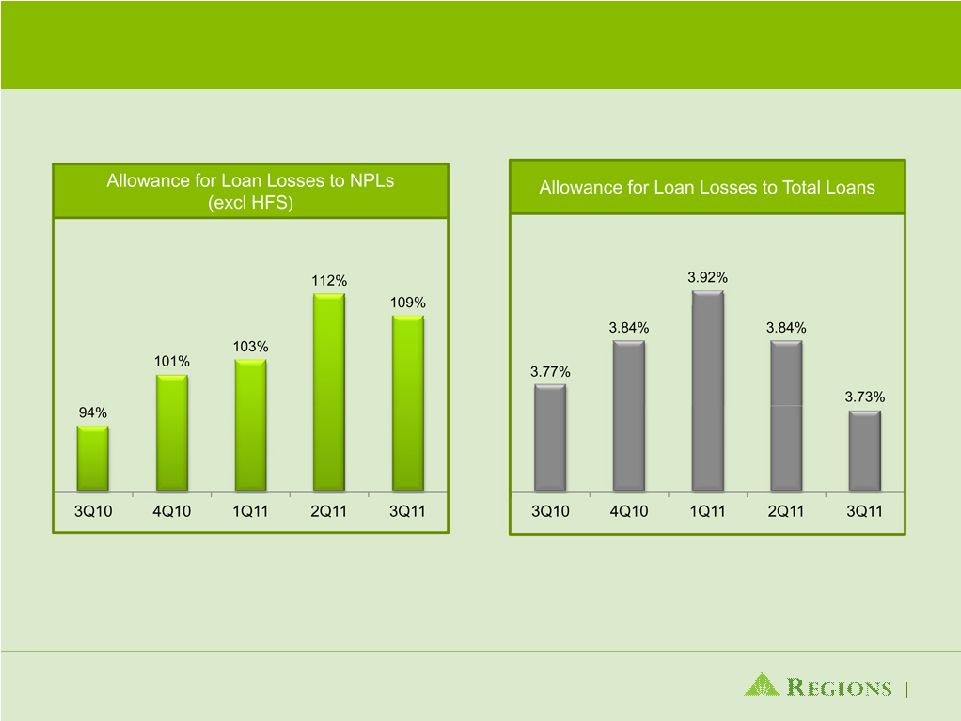 Allowance Coverage Remains Strong
31 |
 32
Conservative Marks and Reserves
Already Taken on Impaired Loans
Note1:
Impaired
loans
include
non-accrual
commercial
and
investor
real
estate
loans,
excluding
leasing,
and
all
TDRs
(including
accruing
commercial,
investor
real
estate,
and
consumer TDRs)
Note 2: Book value represents the unpaid principal balance less charge-offs and
payments applied; it is shown before any allowance for loan losses. Note 3:
Unpaid principal balance represents the contractual obligation due from the customer and includes the net book value plus charge-offs and payments applied.
Impaired Loans as of September 30, 2011
A
B
C= (A -
B)
D
E = (B + D) / A
($ millions)
Unpaid
Principal
Balance
Charge-Offs
and Pmts
Applied
Total Impaired
Loan Book
Value
Related
Allowance for
Loan Loss
Coverage %
Total Commercial and Industrial
812
$
86
$
726
$
197
$
34.8%
Total Commercial Real Estate Mortgage -
OO
960
108
852
216
33.7%
Total Commercial Real Estate Construction -
OO
43
15
28
8
54.2%
Total Commercial
1,815
208
1,606
421
34.7%
Total Commercial Investor Real Estate Mortgage
1,847
172
1,675
439
33.1%
Total Commercial Investor Real Estate Construction
552
111
441
171
51.2%
Total Commercial Investor Real Estate
2,399
284
2,116
610
37.3%
Residential First Mortgage
1,168
66
1,102
158
19.1%
Home Equity
447
14
433
61
16.8%
Indirect
2
-
2
0
0.9%
Consumer Credit Card
-
-
-
Other Consumer
59
0
59
1
1.4%
Total Consumer
1,676
80
1,596
220
17.9%
Total
5,890
$
572
$
5,318
$
1,251
$
30.9% |
 33
Adequately Reserved for Troubled Debt
Restructurings
September 30, 2011
Consumer loans make up 50% of accruing troubled debt restructurings
Foreclosure rate less than half of the industry average
($ millions)
Loan
Allowance for
Allowance as a %
Balance
Credit Losses
of Loan Balance
Accruing:
Commercial
477
83
17%
Investor Real Estate
991
252
25%
Residential First Mortgage
888
127
14%
Home Equity
403
57
14%
Other Consumer
60
1
1%
Total Accruing
2,819
520
18%
Non-accrual or 90+ DPD:
Commercial
372
93
25%
Investor Real Estate
474
145
31%
Residential First Mortgage
214
31
14%
Home Equity
30
4
14%
Other Consumer
1
0
1%
Total Non-accrual or 90+DPD
1,091
273
25%
Total Troubled Debt Restructurings
3,910
793
20% |