Attached files
| file | filename |
|---|---|
| 8-K - FORM 8-K - APARTMENT INVESTMENT & MANAGEMENT CO | c24768e8vk.htm |
Exhibit 99.1
| NAREIT Annual Convention November 15 - 17, 2011 |
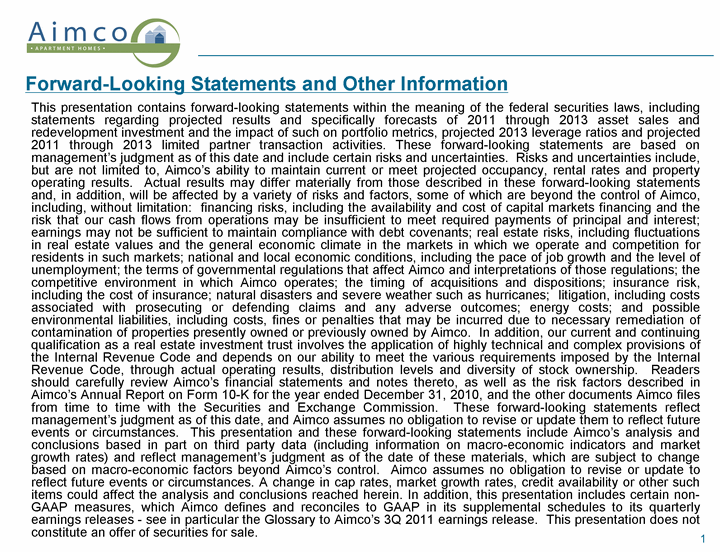
| 1 Forward-Looking Statements and Other Information This presentation contains forward-looking statements within the meaning of the federal securities laws, including statements regarding projected results and specifically forecasts of 2011 through 2013 asset sales and redevelopment investment and the impact of such on portfolio metrics, projected 2013 leverage ratios and projected 2011 through 2013 limited partner transaction activities. These forward-looking statements are based on management's judgment as of this date and include certain risks and uncertainties. Risks and uncertainties include, but are not limited to, Aimco's ability to maintain current or meet projected occupancy, rental rates and property operating results. Actual results may differ materially from those described in these forward-looking statements and, in addition, will be affected by a variety of risks and factors, some of which are beyond the control of Aimco, including, without limitation: financing risks, including the availability and cost of capital markets financing and the risk that our cash flows from operations may be insufficient to meet required payments of principal and interest; earnings may not be sufficient to maintain compliance with debt covenants; real estate risks, including fluctuations in real estate values and the general economic climate in the markets in which we operate and competition for residents in such markets; national and local economic conditions, including the pace of job growth and the level of unemployment; the terms of governmental regulations that affect Aimco and interpretations of those regulations; the competitive environment in which Aimco operates; the timing of acquisitions and dispositions; insurance risk, including the cost of insurance; natural disasters and severe weather such as hurricanes; litigation, including costs associated with prosecuting or defending claims and any adverse outcomes; energy costs; and possible environmental liabilities, including costs, fines or penalties that may be incurred due to necessary remediation of contamination of properties presently owned or previously owned by Aimco. In addition, our current and continuing qualification as a real estate investment trust involves the application of highly technical and complex provisions of the Internal Revenue Code and depends on our ability to meet the various requirements imposed by the Internal Revenue Code, through actual operating results, distribution levels and diversity of stock ownership. Readers should carefully review Aimco's financial statements and notes thereto, as well as the risk factors described in Aimco's Annual Report on Form 10-K for the year ended December 31, 2010, and the other documents Aimco files from time to time with the Securities and Exchange Commission. These forward-looking statements reflect management's judgment as of this date, and Aimco assumes no obligation to revise or update them to reflect future events or circumstances. This presentation and these forward-looking statements include Aimco's analysis and conclusions based in part on third party data (including information on macro-economic indicators and market growth rates) and reflect management's judgment as of the date of these materials, which are subject to change based on macro-economic factors beyond Aimco's control. Aimco assumes no obligation to revise or update to reflect future events or circumstances. A change in cap rates, market growth rates, credit availability or other such items could affect the analysis and conclusions reached herein. In addition, this presentation includes certain non- GAAP measures, which Aimco defines and reconciles to GAAP in its supplemental schedules to its quarterly earnings releases - see in particular the Glossary to Aimco's 3Q 2011 earnings release. This presentation does not constitute an offer of securities for sale. |
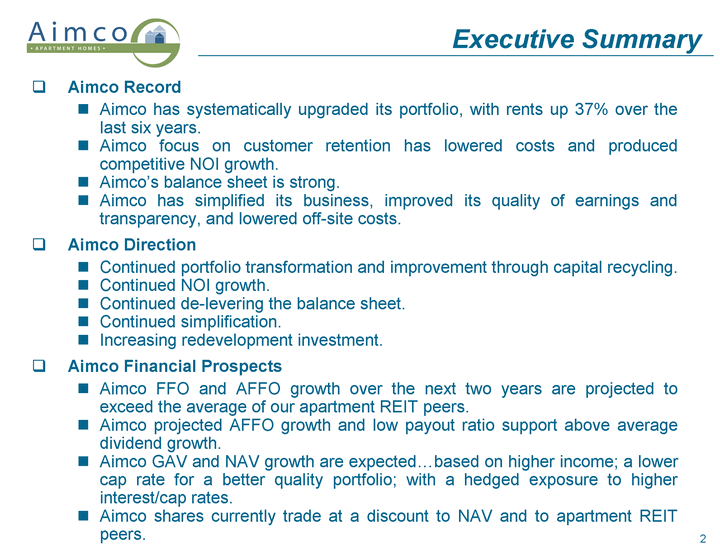
| 2 Aimco Record Aimco has systematically upgraded its portfolio, with rents up 37% over the last six years. Aimco focus on customer retention has lowered costs and produced competitive NOI growth. Aimco's balance sheet is strong. Aimco has simplified its business, improved its quality of earnings and transparency, and lowered off-site costs. Aimco Direction Continued portfolio transformation and improvement through capital recycling. Continued NOI growth. Continued de-levering the balance sheet. Continued simplification. Increasing redevelopment investment. Aimco Financial Prospects Aimco FFO and AFFO growth over the next two years are projected to exceed the average of our apartment REIT peers. Aimco projected AFFO growth and low payout ratio support above average dividend growth. Aimco GAV and NAV growth are expected...based on higher income; a lower cap rate for a better quality portfolio; with a hedged exposure to higher interest/cap rates. Aimco shares currently trade at a discount to NAV and to apartment REIT peers. Executive Summary |
| 3 Aimco Record |
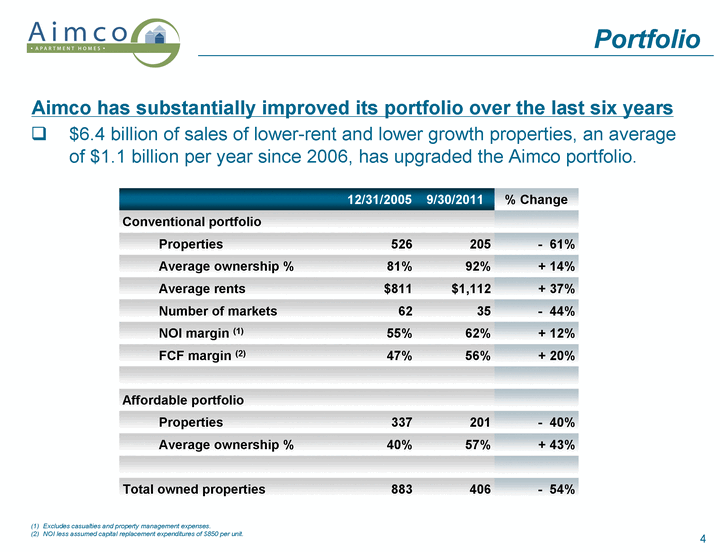
| 4 Excludes casualties and property management expenses. NOI less assumed capital replacement expenditures of $850 per unit. 12/31/2005 9/30/2011 % Change Conventional portfolio Properties 526 205 - 61% Average ownership % 81% 92% + 14% Average rents $811 $1,112 + 37% Number of markets 62 35 - 44% NOI margin (1) 55% 62% + 12% FCF margin (2) 47% 56% + 20% Affordable portfolio Properties 337 201 - 40% Average ownership % 40% 57% + 43% Total owned properties 883 406 - 54% Aimco has substantially improved its portfolio over the last six years Portfolio $6.4 billion of sales of lower-rent and lower growth properties, an average of $1.1 billion per year since 2006, has upgraded the Aimco portfolio. |
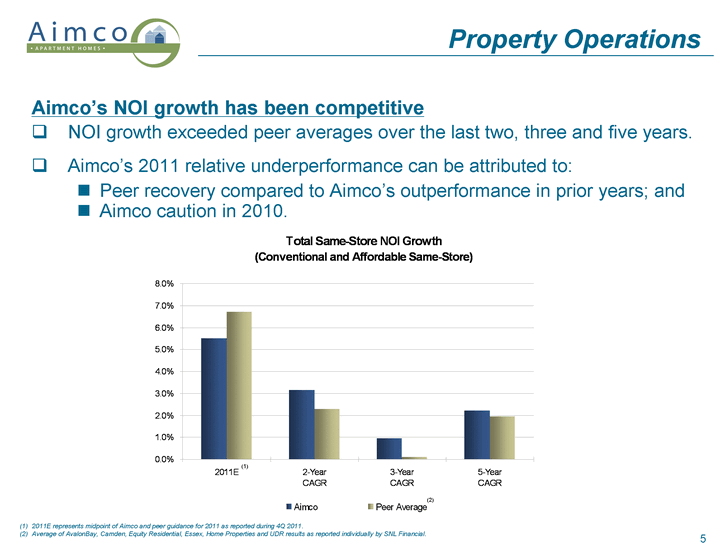
| 5 2011E represents midpoint of Aimco and peer guidance for 2011 as reported during 4Q 2011. Average of AvalonBay, Camden, Equity Residential, Essex, Home Properties and UDR results as reported individually by SNL Financial. Property Operations Aimco's NOI growth has been competitive (1) (2) NOI growth exceeded peer averages over the last two, three and five years. Aimco's 2011 relative underperformance can be attributed to: Peer recovery compared to Aimco's outperformance in prior years; and Aimco caution in 2010. |
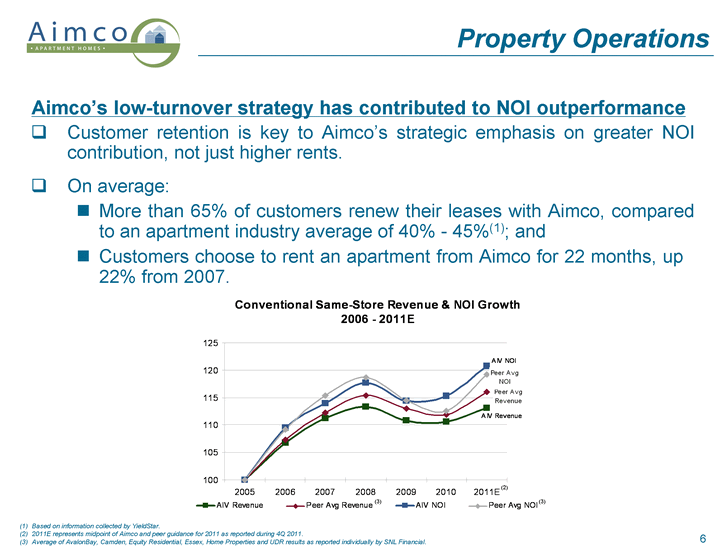
| (2) (3) (3) 6 Aimco's low-turnover strategy has contributed to NOI outperformance Property Operations Based on information collected by YieldStar. 2011E represents midpoint of Aimco and peer guidance for 2011 as reported during 4Q 2011. Average of AvalonBay, Camden, Equity Residential, Essex, Home Properties and UDR results as reported individually by SNL Financial. Customer retention is key to Aimco's strategic emphasis on greater NOI contribution, not just higher rents. On average: More than 65% of customers renew their leases with Aimco, compared to an apartment industry average of 40% - 45%(1); and Customers choose to rent an apartment from Aimco for 22 months, up 22% from 2007. |
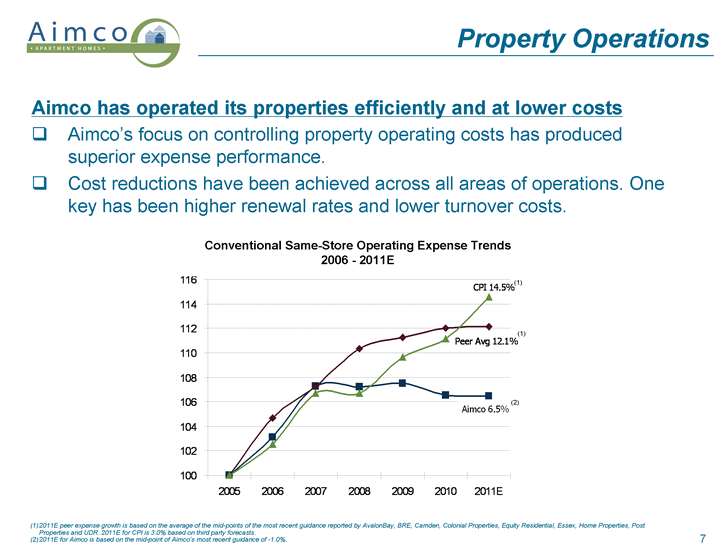
| 7 Property Operations Aimco's focus on controlling property operating costs has produced superior expense performance. Cost reductions have been achieved across all areas of operations. One key has been higher renewal rates and lower turnover costs. 2011E peer expense growth is based on the average of the mid-points of the most recent guidance reported by AvalonBay, BRE, Camden, Colonial Properties, Equity Residential, Essex, Home Properties, Post Properties and UDR. 2011E for CPI is 3.0% based on third party forecasts. 2011E for Aimco is based on the mid-point of Aimco's most recent guidance of -1.0%. Aimco has operated its properties efficiently and at lower costs Conventional Same-Store Operating Expense Trends 2006 - 2011E |
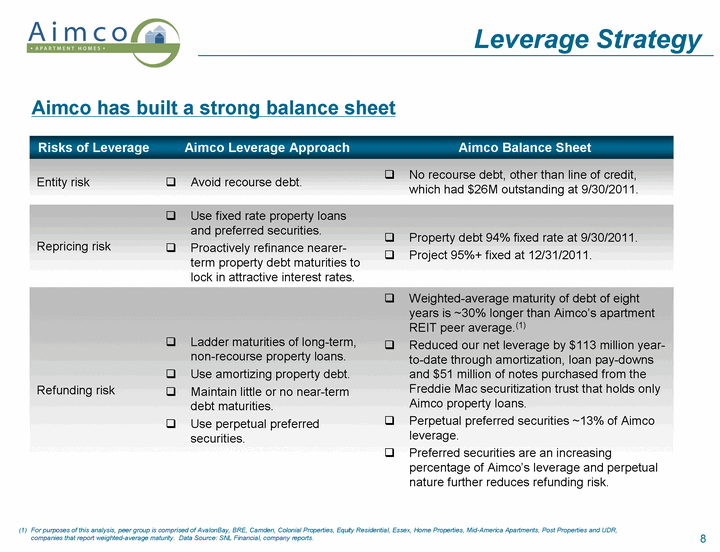
| 8 Leverage Strategy Risks of Leverage Aimco Leverage Approach Aimco Balance Sheet Entity risk Avoid recourse debt. No recourse debt, other than line of credit, which had $26M outstanding at 9/30/2011. Repricing risk Use fixed rate property loans and preferred securities. Proactively refinance nearer-term property debt maturities to lock in attractive interest rates. Property debt 94% fixed rate at 9/30/2011. Project 95%+ fixed at 12/31/2011. Refunding risk Ladder maturities of long-term, non-recourse property loans. Use amortizing property debt. Maintain little or no near-term debt maturities. Use perpetual preferred securities. Weighted-average maturity of debt of eight years is ~30% longer than Aimco's apartment REIT peer average.(1) Reduced our net leverage by $113 million year-to-date through amortization, loan pay-downs and $51 million of notes purchased from the Freddie Mac securitization trust that holds only Aimco property loans. Perpetual preferred securities ~13% of Aimco leverage. Preferred securities are an increasing percentage of Aimco's leverage and perpetual nature further reduces refunding risk. For purposes of this analysis, peer group is comprised of AvalonBay, BRE, Camden, Colonial Properties, Equity Residential, Essex, Home Properties, Mid-America Apartments, Post Properties and UDR, companies that report weighted-average maturity. Data Source: SNL Financial, company reports. Aimco has built a strong balance sheet |

| (1) 9 Simplification Aimco has simplified its business and lowered off-site costs Non-recurring revenue as a percentage of total revenue has been reduced by 86% from a high of 5.2% in 2008 to 0.7% in 2011. During 2011, Aimco will sell more than 100 low-ownership Affordable properties and asset managed properties and reduce costs associated with oversight and compliance activities. During 2010 and 2011, Aimco acquired limited partner interests in ten Conventional partnerships, which increase Aimco's investment in familiar assets in target markets and allows Aimco to reduce off-site costs associated with the administration of these partnerships. For purposes of this analysis, peer group is comprised of AvalonBay, BRE, Camden, Colonial Properties, Equity Residential, Essex, Home Properties, Mid-America Apartments, Post Properties and UDR. Data Source: SNL Financial, company reports. |
| 10 Aimco Direction |
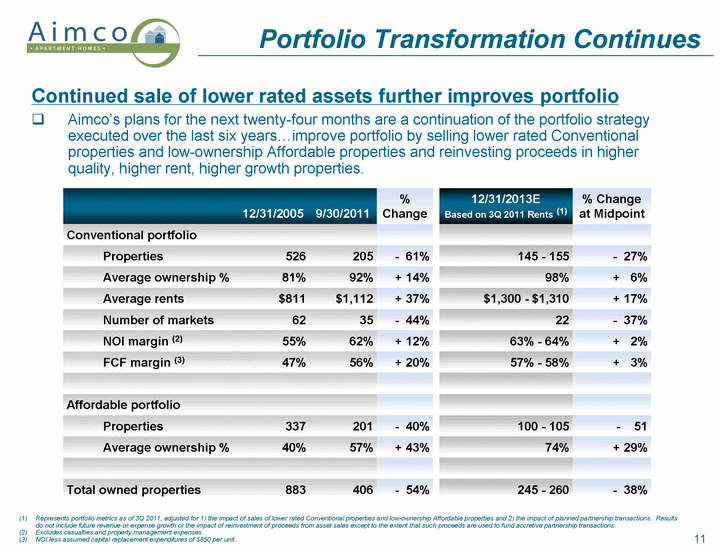
| 11 Represents portfolio metrics as of 3Q 2011, adjusted for 1) the impact of sales of lower rated Conventional properties and low-ownership Affordable properties and 2) the impact of planned partnership transactions. Results do not include future revenue or expense growth or the impact of reinvestment of proceeds from asset sales except to the extent that such proceeds are used to fund accretive partnership transactions. Excludes casualties and property management expenses. NOI less assumed capital replacement expenditures of $850 per unit. Portfolio Transformation Continues Continued sale of lower rated assets further improves portfolio Aimco's plans for the next twenty-four months are a continuation of the portfolio strategy executed over the last six years...improve portfolio by selling lower rated Conventional properties and low-ownership Affordable properties and reinvesting proceeds in higher quality, higher rent, higher growth properties. 12/31/2005 9/30/2011 % Change 12/31/2013E Based on 3Q 2011 Rents (1) % Change at Midpoint Conventional portfolio Properties 526 205 - 61% 145 - 155 - 27% Average ownership % 81% 92% + 14% 98% + 6% Average rents $811 $1,112 + 37% $1,300 - $1,310 + 17% Number of markets 62 35 - 44% 22 - 37% NOI margin (2) 55% 62% + 12% 63% - 64% + 2% FCF margin (3) 47% 56% + 20% 57% - 58% + 3% Affordable portfolio Properties 337 201 - 40% 100 - 105 - 51 Average ownership % 40% 57% + 43% 74% + 29% Total owned properties 883 406 - 54% 245 - 260 - 38% |
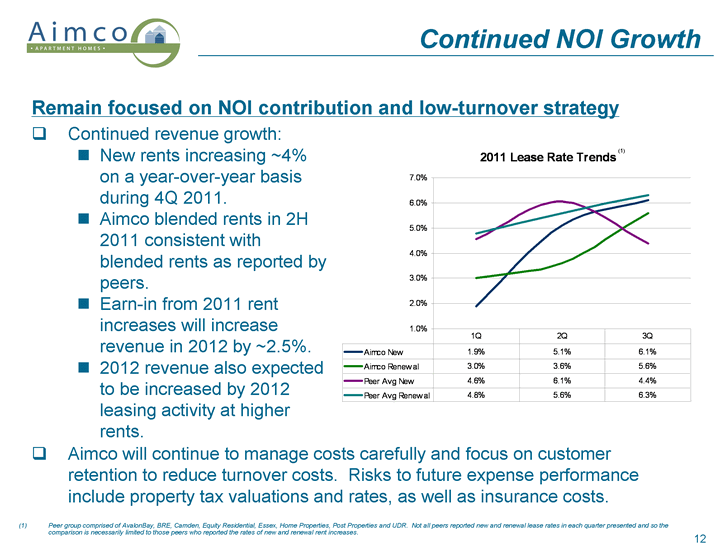
| 12 Continued NOI Growth Remain focused on NOI contribution and low-turnover strategy Continued revenue growth: New rents increasing ~4% on a year-over-year basis during 4Q 2011. Aimco blended rents in 2H 2011 consistent with blended rents as reported by peers. Earn-in from 2011 rent increases will increase revenue in 2012 by ~2.5%. 2012 revenue also expected to be increased by 2012 leasing activity at higher rents. Aimco will continue to manage costs carefully and focus on customer retention to reduce turnover costs. Risks to future expense performance include property tax valuations and rates, as well as insurance costs. (1) Peer group comprised of AvalonBay, BRE, Camden, Equity Residential, Essex, Home Properties, Post Properties and UDR. Not all peers reported new and renewal lease rates in each quarter presented and so the comparison is necessarily limited to those peers who reported the rates of new and renewal rent increases. |
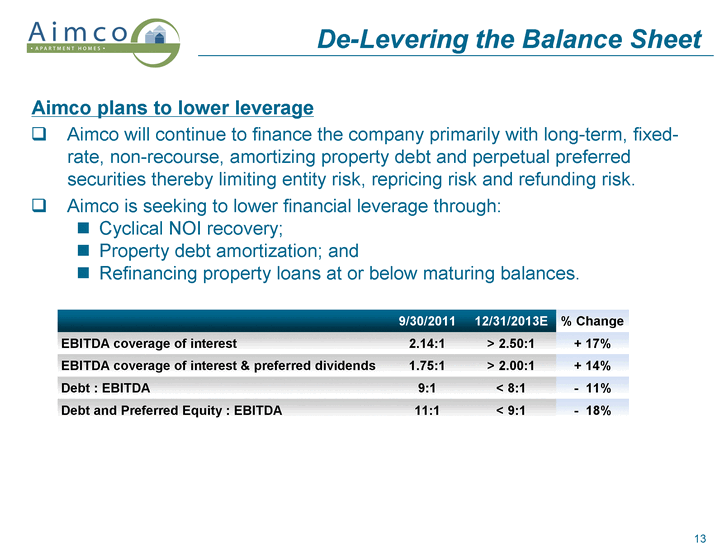
| 13 De-Levering the Balance Sheet Aimco will continue to finance the company primarily with long-term, fixed- rate, non-recourse, amortizing property debt and perpetual preferred securities thereby limiting entity risk, repricing risk and refunding risk. Aimco is seeking to lower financial leverage through: Cyclical NOI recovery; Property debt amortization; and Refinancing property loans at or below maturing balances. Aimco plans to lower leverage 9/30/2011 12/31/2013E % Change EBITDA coverage of interest 2.14:1 > 2.50:1 + 17% EBITDA coverage of interest & preferred dividends 1.75:1 > 2.00:1 + 14% Debt : EBITDA 9:1 < 8:1 - 11% Debt and Preferred Equity : EBITDA 11:1 < 9:1 - 18% |
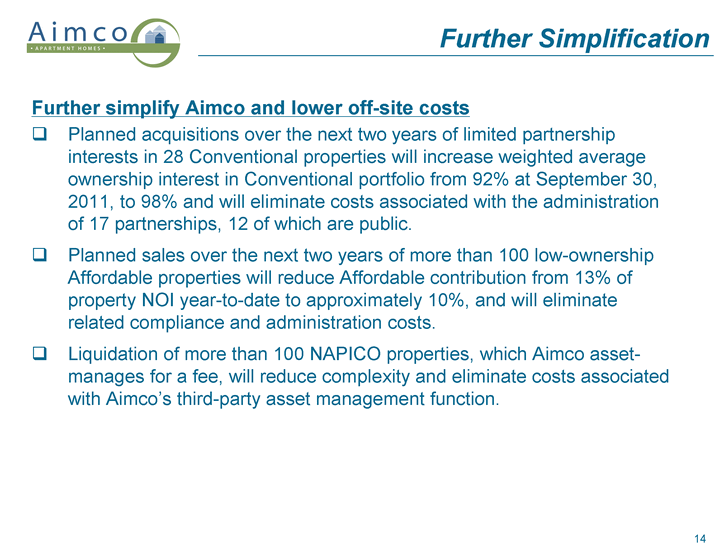
| 14 Further Simplification Further simplify Aimco and lower off-site costs Planned acquisitions over the next two years of limited partnership interests in 28 Conventional properties will increase weighted average ownership interest in Conventional portfolio from 92% at September 30, 2011, to 98% and will eliminate costs associated with the administration of 17 partnerships, 12 of which are public. Planned sales over the next two years of more than 100 low-ownership Affordable properties will reduce Affordable contribution from 13% of property NOI year-to-date to approximately 10%, and will eliminate related compliance and administration costs. Liquidation of more than 100 NAPICO properties, which Aimco asset- manages for a fee, will reduce complexity and eliminate costs associated with Aimco's third-party asset management function. |
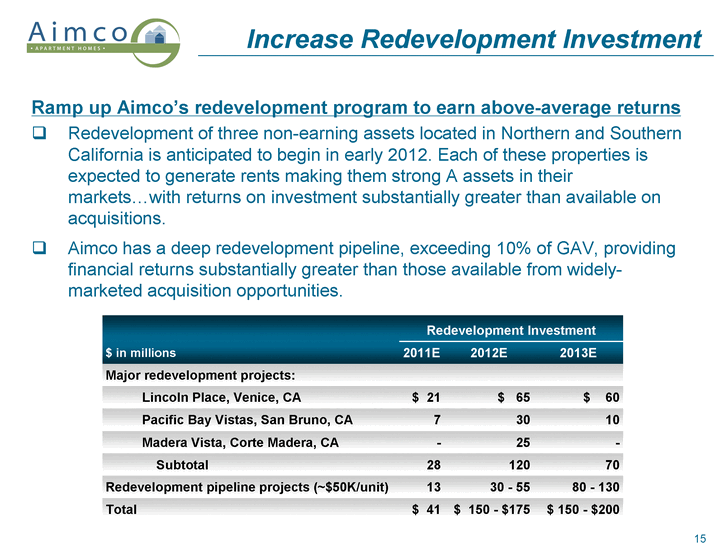
| 15 Redevelopment of three non-earning assets located in Northern and Southern California is anticipated to begin in early 2012. Each of these properties is expected to generate rents making them strong A assets in their markets...with returns on investment substantially greater than available on acquisitions. Aimco has a deep redevelopment pipeline, exceeding 10% of GAV, providing financial returns substantially greater than those available from widely- marketed acquisition opportunities. Redevelopment Investment Redevelopment Investment Redevelopment Investment $ in millions 2011E 2012E 2013E Major redevelopment projects: Lincoln Place, Venice, CA $ 21 $ 65 $ 60 Pacific Bay Vistas, San Bruno, CA 7 30 10 Madera Vista, Corte Madera, CA - 25 - Subtotal 28 120 70 Redevelopment pipeline projects (~$50K/unit) 13 30 - 55 80 - 130 Total $ 41 $ 150 - $175 $ 150 - $200 Increase Redevelopment Investment Ramp up Aimco's redevelopment program to earn above-average returns |
| 16 Aimco Financial Prospects |
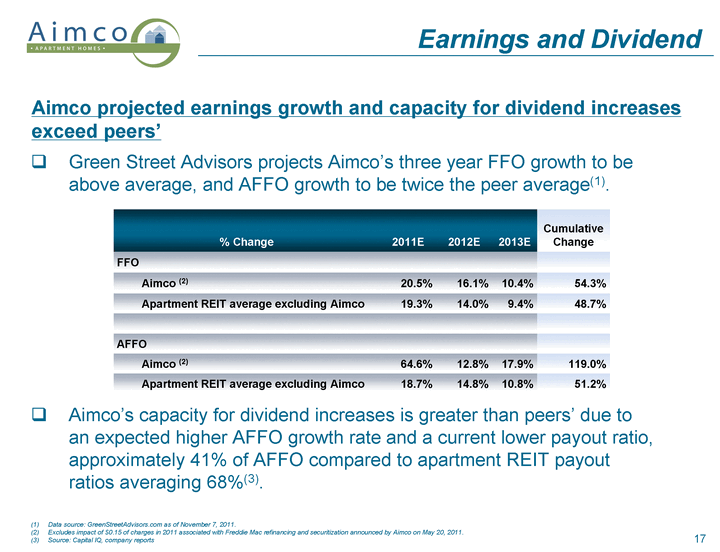
| 17 Earnings and Dividend Aimco's capacity for dividend increases is greater than peers' due to an expected higher AFFO growth rate and a current lower payout ratio, approximately 41% of AFFO compared to apartment REIT payout ratios averaging 68%(3). Data source: GreenStreetAdvisors.com as of November 7, 2011. Excludes impact of $0.15 of charges in 2011 associated with Freddie Mac refinancing and securitization announced by Aimco on May 20, 2011. Source: Capital IQ, company reports Green Street Advisors projects Aimco's three year FFO growth to be above average, and AFFO growth to be twice the peer average(1). Aimco projected earnings growth and capacity for dividend increases exceed peers' % Change 2011E 2012E 2013E Cumulative Change FFO Aimco (2) 20.5% 16.1% 10.4% 54.3% Apartment REIT average excluding Aimco 19.3% 14.0% 9.4% 48.7% AFFO Aimco (2) 64.6% 12.8% 17.9% 119.0% Apartment REIT average excluding Aimco 18.7% 14.8% 10.8% 51.2% |
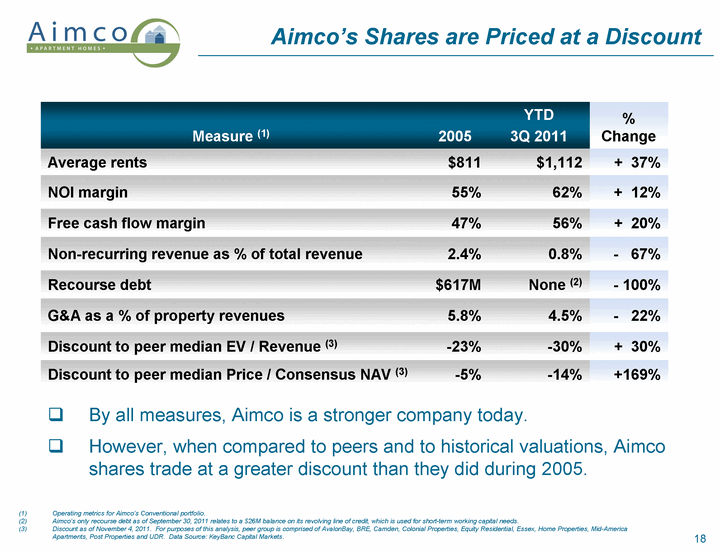
| 18 By all measures, Aimco is a stronger company today. However, when compared to peers and to historical valuations, Aimco shares trade at a greater discount than they did during 2005. Measure (1) 2005 YTD 3Q 2011 % Change Average rents $811 $1,112 + 37% NOI margin 55% 62% + 12% Free cash flow margin 47% 56% + 20% Non-recurring revenue as % of total revenue 2.4% 0.8% - 67% Recourse debt $617M None (2) - 100% G&A as a % of property revenues 5.8% 4.5% - 22% Discount to peer median EV / Revenue (3) -23% -30% + 30% Discount to peer median Price / Consensus NAV (3) -5% -14% +169% Aimco's Shares are Priced at a Discount Operating metrics for Aimco's Conventional portfolio. Aimco's only recourse debt as of September 30, 2011 relates to a $26M balance on its revolving line of credit, which is used for short-term working capital needs. Discount as of November 4, 2011. For purposes of this analysis, peer group is comprised of AvalonBay, BRE, Camden, Colonial Properties, Equity Residential, Essex, Home Properties, Mid-America Apartments, Post Properties and UDR. Data Source: KeyBanc Capital Markets. |
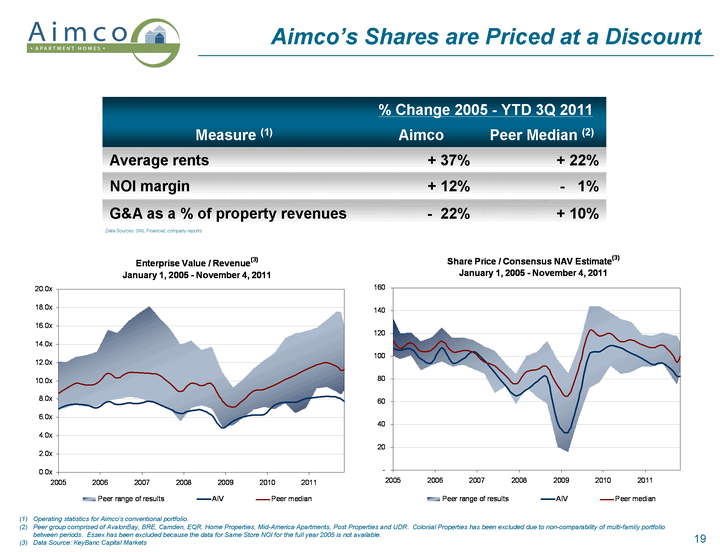
| 19 Data Sources: SNL Financial, company reports Operating statistics for Aimco's conventional portfolio. Peer group comprised of AvalonBay, BRE, Camden, EQR, Home Properties, Mid-America Apartments, Post Properties and UDR. Colonial Properties has been excluded due to non-comparability of multi-family portfolio between periods. Essex has been excluded because the data for Same Store NOI for the full year 2005 is not available. Data Source: KeyBanc Capital Markets Aimco's Shares are Priced at a Discount % Change 2005 - YTD 3Q 2011 % Change 2005 - YTD 3Q 2011 Measure (1) Aimco Peer Median (2) Average rents + 37% + 22% NOI margin + 12% - 1% G&A as a % of property revenues - 22% + 10% |
| 20 Appendix |
| 21 New lease rents continue to increase as apartment fundamentals remain positive, but the rates of increase are lower than we achieved earlier in 2011. Rents are still rising. Demand has eased. Some of the slower pace can be attributed to seasonality, but some is due to a broader economic slowdown and stock market turbulence. This easing has impacted Aimco: Visits at our properties are down 20%, although this also reflects changes in Web advertising. Move-ins are also down, at 6%. Although we see a slower pace of rent growth across our entire portfolio when compared to the summer months, the slowdown is more pronounced in certain submarkets, and those submarkets are ones with lower price points. In markets where we have properties at multiple price points, we do not see a discernable difference by price point in our ability to increase rents. We have been focused on selling lower-rated properties at lower price points. We will continue on this path, as the growth rates for these properties, while positive, remains lower than for our other properties. Sales of lower-rent properties has a magnified positive impact on Free Cash Flow because CR spending is a higher percentage of NOI from these properties than is the case in the rest of our portfolio. Appendix |
