Attached files
| file | filename |
|---|---|
| EX-99.1 - EX-99.1 - DORAL FINANCIAL CORP | d252010dex991.htm |
| 8-K - 8-K - DORAL FINANCIAL CORP | d252010d8k.htm |
EXHIBIT 99.2
Doral Financial Corporation
Q3 Investor Presentation
November 2011
Disclaimer
This presentation may include forward-looking statements as defined in the Private Securities Litigation Reform Act of 1995 (the “PSLRA”). These include comments with respect to our objectives and strategies, and the results of our operations and our business. Forward-looking statements can be identified by the fact that they do not relate strictly to historical or current facts. They often include words such as “expects,” “anticipates,” “intends,” “plans,” “believes,” “seeks,” “estimates,” or words of similar meaning, or future or conditional verbs such as “will,” “would,” “should,” “could” or “may.” We intend these forward-looking statements to be covered by the safe harbor provisions of the PSLRA.
Forward-looking statements provide our expectations or predictions of future conditions, events or results. They are, by their nature, subject to risks and uncertainties. They are not guarantees of future performance, and actual results may differ materially. By their nature, these forward-looking statements involve numerous assumptions and uncertainties, both general and specific, including those discussed in Doral Financial Corporation’s 2010 Annual Report on Form 10-K and other filings we make with the Securities and Exchange Commission. Risk factors and uncertainties that could cause the Company’s actual results to differ materially from those described in forward-looking statements can be found in the Company’s 2010 Annual Report on Form 10-K, which is available in the Company’s website at www.doralfinancial.com, as they may be updated from time to time in the Company’s periodic and other reports filed with the Securities and Exchange Commission.
The statements in this presentation speak only as of the date they are made. We do not undertake to update forward-looking statements to reflect the impact of circumstances or events that arise after the date the forward-looking statements were made.
| 2 |
|
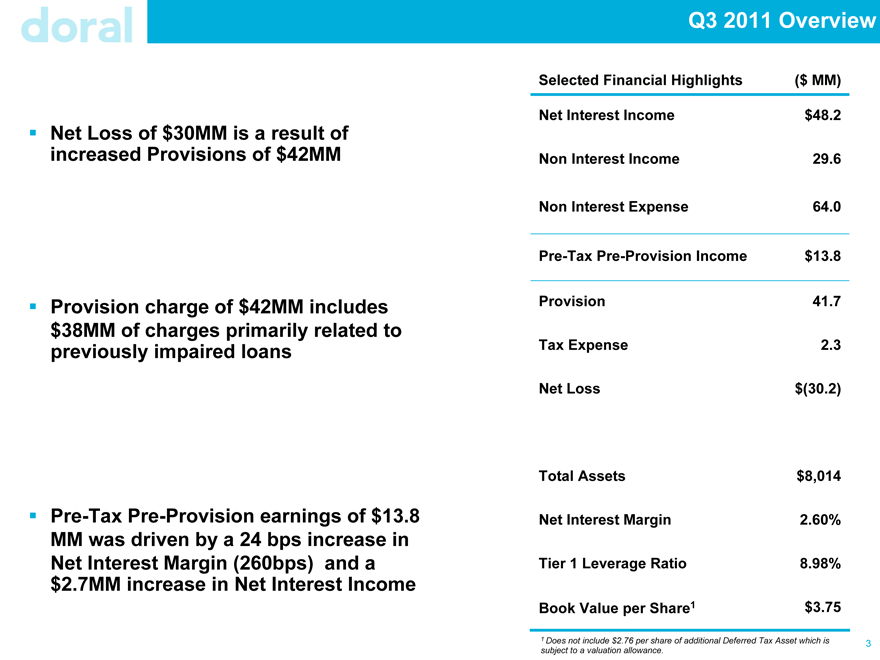
Q3 2011 Overview
Net Loss of $30MM is a result of increased Provisions of $42MM
Provision charge of $42MM includes $38MM of charges primarily related to previously impaired loans
Pre-Tax Pre-Provision earnings of $13.8 MM was driven by a 24 bps increase in Net Interest Margin (260bps) and a $2.7MM increase in Net Interest Income
Selected Financial Highlights ($ MM) Net Interest Income $48.2 Non Interest Income 29.6
Non Interest Expense 64.0
Pre-Tax Pre-Provision Income $13.8
Provision 41.7 Tax Expense 2.3 Net Loss $(30.2)
Total Assets $8,014 Net Interest Margin 2.60% Tier 1 Leverage Ratio 8.98% Book Value per Share1 $3.75
| 1 |
|
Does not include $2.76 per share of additional Deferred Tax Asset which is subject to a valuation allowance. |
| 3 |
|
Credit & Provisions
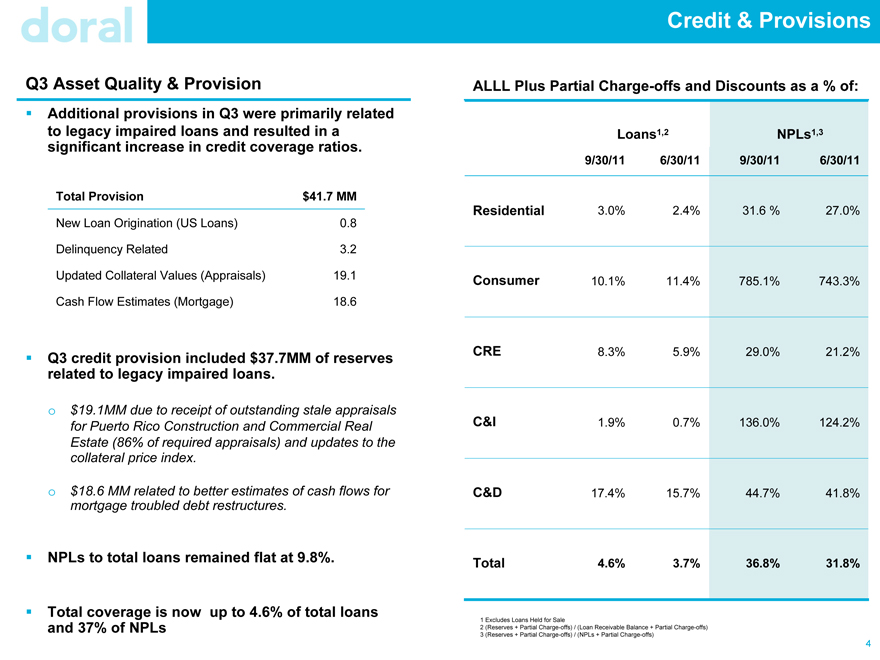
Q3 Asset Quality & Provision
Additional provisions in Q3 were primarily related to legacy impaired loans and resulted in a significant increase in credit coverage ratios.
Total Provision $41.7 MM
New Loan Origination (US Loans) 0.8
Delinquency Related 3.2
Updated Collateral Values (Appraisals) 19.1
Cash Flow Estimates (Mortgage) 18.6
Q3 credit provision included $37.7MM of reserves related to legacy impaired loans.
$19.1MM due to receipt of outstanding stale appraisals for Puerto Rico Construction and Commercial Real Estate (86% of required appraisals) and updates to the collateral price index.
$18.6 MM related to better estimates of cash flows for mortgage troubled debt restructures.
NPLs to total loans remained flat at 9.8%.
Total coverage is now up to 4.6% of total loans and 37% of NPLs
ALLL Plus Partial Charge-offs and Discounts as a % of:
Loans1,2 NPLs1,3
9/30/11 6/30/11 9/30/11 6/30/11
Residential 3.0% 2.4% 31.6 % 27.0%
Consumer 10.1% 11.4% 785.1% 743.3%
CRE 8.3% 5.9% 29.0% 21.2%
C&I 1.9% 0.7% 136.0% 124.2%
C&D 17.4% 15.7% 44.7% 41.8%
Total 4.6% 3.7% 36.8% 31.8%
| 1 |
|
Excludes Loans Held for Sale |
| 2 |
|
(Reserves + Partial Charge- offs) / (Loan Receivable Balance + Partial Charge- offs) |
| 3 |
|
(Reserves + Partial Charge- offs) / (NPLs + Partial Charge-offs) |
| 4 |
|
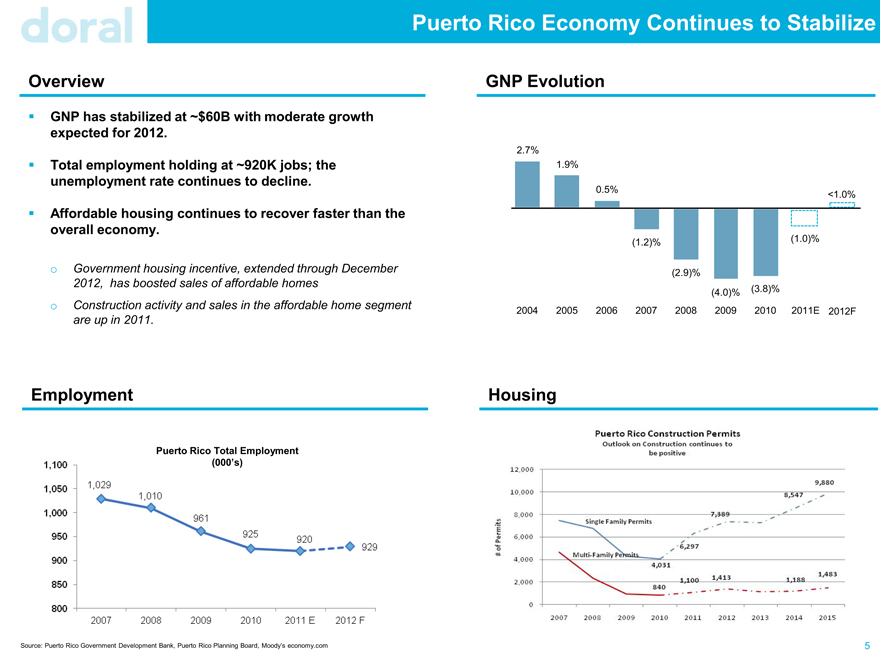
Puerto Rico Economy Continues to Stabilize
Overview
GNP has stabilized at ~$60B with moderate growth expected for 2012.
Total employment holding at ~920K jobs; the unemployment rate continues to decline.
Affordable housing continues to recover faster than the overall economy.
Government housing incentive, extended through December 2012, has boosted sales of affordable homes Construction activity and sales in the affordable home segment are up in 2011.
GNP Evolution
2.7%
1.9%
0.5% <1.0%
(1.2)% (1.0)%
(2.9)%
(4.0)% (3.8)%
2004 2005 2006 2007 2008 2009 2010 2011E 2012F
Employment
Puerto Rico Total Employment (000’s)
Housing
Source: Puerto Rico Government Development Bank, Puerto Rico Planning Board, Moody’s economy.com
Puerto Rico Construction Permits Outlook on Construction continues to be positive
| 5 |
|
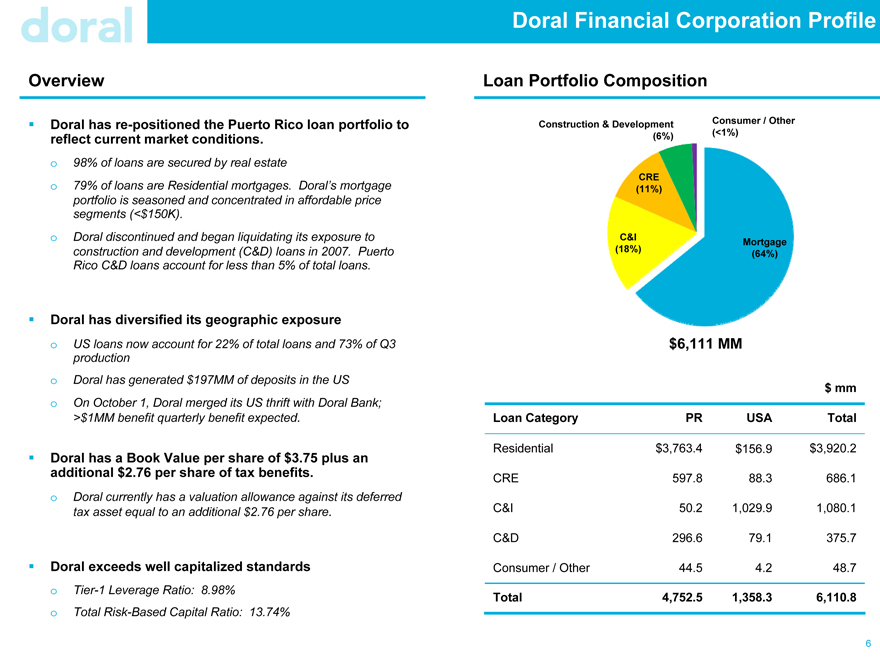
Doral Financial Corporation Profile
Overview
Doral has re-positioned the Puerto Rico loan portfolio to reflect current market conditions. o 98% of loans are secured by real estate o 79% of loans are Residential mortgages. Doral’s mortgage portfolio is seasoned and concentrated in affordable price segments (<$150K). o Doral discontinued and began liquidating its exposure to construction and development (C&D) loans in 2007. Puerto Rico C&D loans account for less than 5% of total loans.
Doral has diversified its geographic exposure o US loans now account for 22% of total loans and 73% of Q3 production o Doral has generated $197MM of deposits in the US o On October 1, Doral merged its US thrift with Doral Bank;
>$1MM benefit quarterly benefit expected.
Doral has a Book Value per share of $3.75 plus an additional $2.76 per share of tax benefits. o Doral currently has a valuation allowance against its deferred tax asset equal to an additional $2.76 per share.
Doral exceeds well capitalized standards o Tier-1 Leverage Ratio: 8.98% o Total Risk-Based Capital Ratio: 13.74%
Loan Portfolio Composition
Construction & Development Consumer / Other (6%) (<1%)
CRE (11%)
C&I Mortgage (18%) (64%)
$6,111 MM
$ mm
Loan Category PR USA Total
Residential $3,763.4 $156.9 $3,920.2
CRE 597.8 88.3 686.1
C&I 50.2 1,029.9 1,080.1
C&D 296.6 79.1 375.7
Consumer / Other 44.5 4.2 48.7
Total 4,752.5 1,358.3 6,110.8
| 6 |
|
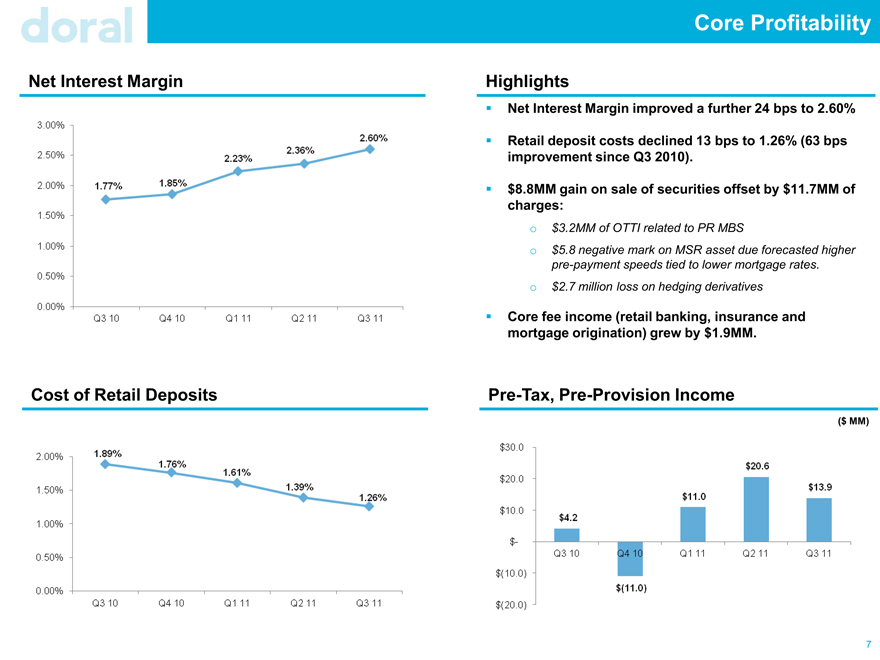
Core Profitability
Net Interest Margin
Cost of Retail Deposits
Highlights
Net Interest Margin improved a further 24 bps to 2.60%
Retail deposit costs declined 13 bps to 1.26% (63 bps improvement since Q3 2010).
$8.8MM gain on sale of securities offset by $11.7MM of charges: $3.2MM of OTTI related to PR MBS $5.8 negative mark on MSR asset due forecasted higher pre-payment speeds tied to lower mortgage rates. o $2.7 million loss on hedging derivatives
Core fee income (retail banking, insurance and mortgage origination) grew by $1.9MM.
Pre-Tax, Pre-Provision Income
($ MM)
| 7 |
|
Doral’s Improvements are Sustainable
Capital ratios are strong.
A flattening economy combined with effective collections strategies have stabilized asset quality.
Business repositioning is expanding earnings power.
| 8 |
|

Investor Relations Contact and Conference Replay Details
Investor Relations:
Christopher Poulton 212 / 329-3794 christopher.poulton@doralfinancial.com
Conference Call:
November 10, 2011 10.00 am (Eastern) Tel. (800) 288-8967 or (612) 332-0228
Conference Call Replay: November 10, 2011 – December 10, 2011 Tel. (800) 475-6701 or (320) 365-3844 Access Code: 224220
9

Exhibit A
Summary Financials
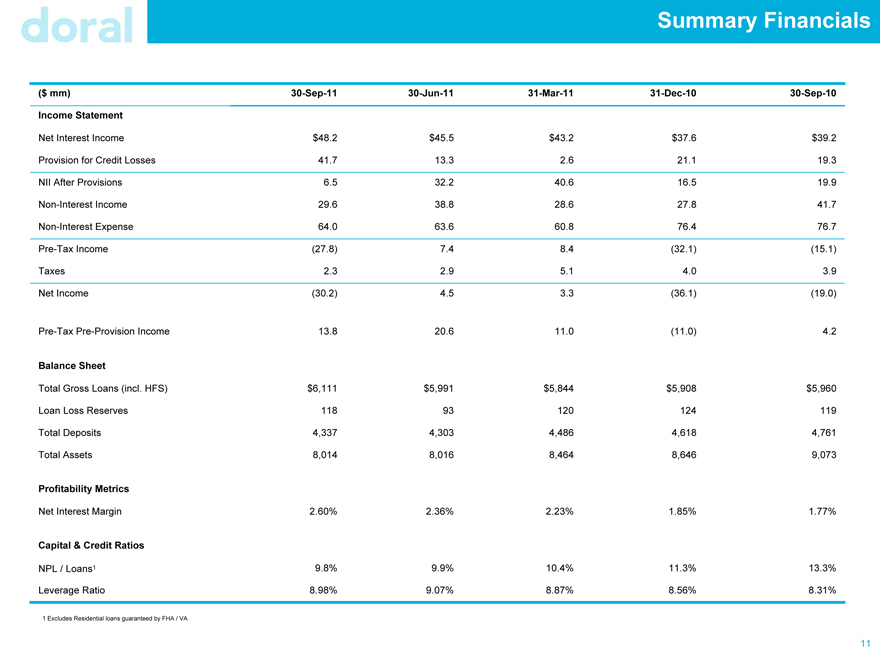
Summary Financials
($ mm) 30-Sep-11 30- Jun-11 31- Mar-11 31- Dec-10 30-Sep-10
Income Statement
Net Interest Income $48.2 $45.5 $43.2 $37.6 $39.2
Provision for Credit Losses 41.7 13.3 2.6 21.1 19.3
NII After Provisions 6.5 32.2 40.6 16.5 19.9
Non-Interest Income 29.6 38.8 28.6 27.8 41.7
Non-Interest Expense 64.0 63.6 60.8 76.4 76.7
Pre-Tax Income (27.8) 7.4 8.4 (32.1) (15.1)
Taxes 2.3 2.9 5.1 4.0 3.9
Net Income (30.2) 4.5 3.3 (36.1) (19.0)
Pre-Tax Pre-Provision Income 13.8 20.6 11.0 (11.0) 4.2
Balance Sheet
Total Gross Loans (incl. HFS) $6,111 $5,991 $5,844 $5,908 $5,960
Loan Loss Reserves 118 93 120 124 119
Total Deposits 4,337 4,303 4,486 4,618 4,761
Total Assets 8,014 8,016 8,464 8,646 9,073
Profitability Metrics
Net Interest Margin 2.60% 2.36% 2.23% 1.85% 1.77%
Capital & Credit Ratios
NPL / Loans1 9.8% 9.9% 10.4% 11.3% 13.3%
Leverage Ratio 8.98% 9.07% 8.87% 8.56% 8.31%
| 1 |
|
Excludes Residential loans guaranteed by FHA / VA |
11