Attached files
| file | filename |
|---|---|
| 8-K - FORM 8-K - Brooks Automation, Inc. | b88928e8vk.htm |
| EX-99.1 - EX-99.1 - Brooks Automation, Inc. | b88928exv99w1.htm |
Exhibit 99.2
| (c) Copyright 2011 by Brooks Automation, Inc. - Proprietary Information 1 4th Quarter Fiscal 2011 Financial Results Conference Call November 10, 2011 |
| (c) Copyright 2011 by Brooks Automation, Inc. - Proprietary Information 2 Safe Harbor Statement "Safe Harbor" Statement under the U.S. Private Securities Litigation Reform Act of 1995; certain matters in this presentation, including forecasts of future demand and future Company performance, are forward-looking statements that are subject to risks and uncertainties that could cause actual results to materially differ, either better or worse, from those projected. Further discussions of risk factors are available in the Company's most recent SEC filings including form 10-K for the fiscal year ended 9/30/10. The Company assumes no obligation to update the information in this presentation. Regulation G This presentation contains certain non-GAAP measures which are provided to assist in an understanding of the Brooks business and it's operational performance. These measures should always be considered in conjunction with the appropriate GAAP measure. Reconciliations of all non-GAAP amounts to the relevant GAAP amount are provided in either an attachment to our fourth quarter financial results press release issued on November 10, 2011 or as an attachment to call slides used to accompany prepared comments made during our financial results conference call of the same date. Both documents are available on our web site at www.brooks.com. |
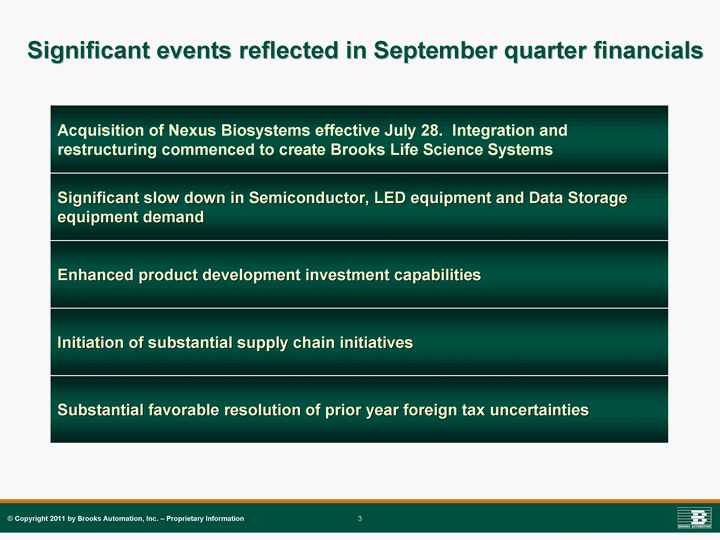
| (c) Copyright 2011 by Brooks Automation, Inc. - Proprietary Information 3 Significant events reflected in September quarter financials Acquisition of Nexus Biosystems effective July 28. Integration and restructuring commenced to create Brooks Life Science Systems Significant slow down in Semiconductor, LED equipment and Data Storage equipment demand Enhanced product development investment capabilities Initiation of substantial supply chain initiatives Substantial favorable resolution of prior year foreign tax uncertainties |
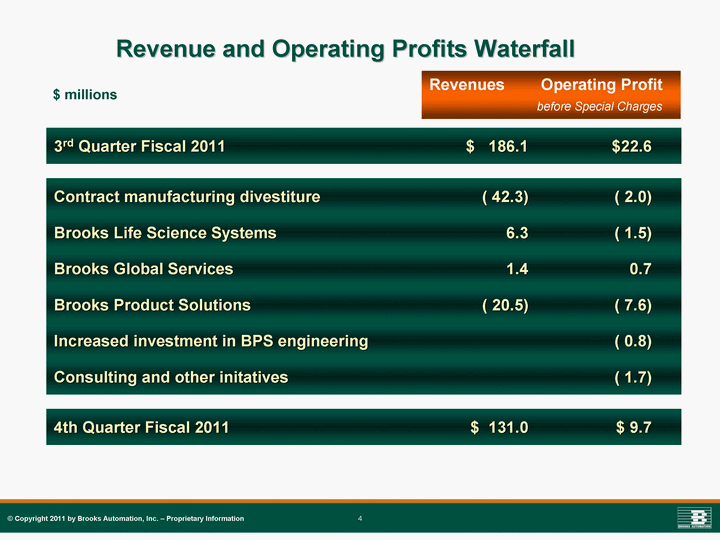
| (c) Copyright 2011 by Brooks Automation, Inc. - Proprietary Information 4 Revenue and Operating Profits Waterfall 3rd Quarter Fiscal 2011 $ 186.1 $22.6 Contract manufacturing divestiture ( 42.3) ( 2.0) Brooks Life Science Systems 6.3 ( 1.5) Brooks Global Services 1.4 0.7 Brooks Product Solutions ( 20.5) ( 7.6) Increased investment in BPS engineering ( 0.8) Consulting and other initatives ( 1.7) 4th Quarter Fiscal 2011 $ 131.0 $ 9.7 Revenues Operating Profit before Special Charges $ millions |
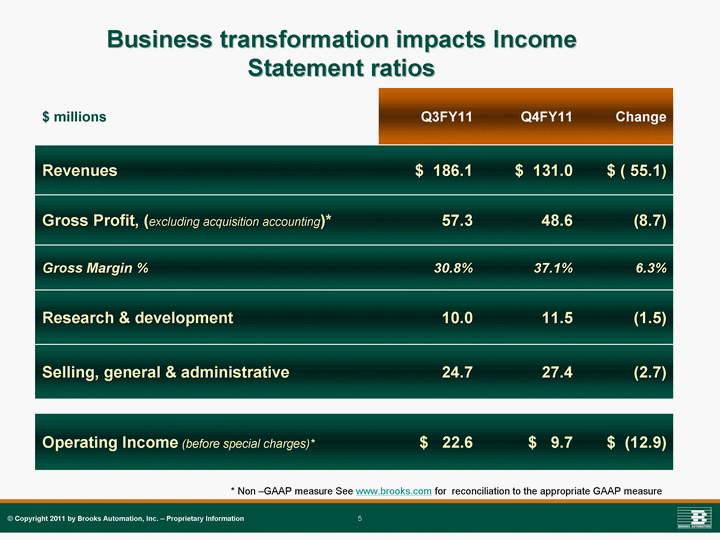
| (c) Copyright 2011 by Brooks Automation, Inc. - Proprietary Information 5 Business transformation impacts Income Statement ratios $ millions Q3FY11 Q4FY11 Change Revenues $ 186.1 $ 131.0 $ ( 55.1) Gross Profit, (excluding acquisition accounting)* 57.3 48.6 (8.7) Gross Margin % 30.8% 37.1% 6.3% Research & development 10.0 11.5 (1.5) Selling, general & administrative 24.7 27.4 (2.7) Operating Income (before special charges)* $ 22.6 $ 9.7 $ (12.9) * Non -GAAP measure See www.brooks.com for reconciliation to the appropriate GAAP measure |
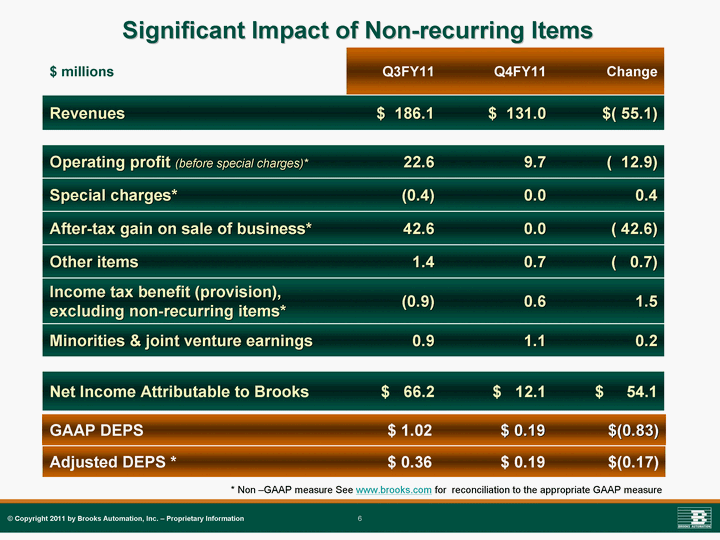
| (c) Copyright 2011 by Brooks Automation, Inc. - Proprietary Information 6 Significant Impact of Non-recurring Items $ millions Q3FY11 Q4FY11 Change Revenues $ 186.1 $ 131.0 $( 55.1) Operating profit (before special charges)* 22.6 9.7 ( 12.9) Special charges* (0.4) 0.0 0.4 After-tax gain on sale of business* 42.6 0.0 ( 42.6) Other items 1.4 0.7 ( 0.7) Income tax benefit (provision), excluding non-recurring items* (0.9) 0.6 1.5 Minorities & joint venture earnings 0.9 1.1 0.2 Net Income Attributable to Brooks $ 66.2 $ 12.1 $ 54.1 GAAP DEPS $ 1.02 $ 0.19 $(0.83) Adjusted DEPS * $ 0.36 $ 0.19 $(0.17) * Non -GAAP measure See www.brooks.com for reconciliation to the appropriate GAAP measure |
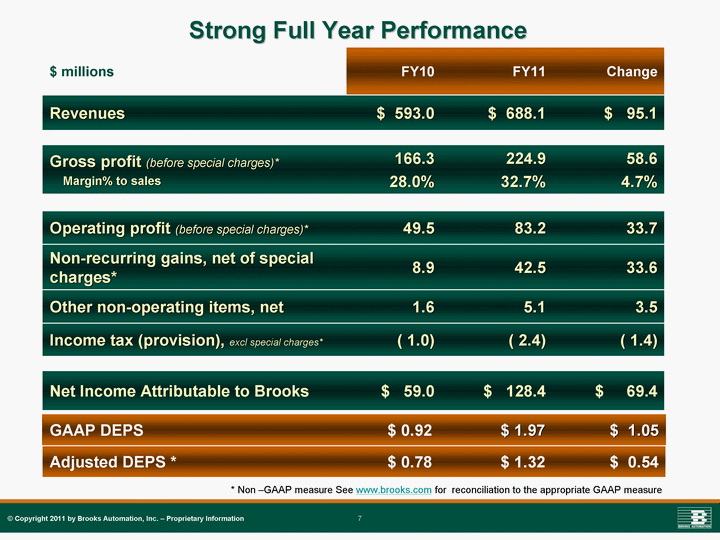
| (c) Copyright 2011 by Brooks Automation, Inc. - Proprietary Information 7 Strong Full Year Performance $ millions FY10 FY11 Change Revenues $ 593.0 $ 688.1 $ 95.1 Gross profit (before special charges)* Margin% to sales 166.3 28.0% 224.9 32.7% 58.6 4.7% Operating profit (before special charges)* 49.5 83.2 33.7 Non-recurring gains, net of special charges* 8.9 42.5 33.6 Other non-operating items, net 1.6 5.1 3.5 Income tax (provision), excl special charges* ( 1.0) ( 2.4) ( 1.4) Net Income Attributable to Brooks $ 59.0 $ 128.4 $ 69.4 GAAP DEPS $ 0.92 $ 1.97 $ 1.05 Adjusted DEPS * $ 0.78 $ 1.32 $ 0.54 * Non -GAAP measure See www.brooks.com for reconciliation to the appropriate GAAP measure |
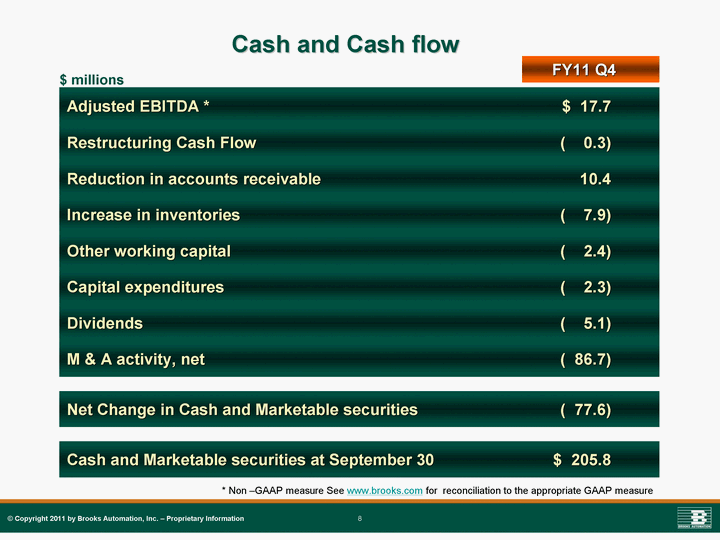
| (c) Copyright 2011 by Brooks Automation, Inc. - Proprietary Information 8 Cash and Cash flow Adjusted EBITDA * $ 17.7 Restructuring Cash Flow ( 0.3) Reduction in accounts receivable 10.4 Increase in inventories ( 7.9) Other working capital ( 2.4) Capital expenditures ( 2.3) Dividends ( 5.1) M & A activity, net ( 86.7) Net Change in Cash and Marketable securities ( 77.6) Cash and Marketable securities at September 30 $ 205.8 FY11 Q4 $ millions * Non -GAAP measure See www.brooks.com for reconciliation to the appropriate GAAP measure |
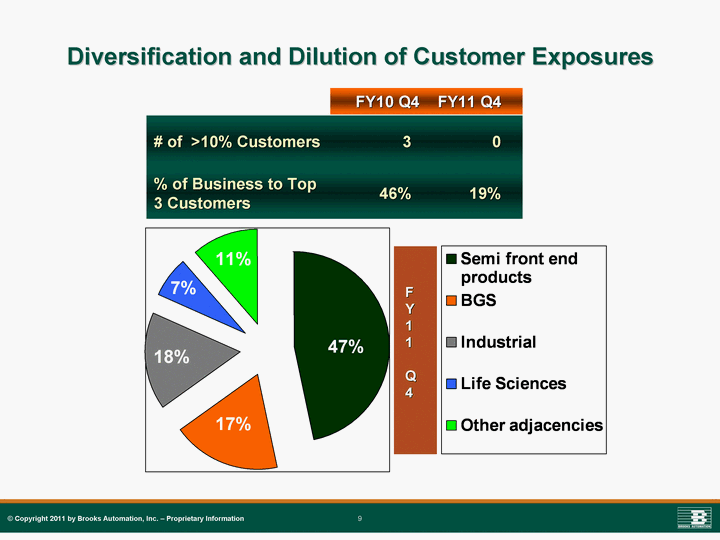
| (c) Copyright 2011 by Brooks Automation, Inc. - Proprietary Information 9 Diversification and Dilution of Customer Exposures # of >10% Customers 3 0 % of Business to Top 3 Customers 46% 19% FY10 Q4 FY11 Q4 Semi front end products BGS Industrial Life Sciences Other adjacencies East 0.467 0.183 0.168 0.068 0.114 47% 18% 11% 17% F Y 1 1 Q 4 7% |
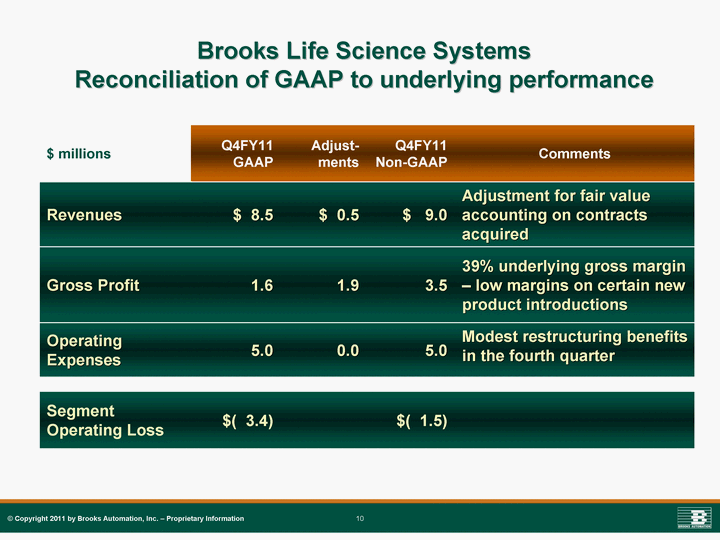
| (c) Copyright 2011 by Brooks Automation, Inc. - Proprietary Information 10 Brooks Life Science Systems Reconciliation of GAAP to underlying performance $ millions Q4FY11 GAAP Adjust-ments Q4FY11 Non-GAAP Comments Revenues $ 8.5 $ 0.5 $ 9.0 Adjustment for fair value accounting on contracts acquired Gross Profit 1.6 1.9 3.5 39% underlying gross margin - low margins on certain new product introductions Operating Expenses 5.0 0.0 5.0 Modest restructuring benefits in the fourth quarter Segment Operating Loss $( 3.4) $( 1.5) |
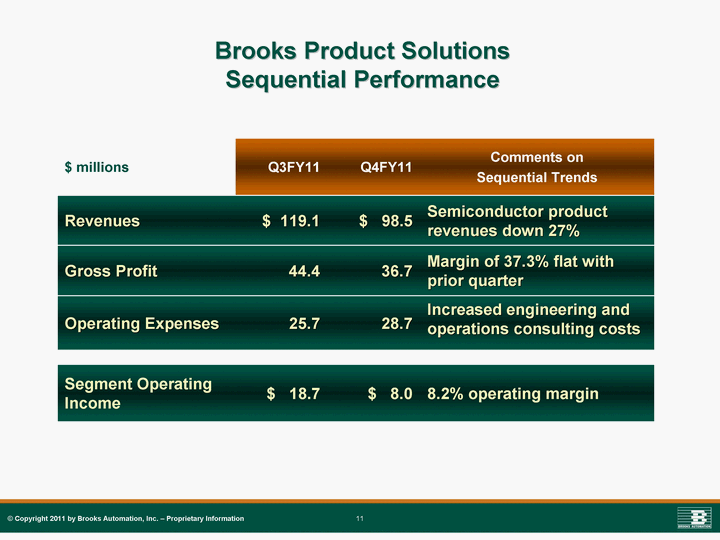
| (c) Copyright 2011 by Brooks Automation, Inc. - Proprietary Information 11 Brooks Product Solutions Sequential Performance $ millions Q3FY11 Q4FY11 Comments on Sequential Trends Revenues $ 119.1 $ 98.5 Semiconductor product revenues down 27% Gross Profit 44.4 36.7 Margin of 37.3% flat with prior quarter Operating Expenses 25.7 28.7 Increased engineering and operations consulting costs Segment Operating Income $ 18.7 $ 8.0 8.2% operating margin |
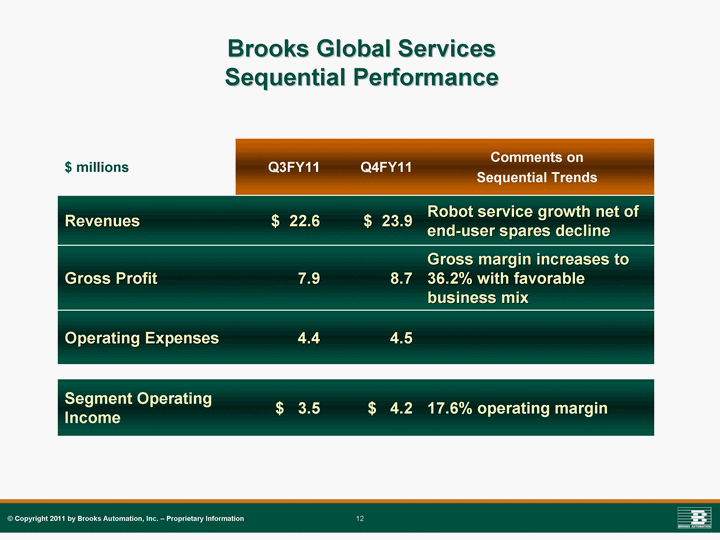
| (c) Copyright 2011 by Brooks Automation, Inc. - Proprietary Information 12 Brooks Global Services Sequential Performance $ millions Q3FY11 Q4FY11 Comments on Sequential Trends Revenues $ 22.6 $ 23.9 Robot service growth net of end-user spares decline Gross Profit 7.9 8.7 Gross margin increases to 36.2% with favorable business mix Operating Expenses 4.4 4.5 Segment Operating Income $ 3.5 $ 4.2 17.6% operating margin |
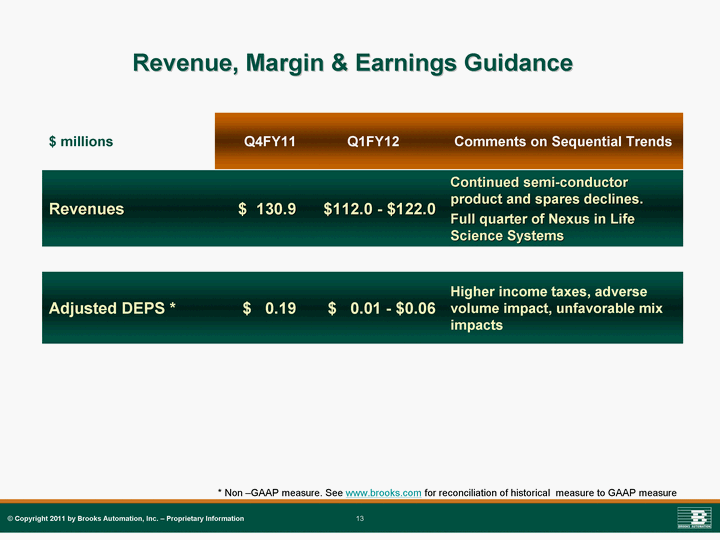
| (c) Copyright 2011 by Brooks Automation, Inc. - Proprietary Information 13 Revenue, Margin & Earnings Guidance $ millions Q4FY11 Q1FY12 Comments on Sequential Trends Revenues $ 130.9 $112.0 - $122.0 Continued semi-conductor product and spares declines. Full quarter of Nexus in Life Science Systems Adjusted DEPS * $ 0.19 $ 0.01 - $0.06 Higher income taxes, adverse volume impact, unfavorable mix impacts * Non -GAAP measure. See www.brooks.com for reconciliation of historical measure to GAAP measure |

| (c) Copyright 2011 by Brooks Automation, Inc. - Proprietary Information 14 4th Quarter Fiscal 2011 Financial Results Conference Call November 10, 2011 |
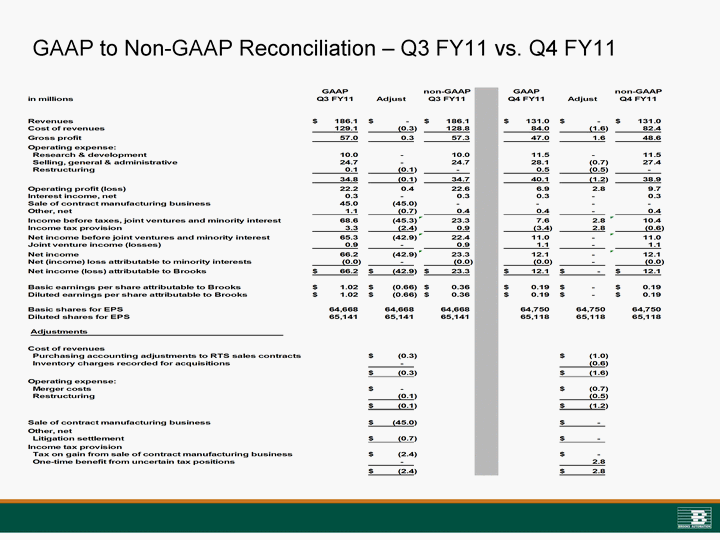
| GAAP to Non-GAAP Reconciliation - Q3 FY11 vs. Q4 FY11 |
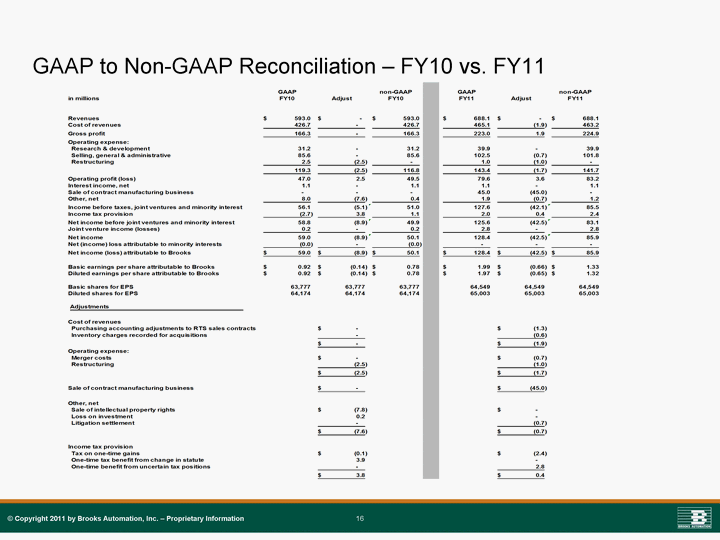
| GAAP to Non-GAAP Reconciliation - FY10 vs. FY11 (c) Copyright 2011 by Brooks Automation, Inc. - Proprietary Information 16 |
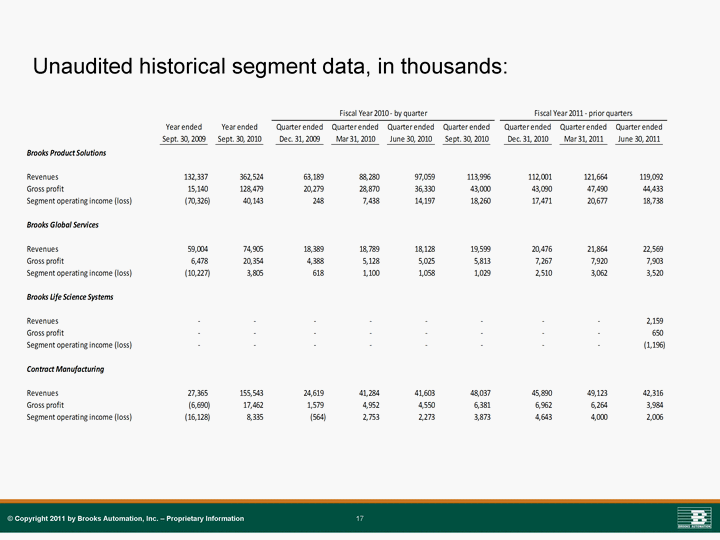
| Unaudited historical segment data, in thousands: (c) Copyright 2011 by Brooks Automation, Inc. - Proprietary Information 17 |