Attached files
| file | filename |
|---|---|
| EX-31.02 - EXHIBIT 31.02 - Brooks Automation, Inc. | exhibit3102brks201310-k1.htm |
| EX-21.01 - EXHIBIT 21.01 - Brooks Automation, Inc. | exhibit21011.htm |
| EX-31.01 - EXHIBIT 31.01 - Brooks Automation, Inc. | exhibit3101brks201310-k1.htm |
| EX-23.01 - EXHIBIT 23.01 - Brooks Automation, Inc. | exhibit2301bdoconsent1.htm |
| EX-32 - EXHIBIT 32 - Brooks Automation, Inc. | exhibit32brks201310-k1.htm |
| EXCEL - IDEA: XBRL DOCUMENT - Brooks Automation, Inc. | Financial_Report.xls |
| EX-23.02 - EXHIBIT 23.02 - Brooks Automation, Inc. | exhibit2302pwcconsent1.htm |
UNITED STATES SECURITIES AND EXCHANGE COMMISSION
Washington, D.C. 20549
Form 10-K
(Mark One) | ||
þ | ANNUAL REPORT PURSUANT TO SECTION 13 OR 15(d) OF THE SECURITIES EXCHANGE ACT OF 1934 | |
For fiscal year ended September 30, 2014 | ||
or | ||
¨ | TRANSITION REPORT PURSUANT TO SECTION 13 OR 15(d) OF THE SECURITIES EXCHANGE ACT OF 1934 | |
For the transition period from to . | ||
Commission File Number: 0-25434
Brooks Automation, Inc.
(Exact name of Registrant as Specified in Its Charter)
Delaware | 04-3040660 | |
(State or Other Jurisdiction of Incorporation or Organization) | (I.R.S. Employer Identification No.) | |
15 Elizabeth Drive Chelmsford, Massachusetts (Address of Principal Executive Offices) | 01824 (Zip Code) | |
978-262-2400
(Registrant's telephone number, including area code)
Securities registered pursuant to Section 12(b) of the Act:
Title of Each Class | Name of Each Exchange on Which Registered | |
Common Stock, $0.01 par value | The NASDAQ Stock Market LLC | |
Securities registered pursuant to Section 12(g) of the Act:
None
Indicate by check mark if the registrant is a well-known seasoned issuer, as defined in Rule 405 of the Securities Act. Yes ¨ No þ
If this report is an annual or transition report, indicate by check mark if the registrant is not required to file reports pursuant to Section 13 or 15(d) of the Securities Exchange Act of 1934. Yes ¨ No þ
Indicate by check mark whether the registrant (1) has filed all reports required to be filed by Section 13 or 15(d) of the Securities Exchange Act of 1934 during the preceding 12 months (or for such shorter period that the registrant was required to file such reports), and (2) has been subject to such filing requirements for the past 90 days. Yes þ No ¨
Indicate by check mark whether the registrant has submitted electronically and posted on its corporate Web site, if any, every Interactive Data File required to be submitted and posted pursuant to Rule 405 of Regulation S-T during the preceding 12 months (or for such shorter period that the registrant was required to submit and post such files). Yes þ No ¨
Indicate by check mark if disclosure of delinquent filers pursuant to Rule 405 of Regulation S-K is not contained herein, and will not be contained, to the best of registrant's knowledge, in definitive proxy or information statements incorporated by reference in Part III of this Form 10-K or any amendment to the Form 10-K. þ
Indicate by check mark whether the registrant is a large accelerated filer, an accelerated filer, a non-accelerated filer, or a smaller reporting company. See the definitions of “large accelerated filer,” “accelerated filer” and “smaller reporting company” in Rule 12b-2 of the Exchange Act. (Check one):
Large accelerated filer þ | Accelerated filer ¨ | Non-accelerated filer ¨ | Smaller reporting company ¨ |
(Do not check if a smaller reporting company) | |||
Indicate by check mark whether the registrant is a shell company (as defined in Exchange Act Rule 12b-2). Yes ¨ No þ
The aggregate market value of the registrant's Common Stock, $0.01 par value, held by non-affiliates of the registrant as of March 31, 2014, was approximately $706,764,000 based on the closing price per share of $10.93 on that date on the Nasdaq Stock Market. As of March 31, 2014, 66,806,263 shares of the registrant's Common Stock, $0.01 par value, were outstanding. As of November 5, 2014, 66,927,388 shares of the registrant's Common Stock, $0.01, par value, were outstanding.
DOCUMENTS INCORPORATED BY REFERENCE
Portions of the registrant's Proxy Statement involving the election of directors, which is expected to be filed within 120 days after the end of the registrant's fiscal year, are incorporated by reference in Part III of this Report.
BROOKS AUTOMATION, INC.
TABLE OF CONTENTS
PAGE NUMBER | ||
Item 1. | ||
Item 1A. | ||
Item 1B. | ||
Item 2. | ||
Item 3. | ||
Item 4. | ||
Item 5. | ||
Item 6. | ||
Item 7. | ||
Item 7A. | ||
Item 8. | ||
Item 9. | ||
Item 9A. | ||
Item 9B. | ||
Item 10. | ||
Item 11. | ||
Item 12. | ||
Item 13. | ||
Item 14. | ||
Item 15. | ||
2
PART I
Item 1. | Business |
We are a leading worldwide provider of automation and cryogenic solutions for multiple markets including semiconductor manufacturing and life sciences. Our technologies, engineering competencies and global service capabilities provide customers speed to market and ensure high uptime and rapid response, which equate to superior value in our customers' mission-critical controlled environments. Since 1978, we have been a leading partner to the global semiconductor manufacturing markets and through product development initiatives and strategic business acquisitions we have expanded our products and services to meet the needs of customers in technology markets adjacent to semiconductor manufacturing and life sciences. We are headquartered in Chelmsford, Massachusetts and have full service operations in North America, Europe and Asia.
Our company initially developed and marketed automated handling equipment for front-end semiconductor manufacturing tools and became a publicly traded company in February 1995. Through both internal product development and business acquisitions we became the leading provider of these automation solutions in this market. Since that time, we have expanded both the markets we serve as well as our core product capabilities. A notable step in our expansion was the acquisition of Helix Technology Corporation in 2005, which provided us with leading technology solutions in vacuum equipment and allowed us to serve a broader set of markets. In 2011, we divested our contract manufacturing business to better focus on our core technology solutions.
In 2011, we identified life sciences as an underserved strategic market where our core competencies in automation and cryogenic solutions could provide enabling products and services to the market and favorable opportunities for growth of our business. Since 2011, we have made several strategic acquisitions to penetrate the automated sample storage system market, and we now are a leading worldwide provider of these solutions. In addition to automated sample management, our life sciences business offers related services, along with consumables and complementary bench-top instruments.
In addition to the acquisitions made to expand the non-semiconductor portions of our business, we have continued to make investments to maintain and grow our semiconductor product and service offerings. In 2012, we acquired Crossing Automation Inc., a Fremont, CA-based provider of automation solutions for the global semiconductor front-end market. In April 2014, we acquired Dynamic Micro Systems Semiconductor Equipment GmbH, or DMS, a German provider of automated contamination control solutions for front opening unified pod, or "FOUP," carriers and reticle storage.
In March 2014, we entered into an agreement to sell the Granville-Phillips Gas Analysis & Vacuum Measurement, or Granville-Phillips, business unit to MKS Instruments, Inc. for $87.0 million in cash and we completed this sale in May 2014. Unless otherwise noted, the description of our business relates solely to our continuing operations and does not include the operations of our former Granville-Phillips business unit.
We expect to continue our internal development efforts and seek acquisitions where we can expand or enhance our product and service offerings.
Markets
Our fiscal years 2014, 2013 and 2012 percentage of revenue by end market was as follows:
2014 | 2013 | 2012 | ||||||
Semiconductor capital equipment | 46 | % | 46 | % | 51 | % | ||
Service and spares | 19 | % | 21 | % | 17 | % | ||
Industrial capital equipment | 11 | % | 12 | % | 11 | % | ||
Other adjacent technology markets | 11 | % | 11 | % | 10 | % | ||
Life sciences | 13 | % | 10 | % | 11 | % | ||
100 | % | 100 | % | 100 | % | |||
The proportion of our revenue by end market is changing as a result of our internal product and sales initiatives, our acquisitions and divestitures and the cyclical nature of the semiconductor capital equipment market. Over time, we expect the percentage of revenue from our life science business to increase given its higher expected growth rate. Changes from year to year, however, will depend on a variety of factors, including the cyclicality of the semiconductor market.
Semiconductor capital equipment
The global semiconductor capital equipment industry is cyclical with a long term growth profile driven by the expanded use of semiconductor devices and the increase in device complexity, each necessitating incremental equipment purchases by manufacturers. This growth is increasingly focused in Asia. The production of advanced semiconductor chips is a complex and logistically challenging manufacturing activity. To create the tens of millions of microscopic transistors and connect them both
3
horizontally and in vertical layers in order to produce a functioning integrated circuit chip, or IC chip, silicon wafers must go through hundreds of process steps performed by complex processing equipment, or tools. A large production fabrication plant, or fab, may have more than 70 different types of process and metrology tools, totaling as many as 500 tools or more. Up to 40% of these tools perform processes in a vacuum, such as removing, depositing, or measuring material on wafer surfaces. Wafers can go through as many as 400 different process steps before fabrication is complete. These steps, which comprise the initial fabrication of the integrated circuit and are referred to in the industry as front-end processes, are repeated many times to create the desired pattern on the silicon wafer. As the complexity of semiconductors continues to increase, the number of process steps that occur in a vacuum environment have also increased, resulting in a greater need for both automation and vacuum technology solutions due to the sensitive handling requirements and increased number of tools. The requirement for efficient, higher throughput and extremely clean manufacturing for semiconductor wafer fabs and other high performance electronic-based products has created a substantial market for substrate handling automation (moving the wafers around and between tools in a semiconductor fab), tool automation (the use of robots and modules used in conjunction with and inside process tools that move wafers from station-to-station), and vacuum systems technology to create and sustain the clean environment necessary to fabricate various products. The use of advanced processing to form three dimensional structures of the previously patterned integrated circuits is emerging in the industry. This processing, often referred to as Wafer Level Packaging, or WLP, is typically performed at what would be considered the back-end processing of an IC chip. Some traditional front-end processes are being used in this back-end advance packaging, thereby increasing the market for automation solutions.
Service and spares
Whereas sales for production equipment are typically made to original equipment manufacturers (“OEMs”), the service and spares support of that equipment can be provided in collaboration with the OEMs, or through a relationship with the end-user manufacturer who is using that equipment in a productive capacity. While the majority of the market that we currently address with our service and spares activities is the semiconductor manufacturing market, we are actively looking to increase our service and spares offerings in the life science market.
Industrial capital equipment
In addition to semiconductor manufacturing, there are a variety of industrial manufacturing operations that require either a vacuum or significant cooling for effective deposition of films or coatings during the production process. The expansion of the use of mobile devices such as smart phones, tablets, and wearable technologies, and the resulting increase in the need for associated manufacturing equipment continues to drive demand for the use of vacuum solutions we provide. These deposition processes are typically performed on equipment that cycle from an uncontrolled atmospheric environment for loading and unloading to a controlled vacuum environment for processing. The transition to the controlled vacuum environment requires removal of large amounts of moisture inherent in the air by deep cooling of coils within the vacuum chamber. The increased need for the equipment necessary to deliver refrigerant to these coils has resulted in increased demand for our products.
Other adjacent technology markets
There are a variety of markets that have adopted, or are adopting, similar manufacturing methods to those utilized by the semiconductor industry. Frequently, these markets have common customers but technology applications in the end markets are still maturing. We serve a variety of these evolving markets including light emitting diode, or LED, applications. High Brightness LED, or HBLED, is a potential clean energy solution replacing incandescent lighting sources. We believe that the application of HBLED solutions will expand as manufacturing processes for these products advance, resulting in lower costs of production and more attractive pricing for these products. Organic LED, or OLED, solutions provide lower power consumption for high clarity still and video images. OLED applications are gaining traction in the mobile computing and telecommunications device markets. Other evolving markets which utilize our products include Micro-Electro-Mechanical Systems, or MEMS, manufacturing and solar panel manufacturing. MEMS applications, which include accelerometers, self tuning antennae and pressure gauges, are expanding in automotive, mobile computing and telecommunications device markets. We believe that solar panel production is also expanding, and our products are used in the production of thin film solar panels which require cooling to effectuate deposition and adhesion of the film on and to the panel.
Life Sciences
There is a broad market of devices, systems and consumables that support the pharmaceutical, biotechnology, healthcare research and diagnostics industries in the advanced handling, processing, storage and distribution of biological and compound samples. At the core of these activities is sample storage. Automated sample stores are generally more effective in maintaining a controlled environment, tracking samples, reliably processing and quickly handling samples, than are manual systems. These automated sample storage management systems are at the center of the complete sample handling process. With the advent of personalized medicine linking DNA to optimal treatment regimens, the expansion of mass storage of key biological material to support rapidly expanding comparative and longitudinal studies, and the accumulation of samples taken from surgical and other
4
procedures, we believe that the numbers of samples in storage is expanding between 25 and 30% per annum on a global basis. We believe that this expansion, together with the problems associated with traditional manual storage systems, will drive consistent growth in automated sample management equipment.
Products
In the semiconductor industry, wafer handling robotics have emerged as a critical technology in determining the efficacy and productivity of complex production tools in the world's most advanced 300mm wafer fabs. A tool is designed and built around a process chamber using automation technology to move wafers into and out of the chamber. Today, OEMs design and build their tools using a cluster architecture, whereby several process chambers are mounted to one central transfer module. High wafer throughput and new materials require advanced automation solutions to address the challenging equipment needs for multiple substrate sizes, including the emerging sub 20nm technology nodes, Thru Silicon Via, EUV Lithography and 450mm substrates. We specialize in developing and building the handling systems, as well as the vacuum technologies used in these tools. Our products can be utilized as individual components or as complete integrated handling systems. In addition, our automation products support both atmospheric and vacuum based processes and are designed to improve performance and productivity of the manufacturing process. The majority of our product revenue is derived from sales to OEMs and end-user semiconductor device manufacturers.
We provide high vacuum pumps which are required in certain process steps to create and to optimize the process environment by maintaining pressure consistency of the known process gas. To achieve optimal production yields, semiconductor manufacturers must ensure that each process operates at carefully controlled pressure levels. Impurities or incorrect pressure levels can lower production yields, thereby significantly increasing the cost per usable IC chip produced. Some key vacuum processes include: dry etching and dry stripping, chemical vapor deposition, or CVD, physical vapor deposition, or PVD, and ion implantation. Our cryogenic vacuum pumps are considered the industry standard by many leading semiconductor device manufacturers for ion implant and PVD applications.
In the HBLED market we have worked with leading manufacturers to develop advanced automation solutions that improve the productivity of processes that were previously manual. These LEDs are also made using vacuum processes for certain production steps, very similar to the steps used in semiconductor manufacturing. We have been successful in capturing LED market share for our vacuum product offerings and for high payload automated tool architectures. In other markets, such as MEMS and WLP applications, unique wafer handling and automation solutions are required to accommodate increasingly thinner and sometimes bowed substrates. We are developing differentiated solutions to address the requirements in these high growth market segments.
For the life science markets we provide automated sample management platforms that store samples (e.g., nucleic acid, blood, drug compounds, biological tissue, etc.) in a controlled environment and automate the process (vials are typically stored in racks or plates) of subsequently retrieving specifically selected samples from those racks or plates. The controlled storage environments ensure that samples are preserved within a narrow temperature band to maintain their integrity for long periods while providing absolute accuracy in the identification and selection of samples during the storage and retrieval processes.
In providing comprehensive solutions to the life science markets we also provide equipment for sealing and de-sealing samples stored on plates and automated cappers and de-cappers for samples stored in tubes. We also provide consumables in the form of sample plates, micro-plates and tubes and support services for many of the customers who have purchased our equipment.
Segments
We report financial results in three segments: Brooks Product Solutions; Brooks Global Services; and Brooks Life Science Systems.
The Brooks Product Solutions segment provides a variety of products and solutions that enable improved throughput and yield in controlled operating environments. Those products include atmospheric and vacuum robots, robotic modules, and tool automation systems that provide precision handling and clean wafer environments as well as vacuum pumping and thermal management solutions used to create and control critical process vacuum applications.
The Brooks Global Services segment provides an extensive range of support services, including repair services, diagnostic support services, and installation services in support of the base equipment installed by our Brooks Product Solutions segment, which enable our customers to maximize process tool uptime and productivity. This segment also provides end-user customers with spare parts to maximize customer tool productivity.
The Brooks Life Science Systems segment provides automated sample management systems for automated cold sample storage, equipment for sample preparation and handling, consumables, and parts and support services to a wide range of life science customers including pharmaceutical companies, biotechnology companies, national laboratories, research institutes and research hospitals.
5
Customers
Within the semiconductor industry, we sell our products and services to most of the major semiconductor chip manufacturers and semiconductor equipment OEMs in the world. Our customers outside the semiconductor industry are broadly diversified. We have major customers in North America, Europe and Asia. Additionally, although much of our equipment sales ship to OEMs in the United States, many of our products are incorporated into equipment that is ultimately utilized outside of North America. See Part I, Item 1A, “Risk Factors” for a discussion of the risks related to foreign operations. The Brooks Global Services business provides support to leading OEMs, fabs and foundries across the globe.
Our life sciences systems solutions are used by pharmaceutical companies, biotechnology companies, national laboratories, research institutes and research hospitals. There is no continuing concentration of customers for the Brooks Life Science Systems segment although given the size of particular projects, an individual customer may be significant to the life science segment in a given quarter or fiscal year.
Relatively few customers account for a substantial portion of our revenue, with the top 10 customers accounting for approximately 37% of our business in fiscal year 2014. We have one customer, Applied Materials, Inc., that accounted for 11% of our overall revenue for the year.
For purposes of determining the percentage of revenue from any OEM customer, we do not include revenue from products sold to a contract manufacturer customer which in turn sells to the OEM. If we did include revenue from products sold to contract manufacturer customers supporting our OEM customers, the percentage of our total revenue derived from certain OEM customers would be higher.
Sales, Marketing and Customer Support
We market and sell most of our semiconductor, industrial and other adjacent technology market products and services in Asia, Europe, the Middle East and North America through our direct sales organization. The sales process for our products is often multilevel, involving a team comprised of individuals from sales, marketing, engineering, operations and senior management. In many cases we assign a team to a customer and that team engages the customer at different levels of its organization to facilitate planning, provide product customization when required, and ensure open communication and support. Some of our vacuum products and services are sold through local country distributors. Additionally, we serve the Japanese market for our robotics and automation products through Yaskawa Brooks Automation, our joint venture with Yaskawa Electric Corporation of Japan.
Much of our life sciences sales are completed through our direct Brooks Life Science Systems sales force, particularly our store systems and services. In addition, we facilitate the sale of consumables and instruments with distributors which reach a broader range of customers. In regions with emerging life science industries such as China, India and the Middle East, we leverage local distributors to assist in the sales process of stores. The sales process for our larger sample management systems may take 6-18 months to complete and it involves a team typically comprised of individuals from sales, marketing, engineering and senior management.
We typically provide warranties from one to two years, depending upon the type of product, with the average warranty on our products lasting for 15 months.
Our marketing activities include participation in trade shows, delivery of seminars, participation in industry forums, distribution of sales literature, publication of press releases and articles in business and industry publications. To enhance communication and support, particularly with our international customers, we maintain sales and service centers in Asia, Europe, the Middle East and North America. These facilities, together with our headquarters, maintain local support capabilities and demonstration equipment for customers to evaluate. Customers are encouraged to discuss features and applications of our demonstration equipment with our engineers located at these facilities.
Net revenue for the fiscal years ended September 30, 2014, 2013 and 2012 based upon the source of the order by geographic area is as follows (in thousands):
Year Ended September 30, | |||||||||||
2014 | 2013 | 2012 | |||||||||
North America | $ | 174,343 | $ | 177,779 | $ | 214,060 | |||||
Asia/Pacific | 198,695 | 154,358 | 183,406 | ||||||||
Europe | 109,810 | 90,303 | 91,517 | ||||||||
$ | 482,848 | $ | 422,440 | $ | 488,983 | ||||||
The geographic location of an OEM is not indicative of where our products will eventually be used. The geographic area for our orders is determined by the onward sale of an OEM system which incorporates our sub-systems and/or components.
6
Our property, plant and equipment as of September 30, 2014 and 2013 by geographic area is as follows (in thousands):
September 30, | |||||||
2014 | 2013 | ||||||
North America | $ | 40,232 | $ | 38,505 | |||
Asia/Pacific | 870 | 1,646 | |||||
Europe/Middle East | 9,081 | 7,355 | |||||
$ | 50,183 | $ | 47,506 | ||||
Competition
We operate in a variety of niches of varying breadth and with differing competitors and competitive dynamics. The semiconductor and adjacent technology markets, and process equipment manufacturing industries are highly competitive and characterized by continual changes and improvements in technology. A significant portion of equipment automation is still done in-house by OEMs. Our competitors among external vacuum automation suppliers are primarily Japanese companies such as Daihen Corporation, Daikin Industries, Ltd. and Rorze Corporation. Our competitors among vacuum components suppliers include Sumitomo Heavy Industries and Telemark, Inc. Atmospheric tool automation is typically less demanding, has fewer barriers to entry and has a larger field of competitors. We compete directly with other equipment automation suppliers of atmospheric modules and systems such as Hirata Corporation, Kawasaki Heavy Industries, Ltd., Genmark Automation, Inc., Rorze Corporation, Sankyo Seisakusho Co., Ltd., TDK Corporation and Sinfonia Technology Co., Ltd. Contract manufacturers such as Celestica Inc. and Flextronics International Ltd. also provide assembly and manufacturing services for atmospheric systems.
Our Life Science Systems business unit competes with a number of private companies in providing automated sample management systems. These competitors include Hamilton Company, Liconic AG and TTP LabTech, Ltd.
We believe our customers will purchase our equipment automation products and vacuum subsystems as long as our products continue to provide the necessary throughput, reliability, contamination control and accuracy at an acceptable price. We believe that we have competitive offerings with respect to all of these factors. We cannot guarantee, however, that we will be successful in selling our products to OEMs who currently satisfy a portion of their automation needs in-house or from other independent suppliers, regardless of the performance or price of our products.
Research and Development
Our research and development efforts are focused on developing new products and also enhancing the functionality, degree of integration, reliability and performance of our existing products. Our engineering, marketing, operations and management personnel leverage their close collaborative relationships with many of their counterparts in customer organizations in an effort to proactively identify market demands which helps us refocus our research and development investment to meet our customers' demands. With the rapid pace of change that characterizes the markets we serve, it is essential for us to provide high-performance and reliable products in order for us to maintain our leadership position.
Our research and development spending for fiscal years 2014, 2013 and 2012 was $52.6 million, $46.2 million and $44.7 million, respectively. The expansion in research and development spending primarily reflects our investment in life sciences as we have developed the Twinbank platform and continue to develop automated bio-sample storage solutions for environments operating at ultra-low temperatures.
Manufacturing
Our manufacturing operations are used for product assembly, integration and testing. We have implemented quality assurance procedures that include standard design practices including reliability testing and analysis, supplier and component selection procedures, vendor controls, manufacturing process controls, and service processes that ensure high-quality performance of our products. Our major manufacturing facilities are located in Chelmsford, Massachusetts; Poway, California; Spokane, Washington; Monterrey, Mexico; Yongin-City, South Korea; Manchester, UK; and Jena, Germany. We also provide service and spare parts support to end-users throughout the world. Many of our service customers are based outside of the United States, with many in Asia. We have service and support locations close to these customers to provide rapid response to their service needs. We have service and support locations in Chelmsford, Massachusetts; Poway, California; Fremont, California; Spokane, Washington; Chu Bei City, Taiwan; Yongin-City, South Korea; Yokohama, Japan; Shanghai, China; Singapore; Jena, Germany; Oberdiessbach, Switzerland; Manchester, UK; and Kiryat-Gat, Israel.
Our manufacturing operations are designed to provide high quality, low cost, differentiated products to our customers in short lead times through responsive and flexible processes and sourcing strategies. We utilize lean manufacturing techniques for a large portion of our manufacturing capabilities. This includes the outsourcing of assemblies and products to competitive regions, including Asia. We expect to continue to broaden our sourcing of certain portions of our manufacturing process to
7
ensure we continue to provide high quality products at competitive costs. We also believe the continued sourcing of portions of our manufacturing processes in these regions allows us to better serve our customers in these regions.
Patents and Proprietary Rights
We rely on patents, trade secret laws, confidentiality procedures, copyrights, trademarks and licensing agreements to protect our technology. Due to the rapid technological change that characterizes the life sciences, semiconductor, adjacent technology markets and related process equipment industries, we believe that the improvement of existing technology, reliance upon trade secrets and unpatented proprietary know-how and the development of new products may be as important as patent protection in establishing and maintaining a competitive advantage. To protect trade secrets and know-how, it is our policy to require all employees to enter into proprietary information and nondisclosure agreements. We cannot guarantee that these efforts will meaningfully protect our trade secrets.
As of September 30, 2014, we owned approximately 480 issued U.S. patents, with various corresponding patents issued in foreign jurisdictions. We also had approximately 140 pending U.S. patent applications, with foreign counterparts of certain of these applications having been filed or may be filed at the appropriate time. Our patents will expire at various dates through 2032.
Backlog
Total backlog for our products as of September 30, 2014, totaled $126.9 million as compared to $107.2 million at September 30, 2013. Backlog or total backlog, includes all purchase orders for which a customer has scheduled delivery, regardless of the expected delivery date, and consists principally of orders for products and service agreements. The backlog for our products within the next 12 months was $113.6 million and $104.9 million at September 30, 2014 and 2013, respectively. Twelve-month backlog includes orders scheduled to be delivered within the next 12 months. Backlog for products with scheduled deliveries beyond one year relate primarily to our life science products.
Backlog as of any particular date should not be relied upon as indicative of our revenue for any future period. A substantial percentage of current business generates no backlog because we deliver our products and services in the same period in which the order is received. The orders included in our backlog may also be canceled or rescheduled by customers without significant penalty.
Environmental Matters
We are subject to federal, state, and local environmental laws and regulations, as well as the environmental laws and regulations of the foreign national and local jurisdictions in which we have manufacturing facilities. We believe we are in material compliance with all such laws and regulations.
Compliance with foreign, federal, state, and local laws and regulations has not had, and is not expected to have, an adverse effect on our capital expenditures, competitive position, financial condition or results of operations.
Employees
At September 30, 2014, we had 1,455 full time employees. In addition, we employ part time workers and contractors. Approximately 45 employees in our facility in Jena, Germany are covered by a collective bargaining agreement. We consider our relationships with these and all employees to be good.
Available Information
We file annual, quarterly, and current reports, proxy statements, and other documents with the Securities and Exchange Commission, or SEC, under the Securities Exchange Act of 1934, as amended, or the Exchange Act. The public may read and copy any materials that we file with the SEC at the SEC's Public Reference Room at 100 F Street, NE, Washington, DC 20549. The public may obtain information on the operation of the Public Reference Room by calling the SEC at 1-800-SEC-0330. Also, the SEC maintains an Internet website that contains reports, proxy and information statements, and other information regarding issuers, including Brooks Automation, Inc., that file electronically with the SEC. The public can obtain any documents that we file with the SEC at www.sec.gov.
Our internet website address is http://www.brooks.com. Through our website, we make available, free of charge, our annual report on Form 10-K, quarterly reports on Form 10-Q, current reports on Form 8-K and any amendments to those reports, as soon as reasonably practicable after such materials are electronically filed, or furnished to, the SEC. These SEC reports can be accessed through the investors section of our website. The information found on our website is not part of this or any other report we file with or furnish to the SEC.
8
Item 1A. | Risk Factors |
Factors That May Affect Future Results
You should carefully consider the risks described below and the other information in this report before deciding to invest in shares of our common stock. These are the risks and uncertainties we believe are most important for you to consider. Additional risks and uncertainties not presently known to us, which we currently deem immaterial or which are similar to those faced by other companies in our industry or business in general, may also impair our business operations. If any of the following risks or uncertainties actually occurs, our business, financial condition and operating results would likely suffer. In that event, the market price of our common stock could decline and you could lose all or part of your investment.
Risks Relating to Our Industry
Due in part to the cyclical nature of the semiconductor manufacturing industry and related industries, as well as due to volatility in worldwide capital and equity markets, we have previously incurred operating losses and may have future losses.
Our business is largely dependent on capital expenditures in the semiconductor manufacturing industry and other businesses employing similar manufacturing technologies. The semiconductor manufacturing industry in turn depends on current and anticipated demand for integrated circuits and the products that use them. In recent years, these businesses have experienced unpredictable and volatile business cycles due in large part to rapid changes in demand and manufacturing capacity for semiconductors, and these cycles have had an impact on our business, sometimes causing declining revenue and operating losses. We could experience future operating losses during an industry downturn. If an industry downturn continues for an extended period of time, our business could be materially harmed. Conversely, in periods of rapidly increasing demand, we could have insufficient inventory and manufacturing capacity to meet our customers' needs on a timely basis, which could result in the loss of customers and various other expenses that could reduce gross margins and profitability.
We face competition which may lead to price pressure and otherwise adversely affect our sales.
We face competition throughout the world in each of our product and service areas, including from the competitors discussed in Part I, Item 1, “Business - Competition” as well as from internal automation capabilities at larger OEMs. Many of our competitors have substantial engineering, manufacturing, marketing and customer support capabilities. We expect our competitors to continue to improve the performance of their current products and services and to introduce new products, services and technologies that could adversely affect sales of our current and future products and services. New products, services and technologies developed by our competitors or more efficient production of their products or provisions of their services could require us to make significant price reductions or decide not to compete for certain orders. If we fail to respond adequately to pricing pressures or fail to develop products with improved performance or developments or better quality services with respect to the other factors on which we compete, we could lose customers or orders. If we are unable to compete effectively, our business and prospects could be materially harmed.
Risks Relating to Our Operations
Our operating results could fluctuate significantly, which could negatively impact our business.
Our revenue, operating margins and other operating results could fluctuate significantly from quarter to quarter depending upon a variety of factors, including:
• | demand for our products as a result of the cyclical nature of the semiconductor manufacturing industry and the markets upon which the industry depends or otherwise; |
• | changes in the timing and terms of product orders by our customers as a result of our customer concentration or otherwise; |
• | changes in the mix of products and services that we offer; |
• | changes in the demand for the mix of products and services that we offer; |
• | timing and market acceptance of our new product and services introductions; |
• | delays or problems in the planned introduction of new products or service, or in the performance of any such products following delivery to customers or the quality of such services; |
• | new products, services or technological innovations by our competitors, which can, among other things, render our products less competitive due to the rapid technological changes in the markets in which we provide products and services; |
• | the timing and related costs of any acquisitions, divestitures or other strategic transactions; |
9
• | our ability to reduce our costs in response to decreased demand for our products and services; |
• | our ability to accurately estimate customer demand, including the accuracy of demand forecasts used by us; |
• | disruptions in our manufacturing process or in the supply of components to us; |
• | write-offs for excess or obsolete inventory; and |
• | competitive pricing pressures. |
As a result of these risks, we believe that quarter-to-quarter comparisons of our revenue and operating results may not be meaningful, and that these comparisons may not be an accurate indicator of our future performance.
If we do not continue to introduce new products and services that reflect advances in technology in a timely and effective manner, our products and services may become obsolete and our operating results will suffer.
Our success is dependent on our ability to respond to the technological change present in the markets we serve. The success of our product development and introduction depends on our ability to:
• | accurately identify and define new market opportunities, products and services; |
• | obtain market acceptance of our products and services; |
• | timely innovate, develop and commercialize new technologies and applications; |
• | adjust to changing market conditions; |
• | differentiate our offerings from our competitors' offerings; |
• | obtain and maintain intellectual property rights where necessary; |
• | continue to develop a comprehensive, integrated product and service strategy; |
• | properly price our products and services; and |
• | design our products to high standards of manufacturability so that they meet customer requirements. |
If we cannot succeed in responding in a timely manner to technological and/or market changes or if the new products and services that we introduce do not achieve market acceptance, our competitive position would diminish which could materially harm our business and our prospects.
The global nature of our business exposes us to multiple risks.
For the fiscal years ended September 30, 2014 and 2013, approximately 64% and 58%, respectively, of our revenue was derived from sales outside North America. We expect that international sales, including increased sales in Asia, will continue to account for a significant portion of our revenue. We maintain a global footprint of sales, service and repair operations. As a result of our international operations, we are exposed to many risks and uncertainties, including:
• | longer sales-cycles and time to collection; |
• | tariff and international trade barriers; |
• | fewer or less certain legal protections for intellectual property and contract rights abroad; |
• | different and changing legal and regulatory requirements in the jurisdictions in which we operate; |
• | government currency control and restrictions on repatriation of earnings; |
• | fluctuations in foreign currency exchange and interest rates, particularly in Asia and Europe; and |
• | political and economic instability, changes, hostilities and other disruptions in regions where we operate. |
Negative developments in any of these areas in one or more countries could result in a reduction in demand for our products, the cancellation or delay of orders already placed, threats to our intellectual property, difficulty in collecting receivables, and a higher cost of doing business, any of which could materially harm our business and profitability.
Our business could be materially harmed if we fail to adequately integrate the operations of the businesses that we have acquired or may acquire.
We have made in the past, and may make in the future, acquisitions or significant investments in businesses with complementary products, services and/or technologies. Our acquisitions present numerous risks, including:
• | difficulties in integrating the operations, technologies, products and personnel of the acquired companies and realizing the anticipated synergies of the combined businesses; |
• | defining and executing a comprehensive product strategy; |
• | managing the risks of entering markets or types of businesses in which we have limited or no direct experience; |
10
• | the potential loss of key employees, customers and strategic partners of ours or of acquired companies; |
• | unanticipated problems or latent liabilities, such as problems with the quality of the installed base of the target company's products or infringement of another company's intellectual property by a target company's activities or products; |
• | problems associated with compliance with the acquired company's existing contracts; |
• | difficulties in managing geographically dispersed operations; and |
• | the diversion of management's attention from normal daily operations of the business. |
If we acquire a new business, we may be required to expend significant funds, incur additional debt or issue additional securities, which may negatively affect our operations and be dilutive to our stockholders. In periods following an acquisition, we will be required to evaluate goodwill and acquisition-related intangible assets for impairment. When such assets are found to be impaired, they will be written down to estimated fair value, with a charge against earnings. The failure to adequately address these risks or the impairment of any assets could materially harm our business and financial results.
Entering new markets introduces new competitors and commercial risks.
A key part of our growth strategy is to continue expanding beyond the semiconductor manufacturing market into semiconductor adjacent and life sciences markets. As part of this strategy, we expect to diversify our product sales and service revenue by leveraging our core technologies, which requires investments and resources which may not be available as needed. We cannot guarantee that we will be successful in leveraging our capabilities into the life sciences market to meet all the needs of these new customers and to compete favorably. Because a significant portion of our growth potential may be dependent on our ability to increase sales to markets beyond semiconductor manufacturing, our inability to successfully enter new markets may adversely impact future financial results.
Changes in key personnel could impair our ability to execute our business strategy.
The continuing service of our executive officers and essential engineering, technical and management personnel, together with our ability to attract and retain such personnel, is an important factor in our continuing ability to execute our strategy. There is substantial competition to attract such employees and the loss of any such key employees could have a material adverse effect on our business and operating results. The same could be true if we were to experience a high turnover rate among engineering and technical personnel and we were unable to replace them.
Our failure to protect our intellectual property could adversely affect our future operations.
Our ability to compete is significantly affected by our ability to protect our intellectual property. We rely upon patents, trade secret laws, confidentiality procedures, copyrights, trademarks and licensing agreements to protect our technology. Existing trade secret, trademark and copyright laws offer only limited protection. Our success depends in part on our ability to obtain and enforce patent protection for our products both in the United States and in other countries. We own numerous U.S. and foreign patents, and we intend to file additional applications, as appropriate, for patents covering our products and technology. Any issued patents owned by or licensed to us may be challenged, invalidated or circumvented, and the rights under these patents may not provide us with competitive advantages. In addition, the laws of some countries in which our products are or may be developed, manufactured or sold may not fully protect our products. Due to the rapid technological change that characterizes the semiconductor and adjacent technology markets, we believe that the improvement of existing technology, reliance upon trade secrets and unpatented proprietary know-how and the development of new products may be as important as patent protection in establishing and maintaining competitive advantage. To protect trade secrets and know-how, it is our policy to require all technical and management personnel to enter into nondisclosure agreements.
We cannot guarantee that the steps we have taken to protect our intellectual property will be adequate to prevent the misappropriation of our technology. Other companies could independently develop similar or superior technology without violating our intellectual property rights. In the future, it may be necessary to engage in litigation or like activities to enforce our intellectual property rights, to protect our trade secrets or to determine the validity and scope of proprietary rights of others, including our customers. This could require us to incur significant expenses and to divert the efforts and attention of our management and technical personnel from our business operations.
The expiration of our patents over time could lead to an increase of competition and a decline in our revenue.
One of our main competitive strengths is our technology and we are dependent on our patent rights and other intellectual property rights to maintain our competitive position. While our current patents will expire from time to time through 2032, certain significant patents will expire within two years, including a patent related to technology in one of our core automation products expiring in 2015 and patents which we license to third parties in exchange for agreed upon royalties expiring in 2016. In addition to the loss of revenue from royalties, the expiration of patents could result in increased competition and declines in product and service revenue.
11
We may be subject to claims of infringement of third-party intellectual property rights, or demands that we license third-party technology, which could result in significant expense and prevent us from using our technology.
There has been substantial litigation regarding patent and other intellectual property rights in the semiconductor-related industries. We have in the past been, and may in the future be, notified that we may be infringing intellectual property rights possessed by third parties. We cannot guarantee that infringement claims by third parties or other claims for indemnification by customers or end-users of our products resulting from infringement claims will not be asserted in the future or that such assertions, whether or not proven to be true, will not materially and adversely affect our business, financial condition and results of operations.
We cannot predict the extent to which we might be required to seek licenses or alter our products so that they no longer infringe the rights of others. We also cannot guarantee that licenses will be available or the terms of any licenses we may be required to obtain will be reasonable. Similarly, changing our products or processes to avoid infringing the rights of others may be costly or impractical and could detract from the value of our products. If a judgment of infringement were obtained against us, we could be required to pay substantial damages and a court could issue an order preventing us from selling one or more of our products. Further, the cost and diversion of management attention brought about by such litigation could be substantial, even if we were to prevail. Any of these events could result in significant expense to us and may materially harm our business and our prospects.
If our manufacturing sites were to experience a significant disruption in operations, our business could be materially harmed, while the failure to estimate customer demand accurately could result in excess or obsolete inventory.
We have a limited number of manufacturing facilities for our products and we have moved portions of our manufacturing to third parties, including some in lesser developed countries. If the operations at any one of these facilities were disrupted as a result of a natural disaster, fire, power or other utility outage, work stoppage or other similar event, our business could be seriously harmed because we may be unable to manufacture and ship products and parts to our customers in a timely fashion. The impact of any disruption at one of our facilities may be exacerbated if the disruption occurs at a time when we need to rapidly increase our manufacturing capabilities to meet increased demand or expedited shipment schedules.
Moreover, if actual demand for our products is different than expected, we may purchase more/fewer component parts than necessary or incur costs for canceling, postponing or expediting delivery of such parts. If we purchase inventory in anticipation of customer demand that does not materialize, or if our customers reduce or delay orders, we may incur excess inventory charges. Any or all of these factors could materially and adversely affect our business, financial condition and results of operations.
Our business could be materially harmed if one or more key suppliers fail to continuously deliver key components of acceptable cost and quality.
We currently obtain many of our key components on an as-needed, purchase order basis from numerous suppliers. In some cases we have only a single source of supply for necessary components and materials used in the manufacturing of our products. Further, we are increasing our sourcing of products in Asia, and particularly in China, and we do not have a previous course of dealing with many of these suppliers. We do not generally have long-term supply contracts with any of these suppliers, and many of them underwent cost-containment measures in light of the last significant industry downturn in 2008 and 2009. As the industry has recovered, these suppliers have faced challenges in delivering components on a timely basis. The volatility in demand of these components has led some of our vendors to exit the semiconductor market, and other vendors may also decide to exit this market. Our inability to obtain components or materials in required quantities or of acceptable cost and quality and with the necessary continuity of supply could result in delays or reductions in product shipments to our customers. In addition, if a supplier or sub-supplier suffers a production stoppage or delay for any reason, including natural disasters such as the tsunamis that affected Japan and Thailand, this could result in a delay or reduction in our product shipments to our customers. Any of these contingencies could cause us to lose customers, result in delayed or lost revenue and otherwise materially harm our business.
Our outsource providers may fail to perform as we expect.
Outsource providers have played and will continue to play a key role in our manufacturing operations and in many of our transactional and administrative functions, such as information technology and facilities management. Although we attempt to select reputable providers and secure their performance on terms documented in written contracts, it is possible that one or more of these providers could fail to perform as we expect and such failure could have an adverse impact on our business.
12
Our business relies on certain critical information systems and a failure or breach of such a system could harm our business and results of operations and, in the event of unauthorized access to a customer’s data or our data, incur significant legal and financial exposure and liabilities.
We maintain and rely upon certain critical information systems for the effective operation of our business. These information systems include telecommunications, the internet, our corporate intranet, various computer hardware and software applications, network communications and e-mail. These information systems may be owned and maintained by us, our outsource providers or third parties such as vendors and contractors. These information systems are subject to attacks, failures, and access denials from a number of potential sources including viruses, destructive or inadequate code, power failures, and physical damage to computers, hard drives, communication lines and networking equipment. To the extent that these information systems are under our control, we have implemented security procedures, such as virus protection software and emergency recovery processes, to mitigate the outlined risks. However, security procedures for information systems cannot be guaranteed to be failsafe and our inability to use or access these information systems at critical points in time, or unauthorized releases of confidential information, could unfavorably impact the timely and efficient operation of our business.
Confidential information stored on these information systems could also be compromised. If a third party gains unauthorized access to our data, including any information regarding our customers, such security breach could expose us to a risk of loss of this information, loss of business, litigation and possible liability. These security measures may be breached as a result of third-party action, including intentional misconduct by computer hackers, employee error, malfeasance or otherwise. Additionally, third parties may attempt to fraudulently induce employees or customers into disclosing sensitive information such as user names, passwords or other information in order to gain access to our customers' data or our data, including our intellectual property and other confidential business information, or our information technology systems. Because the techniques used to obtain unauthorized access, or to sabotage systems, change frequently and generally are not recognized until launched against a target, we may be unable to anticipate these techniques or to implement adequate preventative measures. Any security breach could result in a loss of confidence by our customers, damage our reputation, disrupt our business, lead to legal liability and negatively impact our future sales.
Our intangible assets may become impaired.
As of September 30, 3014, we had $109.5 million of goodwill and $59.6 million in net intangible assets as a result of our acquisitions. We periodically review our goodwill and the estimated useful lives of our identifiable intangible assets, taking into consideration any events or circumstances that might result in either a diminished fair value, or for intangible assets, a revised useful life. These events and circumstances include significant changes in the business climate, legal factors, operating performance indicators, advances in technology and competition. Any impairment or revised useful life could have a material and adverse effect on our financial position and results of operations, and could harm the trading price of our common stock.
Changes in tax rates or tax regulation could affect results of operations.
As a global company, we are subject to taxation in the United States and various other countries. Significant judgment is required to determine and estimate worldwide tax liabilities. Our future annual and quarterly effective tax rates could be affected by numerous factors, including changes in the: applicable tax laws; composition of pre-tax income in countries with differing tax rates; and/or valuation of our deferred tax assets and liabilities. In addition, we are subject to regular examination by the Internal Revenue Service and state, local and foreign tax authorities. We regularly assess the likelihood of favorable or unfavorable outcomes resulting from these examinations to determine the adequacy of our provision for income taxes. Although we believe our tax estimates are reasonable, there can be no assurance that any final determination will not be materially different from the treatment reflected in our historical income tax provisions and accruals, which could materially and adversely affect our financial condition and results of operations.
We are subject to numerous governmental regulations.
We are subject to federal, state, local and foreign regulations, including environmental regulations and regulations relating to the design and operation of our products and control systems. We might incur significant costs as we seek to ensure that our products meet safety and emissions standards, many of which vary across the states and countries in which our products are used. In the past, we have invested significant resources to redesign our products to comply with these directives. Compliance with future regulations, directives, and standards could require us to modify or redesign some products, make capital expenditures, or incur substantial costs. If we do not comply with current or future regulations, directives, and standards:
• | we could be subject to fines; |
• | our production or shipments could be suspended; and |
• | we could be prohibited from offering particular products in specified markets. |
Any of these events could materially and adversely affect our business, financial condition and results of operations.
13
New regulations and customer demands related to conflict minerals may adversely affect us.
The Dodd-Frank Wall Street Reform and Consumer Protection Act imposes new disclosure requirements regarding the use in our products of “conflict minerals” mined from the Democratic Republic of Congo and adjoining countries, whether or not the components of our products are manufactured by us or third parties. This new requirement could affect the pricing, sourcing and availability of minerals used in the manufacture of components we use in our products. In addition, there are additional costs associated with complying with the disclosure requirements and customer requests, such as costs related to our due diligence to determine the source of any conflict minerals used in our products. We may face difficulties in satisfying customers who may require that all of the components of our products are certified as conflict mineral free and/or free of numerous other hazardous materials.
Unfavorable currency exchange rate fluctuations may lead to lower operating margins, or may cause us to raise prices, which could result in reduced sales.
Currency exchange rate fluctuations could have an adverse effect on our sales and results of operations and we could experience losses with respect to forward exchange contracts into which we may enter. Unfavorable currency fluctuations could require us to increase prices to foreign customers, which could result in lower net sales by us to such customers. Alternatively, if we do not adjust the prices for our products in response to unfavorable currency fluctuations, our results of operations could be materially and adversely affected. In addition, most sales made by our foreign subsidiaries are denominated in the currency of the country in which these products are sold and the currency they receive in payment for such sales could be less valuable as compared to the U.S. dollar at the time of receipt as a result of exchange rate fluctuations. From time to time, we enter into forward exchange contracts to reduce currency exposure. However, we cannot be certain that our efforts will be adequate to protect us against significant currency fluctuations or that such efforts will not expose us to additional exchange rate risks, which could materially and adversely affect our results of operations.
Risks Relating to Our Customers
Because we rely on a limited number of customers for a large portion of our revenue, the loss of one or more of these customers could materially harm our business.
We receive a significant portion of our revenue in each fiscal period from a relatively limited number of customers, and that trend is likely to continue. Sales to our ten largest customers accounted for approximately 37%, 40% and 45% of our total revenue in the fiscal years ended September 30, 2014, 2013 and 2012, respectively. The loss of one or more of these major customers, a significant decrease in orders from one of these customers, or the inability of one or more customers to make payments to us when they are due could materially affect our revenue, business and reputation. In addition, there has been and may continue to be significant consolidation among some of our largest OEM customers, which could lead to increased pressure to reduce the price of our products and/or decreased market share of our products with the combined companies.
Because of the lengthy sales cycles of many of our products, we may incur significant expenses before we generate any revenue related to those products.
Our customers may need several months to test and evaluate our products. This increases the possibility that a customer may decide to cancel an order or change its plans, which could reduce or eliminate our sales to that customer. The impact of this risk can be magnified during the periods in which we introduce a number of new products, as has been the case in recent years. As a result of this lengthy sales cycle, we may incur significant research and development expenses, and selling, general and administrative expenses before we generate the related revenue for these products, and we may never generate the anticipated revenue if our customer cancels an order or changes its plans.
In addition, many of our products will not be sold directly to the end-user but will be components of other products manufactured by OEMs. As a result, we rely on OEMs to select our products from among alternative offerings to be incorporated into their equipment at the design stage; so-called design-ins. The OEMs' decisions often precede the generation of volume sales, if any, by a year or more. Moreover, if we are unable to achieve these design-ins from an OEM, we would have difficulty selling our products to that OEM because changing suppliers after design-ins involves significant cost, time, effort and risk on the part of that OEM.
Customers generally do not make long term commitments to purchase our products and our customers may cease purchasing our products at any time.
Sales of our products are often made pursuant to individual purchase orders and not under long-term commitments and contracts. Our customers frequently do not provide any assurance of minimum or future sales and are not prohibited from purchasing products from our competitors at any time. Accordingly, we are exposed to competitive pricing pressures on each order. Our customers also engage in the practice of purchasing products from more than one manufacturer to avoid dependence on sole-source suppliers for certain of their needs. The existence of these practices makes it more difficult for us to increase price, gain new customers and win repeat business from existing customers.
14
We may face claims for liability related to damages of customer materials attributed to the failure of our products, exposing us to significant financial or reputational harm.
Our automation products for the semiconductor manufacturing market are used in the handling and movement of silicon wafers at various points in the production process, and our automated cold storage systems for the life sciences market are used in the handling, movement and storage of biological and chemical samples. In either case, damage to our customers' materials may be attributed to a failure of our products which could lead to claims for damages made by our customers and could also harm our relationship with our customers and damage our reputation in each of these industries, resulting in material harm to our business.
Risks Relating to Owning Our Securities
Our stock price is volatile.
The market price of our common stock has fluctuated widely. From the beginning of fiscal year 2013 through the end of fiscal year 2014, our stock price fluctuated between a high of $11.64 per share and a low of $7.00 per share. Consequently, the current market price of our common stock may not be indicative of future market prices, and we may be unable to sustain or increase the value of an investment in our common stock. Factors affecting our stock price may include:
• | variations in operating results from quarter to quarter; |
• | changes in earnings estimates by analysts or our failure to meet analysts' expectations; |
• | changes in the market price per share of our public company customers; |
• | market conditions in the semiconductor and other industries into which we sell products and services; |
• | global economic conditions; |
• | political changes, hostilities or natural disasters such as hurricanes and floods; |
• | low trading volume of our common stock; and |
• | the number of firms making a market in our common stock. |
In addition, the stock market has in the past experienced significant price and volume fluctuations. These fluctuations have particularly affected the market prices of the securities of high technology companies like ours. These market fluctuations could adversely affect the market price of our common stock.
We may not pay dividends on our common stock.
Holders of our common stock are only entitled to receive dividends when and if they are declared by our Board of Directors. Although we have declared cash dividends on our common stock for the past few years, we are not required to do so and may reduce or eliminate our cash dividends in the future. This could adversely affect the market price of our common stock.
Provisions in our charter documents and, Delaware law may delay or prevent an acquisition of us, which could decrease the value of your shares.
Our restated certificate of incorporation and by-laws and Delaware law contain provisions that could make it harder for a third party to acquire us without the consent of our Board of Directors. These provisions include limitations on actions by our stockholders by written consent, the inability of stockholders to call special meetings and the potential for super majority votes of our stockholders in certain circumstances. In addition, our Board of Directors has the right to issue preferred stock without stockholder approval, which could be used to dilute the stock ownership of a potential hostile acquirer.
Our restated certificate of incorporation makes us subject to the anti-takeover provisions of Section 203 of the Delaware General Corporation Law. In general, Section 203 prohibits publicly held Delaware corporations to which it applies from engaging in a “business combination” with an “interested stockholder” for a period of three years after the date of the transaction in which the person became an interested stockholder, unless the business combination is approved in a prescribed manner. This provision could discourage others from bidding for our shares of common stock and could, as a result, reduce the likelihood of an increase in the price of our common stock that would otherwise occur if a bidder sought to buy our common stock.
Delaware law also imposes restrictions on mergers and other business combinations between us and any holder of 15% or more of our outstanding common stock. Although we believe these provisions provide for an opportunity to receive a higher bid by requiring potential acquirers to negotiate with our Board of Directors, these provisions apply even if the offer may be considered beneficial by stockholders. If a change of control or change in management is delayed or prevented, the market price of our common stock could decline.
15
Our certificate of incorporation authorizes the issuance of shares of blank check preferred stock.
Our certificate of incorporation provides that our Board of Directors is authorized to issue from time to time, without further stockholder approval, up to 1,000,000 shares of preferred stock in one or more series and to fix and designate the rights, preferences, privileges and restrictions of the preferred stock, including dividend rights, conversion rights, voting rights, redemption rights and terms of redemption and liquidation preferences. Such shares of preferred stock could have preferences over our common stock with respect to dividends and liquidation rights. Our issuance of preferred stock may have the effect of delaying or preventing a change in control. Our issuance of preferred stock could decrease the amount of earnings and assets available for distribution to the holders of common stock or could adversely affect the rights and powers, including voting rights, of the holders of common stock. The issuance of preferred stock could have the effect of decreasing the market price of our common stock.
Item 1B. | Unresolved Staff Comments |
None.
Item 2. | Properties |
Our corporate headquarters and primary manufacturing/research and development facilities are currently located in three buildings in Chelmsford, Massachusetts, where we own two buildings and are committed to purchase the third under a long term purchase option. In summary, we maintain the following active principal facilities:
Location | Functions | Square Footage (Approx.) | Ownership Status/Lease Expiration | ||||
Chelmsford, Massachusetts | Corporate headquarters, training, manufacturing, R&D and sales & support | 201,000 | Owned | ||||
Chelmsford, Massachusetts | Manufacturing | 97,000 | Committed to purchase | ||||
Poway, California | Manufacturing, R&D and sales & support | 67,600 | July 2015 | ||||
Fremont, California | R&D and sales & support | 44,900 | August 2018 | ||||
Manchester, UK | Manufacturing, R&D and sales & support | 42,000 | December 2019 | ||||
Yongin-City, South Korea | Manufacturing, R&D and sales & support | 34,100 | August 2019 | ||||
Jena, Germany | Manufacturing, R&D and sales & support | 30,100 | January 2017 | ||||
Chu Bei City, Taiwan | Sales & support | 28,600 | June 2016 | ||||
Our Brooks Product Solutions segment utilizes the facilities in Massachusetts, Fremont, California, South Korea and Germany. Our Brooks Global Services segment utilizes the facilities in Massachusetts, South Korea, Germany and Taiwan. Our Brooks Life Science Systems segment utilizes the facilities in Poway, California and the UK as well as an additional facility in Spokane, Washington.
We maintain additional sales and support and training offices in Texas and overseas in Europe (France, Germany and Switzerland), as well as in Asia (Japan, China, Singapore and Taiwan) and the Middle East (Israel).
We utilize a third party to manage our manufacturing operation in Mexico. As part of our arrangement with this third party, we guarantee a lease for a 56,100 square foot manufacturing facility. The remaining payments under this lease, which expires in 2018, are approximately $1.4 million.
Item 3. | Legal Proceedings |
We are subject to various legal proceedings, both asserted and unasserted, that arise in the ordinary course of business. We cannot predict the ultimate outcome of such legal proceedings or in certain instances provide reasonable ranges of potential losses. However, as of the date of this report, we believe that none of these claims will have a material adverse effect on our consolidated financial condition or results of operations. In the event of unexpected subsequent developments and given the inherent unpredictability of these legal proceedings, there can be no assurance that our assessment of any claim will reflect the ultimate outcome and an adverse outcome in certain matters could, from time-to-time, have a material adverse effect on our consolidated financial condition or results of operations in particular quarterly or annual periods.
16
Item 4. | Mine Safety Disclosures |
Not applicable.
PART II
Item 5. | Market for Registrant's Common Equity, Related Stockholder Matters and Issuer Purchases of Equity Securities |
Our common stock is traded on the NASDAQ Stock Market LLC under the symbol “BRKS.” The following table sets forth the high and low intraday sales prices per share of our common stock as reported by the NASDAQ Stock Market LLC and the cash dividends declared per common share for the periods indicated:
Market Price | Dividends Declared | ||||||||||
High | Low | ||||||||||
Fiscal year ended September 30, 2014 | |||||||||||
First quarter | $ | 10.75 | $ | 9.01 | $ | 0.08 | |||||
Second quarter | 11.64 | 9.43 | 0.08 | ||||||||
Third quarter | 11.50 | 8.75 | 0.08 | ||||||||
Fourth quarter | 11.53 | 9.86 | 0.10 | ||||||||
Fiscal year ended September 30, 2013 | |||||||||||
First quarter | $ | 8.24 | $ | 7.00 | $ | 0.08 | |||||
Second quarter | 10.50 | 8.23 | 0.08 | ||||||||
Third quarter | 10.97 | 8.78 | 0.08 | ||||||||
Fourth quarter | 10.56 | 8.74 | 0.08 | ||||||||
Number of Holders
As of November 5, 2014, there were 672 holders of record of our common stock.
Dividend Policy
Dividends are declared at the discretion of our Board of Directors and depend on actual cash from operations, our financial condition and capital requirements and any other factors our Board of Directors may consider relevant. Future dividend declarations, as well as the record and payment dates for such dividends, will be determined by our Board of Directors on a quarterly basis.
On November 5, 2014, our Board of Directors approved a cash dividend of $0.10 per share payable on December 26, 2014 to common stockholders of record on December 5, 2014.
17
Comparative Stock Performance
The following graph compares the cumulative total shareholder return (assuming reinvestment of dividends) from investing $100 on September 30, 2009, and plotted at the last trading day of each of the fiscal years ended September 30, 2010, 2011, 2012, 2013 and 2014, in each of (i) our Common Stock; (ii) the NASDAQ/NYSE MKT/NYSE Index of companies; and (iii) a peer group comprised of: Advanced Energy Industries, Inc., Bruker Corp., Entegris, Inc., FEI Company, Formfactor Inc., MKS Instruments, Inc., Photronics, Inc., Teradyne Inc., Ultra Clean Technology, Inc., Veeco Instruments Inc. and Xcerra Corp. The stock price performance on the graph below is not necessarily indicative of future price performance.
COMPARISON OF 5 YEAR CUMULATIVE TOTAL RETURN*
Among Brooks Automation, Inc., the NASDAQ/NYSE MKT/NYSE Index,
and a Peer Group
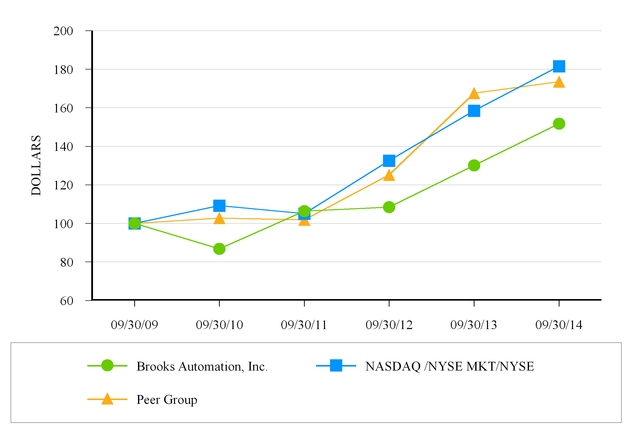
* $100 invested on September 30, 2009 in stock or index, including reinvestment of dividends.
9/30/09 | 9/30/10 | 9/30/11 | 9/30/12 | 9/30/13 | 9/30/14 | |||||||
Brooks Automation, Inc. | 100.00 | 86.80 | 106.38 | 108.40 | 130.06 | 151.69 | ||||||
NASDAQ/NYSE MKT/NYSE | 100.00 | 109.28 | 105.09 | 132.49 | 158.51 | 181.57 | ||||||
Peer Group | 100.00 | 102.67 | 101.89 | 125.13 | 167.58 | 173.52 | ||||||
The information included under the heading “Comparative Stock Performance” in Item 5 of "this report" shall not be deemed to be “soliciting material” or subject to Regulation 14A, shall not be deemed “filed” for purposes of Section 18 of the Exchange Act, or otherwise subject to the liabilities of that section, nor shall it be deemed incorporated by reference in any filing under the Securities Act of 1933, as amended, or the Exchange Act.
Unregistered Sales of Securities
Not applicable.
Issuer's Purchases of Equity Securities
As part of our equity compensation program, we offer recipients of restricted stock awards the opportunity to elect to sell their shares at the time of vesting to satisfy tax obligations in connection with such vesting. The following table provides
18
information concerning shares of our Common Stock, $0.01 par value, purchased in connection with the forfeiture of shares to satisfy the employees' obligations with respect to withholding taxes in connection with the vesting of certain shares of restricted stock during the three months ended September 30, 2014. Upon purchase, these shares are immediately retired.
Period | Total Number of Shares Purchased | Average Price Paid per Share | Total Number of Shares Purchased as Part of Publicly Announced Plans or Programs | Maximum Number (or Approximate Dollar Value) of Shares that May Yet be Purchased Under the Plans or Programs | ||||||||||
July 1 - 31, 2014 | — | $ | — | — | $ | — | ||||||||
August 1 - 31, 2014 | 8,608 | 10.56 | 8,608 | — | ||||||||||
September 1 - 30, 2014 | — | — | — | — | ||||||||||
Total | 8,608 | $ | 10.56 | 8,608 | $ | — | ||||||||
Item 6. | Selected Financial Data |
The selected consolidated financial data set forth below should be read in conjunction with our consolidated financial statements and notes thereto and “Management’s Discussion and Analysis of Financial Condition and Results of Operations,” appearing elsewhere in this report.
Year Ended September 30, | |||||||||||||||||||
2014(1)(2)(3) | 2013(1)(4)(5) | 2012(1)(6)(7)(8) | 2011(1)(9)(10) | 2010(1)(11) | |||||||||||||||
(In thousands, except per share data) | |||||||||||||||||||
Revenue | $ | 482,848 | $ | 422,440 | $ | 488,983 | $ | 653,299 | $ | 562,744 | |||||||||
Gross profit | $ | 167,337 | $ | 132,307 | $ | 159,453 | $ | 207,012 | $ | 152,605 | |||||||||
Operating income (loss) | $ | (2,699 | ) | $ | (16,798 | ) | $ | 1,642 | $ | 70,301 | $ | 39,295 | |||||||
Income (loss) from continuing operations | $ | 1,520 | $ | (7,114 | ) | $ | 131,835 | $ | 121,141 | $ | 52,172 | ||||||||
Income from discontinued operations, net of tax | $ | 30,002 | $ | 4,964 | $ | 5,000 | $ | 9,296 | $ | 7,712 | |||||||||
Net income (loss) attributable to Brooks Automation, Inc. | $ | 31,361 | $ | (2,215 | ) | $ | 136,789 | $ | 130,385 | $ | 59,841 | ||||||||
Basic net income (loss) per share attributable to Brooks Automation, Inc. common stockholders: | |||||||||||||||||||
Income (loss) from continuing operations | $ | 0.02 | $ | (0.11 | ) | $ | 2.02 | $ | 1.88 | $ | 0.82 | ||||||||
Income from discontinued operations, net of tax | 0.45 | 0.08 | 0.08 | 0.14 | 0.12 | ||||||||||||||
Basic net income (loss) per share attributable to Brooks Automation, Inc. | $ | 0.47 | $ | (0.03 | ) | $ | 2.10 | $ | 2.02 | $ | 0.94 | ||||||||
Diluted net income (loss) per share attributable to Brooks Automation, Inc. common stockholders: | |||||||||||||||||||
Income (loss) from continuing operations | $ | 0.02 | $ | (0.11 | ) | $ | 2.01 | $ | 1.86 | $ | 0.81 | ||||||||
Income from discontinued operations, net of tax | 0.44 | 0.08 | 0.08 | 0.14 | 0.12 | ||||||||||||||
Diluted net income (loss) per share attributable to Brooks Automation, Inc. | $ | 0.46 | $ | (0.03 | ) | $ | 2.08 | $ | 2.01 | $ | 0.93 | ||||||||
Dividend declared per share | $ | 0.34 | $ | 0.32 | $ | 0.32 | $ | 0.08 | $ | — | |||||||||
As of September 30, | |||||||||||||||||||
2014 | 2013 | 2012 | 2011 | 2010 | |||||||||||||||
(In thousands) | |||||||||||||||||||
Cash and cash equivalents and marketable securities | $ | 245,456 | $ | 173,362 | $ | 200,231 | $ | 205,818 | $ | 142,427 | |||||||||
Working capital(12) | $ | 98,228 | $ | 105,511 | $ | 121,709 | $ | 95,579 | $ | 107,064 | |||||||||
Total assets | $ | 778,038 | $ | 736,763 | $ | 741,960 | $ | 636,958 | $ | 517,040 | |||||||||
Total capital lease obligation | $ | 8,298 | $ | — | $ | — | $ | — | $ | — | |||||||||
Total equity | $ | 642,889 | $ | 632,656 | $ | 649,301 | $ | 518,936 | $ | 388,168 | |||||||||
19
Year Ended September 30, 2014 | |||||||||||||||
First Quarter(1) | Second Quarter | Third Quarter(2)(3) | Fourth Quarter(3) | ||||||||||||
(In thousands, except per share data) | |||||||||||||||
Revenue | $ | 117,072 | $ | 125,900 | $ | 117,359 | $ | 122,517 | |||||||
Gross profit | $ | 40,891 | $ | 44,298 | $ | 40,746 | $ | 41,402 | |||||||
Operating income (loss) | $ | 1,458 | $ | 2,396 | $ | (5,910 | ) | $ | (643 | ) | |||||
Income (loss) from continuing operations | $ | 1,919 | $ | 2,103 | $ | (2,764 | ) | $ | 262 | ||||||
Income from discontinued operations, net of tax | $ | 1,577 | $ | 1,162 | $ | 27,263 | $ | — | |||||||
Net income attributable to Brooks Automation, Inc. | $ | 3,448 | $ | 3,189 | $ | 24,476 | $ | 248 | |||||||
Basic net income per share attributable to Brooks Automation, Inc. common stockholders: | |||||||||||||||
Income (loss) from continuing operations | $ | 0.03 | $ | 0.03 | $ | (0.04 | ) | $ | 0.00 | ||||||
Income from discontinued operations, net of tax | 0.02 | 0.02 | 0.41 | — | |||||||||||
Basic net income per share attributable to Brooks Automation, Inc. | $ | 0.05 | $ | 0.05 | $ | 0.37 | $ | 0.00 | |||||||
Diluted net income per share attributable to Brooks Automation, Inc. common stockholders: | |||||||||||||||
Income (loss) from continuing operations | $ | 0.03 | $ | 0.03 | $ | (0.04 | ) | $ | 0.00 | ||||||
Income from discontinued operations, net of tax | 0.02 | 0.02 | 0.40 | — | |||||||||||
Diluted net income per share attributable to Brooks Automation, Inc. | $ | 0.05 | $ | 0.05 | $ | 0.36 | $ | 0.00 | |||||||
Year Ended September 30, 2013 | |||||||||||||||
First Quarter(5) | Second Quarter(5) | Third Quarter(5) | Fourth Quarter(4)(5) | ||||||||||||
(In thousands, except per share data) | |||||||||||||||
Revenue | $ | 91,506 | $ | 109,482 | $ | 110,771 | $ | 110,681 | |||||||
Gross profit | $ | 26,281 | $ | 33,083 | $ | 36,075 | $ | 36,868 | |||||||
Operating income (loss) | $ | (14,468 | ) | $ | (3,170 | ) | $ | 2,133 | $ | (1,293 | ) | ||||
Income (loss) from continuing operations | $ | (10,407 | ) | $ | (3,165 | ) | $ | 4,549 | $ | 1,909 | |||||
Income (loss) from discontinued operations, net of tax | $ | 1,188 | $ | 2,654 | $ | (2,981 | ) | $ | 4,103 | ||||||
Net income (loss) attributable to Brooks Automation, Inc. | $ | (9,236 | ) | $ | (538 | ) | $ | 1,544 | $ | 6,015 | |||||
Basic net income (loss) per share attributable to Brooks Automation, Inc. common stockholders: | |||||||||||||||
Income (loss) from continuing operations | $ | (0.16 | ) | $ | (0.05 | ) | $ | 0.07 | $ | 0.03 | |||||
Income (loss) from discontinued operations, net of tax | 0.02 | 0.04 | (0.05 | ) | 0.06 | ||||||||||
Basic net income (loss) per share attributable to Brooks Automation, Inc. | $ | (0.14 | ) | $ | (0.01 | ) | $ | 0.02 | $ | 0.09 | |||||
Diluted net income (loss) per share attributable to Brooks Automation, Inc. common stockholders: | |||||||||||||||
Income (loss) from continuing operations | $ | (0.16 | ) | $ | (0.05 | ) | $ | 0.07 | $ | 0.03 | |||||
Income (loss) from discontinued operations, net of tax | 0.02 | 0.04 | (0.04 | ) | 0.06 | ||||||||||
Diluted net income (loss) per share attributable to Brooks Automation, Inc. | $ | (0.14 | ) | $ | (0.01 | ) | $ | 0.02 | $ | 0.09 | |||||
(1) | In March 2014, we entered into an agreement to sell the Granville-Phillips Gas Analysis & Vacuum Measurement, or Granville-Phillips, business unit for $87.0 million in cash. In the second quarter of fiscal year 2014, we determined that the Granville-Phillips business met the criteria to be reported as a discontinued operation. As a result, the selected financial data presented for periods prior to the second quarter of fiscal year 2014 has been revised to present the |
20
operating results of the Granville-Phillips business as a discontinued operation. Refer to Note 3, “Discontinued Operations” in the Notes to the Consolidated Financial Statements for additional information regarding this transaction.
(2) | We completed the sale of the Granville-Phillips business in May 2014. We realized a pre-tax gain of $56.8 million and an after-tax gain of $26.9 million in connection with the sale. The tax charge of $29.9 million on the gain is substantially non-cash as it is offset by our net operating losses in the United States. |
(3) | We acquired Dynamic Micro Systems Semiconductor Equipment GmbH, or DMS, in April 2014. The results of DMS have been included in our results of operations from the date of acquisition. Refer to Note 4, “Acquisitions” in the Notes to the Consolidated Financial Statements for additional information regarding this transaction. |
(4) | We acquired certain assets and assumed certain liabilities of Matrical, Inc.’s life science businesses, collectively referred to as Matrical, in August 2013. The results of Matrical have been included in our results of operations from the date of acquisition. Refer to Note 4, “Acquisitions” in the Notes to the Consolidated Financial Statements for additional information regarding this transaction. |
(5) | We acquired Crossing Automation Inc., or Crossing, in October 2012. The results of Crossing have been included in our results of operations from the date of acquisition. Refer to Note 4, “Acquisitions” in the Notes to the Consolidated Financial Statements for additional information regarding this transaction. |
(6) | We acquired the Celigo® product line in December 2011. The results from the Celigo® product line were included in our results of operations from the date of acquisition through March 2014, when we completed the sale of this product line. Refer to Note 4, “Acquisitions” in the Notes to the Consolidated Financial Statements for additional information regarding this transaction. |
(7) | Income (loss) from continuing operations and net income (loss) attributable to Brooks Automation, Inc. includes a $121.8 million deferred income tax benefit in connection with a reversal of a majority of the valuation allowance against our net deferred tax assets. |
(8) | Income (loss) from continuing operations and net income (loss) attributable to Brooks Automation, Inc. includes an $8.9 million charge in connection with the settlement of our U.S. defined benefit pension plan. |
(9) | We acquired RTS Life Science Limited, or RTS, in April 2011 and Nexus Biosystems, Inc., or Nexus, in July 2011. The results of RTS and Nexus have been included in our results of operations from the date of each acquisition. |
(10) | On June 28, 2011, we disposed of our contract manufacturing business which did not qualify as discontinued operations because of the significance of the ongoing commercial arrangements between us and the buyer. As such, the operations prior to the divestiture are included in our results of operations. Income (loss) from continuing operations and net income (loss) attributable to Brooks Automation, Inc. includes a $45.0 million pre-tax gain on the sale of our contract manufacturing business. |
(11) | Income (loss) from continuing operations and net income (loss) attributable to Brooks Automation, Inc. includes a $7.8 million gain on the sale of certain patents and patents pending related to a legacy product line. |
(12) | The calculation of working capital excludes "Cash and cash equivalents" and "Marketable securities," as well as assets and liabilities identifiable within the Granville-Phillips business reported as “Assets held for sale” and “Liabilities held for sale,” respectively, in the Consolidated Balance Sheets. |
Item 7. | Management’s Discussion and Analysis of Financial Condition and Results of Operations |
Certain statements in this Form 10-K, and in particular in “Management’s Discussion and Analysis of Financial Condition and Results of Operations,” constitute forward-looking statements, which are subject to the safe harbor provisions created by the Private Securities Litigation Reform Act of 1995. Certain, but not all, of the forward-looking statements in this report are specifically identified as forward-looking, by use of phrases and words such as “we believe,” “we estimate,” “we expect,” “may,” “should,” “could,” “intend,” “likely,” and other future-oriented terms. The identification of certain statements as “forward-looking” is not intended to mean that other statements not specifically identified are not forward-looking. Forward-looking statements include, but are not limited to, statements that relate to our future revenue, margin, costs, earnings, product development, demand, acceptance and market share, competitiveness, market opportunities and performance, levels of research and development, or R&D, the success of our marketing, sales and service efforts, outsourced activities and operating expenses, anticipated manufacturing, customer and technical requirements, the ongoing viability of the solutions that we offer and our customers’ success, tax expenses, our management’s plans and objectives for our current and future operations and business focus, the levels of customer spending, general economic conditions, the sufficiency of financial resources to support future operations, and capital expenditures. Such statements are based on current expectations and are subject to risks, uncertainties, and changes in condition, significance, value and effect, including without limitation those discussed above under the heading “Risk Factors” within Item 1A and elsewhere in this report and other documents we file from time to time with the Securities and Exchange Commission (the “SEC”), such as our quarterly reports on Form 10-Q and our current reports on Form 8-K. Such risks, uncertainties and changes in condition, significance, value and effect could cause our actual results, performance or achievements to differ materially from those expressed in this report and in ways we cannot readily foresee. Readers are cautioned not to place undue reliance on these forward-looking statements, which speak only as of the date hereof and are based on information currently and reasonably known to us. We do not undertake any obligation to release the results of any
21
revisions to these forward-looking statements, which may be made to reflect events or circumstances that occur after the date of this report or to reflect the occurrence or effect of anticipated or unanticipated events. Precautionary statements made herein should be read as being applicable to all related forward-looking statements wherever they appear in this report.
Overview
We are a leading provider of automation and cryogenic solutions for multiple markets including semiconductor manufacturing and life sciences and are a valued business partner to original equipment manufacturers, or OEMs, and equipment users throughout the world. We serve markets where equipment productivity and availability is a critical factor for our customers’ success, typically in demanding temperature and/or pressure environments. Our largest served market is the semiconductor capital equipment industry, for which products sold through our Brooks Product Solutions segment represented approximately 51%, 52% and 56% of our consolidated revenue for fiscal years 2014, 2013 and 2012, respectively. The decrease in the portion of our total revenues represented by products sold through our Brooks Product Solutions segment is due in part to the cyclical nature of the demand from the customer for semiconductor capital equipment combined with the growth of sales of our Brooks Life Science Systems segment. The non-semiconductor markets served by us also includes industrial capital equipment and other adjacent technology markets.
We expect the semiconductor equipment market will continue to be a key end market for our products, and we continue to make investments to maintain and grow our semiconductor product and service offerings. We acquired DMS Dynamic Micro Systems Semiconductor Equipment GmbH, or DMS, in April 2014 for approximately $31.6 million. DMS is a German based provider of automated contamination control solutions for front opening unified pod, or FOUP, carriers and reticle storage, for improving yield of semiconductor processes at semiconductor fabrication plants. In October 2012, we acquired Crossing Automation Inc., or Crossing, a U.S. based provider of automation solutions for the global semiconductor front-end markets. The purchase price was $59.0 million. The acquisition of these businesses provides us with the opportunity to enhance our existing capabilities with respect to manufacturing of atmospheric and vacuum automation solutions within the semiconductor front-end market.
We also intend to continue development and acquisition of technologies that create opportunities outside of the semiconductor market. In fiscal year 2014, our Brooks Life Science Systems segment began shipping our Twinbank platform of automated systems for compound and biological sample storage. In addition, in the last eighteen months we completed two acquisitions that expanded our offerings to our life science customers. In August 2013 we acquired certain assets related to biological sample preparation, management and storage solutions from Matrical, Inc. for $9.3 million. In October 2014, subsequent to the reporting period of this filing, we announced the acquisition of FluidX Ltd., or FluidX, a UK based provider of biological sample storage tubes and complementary bench-top instruments for approximately $16.0 million.
In September 2014, we acquired the remaining interest in the equity of our majority owned subsidiary, Brooks Automation Asia, Ltd., or BAA, for $3.2 million. We have historically consolidated the financial position and results of operations from BAA and presented the portion of the income attributable to the minority shareholders in the Consolidated Statements of Operations. The acquisition of this additional interest has been accounted for as an equity transaction, and as a result, no additional assets or liabilities were recognized related to the additional interest acquired. We will no longer report a noncontrolling interest.
In March 2014, we entered into an agreement to sell the Granville-Phillips Gas Analysis & Vacuum Measurement, or Granville-Phillips, business unit to MKS Instruments, Inc. for $87.0 million in cash. We completed the sale on May 30, 2014. We recorded a pre-tax gain of $56.8 million and an after-tax gain of $26.9 million. The tax charge of $29.9 million on the gain is substantially non-cash as it is offset by our net operating losses in the U.S. Our historical financial statements have been revised to present the operating results of the Granville-Phillips business as a discontinued operation.
We report financial results in three segments:
• | The Brooks Product Solutions segment provides a variety of products and solutions that enable improved throughput and yield in controlled operating environments. Those products include atmospheric and vacuum robots, robotic modules, and tool automation systems that provide precision handling and clean wafer environments as well as vacuum pumping and thermal management solutions used to create and control critical process vacuum applications. |
• | The Brooks Global Services segment provides an extensive range of support services, including repair services, diagnostic support services, and installation services in support of the base equipment installed by our Brooks Product Solutions segment, which enable our customers to maximize process tool uptime and productivity. This segment also provides end-user customers with spare parts to maximize customer tool productivity. |
• | The Brooks Life Science Systems segment provides automated cold sample management systems for compound and bio sample storage, equipment for sample preparation and handling, consumables, and parts and support services to a wide range of life science customers including pharmaceutical companies, biotechnology companies, biobanks, national laboratories, research institutes and research universities. |
22
During fiscal year 2014, we had net income attributable to Brooks Automation, Inc. of $31.4 million, of which $30.0 million was from discontinued operations, including the gain on sale of the Granville-Phillips business unit. Income from continuing operations was $1.5 million in fiscal year 2014 after a loss of $7.1 million in fiscal year 2013. In addition to the acquisitions activity described above, we intend to continue to implement measures to improve the profitability of our continuing operations. For example, during fiscal year 2014, we discontinued certain product lines in the Brooks Life Science Systems and Brooks Product Solutions segments, transitioned manufacturing of our line of Polycold cryochillers to a third party contract manufacturer, consolidated our global footprint and implemented other programs designed to improve our cost structure. In connection with these initiatives, we recorded restructuring charges of $6.3 million for fiscal year 2014, compared to $6.4 million of restructuring charges recorded in fiscal year 2013. We expect these changes to improve our profitability in future periods.
Critical Accounting Policies and Estimates
The preparation of the consolidated financial statements requires us to make estimates and judgments that affect the reported amounts of assets, liabilities, revenue and expenses, and related disclosure of contingent assets and liabilities. On an ongoing basis, we evaluate our estimates, including those related to revenue, bad debts, inventories, derivative instruments, intangible assets, goodwill, income taxes, warranty obligations, pensions and stock-based compensation. We base our estimates on historical experience and on various other assumptions that are believed to be reasonable under the circumstances, including current and anticipated worldwide economic conditions both in general and specifically in relation to the semiconductor and life science industries, the results of which form the basis for making judgments about the carrying values of assets and liabilities that are not readily apparent from other sources. Using different estimates could have a material impact on our financial condition and results of operations.
We believe the following critical accounting policies incorporate our more significant judgments and estimates used in the preparation of our consolidated financial statements.
Revenue
Product revenue is associated with the sale of hardware systems, components and spare parts as well as product license revenue. Service revenue is associated with service contracts, repairs, upgrades and field service. Shipping and handling fees billed to customers, if any, are recognized as revenue. The related shipping and handling costs are recognized in cost of revenue.
We recognize revenue when the following criteria have been met: persuasive evidence of an arrangement exists with the customer; delivery of the specified products has occurred or services have been rendered; fees are fixed or determinable; and collection of the related receivable is reasonably assured. The arrangements for the sale of certain of our products include customer acceptance provisions. These provisions are included in these arrangements to ensure that the product delivered to the customer meets published specifications. Prior to shipment of our products, we typically inspect the product, test its functionality and document that it meets the published specifications. In general, our inspections and testing replicate the testing that will be performed at the customer site prior to final acceptance by the customer. In situations where we have sufficient history of objectively demonstrating that the acceptance criteria in the arrangement have been achieved prior to delivery, which are typically for products with limited customization, we recognize revenue in advance of final customer acceptance because there are no remaining substantive contingencies. Arrangements with certain customers also include contingent revenue provisions, in which a portion of the selling price of a delivered item is contingent on the delivery of other items or on the delivered items meeting specified performance criteria. In arrangements that include contingent revenue, the amount of revenue that we recognize is limited to the lower of either: the amount billed that is not contingent on acceptance; or the value of the arrangement consideration allocated to the delivered elements, if the product is part of a multiple-element arrangement. When significant on-site customer acceptance provisions are present in the arrangement, or we are not able to objectively demonstrate that the acceptance criteria have been met, revenue is recognized upon receiving acceptance from the customer.
Revenue from product sales that include significant customization, which primarily include life science automation systems, is recorded using the percentage of completion method. Under the percentage of completion method, revenue is recorded as work progresses based on a percentage that incurred labor effort to date bears to total projected labor effort. Profit estimates on long-term contracts are revised periodically based on changes in circumstances, and any losses on contracts are accrued in the same period we determine that the loss is probable. If we determine that a loss is probable, we estimate the amount of the loss by comparing total estimated contract revenue to the total estimated contract costs. Significant judgment is required when estimating total labor costs and progress to completion on these arrangements, as well as whether a loss is expected to be incurred on the contract due to several factors, including the degree of customization required and the customer’s existing environment. We use historical experience, project plans, and an assessment of the risks and uncertainties inherent in the arrangement to establish these estimates. Uncertainties in these arrangements include implementation delays or performance issues that may or may not be within our control. We also have certain arrangements for products with significant
23
customization that include contractual terms that prohibit us from using the percentage of completion method. In some circumstances, percentage of completion is not appropriate, as it relates to the contractual rights of the customer, and in these cases we use the completed-contract method. Under the completed-contract method, income is recognized only when a contract is completed or substantially completed.
Generally, the terms of long-term contracts provide for progress billings based on completion of milestones or other defined phases of work. In certain instances, payments collected from customers in advance of recognizing the related revenue is recorded as deferred revenue.
Revenue associated with service agreements is generally recognized ratably over the term of the contract, with payments from customers being recorded as deferred revenue. Revenue from repair services or upgrades of customer-owned equipment is recognized upon completion of the repair effort and upon the shipment of the repaired item back to the customer. In instances where the repair or upgrade includes installation, revenue is recognized when the installation is completed.
A portion of the revenue arrangements for our products, particularly in sales of life science automation systems, are multiple element arrangements that can include product, service and other elements. For revenue arrangements with multiple elements, arrangement consideration is allocated to each element based upon their relative selling price using vendor-specific objective evidence, or VSOE, or third-party evidence, or TPE, or based upon the relative selling price using estimated selling prices if VSOE or TPE does not exist. We rely primarily on estimated selling prices because we generally do not have VSOE or TPE. We recognize revenue on each element of the arrangement in accordance with our policies for revenue recognition. The fair value of any undelivered elements is deferred until the undelivered element is delivered and all other criteria for revenue recognition have been met.
Intangible Assets, Goodwill and Other Long-Lived Assets
As a result of our acquisitions, we have identified intangible assets other than goodwill and generated significant goodwill. Intangible assets other than goodwill are valued based on estimates of future cash flows and amortized over their estimated useful life. Goodwill is subject to annual impairment testing as well as testing upon the occurrence of any event that indicates a potential impairment. Intangible assets other than goodwill and other long-lived assets are subject to an impairment test if there is an indicator of impairment. We conduct our annual goodwill impairment test as of our fiscal year end, or September 30th. Management's judgments are based on market and operational conditions at the time of the evaluation and can include management's best estimate of future business activity, which in turn drives estimates of future cash flows from these assets and the reporting units with associated goodwill. These periodic evaluations could cause management to conclude that impairment factors exist, requiring an adjustment of these assets to their then-current fair market value. Future business conditions and/or activity could differ materially from the projections made by management causing the need for additional adjustments and impairment charges.
The testing of goodwill for impairment is to be performed at a level referred to as a reporting unit. A reporting unit is either the “operating segment level” or one level below, which is referred to as a “component.” The level at which the impairment test is performed requires an assessment as to whether the operations below the operating segment constitute a self-sustaining business, in which case testing is generally required to be performed at this level. We currently have four reporting units that have goodwill, including two components that are part of our Brooks Product Solutions operating segment and sole reporting units that are our Brooks Global Services and Brooks Life Science Systems operating segments.
Goodwill impairment testing is a two-step process. The first step of the goodwill impairment test, used to identify potential impairment, compares the fair value of each reporting unit to its respective carrying amount, including goodwill. If the fair value of the reporting unit exceeds its carrying amount, goodwill of the reporting unit is not considered impaired. If the reporting unit’s carrying amount exceeds the fair value, the second step of the goodwill impairment test must be completed to measure the amount of the impairment loss, if any. The second step compares the implied fair value of goodwill with the carrying value of goodwill. The implied fair value is determined by allocating the fair value of the reporting unit to all of the assets and liabilities of that unit, and the excess of the fair value over amounts assigned to its assets and liabilities is the implied fair value of goodwill. The implied fair value of goodwill determined in this step is compared to the carrying value of goodwill. If the implied fair value of goodwill is less than the carrying value of goodwill, an impairment loss is recognized equal to the difference.
We determine the fair value of our reporting units using an Income Approach, specifically the Discounted Cash Flow Method, or DCF Method. The DCF Method includes future cash flow projections, which are discounted to present value, and an estimate of terminal values, which are also discounted to present value. Terminal values represent the present value an investor would pay today for the rights to the cash flows of the business for the years subsequent to the discrete cash flow projection period. We consider the DCF Method to be the most appropriate valuation indicator as the DCF analyses are based on management’s long-term financial projections. Given the dynamic nature of the cyclical semiconductor equipment market, management’s projections as of the valuation date are considered more objective since other market metrics for peer companies fluctuate over the cycle. However, we also use market-based valuation techniques to test the reasonableness of the reporting
24
unit fair values determined by the DCF Method. In addition, we compare the aggregate fair value of our reporting units plus our net corporate assets to our overall market capitalization.
For our annual goodwill impairment test as of September 30, 2014, we determined that the estimated fair value of each reporting unit substantially exceeded its carrying value and that no impairment existed. The observable inputs used in our DCF approach include discount rates that are at or above our weighted-average cost of capital. We derive discount rates that are commensurate with the risks and uncertainties inherent in the respective businesses and our internally developed projections of future cash flows. In addition, we determine the terminal value of each reporting unit using the Gordon growth method. The Gordon growth method assumes that the reporting unit will grow and generate free cash flow at a constant rate. We believe that the Gordon growth method is the most appropriate method for determining the terminal value because the terminal value was calculated at the point in which we have assumed that our reporting units have reached stable growth rates.
We are required to test long-lived assets, other than goodwill, when indicators of impairment are present. For purposes of this test, long-lived assets are grouped with other assets and liabilities at the lowest level for which identifiable cash flows are largely independent of the cash flows of other assets and liabilities. When we determine that indicators of potential impairment exist, the next step of the impairment test requires that the potentially impaired long-lived asset group is tested for recoverability. The test for recoverability compares the undiscounted future cash flows of the long-lived asset group to its carrying value. If the carrying values of the long-lived asset group exceed the future cash flows, the assets are potentially impaired. The next step in the impairment process is to determine the fair value of the individual net assets within the long-lived asset group. If the aggregate fair values of the individual net assets of the group are less than the carrying values, an impairment charge is recorded equal to the excess of the aggregate carrying value of the group over the aggregate fair value. The loss is allocated to each asset within the group based on their relative carrying values, with no asset reduced below its fair value.
We determined that impairment indicators were present for long-lived assets related to the Celigo product line as of September 30, 2013. Indicators of impairment for this asset group included declining sales in the trailing twelve months and negative cash flows from the asset group. We tested the recoverability of the asset group by comparing the sum of the expected future undiscounted cash flows directly attributable to the assets to their carrying values, which resulted in the conclusion that the carrying amounts of the assets were not recoverable. The fair value of the long-lived assets related to the Celigo products was based primarily on market-based valuation techniques reflecting the view of a market participant using the assets in the group to their best possible use. We determined that the carrying value of the asset group exceeded the fair value of the asset group by approximately $2.0 million and we recorded this amount as an impairment charge in the fourth quarter of 2013. We revised our estimate of the fair value of these assets in the first fiscal quarter of 2014 and determined that an additional impairment charge, representing the remaining carrying value of the long-lived assets, of $0.4 million was required.
Except as described above, we have not tested any other long-lived assets, other than goodwill, since 2009 because no events have occurred that would require an impairment assessment.
Accounts Receivable
We record trade accounts receivable at the invoiced amount. Trade accounts receivables do not bear interest. We maintain an allowance for doubtful accounts representing our best estimate of the amount of probable credit losses in our existing accounts receivable. If the financial results of our customers deteriorate, reducing their ability to make payments, additional allowances would be required, resulting in a charge to operations. We do not have any off-balance-sheet credit exposure related to our customers.
Derivative Financial Instruments
We record all derivative instruments as assets or liabilities at their fair value, which is determined by estimating future cash flows of the instrument. Subsequent changes in a derivative’s fair value are recognized in income, unless specific hedge accounting criteria are met. Changes in the fair value of a derivative that is highly effective and designated as a cash flow hedge are recognized in accumulated other comprehensive income until the forecasted transaction occurs or it becomes probable that the forecasted transaction will not occur. We perform an assessment at the inception of the hedge and on a quarterly basis thereafter, to determine whether our derivatives are highly effective in offsetting changes in the value of the hedged items. Any changes in the fair value resulting from hedge ineffectiveness are immediately recognized as income or expense.
Warranty
We provide for the estimated cost of product warranties at the time revenue is recognized. While we engage in extensive product quality programs and processes, including actively monitoring and evaluating the quality of our component suppliers, our warranty obligation is affected by product failure rates, material usage and service delivery costs incurred in correcting a product failure. Should actual product failure rates, material usage or service delivery costs differ from our estimates, revisions to the estimated warranty liability would be required and may result in additional benefits or charges to operations.
25
Inventory
We provide reserves for estimated obsolescence or unmarketable inventory equal to the difference between the cost of inventory and the estimated market value based upon assumptions about future demand and market conditions. We fully reserve for inventories and noncancelable purchase orders for inventory deemed obsolete. We perform periodic reviews of all inventory items to identify excess inventories on hand by comparing on-hand balances to anticipated usage using recent historical activity as well as anticipated or forecasted demand, based upon sales and marketing inputs through our planning systems. If estimates of demand diminish further or actual market conditions are less favorable than those projected by management, additional inventory write-downs may be required.
Deferred Income Taxes
We record a valuation allowance to reduce our deferred tax assets to the amount that is more likely than not to be realized. We consider recent historical income, estimated future taxable income, carry-forward periods of tax attributes, the volatility of the semiconductor industry and ongoing tax planning strategies in assessing the need for the valuation allowance. We maintain a valuation allowance against certain deferred tax assets in the U.S. and in certain foreign jurisdictions. We will continue to assess the need for a valuation allowance in future periods. If future operating results of the U.S. or these foreign jurisdictions deviate from long-term expectations, it is reasonably possible that there could be a change in the valuation allowance in the future. A change in the valuation allowance, in whole or in part, would result in a non-cash income tax expense or benefit during the period of change.
Pension Plans
We sponsor defined benefit pension plans in Switzerland and Taiwan. The cost and obligations of these arrangements are calculated using many assumptions to estimate the benefits that the employee earns while working, the amount of which cannot be completely determined until the benefit payments cease. Major assumptions used in the accounting for these employee benefit plans include the discount rate, expected return on plan assets and rate of increase in employee compensation levels. Assumptions are determined based on company data and appropriate market indicators in consultation with third-party actuaries, and are evaluated each year as of the plans’ measurement date. Should any of our assumptions change, they would have an effect on net periodic pension costs and the unfunded benefit obligation.
Stock-Based Compensation
We measure compensation cost for all employee stock awards at fair value on the date of grant and recognize compensation expense over the service period for awards expected to vest. The fair value of restricted stock units is determined based on the number of shares granted and the closing price of our common stock quoted on NASDAQ on the date of grant, and the fair value of stock options is determined using the Black-Scholes valuation model. Such fair values are recognized as expense over the service period, net of estimated forfeitures. The estimation of stock awards that will ultimately vest requires significant judgment. We consider many factors when estimating expected forfeitures, including types of awards, employee class, and historical experience. In addition, for stock-based awards where vesting is dependent upon achieving certain operating performance goals, we estimate the likelihood of achieving the performance goals. Actual results, and future changes in estimates, may differ from our current estimates.
Year Ended September 30, 2014 Compared to Year Ended September 30, 2013
Revenue
We reported revenue of $482.8 million for fiscal year 2014, compared to $422.4 million in the previous fiscal year, an increase of 14%. All three of our segments contributed to the increase in revenue. Revenue from Brooks Product Solutions and Brooks Global Services increased $35.1 million and $5.4 million, respectively, and benefited from stronger demand from the semiconductor capital equipment market. Brooks Life Science Systems’ revenue increased $19.9 million, primarily as a result of increased demand for automated cold storage systems. Acquisitions completed in the last twelve months contributed $5.5 million of revenue. We continue to seek opportunities to expand our market share in the semiconductor and adjacent technology markets served by our Brooks Product Solutions and Brooks Global Services segments. However, these markets are cyclical and demand for the products and services offered will be affected by these cycles. We anticipate continued growth in revenue from our Brooks Life Science Systems segment through our internally developed products and services, including our Twinbank platform for automated systems, and through acquisition of products and services that expand our addressable markets, including our recent acquisition of FluidX.
Our Brooks Product Solutions segment reported revenue of $325.6 million for fiscal year 2014, an increase of 12% from $290.5 million in the prior fiscal year. These increases were mostly attributable to increased demand from the semiconductor capital equipment market. Revenue from the acquisition of DMS contributed $5.5 million to the increase.
26
Our Brooks Global Services segment reported revenue of $94.1 million for fiscal year 2014, a 6% increase from $88.6 million in the prior fiscal year. The increase was primarily due to increased demand from semiconductor capital equipment end-users.
Our Brooks Life Science Systems segment reported revenue of $63.1 million for fiscal year 2014, an increase of 46% from $43.3 million in the prior fiscal year. Revenue growth was supported by the launch and accelerating sales of the first internally developed Twinbank platform for automated cold storage systems. The acquisition of Matrical provided $6.0 million and $1.0 million of revenue from automated cold storage systems, instrumentation and consumables in fiscal years 2014 and 2013, respectively. Many of the opportunities for Matrical automated cold storage systems were transitioned to the Twinbank platform that we launched in fiscal year 2014.
Revenue outside the United States was $308.5 million, or 64% of total revenue, and $244.7 million, or 58% of total revenue, for fiscal years 2014 and 2013, respectively.
Gross Margin
Gross margin increased by 3.4 percentage points to 34.7% for fiscal year 2014, compared to 31.3% for the prior fiscal year. The increase was driven by leverage on increased volume in all three segments, favorable mix in our Brooks Product Solutions segment and execution of operational initiatives related to material and warranty cost reduction. Gross margin in fiscal year 2014 included $3.0 million of charges related to the step-up of inventory balances in purchase accounting, impairment of intangible assets and restructuring charges compared with $5.0 million of such charges in fiscal year 2013. These charges reduced gross profit margin by 0.6 percentage points in fiscal year 2014 and 1.2 percentage points in fiscal year 2013.
Our gross margin percentage for our Brooks Products Solutions segment increased to 34.3% for fiscal year 2014 as compared to 31.4% in the prior fiscal year. The increase was primarily driven by leverage on increased volume, execution of operational initiatives related to material and warranty cost reduction and favorable product mix. Operational improvements were partially offset by an increase in inventory step-up charges associated with acquisitions which reduced gross profit margin by 0.6 percentage points in fiscal year 2014 as compared to 0.5 percentage points in fiscal year 2013.
Our gross margin percentage for our Brooks Global Services segment increased to 34.2% for fiscal year 2014 as compared to 30.4% in the prior fiscal year. The increase was primarily driven by leverage on increased volume, improved utilization of our field service organization and a reduction in inventory step-up charges associated with acquisitions. Gross margin in fiscal 2013 included $1.3 million of step-up charges which reduced gross margin by 1.5 percentage points. Our Brooks Global Services segment did not have any step-up charges in fiscal year 2014.
Our gross margin percentage for our Brooks Life Science Systems segment increased to 37.1% for fiscal year 2014 as compared to 32.7% in the prior fiscal year. The increase was driven by leverage on increased volume, a reduction in inventory step-up charges associated with acquisitions and a reduction in impairment charges related to completed technology intangible assets. The segment operating leverage drove significant benefits with revenue growth of 46% compared to fiscal year 2013. The operational improvements in the segment were partially offset by one $3.6 million project, recognized in the third quarter of fiscal 2013, that made a minimal contribution to gross margin. Gross profit margin in fiscal year 2014 benefited from $2.0 million of lower costs related to the step-up of inventory balances in purchase accounting, impairment of intangible assets and restructuring charges.
Research and Development
Research and development, or R&D, expenses for fiscal year 2014 were $52.6 million, an increase of $6.4 million, compared to $46.2 million in the previous fiscal year. The increase in R&D expenses, which consist primarily of employee-related and project costs, relates to developing enhancements to our current product offerings and investing in new product development as part of our strategy to grow longer-term revenue. R&D expenses for fiscal year 2014 also increased as compared to the prior fiscal year as a result of our recently completed acquisitions.
Selling, General and Administrative
Selling, general and administrative, or SG&A, expenses were $111.1 million for fiscal year 2014, an increase of $14.6 million compared to $96.5 million in the prior fiscal year. The increase is the result of $10.4 million of higher costs for incentive compensation and stock-based compensation resulting from our improved execution against financial performance objectives. SG&A expenses in fiscal year 2014 also includes $2.6 million of expenses related to the impairment of a note receivable. Our recently completed acquisitions also contributed to the increase in SG&A in fiscal year 2014 as compared to fiscal year 2013. These increases were partially offset by lower employee-related and facility costs attributable to cost savings initiatives undertaken over the last twelve months.
We recorded the impairment charge on the note receivable in the third quarter of fiscal year 2014, after a strategic partner informed us of their intent to secure additional funding through an investment program designed to support early-stage
27
companies being funded by the Commonwealth of Massachusetts. In connection with efforts to secure additional financing, we agreed to subordinate our first-priority security interest to the new lender and to extend the due date of our loan to coincide with the due date of the new loan, which is September 2019. The partner also provided revised assumptions about their future cash flows. Based on the information provided by the partner, and the subordination, we determined it was probable that we would not recover all amounts due from the loan and recorded an impairment charge. We determined the fair value of the loan by considering the fair value of the collateral using certain valuation techniques, principally, the discounted cash flow method, and the subordination to the new lender. As a result, the fair value of the loan, which we currently estimate to be $1.0 million, could be different under different conditions or different assumptions, including the varying assumptions regarding future cash flows of the partner or discount rates.
Restructuring and Other Charges
We recorded restructuring charges of $6.3 million for fiscal year 2014. These charges relate primarily to our decision to discontinue certain product lines in the Brooks Life Science Systems and Brooks Product Solutions segments, the transition of manufacturing certain products in our line of Polycold cryochillers and compressors to a third party contract manufacturer, the consolidation of our global footprint and other programs designed to improve our cost structure.
Restructuring costs recorded in fiscal year 2014 include $5.7 million of severance costs resulting from workforce reductions of approximately 70 positions across all of our reportable segments and our corporate function. Total severance charges related to the outsourcing of the Polycold manufacturing operation, which relate to the Brooks Product Solutions and Brooks Global Services segments, were $1.2 million, of which $0.6 million was recorded in fiscal year 2014. The charge for this program was recorded ratably over the period from notification of the closing in October 2012 to the actual service end date in September 2014.
Unpaid severance charges of $3.4 million as of September 30, 2014 are expected to be paid during fiscal year 2015.
In addition to the workforce-related charges described above, we recorded $0.6 million of facility-related costs which consisted of lease payments and fixed asset write-offs associated with our efforts to reduce the space used in our operations. We also recorded $0.3 million of inventory write-offs associated primarily with discontinuing certain product lines and is included in cost of revenue in our Consolidated Statements of Operations.
We recorded restructuring charges of $6.4 million for fiscal year 2013. These charges related primarily to workforce reductions implemented to consolidate the operations of Crossing into our operations, the transition of manufacturing certain our line of Polycold cryochillers and compressors to a third party contract manufacturer and other programs designed to improve our cost structure. Restructuring charges also included facility-related costs incurred in connection with the consolidation of Crossing facilities with our facilities. Restructuring costs recorded in fiscal year 2013 consisted of $5.5 million of severance costs and $0.8 million of facility related costs. Severance costs related to a series of workforce reductions implemented to improve our cost structure by eliminating approximately 200 positions. Restructuring and other charges recorded in fiscal year 2013 also included $0.1 million related to a partial settlement of a defined benefit pension plan that covered substantially all of our Swiss employees.
Interest Income
Interest income was $1.0 million for both fiscal year 2014 and 2013.
Interest Expense
Interest expense was $0.2 million in fiscal year 2014 and relates to the capital lease we entered in March 2014.
Other Income, net
Other income, net of $0.3 million for fiscal year 2014 consists primarily of $1.4 million of other income, of which $0.6 million is attributable to joint venture management fee income, and is partially offset by $1.2 million of foreign exchange losses.
Other income, net of $1.2 million for fiscal year 2013 consists primarily of a $1.4 million gain on the sale of certain underutilized buildings in Chelmsford, MA and Oberdiessbach, Switzerland and $0.6 million of joint venture management fee income which was partially offset by foreign exchange losses of $0.9 million.
Income Tax Benefit
We recorded an income tax benefit of $2.0 million for fiscal year 2014. The tax benefit is driven by U.S. and German pre-tax losses and $1.2 million of reductions in unrecognized tax benefits resulting from the expiration of the statute of limitations in various foreign jurisdictions. These benefits are partially offset by foreign income taxes and interest related to unrecognized tax benefits.
28
The net deferred tax assets, including current and noncurrent, decreased from $115.0 million to $83.2 million during the fiscal year ended September 30, 2014. The decrease of $31.8 million was primarily driven by a tax provision of $29.9 million related to the gain on the sale of discontinued operations. The gain on sale of discontinued operations was reported net of the tax effect in the Consolidated Statements of Operations.
We recorded an income tax benefit of $5.0 million for fiscal year 2013. This benefit consists of deferred tax benefits in the U.S. generated by pre-tax losses and tax credits of $5.1 million. We recorded the benefit in the U.S. because there was no valuation allowance against the deferred tax assets generated in fiscal year 2013. This benefit is partially offset by foreign taxes on profits of our foreign subsidiaries. Additionally, we recorded $1.0 million of tax benefits for the reversal of tax reserves resulting from the expiration of statutes of limitations in certain foreign jurisdictions. The U.S. tax benefit includes $0.9 million of U.S. tax credits from fiscal year 2012 that were recognized in fiscal year 2013. These credits were reinstated under The American Taxpayer Relief Act of 2012 that was signed into law on January 2, 2013.
Equity in Earnings of Equity Method Investments
Our proportional share of income from our equity method investments was $1.2 million in fiscal year 2014 compared with $2.4 million in fiscal year 2013. The decrease is driven primarily from lower income from our 50% interest in ULVAC Cryogenics, Inc., a joint venture with ULVAC Corporation of Japan, which contributed $1.6 million of income in fiscal year 2014 as compared to $2.6 million for fiscal year 2013. The remaining decrease in income from our equity method investments is attributable to higher losses generated by our 50% interest in Yaskawa Brooks Automation, Inc., a joint venture with Yaskawa Electric Corporation of Japan and our proportional share of losses generated by BioCision LLC, a privately-held company based in Larkspur, California, in which we made an equity investment in March 2014.
Income from Discontinued Operations, Net of Tax
We determined that the Granville-Phillips business was not consistent with our strategy to expand our leadership positions in our core semiconductor and life science market segments. We entered into an agreement to sell this business unit for $87.0 million in cash that we completed in May 2014. We determined that our Granville-Phillips business unit met the criteria to be reported as a discontinued operation. As a result, our historical financial statements have been revised to present the operating results of the Granville-Phillips business as a discontinued operation.
Reported revenue for the fiscal years ended September 30, 2014 and 2013 have been reduced by $19.3 million and $28.5 million, respectively, for amounts attributable to Granville-Phillips. The pre-tax income from the discontinued operation was $61.7 million and $7.8 million for the fiscal years ended September 30, 2014 and 2013, respectively. The after-tax income from the discontinued operation was $30.0 million and $5.0 million for the fiscal years ended September 30, 2014 and 2013, respectively. The results of the discontinued operation for the fiscal year ended September 30, 2014 include the pre-tax gain of $56.8 million and the after-tax gain of $26.9 million from the sale of the Granville-Phillips business unit. Tax expense related to the gain on the sale of the business was $29.9 million, representing a tax rate of 52.7%, which is higher than the U.S. statutory rate. The goodwill that was disposed of in this transaction had no basis for tax purposes and as a result, increased the gain recognized for tax purposes. The tax charge was substantially non-cash as it was offset by our net operating losses.
Year Ended September 30, 2013 Compared to Year Ended September 30, 2012
Revenue
We reported revenue of $422.4 million for fiscal year 2013, compared to $489.0 million in the previous fiscal year, a decrease of 14%. This decrease was due to reduced demand for our products, primarily due to weakness in demand for semiconductor capital equipment which led to a reduction of $94.4 million in revenue from our Brooks Product Solutions segment and a $4.3 million reduction in revenue from our Brooks Global Services segment. These decreases were partially offset by the acquisition of Crossing which added $33.5 million of revenue to our Brooks Product Solutions segment and $8.0 million of revenue to our Brooks Global Services segment for fiscal year 2013. Our Brooks Life Science Systems segment had lower sales of $9.3 million for fiscal year 2013 as compared to the previous year due to lower demand.
Our Brooks Product Solutions segment reported revenue of $290.5 million for fiscal year 2013, a decrease of 17% from $351.4 million in the prior fiscal year. These decreases were mostly attributable to lower volumes of shipments to semiconductor capital equipment and semiconductor adjacent customers, which decreased by $94.4 million for fiscal year 2013, as compared to the prior fiscal year. This decrease was partially offset by $33.5 million of product revenue for fiscal year 2013, contributed by our acquisition of Crossing.
Our Brooks Global Services segment reported revenue of $88.6 million for fiscal year 2013, a 4% increase from $84.9 million in the prior fiscal year. Excluding the acquisition of Crossing, revenue for this segment declined $4.3 million for fiscal year 2013 as compared to the prior fiscal year period primarily due to weakness in demand.
29
Our Brooks Life Science Systems segment reported revenue of $43.3 million for fiscal year 2013, a decrease of 18% from $52.6 million in the same prior fiscal year. These decreases were the result of delays in customer decisions to purchase automated sample management systems during the first half of fiscal year 2013.
Revenue outside the United States was $244.7 million, or 58% of total revenue, and $274.9 million, or 56% of total revenue, for fiscal years 2013 and 2012, respectively.
Gross Margin
Gross margin percentage decreased to 31.3% for fiscal year 2013, compared to 32.6% for the prior fiscal year. Gross margin in fiscal year 2013 included $2.7 million of charges related to the acquisition of Crossing, related primarily to the sale of acquired inventory to which a step-up in value was applied in our purchase accounting, which reduced gross margin by 0.6 percentage points. Gross margin in fiscal year 2013 also included $2.4 million of impairment charges and inventory reserves related to the Celigo product line which reduced gross margin by 0.6 percentage points. Gross margin was also negatively impacted by lower production which resulted in reduced absorption of our fixed costs. However, the decrease in absorption was offset by lower charges for excess and obsolete inventories, warranty costs and other manufacturing costs which increased gross margin by approximately 1.1 percentage points in fiscal year 2013.
Our gross margin percentage for our Brooks Products Services segment decreased to 31.4% for fiscal year 2013 as compared to 32.4% in the prior fiscal year. The decrease was due primarily to reduced demand for our products, which resulted in reduced absorption of our fixed costs. In addition, gross margin for the Brooks Products Services segment included $1.4 million related primarily to the sale of acquired inventory to which a step-up in value was applied in our purchase accounting, which reduced gross margin by 0.4 percentage points. The decreases in gross margin were partially offset by lower charges for excess and obsolete inventories and warranty costs which increased gross margin by 0.8 percentage points in fiscal year 2013.
Our gross margin percentage for our Brooks Global Services segment increased to 30.4% for fiscal year 2013 as compared to 29.5% in the prior fiscal year. The increase was due to lower charges for excess and obsolete inventories which increased gross margin by 1.3 percentage points in fiscal year 2013 and higher absorption of fixed costs resulting from an increase in revenue. The increase was partially offset by $1.3 million of charges related to the acquisition of Crossing, related primarily to the sale of acquired inventory to which a step-up in value was applied in our purchase accounting, which reduced gross margin by 1.5 percentage points. In addition, amortization expense associated with Crossing reduced gross margin by 0.2 percentage points in fiscal year 2013.
Our gross margin percentage for our Brooks Life Science Systems segment decreased to 32.7% for fiscal year 2013 as compared to 38.8% in the prior fiscal year. The decrease was due primarily to $2.4 million of impairment charges and inventory reserves related to the Celigo product line. The charges reduced gross profit margin by 5.5 percentage points for fiscal year 2013. The remaining decrease related to lower production and as a result, reduced absorption of our fixed costs.
Research and Development
Research and development, or R&D, expenses for fiscal year 2013 were $46.2 million, an increase of $1.5 million, compared to $44.7 million in the previous fiscal year. Lower labor and material costs resulting from restructuring actions and other cost saving initiatives were more than offset by our Crossing acquisition, which increased R&D expenses by $6.8 million and was not included in the prior fiscal year.
Selling, General and Administrative
Selling, general and administrative, or SG&A, expenses were $96.5 million for fiscal year 2013, a decrease of $1.5 million compared to $98.0 million in the prior fiscal year. The decrease was the result of $5.2 million of lower consulting costs and other professional service fees which decreased primarily because a project focused on improving operating efficiencies was completed in the prior fiscal year. We also reduced labor costs by $5.0 million through restructuring actions taken during fiscal year 2013 and incurred $1.2 million less stock-based compensation expense as a result of performance-based vesting criteria that we no longer expected to achieve. Lower SG&A costs for fiscal year 2013 were partially offset by $6.9 million of SG&A expenses for Crossing, which were not included in the prior fiscal year. In addition, in the second quarter of fiscal year 2012, we received $3.3 million of insurance proceeds as reimbursement of previously incurred litigation related costs.
Restructuring and Other Charges
We recorded restructuring charges of $6.4 million for fiscal year 2013. These charges related primarily to workforce reductions implemented to consolidate the operations of Crossing into our operations, to transition manufacturing of certain products in our line of Polycold cryochillers and compressors to a third party contract manufacturer and other programs designed to improve our cost structure. Restructuring charges also included facility related costs incurred in connection with the consolidation of Crossing facilities with our facilities.
30
Restructuring costs recorded in fiscal year 2013 consisted of $5.5 million of severance costs and $0.8 million of facility related costs. Severance costs related to a series of workforce reductions implemented to improve our cost structure by eliminating approximately 200 positions.
We recorded a restructuring charge of $3.2 million for fiscal year 2012. These charges related primarily to a series of workforce reductions of 118 employees implemented to improve our cost structure.
Pension Settlement
During fiscal year 2012, we advised participants of our frozen U.S. defined benefit pension plan that we intended to settle this pension obligation. This settlement occurred in the quarter ended September 30, 2012 and resulted in accelerated cash payments of approximately $6.4 million to fully satisfy the pension liability, and resulted in an accelerated amortization of approximately $8.9 million of prior pension losses that were previously reported in accumulated other comprehensive income.
In-process Research and Development
During the three months ended March 31, 2012, we acquired assets consisting primarily of intellectual property from Intevac, Inc. for $3.0 million. Management evaluated this asset purchase to determine if this acquisition would be considered an acquisition of a business. Since only limited assets were acquired, management concluded that the inputs and processes required to meet the definition of a business were not acquired in this transaction, and therefore, this transaction was treated as the purchase of an asset group. We expensed essentially all of this asset purchase as an in-process research and development cost in fiscal 2012.
Interest Income
Interest income was $1.0 million and $1.2 million, respectively, for fiscal years 2013 and 2012. The reduction was due to lower cash balances available for investing due to the cash acquisitions of Crossing in October 2012 and Matrical in August 2013.
Other Income, net
Other income, net, of $1.2 million for fiscal year 2013 consisted primarily of a $1.4 million gain on the sale of certain underutilized buildings in Chelmsford, MA and Oberdiessbach, Switzerland and $0.6 million of joint venture management fee income which was partially offset by foreign exchange losses of $0.9 million. Other income, net of $0.7 million for fiscal year 2012 consisted primarily of $1.0 million of joint venture management fee income partially offset by foreign exchange losses of $0.4 million.
Income Tax Benefit
We recorded an income tax benefit of $5.0 million for fiscal year 2013. This benefit consists of deferred tax benefits in the U.S. generated by pre-tax losses and tax credits of $5.1 million. We recorded the benefit in the U.S. because there was no valuation allowance against the deferred tax assets generated in fiscal year 2013. Despite the current year loss in the U.S. for fiscal year 2013, we reported taxable income for federal tax purposes due to the reversal of book to taxable income differences and the inclusion of income from the discontinued operations. As a result, we did not change any estimates with regard to long-term utilization of our net operating losses and credits. This benefit was partially offset by foreign taxes on profits of our foreign subsidiaries. Additionally, we recorded $1.0 million of tax benefits for the reversal of tax reserves resulting from the expiration of statutes of limitations in certain foreign jurisdictions. The U.S. tax benefit included $0.9 million of U.S. tax credits from fiscal year 2012 that were recognized in fiscal year 2013. These credits were reinstated under The American Taxpayer Relief Act of 2012 that was signed into law on January 2, 2013.
We recorded an income tax benefit of $126.2 million for fiscal year 2012. This benefit included a $121.8 million deferred income tax benefit, primarily resulting from a significant reduction in the valuation allowance against deferred tax assets. We considered the weight of both positive and negative evidence as of September 30, 2012 and concluded that a substantial portion of the deferred tax assets would be realized. The tax benefit for fiscal year 2012 was partially offset by U.S. state income taxes and foreign taxes.
Equity in Earnings of Equity Method Investments
Income associated with our 50% interest in ULVAC Cryogenics, Inc., a joint venture with ULVAC Corporation of Japan, was $2.6 million for fiscal year 2013 as compared to $2.0 million for fiscal year 2012. Loss associated with our 50% interest in Yaskawa Brooks Automation, Inc., a joint venture with Yaskawa Electric Corporation of Japan was $(0.2) million for fiscal year 2012 as compared to a gain of $0.1 million for fiscal year 2012.
31
Liquidity and Capital Resources
A considerable portion of our revenue is dependent on the demand for semiconductor capital equipment. Demand for this equipment has historically experienced periodic downturns. We believe that we have adequate resources to fund our currently planned working capital and capital expenditure requirements for the next twelve months. The cyclical nature of our served markets and uncertainty with the current global economic environment makes it difficult for us to predict longer-term liquidity requirements with certainty. We may be unable to obtain any required additional financing on terms favorable to us, if at all. If adequate funds are not available on acceptable terms, we may be unable to successfully develop or enhance products, respond to competitive pressure or take advantage of acquisition opportunities, any of which could have a material adverse effect on our business.
Our cash, cash equivalents and marketable securities as of September 30, 2014 and 2013 consist of the following (in thousands):
September 30, | |||||||
2014 | 2013 | ||||||
Cash and cash equivalents | $ | 94,114 | $ | 82,971 | |||
Short-term marketable securities | 68,130 | 45,900 | |||||
Long-term marketable securities | 83,212 | 44,491 | |||||
$ | 245,456 | $ | 173,362 | ||||
Our marketable securities are generally readily convertible to cash without an adverse impact.
Cash and cash equivalents were $94.1 million at September 30, 2014, an increase of $11.1 million from September 30, 2013. The increase in cash was primarily due to $85.4 million of net proceeds received from the sale of divested businesses and $53.8 million of cash flow from operations. These sources of cash were partially offset by $62.2 million of net purchases of marketable securities, $35.6 million used in acquisitions and $22.9 million of cash dividends paid to our shareholders. Our cash and cash equivalents of $83.0 million at September 30, 2013 increased $28.3 million compared with cash and cash equivalents at September 30, 2012. In fiscal year 2013, the increase in cash and cash equivalents was due primarily to $54.4 million of cash flow from operations, $53.3 million of net sales of marketable securities and $14.1 million of proceeds from the sale of real estate offset, in part, by $68.3 million used for acquisitions and $21.3 million of cash dividends paid to our shareholders.
Cash provided by operating activities was $53.8 million for fiscal year 2014 compared with $54.4 million for fiscal year 2013. In fiscal year 2014, cash provided by operating activities was composed primarily of $31.5 million of net income adjusted by $8.2 million for non-cash related charges and $14.1 million of net working capital improvements. Non-cash related charges in fiscal year 2014 consisted of $23.5 million of depreciation and amortization and $10.9 million of stock-based compensation offset by $27.4 million related to gains from the sale of divested businesses. The decrease in working capital is primarily due to a $12.1 million decrease in accounts receivable and a $9.6 million decrease in inventory. In fiscal year 2013, cash provided by operating activities was composed primarily of a $2.2 million net loss adjusted by $28.4 million for non-cash related charges and a $28.1 million decrease in net working capital. Non-cash related charges in fiscal year 2013 consisted of $24.2 million of depreciation and amortization and $7.8 million of stock-based compensation. The decrease in working capital was primarily due to a $15.5 million decrease in inventory and $9.0 million increase in deferred revenue. The change in assets and liabilities due to acquisitions and divestitures is treated as an investing activity, not as an operating activity.
Cash used in investing activities was $17.8 million for fiscal year 2014, and included $62.2 million of net purchases of marketable securities, $35.6 million used for the acquisition of DMS and our investment in BioCision, LLC and $5.5 million of capital expenditures offset, in part, by $85.4 million of net proceeds from the sale of divested businesses. In fiscal year 2013, we used $7.1 million of cash in investing activities, which consisted of $68.3 million used for acquisitions and $3.6 million of capital expenditures offset, in part, by $53.3 million of net sales of marketable securities and $14.1 million of net proceeds from the sale of certain real estate in the United States and Switzerland.
Cash used in financing activities was $24.5 million for fiscal year 2014 compared with $19.5 million for fiscal year 2013. In fiscal year 2014, we used $22.9 million for the quarterly cash dividends we paid to our shareholders and an additional $3.2 million to acquire the outstanding interest of our majority-owned subsidiary in Korea. Cash used in financing activities for fiscal year 2013 consisted of $21.3 million for quarterly cash dividends partially offset by $1.8 million of cash generated from employee contributions to our employee stock purchase plans.
We had approximately $21.1 million of letters of credit outstanding related primarily to customer advances and other performance obligations at September 30, 2014. These arrangements guarantee the refund of advance payments received from customers in the event that the product is not delivered or warranty obligations are not fulfilled in compliance with the terms of the contract. While we do not anticipate that these obligations will be called, they could be called by the beneficiaries at any time before the expiration date of the particular letter of credit should we fail to meet certain contractual requirements.
32
Our contractual obligations consist of the following at September 30, 2014 (in thousands):
Total | Less than One Year | One to Three Years | Four to Five Years | Thereafter | |||||||||||||||
Operating leases | $ | 12,472 | $ | 5,140 | $ | 5,132 | $ | 2,107 | $ | 93 | |||||||||
Capital lease | 9,544 | 881 | 8,663 | — | — | ||||||||||||||
Pension funding | 2,082 | 309 | 619 | 311 | 843 | ||||||||||||||
Purchase commitments and other | 72,353 | 68,385 | 3,829 | 139 | — | ||||||||||||||
Total contractual obligations | $ | 96,451 | $ | 74,715 | $ | 18,243 | $ | 2,557 | $ | 936 | |||||||||
In March 2014, we exercised an option to renew the lease of a building and the related land on our Chelmsford, Massachusetts campus. We have leased this building since 2002. By exercising this option, we also contracted to purchase the building at the end of the lease period. The assets acquired under the capital lease were recorded at the net present value of the minimum lease payments. The cost of the building and the land under the capital lease were included in the Consolidated Balance Sheets as property, plant and equipment at $6.4 million and $2.1 million, respectively, and the building is being depreciated over its estimated useful life.
As of September 30, 2014, the total amount of net unrecognized tax benefits for uncertain tax positions and the accrual for the related interest was $5.8 million, all of which represents a potential future cash outlay. We are unable to make a reasonably reliable estimate of the timing of the cash settlement for this liability since the timing of future tax examinations by various tax jurisdictions and the related resolution is uncertain.
We are a guarantor on a lease in Mexico that expires in January 2018. The remaining payments under this lease at September 30, 2014 are approximately $1.4 million.
On June 25, 2013, we filed a shelf registration statement on Form S-3 with the SEC to sell up to $200 million of securities, before any fees or expenses of the offering. Securities that may be sold include common stock, preferred stock, warrants, debt securities, depository shares, purchase contracts and purchase units. Any such offering, if it does occur, may happen in one or more transactions. Specific terms of any securities to be sold will be described in supplemental filings with the SEC. This registration statement will expire on July 1, 2016.
Our Board of Directors declared the following dividends during the fiscal years ended September 30, 2014 and 2013 (in thousands, except per share data):
Declaration Date | Dividend per Share | Record Date | Payment Date | Total | ||||||||
Fiscal year Ended September 30, 2014 | ||||||||||||
November 12, 2013 | $ | 0.08 | December 6, 2013 | December 27, 2013 | $ | 5,391 | ||||||
February 5, 2014 | 0.08 | March 7, 2014 | March 28, 2014 | 5,408 | ||||||||
May 7, 2014 | 0.08 | June 6, 2014 | June 27, 2014 | 5,344 | ||||||||
July 30, 2014 | 0.10 | September 5, 2014 | September 26, 2014 | 6,732 | ||||||||
Fiscal year Ended September 30, 2013 | ||||||||||||
November 7, 2012 | $ | 0.08 | December 7, 2012 | December 28, 2012 | $ | 5,311 | ||||||
January 30, 2013 | 0.08 | March 8, 2013 | March 29, 2013 | 5,361 | ||||||||
May 8, 2013 | 0.08 | June 7, 2013 | June 28, 2013 | 5,316 | ||||||||
August 7, 2013 | 0.08 | September 6, 2013 | September 27, 2013 | 5,340 | ||||||||
On November 5, 2014, our Board of Directors approved a cash dividend of $0.10 per share of our common stock. The total dividend of approximately $6.7 million will be paid on December 26, 2014 to shareholders of record at the close of business on December 5, 2014. Dividends are declared at the discretion of our Board of Directors and depend on actual cash from operations, our financial condition and capital requirements and any other factors our Board of Directors may consider relevant. We intend to pay quarterly cash dividends in the future; however, the amount and timing of these dividends may be impacted by the cyclical nature of certain markets that we serve. We may reduce, delay or cancel a quarterly cash dividend based on the severity of a cyclical downturn.
Recent Accounting Pronouncements
In July 2013, the Financial Accounting Standards Board, or FASB, issued an amendment to the accounting guidance for presentation of unrecognized tax benefits. The prior guidance related to unrecognized tax benefits did not explicitly address financial statement presentation of unrecognized tax benefits when a net operating loss carryforward, a similar tax loss or a tax credit carryforward exists. The amended guidance eliminates the existing diversity in practice in the presentation of
33
unrecognized tax benefits in these instances. Under the amended guidance, an unrecognized tax benefit, or a portion of an unrecognized tax benefit, will be presented in the financial statements as a reduction of a deferred tax asset when an operating loss carryforward, a similar tax loss or a tax credit carryforward exists, with limited exceptions. This amended guidance is effective for fiscal years beginning on or after December 15, 2013. The adoption of this guidance will not have a material impact on our financial position or results of operations.
In April 2014, the FASB issued an amendment to the accounting guidance for reporting discontinued operations. The amended guidance raises the threshold for disposals to qualify as a discontinued operation by requiring a component of an entity that is held for sale, or has been disposed of by sale, to represent a strategic shift that has or will have a major effect on operations and financial results. Under the amended guidance, a strategic shift could include the disposal of a major line of business, a major geographical area, a major equity method investment or other major parts of an entity. In addition, the new guidance allows companies to have significant continuing involvement and continuing cash flows with the discontinued operation. The amended guidance is effective for fiscal years beginning on or after December 15, 2014. Early adoption is permitted but not required for disposals, or classifications as held for sale, that have not been previously reported in financial statements. We have elected not to adopt this amended guidance in regard to the Granville-Phillips discontinued operation.
In May 2014, the FASB issued new accounting guidance for reporting revenue recognition. The guidance recognizes revenue when promised goods or services are transferred to customers in an amount that reflects the consideration that is expected to be received for those goods or services. The five step process may make it possible that more judgment and estimation will be required within the revenue recognition process than required under existing generally accepted accounting principles in the United States, including identifying performance obligations in the contract, estimating the amount of variable consideration to include in the transaction price and allocating the transaction price to each separate performance obligation. This guidance is effective for fiscal years beginning after December 15, 2016. Early adoption is not permitted. We are evaluating the impact that the adoption of this guidance will have on our financial position and results of operations.
Item 7A. | Quantitative and Qualitative Disclosures About Market Risk |
We are exposed to a variety of market risks, including changes in interest rates affecting the return on our cash and cash equivalents, short-term and long-term investments and fluctuations in foreign currency exchange rates.
Interest Rate Exposure
Our cash and cash equivalents consist principally of money market securities which are short-term in nature. Our short-term and long-term investments consist mostly of highly rated corporate debt securities, U.S. Treasury securities, and obligations of U.S. Government Agencies and other municipalities. At September 30, 2014, the unrealized loss position on marketable securities was $38,000, which is included in “Accumulated other comprehensive income” in the Consolidated Balance Sheets. A hypothetical 100 basis point change in interest rates would result in an annual change of approximately $2.1 million in interest income earned.
Currency Rate Exposure
We have transactions and balances denominated in currencies other than the U.S. dollar. Most of these transactions or balances are denominated in Euros, British Pounds and a variety of Asian currencies. Sales in currencies other than the U.S. dollar were 30% of our total sales for the fiscal year ended September 30, 2014. These foreign sales were made primarily by our foreign subsidiaries, which have cost structures that substantially align with the currency of sale.
In the normal course of our business, we have short-term advances between our legal entities that are subject to foreign currency exposure. These short-term advances were approximately $18.7 million at September 30, 2014, and relate to the Euro, British Pound and a variety of Asian currencies. We mitigate the impact of potential currency translation losses on these short-term intercompany advances by the timely settlement of each transaction, generally within 30 days. We also utilize forward contracts to mitigate our exposures to currency movement. We incurred a foreign currency loss of $1.2 million for the fiscal year ended September 30, 2014, which relates to the currency fluctuation on these advances between the time the transaction occurs and the ultimate settlement of the transaction. A hypothetical 10% change in foreign exchange rates at September 30, 2014 would result in a $0.5 million change in our net income.
34
Item 8. | Financial Statements and Supplementary Data |
35
REPORT OF INDEPENDENT REGISTERED PUBLIC ACCOUNTING FIRM
Board of Directors and Stockholders
Brooks Automation, Inc.
Chelmsford, Massachusetts
We have audited the accompanying consolidated balance sheets of Brooks Automation, Inc. as of September 30, 2014 and 2013 and the related consolidated statements of operations, comprehensive income (loss), changes in equity, and cash flows for the years then ended. These financial statements are the responsibility of the Company’s management. Our responsibility is to express an opinion on these financial statements based on our audits.
We conducted our audits in accordance with the standards of the Public Company Accounting Oversight Board (United States). Those standards require that we plan and perform the audit to obtain reasonable assurance about whether the financial statements are free of material misstatement. An audit also includes examining, on a test basis, evidence supporting the amounts and disclosures in the financial statements, assessing the accounting principles used and significant estimates made by management, as well as evaluating the overall presentation of the financial statements. We believe that our audits provide a reasonable basis for our opinion.
In our opinion, the consolidated financial statements referred to above present fairly, in all material respects, the financial position of Brooks Automation, Inc. at September 30, 2014 and 2013 and the results of its operations and its cash flows for the years then ended, in conformity with accounting principles generally accepted in the United States of America.
We also have audited, in accordance with the standards of the Public Company Accounting Oversight Board (United States), Brooks Automation, Inc.’s internal control over financial reporting as of September 30, 2014, based on criteria established in Internal Control - Integrated Framework (1992) issued by the Committee of Sponsoring Organizations of the Treadway Commission (COSO) and our report dated November 13, 2014 expressed an unqualified opinion thereon.
/s/ BDO USA, LLP
Boston, Massachusetts
November 13, 2014
36
REPORT OF INDEPENDENT REGISTERED PUBLIC ACCOUNTING FIRM
To the Board of Directors and Stockholders of Brooks Automation, Inc.:
In our opinion, the consolidated statements of operations, comprehensive income (loss), changes in equity and cash flows for the year ended September 30, 2012 present fairly, in all material respects, the results of their operations and cash flows of Brooks Automation, Inc. and its subsidiaries for the year ended September 30, 2012, in conformity with accounting principles generally accepted in the United States of America. These financial statements are the responsibility of the Company's management. Our responsibility is to express an opinion on these financial statements based on our audit. We conducted our audit of these statements in accordance with the standards of the Public Company Accounting Oversight Board (United States). Those standards require that we plan and perform the audit to obtain reasonable assurance about whether the financial statements are free of material misstatement. An audit includes examining, on a test basis, evidence supporting the amounts and disclosures in the financial statements, assessing the accounting principles used and significant estimates made by management, and evaluating the overall financial statement presentation. We believe that our audit provides a reasonable basis for our opinion.
/s/ PricewaterhouseCoopers LLP
PricewaterhouseCoopers LLP
Boston, Massachusetts
November 21, 2012, except for the effects of discontinued operations discussed in Note 3 as to which the date is November 13, 2014
37
BROOKS AUTOMATION, INC.
CONSOLIDATED BALANCE SHEETS
September 30, 2014 | September 30, 2013 | ||||||
(In thousands, except share and per share data) | |||||||
Assets | |||||||
Current assets | |||||||
Cash and cash equivalents | $ | 94,114 | $ | 82,971 | |||
Restricted cash | — | 177 | |||||
Marketable securities | 68,130 | 45,900 | |||||
Accounts receivable, net | 80,106 | 77,483 | |||||
Inventories | 93,567 | 94,411 | |||||
Deferred tax assets | 19,009 | 16,839 | |||||
Assets held for sale | — | 27,778 | |||||
Prepaid expenses and other current assets | 19,387 | 9,030 | |||||
Total current assets | 374,313 | 354,589 | |||||
Property, plant and equipment, net | 50,183 | 47,506 | |||||
Long-term marketable securities | 83,212 | 44,491 | |||||
Long-term deferred tax assets | 67,563 | 99,146 | |||||
Goodwill | 109,501 | 97,924 | |||||
Intangible assets, net | 59,550 | 60,088 | |||||
Equity method investments | 28,944 | 25,687 | |||||
Other assets | 4,772 | 7,332 | |||||
Total assets | $ | 778,038 | $ | 736,763 | |||
Liabilities and equity | |||||||
Current liabilities | |||||||
Accounts payable | $ | 33,740 | $ | 35,392 | |||
Capital lease obligation | 881 | — | |||||
Deferred revenue | 26,279 | 19,610 | |||||
Accrued warranty and retrofit costs | 6,499 | 7,260 | |||||
Accrued compensation and benefits | 21,663 | 14,225 | |||||
Accrued restructuring costs | 3,475 | 1,412 | |||||
Accrued income taxes payable | 1,808 | 1,058 | |||||
Deferred tax liabilities | 808 | 19 | |||||
Liabilities held for sale | — | 132 | |||||
Accrued expenses and other current liabilities | 18,688 | 13,453 | |||||
Total current liabilities | 113,841 | 92,561 | |||||
Long-term capital lease obligation | 7,417 | — | |||||
Long-term tax reserves | 5,708 | 6,115 | |||||
Long-term deferred tax liabilities | 2,567 | 921 | |||||
Long-term pension liability | 1,774 | 815 | |||||
Other long-term liabilities | 3,842 | 3,695 | |||||
Total liabilities | 135,149 | 104,107 | |||||
Commitments and contingencies (Note 22) | |||||||
Equity | |||||||
Preferred stock, $0.01 par value, 1,000,000 shares authorized, no shares issued or outstanding | — | — | |||||
Common stock, $0.01 par value, 125,000,000 shares authorized, 80,375,777 shares issued and 66,913,908 shares outstanding at September 30, 2014, 80,039,104 shares issued and 66,577,235 shares outstanding at September 30, 2013 | 804 | 800 | |||||
Additional paid-in capital | 1,834,619 | 1,825,499 | |||||
Accumulated other comprehensive income | 15,687 | 22,604 | |||||
Treasury stock at cost, 13,461,869 shares | (200,956 | ) | (200,956 | ) | |||
Accumulated deficit | (1,007,265 | ) | (1,015,991 | ) | |||
Total Brooks Automation, Inc. stockholders’ equity | 642,889 | 631,956 | |||||
Noncontrolling interest in subsidiaries | — | 700 | |||||
Total equity | 642,889 | 632,656 | |||||
Total liabilities and equity | $ | 778,038 | $ | 736,763 | |||
The accompanying notes are an integral part of these consolidated financial statements.
38
BROOKS AUTOMATION, INC.
CONSOLIDATED STATEMENTS OF OPERATIONS
Year ended September 30, | |||||||||||
2014 | 2013 | 2012 | |||||||||
(In thousands, except per share data) | |||||||||||
Revenue | |||||||||||
Product | $ | 387,032 | $ | 335,011 | $ | 402,505 | |||||
Services | 95,816 | 87,429 | 86,478 | ||||||||
Total revenue | 482,848 | 422,440 | 488,983 | ||||||||
Cost of revenue | |||||||||||
Product | 252,688 | 229,411 | 267,448 | ||||||||
Services | 62,823 | 60,722 | 62,082 | ||||||||
Total cost of revenue | 315,511 | 290,133 | 329,530 | ||||||||
Gross profit | 167,337 | 132,307 | 159,453 | ||||||||
Operating expenses | |||||||||||
Research and development | 52,649 | 46,209 | 44,717 | ||||||||
Selling, general and administrative | 111,098 | 96,516 | 97,978 | ||||||||
Restructuring and other charges | 6,289 | 6,380 | 3,153 | ||||||||
Pension settlement | — | — | 8,937 | ||||||||
In-process research and development | — | — | 3,026 | ||||||||
Total operating expenses | 170,036 | 149,105 | 157,811 | ||||||||
Operating income (loss) | (2,699 | ) | (16,798 | ) | 1,642 | ||||||
Interest income | 950 | 1,032 | 1,213 | ||||||||
Interest expense | (202 | ) | (2 | ) | (14 | ) | |||||
Other income, net | 256 | 1,227 | 660 | ||||||||
Income (loss) before income taxes and equity in earnings of equity method investments | (1,695 | ) | (14,541 | ) | 3,501 | ||||||
Income tax benefit | (1,980 | ) | (4,985 | ) | (126,201 | ) | |||||
Income (loss) before equity in earnings of equity method investments | 285 | (9,556 | ) | 129,702 | |||||||
Equity in earnings of equity method investments | 1,235 | 2,442 | 2,133 | ||||||||
Income (loss) from continuing operations | 1,520 | (7,114 | ) | 131,835 | |||||||
Income from discontinued operations, net of tax | 30,002 | 4,964 | 5,000 | ||||||||
Net income (loss) | 31,522 | (2,150 | ) | 136,835 | |||||||
Net income attributable to noncontrolling interests | (161 | ) | (65 | ) | (46 | ) | |||||
Net income (loss) attributable to Brooks Automation, Inc. | $ | 31,361 | $ | (2,215 | ) | $ | 136,789 | ||||
Basic net income (loss) per share attributable to Brooks Automation, Inc. common stockholders: | |||||||||||
Income (loss) from continuing operations | $ | 0.02 | $ | (0.11 | ) | $ | 2.02 | ||||
Income from discontinued operations, net of tax | 0.45 | 0.08 | 0.08 | ||||||||
Basic net income (loss) per share attributable to Brooks Automation, Inc. | $ | 0.47 | $ | (0.03 | ) | $ | 2.10 | ||||
Diluted net income (loss) per share attributable to Brooks Automation, Inc. common stockholders: | |||||||||||
Income (loss) from continuing operations | $ | 0.02 | $ | (0.11 | ) | $ | 2.01 | ||||
Income from discontinued operations, net of tax | 0.44 | 0.08 | 0.08 | ||||||||
Diluted net income (loss) per share attributable to Brooks Automation, Inc. common stockholders | $ | 0.46 | $ | (0.03 | ) | $ | 2.08 | ||||
Dividend declared per share | $ | 0.34 | $ | 0.32 | $ | 0.32 | |||||
Weighted-average shares used in computing earnings (loss) per share: | |||||||||||
Basic | 66,648 | 65,912 | 65,128 | ||||||||
Diluted | 67,644 | 65,912 | 65,722 | ||||||||
The accompanying notes are an integral part of these consolidated financial statements.
39
BROOKS AUTOMATION, INC.
CONSOLIDATED STATEMENTS OF COMPREHENSIVE INCOME (LOSS)
Year ended September 30, | |||||||||||
2014 | 2013 | 2012 | |||||||||
(In thousands) | |||||||||||
Net income (loss) | $ | 31,522 | $ | (2,150 | ) | $ | 136,835 | ||||
Comprehensive income (loss), net of tax: | |||||||||||
Change in cumulative translation adjustment | (6,296 | ) | (2,113 | ) | (2,406 | ) | |||||
Change in unrealized gain (loss) on marketable securities | (104 | ) | (135 | ) | 393 | ||||||
Change in fair value on cash flow hedges | (14 | ) | 14 | — | |||||||
Actuarial gain (loss) | (503 | ) | 1,109 | (606 | ) | ||||||
Pension settlement | — | 87 | 8,937 | ||||||||
Comprehensive income (loss), net of tax | 24,605 | (3,188 | ) | 143,153 | |||||||
Comprehensive income attributable to noncontrolling interests | (161 | ) | (65 | ) | (46 | ) | |||||
Comprehensive income (loss) attributable to Brooks Automation, Inc., net of tax | $ | 24,444 | $ | (3,253 | ) | $ | 143,107 | ||||
The accompanying notes are an integral part of these consolidated financial statements.
40
BROOKS AUTOMATION, INC.
CONSOLIDATED STATEMENTS OF CASH FLOWS
Year ended September 30, | |||||||||||
2014 | 2013 | 2012 | |||||||||
(In thousands) | |||||||||||
Cash flows from operating activities | |||||||||||
Net income (loss) | $ | 31,522 | $ | (2,150 | ) | $ | 136,835 | ||||
Adjustments to reconcile net income (loss) to net cash provided by operating activities: | |||||||||||
Depreciation and amortization | 23,459 | 24,155 | 21,620 | ||||||||
Impairment of intangible assets | 398 | 1,960 | — | ||||||||
Impairment of other assets | 2,621 | — | — | ||||||||
Stock-based compensation | 10,912 | 7,757 | 8,647 | ||||||||
Amortization of premium on marketable securities | 1,255 | 1,274 | 2,401 | ||||||||
Undistributed earnings of equity method investments | (1,235 | ) | (2,442 | ) | (2,133 | ) | |||||
Deferred income tax benefit | (1,779 | ) | (2,936 | ) | (122,136 | ) | |||||
Pension settlement | — | 87 | 8,937 | ||||||||
Gain on disposal of businesses | (27,444 | ) | — | — | |||||||
Loss (gain) on disposal of long-lived assets | 13 | (1,394 | ) | (63 | ) | ||||||
Changes in operating assets and liabilities, net of acquisitions and disposals: | |||||||||||
Accounts receivable | 12,098 | 6,422 | (784 | ) | |||||||
Inventories | 9,598 | 15,490 | 5,874 | ||||||||
Prepaid expenses and other current assets | (12,325 | ) | 4,359 | 5,801 | |||||||
Accounts payable | (11,924 | ) | 3,123 | (11,182 | ) | ||||||
Deferred revenue | 5,900 | 8,971 | (4,684 | ) | |||||||
Accrued warranty and retrofit costs | (1,102 | ) | (1,806 | ) | (123 | ) | |||||
Accrued compensation and benefits | 6,783 | (2,625 | ) | (4,878 | ) | ||||||
Accrued restructuring costs | 2,161 | (972 | ) | 1,930 | |||||||
Accrued pension | 997 | (950 | ) | (5,772 | ) | ||||||
Accrued expenses and other current liabilities | 1,873 | (3,934 | ) | (4,252 | ) | ||||||
Net cash provided by operating activities | 53,781 | 54,389 | 36,038 | ||||||||
Cash flows from investing activities | |||||||||||
Purchases of property, plant and equipment | (5,518 | ) | (3,635 | ) | (8,653 | ) | |||||
Purchases of marketable securities | (174,287 | ) | (91,740 | ) | (132,015 | ) | |||||
Sale/maturity of marketable securities | 112,085 | 145,023 | 131,317 | ||||||||
Proceeds from divestitures | 85,369 | — | — | ||||||||
Acquisitions, net of cash acquired | (35,625 | ) | (68,331 | ) | (9,216 | ) | |||||
Decrease in restricted cash | 177 | 586 | 530 | ||||||||
Other investment | — | — | (3,000 | ) | |||||||
Proceeds from the sale of property, plant and equipment | — | 14,082 | — | ||||||||
Payment of deferred leasing cost | — | (3,134 | ) | — | |||||||
Net cash used in investing activities | (17,799 | ) | (7,149 | ) | (21,037 | ) | |||||
Cash flows from financing activities | |||||||||||
Proceeds from issuance of common stock, net of issuance costs | 1,838 | 1,851 | 1,705 | ||||||||
Repayment of capital lease obligations | (239 | ) | — | — | |||||||
Acquisition of noncontrolling interest | (3,189 | ) | — | — | |||||||
Common stock dividend paid | (22,875 | ) | (21,328 | ) | (20,953 | ) | |||||
Net cash used in financing activities | (24,465 | ) | (19,477 | ) | (19,248 | ) | |||||
Effects of exchange rate changes on cash and cash equivalents | (374 | ) | 569 | 53 | |||||||
Net increase (decrease) in cash and cash equivalents | 11,143 | 28,332 | (4,194 | ) | |||||||
Cash and cash equivalents, beginning of year | 82,971 | 54,639 | 58,833 | ||||||||
Cash and cash equivalents, end of year | $ | 94,114 | $ | 82,971 | $ | 54,639 | |||||
Supplemental disclosures: | |||||||||||
Cash paid during the year for interest | $ | 202 | $ | 2 | $ | 14 | |||||
Cash paid (refunded) during the year for income taxes, net | $ | 1,084 | $ | (762 | ) | $ | 4,282 | ||||
Supplemental disclosure of non-cash investing and financing activities: | |||||||||||
Acquisition of buildings and land through capital lease | $ | 8,537 | $ | — | $ | — | |||||
The accompanying notes are an integral part of these consolidated financial statements.
41
BROOKS AUTOMATION, INC.
CONSOLIDATED STATEMENTS OF CHANGES IN EQUITY
Common Stock Shares | Common Stock at Par Value | Additional Paid-In Capital | Accumulated Other Comprehensive Income | Accumulated Deficit | Treasury Stock | Total Brooks Automation, Inc. Stockholders’ Equity | Noncontrolling Interests in Subsidiaries | Total Equity | ||||||||||||||||||||||||||
(In thousands, except share data) | ||||||||||||||||||||||||||||||||||
Balance September 30, 2011 | 79,737,189 | $ | 797 | $ | 1,809,287 | $ | 17,324 | $ | (1,108,105 | ) | $ | (200,956 | ) | $ | 518,347 | $ | 589 | $ | 518,936 | |||||||||||||||
Shares issued under stock option, restricted stock and purchase plans, net | 53,368 | 1 | (228 | ) | (227 | ) | (227 | ) | ||||||||||||||||||||||||||
Stock-based compensation | 8,647 | 8,647 | 8,647 | |||||||||||||||||||||||||||||||
Common stock dividend declared | (21,208 | ) | (21,208 | ) | (21,208 | ) | ||||||||||||||||||||||||||||
Net income | 136,789 | 136,789 | 46 | 136,835 | ||||||||||||||||||||||||||||||
Currency translation adjustments | (2,406 | ) | (2,406 | ) | (2,406 | ) | ||||||||||||||||||||||||||||
Changes in unrealized gain on marketable securities | 393 | 393 | 393 | |||||||||||||||||||||||||||||||
Actuarial loss arising in the year | (606 | ) | (606 | ) | (606 | ) | ||||||||||||||||||||||||||||
Recognition of pension settlement in earnings | 8,937 | 8,937 | 8,937 | |||||||||||||||||||||||||||||||
Balance September 30, 2012 | 79,790,557 | 798 | 1,817,706 | 23,642 | (992,524 | ) | (200,956 | ) | 648,666 | 635 | 649,301 | |||||||||||||||||||||||
Shares issued under stock option, restricted stock and purchase plans, net | 248,547 | 2 | 186 | 188 | 188 | |||||||||||||||||||||||||||||
Stock-based compensation | 7,607 | 7,607 | 7,607 | |||||||||||||||||||||||||||||||
Common stock dividend declared | (21,252 | ) | (21,252 | ) | (21,252 | ) | ||||||||||||||||||||||||||||
Net loss | (2,215 | ) | (2,215 | ) | 65 | (2,150 | ) | |||||||||||||||||||||||||||
Currency translation adjustments | (2,113 | ) | (2,113 | ) | (2,113 | ) | ||||||||||||||||||||||||||||
Changes in unrealized loss on marketable securities, net of tax of $79 | (135 | ) | (135 | ) | (135 | ) | ||||||||||||||||||||||||||||
Changes in unrealized gain on cash flow hedges, net of tax of $9 | 14 | 14 | 14 | |||||||||||||||||||||||||||||||
Actuarial gain arising in the year, net of tax of $360 | 1,109 | 1,109 | 1,109 | |||||||||||||||||||||||||||||||
Recognition of pension settlement in earnings | 87 | 87 | 87 | |||||||||||||||||||||||||||||||
Balance September 30, 2013 | 80,039,104 | 800 | 1,825,499 | 22,604 | (1,015,991 | ) | (200,956 | ) | 631,956 | 700 | 632,656 | |||||||||||||||||||||||
Shares issued under restricted stock and purchase plans, net | 336,673 | 4 | 386 | 390 | 390 | |||||||||||||||||||||||||||||
Stock-based compensation | 11,062 | 11,062 | 11,062 | |||||||||||||||||||||||||||||||
Common stock dividend declared | (22,635 | ) | (22,635 | ) | (22,635 | ) | ||||||||||||||||||||||||||||
Acquisition of noncontrolling interest | (2,328 | ) | (2,328 | ) | (861 | ) | (3,189 | ) | ||||||||||||||||||||||||||
Net income | 31,361 | 31,361 | 161 | 31,522 | ||||||||||||||||||||||||||||||
Currency translation adjustments | (6,296 | ) | (6,296 | ) | (6,296 | ) | ||||||||||||||||||||||||||||
Changes in unrealized loss on marketable securities, net of tax of $62 | (104 | ) | (104 | ) | (104 | ) | ||||||||||||||||||||||||||||
Changes in unrealized loss on cash flow hedges, net of tax of $9 | (14 | ) | (14 | ) | (14 | ) | ||||||||||||||||||||||||||||
Actuarial loss arising in the year, net of tax of $471 | (503 | ) | (503 | ) | (503 | ) | ||||||||||||||||||||||||||||
Balance September 30, 2014 | 80,375,777 | $ | 804 | $ | 1,834,619 | $ | 15,687 | $ | (1,007,265 | ) | $ | (200,956 | ) | $ | 642,889 | $ | — | $ | 642,889 | |||||||||||||||
The accompanying notes are an integral part of these consolidated financial statements.
42
BROOKS AUTOMATION, INC.
NOTES TO CONSOLIDATED FINANCIAL STATEMENTS
1. Nature of the Business
Brooks Automation, Inc. (“Brooks” or the “Company”) is a leading worldwide provider of automation and cryogenic solutions for multiple markets including semiconductor manufacturing and life sciences. The Company's technologies, engineering competencies and global service capabilities provide customers speed to market and ensure high uptime and rapid response, which equate to superior value in their mission-critical controlled environments. Since 1978, the Company has been a leading partner to the global semiconductor manufacturing markets and through product development initiatives and strategic business acquisitions, Brooks has expanded its products and services to meet the needs of customers in the life science markets and in technology markets adjacent to semiconductor.
In the second quarter of fiscal year 2014, the Company determined that its Granville-Phillips Gas Analysis & Vacuum Measurement ("Granville-Phillips") business met the criteria to be reported as a discontinued operation. As a result, the Company’s historical financial statements have been revised to present the operating results of the Granville-Phillips business as a discontinued operation. The results of operations from the Granville-Phillips business are presented as “Income from discontinued operations, net of tax” in the Consolidated Statements of Operations. Assets and liabilities identifiable within the Granville-Phillips business are reported as "Assets held for sale" and "Liabilities held for sale," respectively, in the Consolidated Balance Sheets. The Company has not separated cash flows of the Granville-Phillips business from those of its continuing operations and has not revised its historical statements of cash flows. The discussion in the notes to these consolidated financial statements, unless otherwise noted, relate solely to the Company's continuing operations.
2. Summary of Significant Accounting Policies
Principles of Consolidation and Basis of Presentation
The consolidated financial statements include the accounts of the Company and all majority-owned subsidiaries. All intercompany accounts and transactions are eliminated. Equity investments in which the Company exercises significant influence but does not control and is not the primary beneficiary are accounted for using the equity method of accounting.
Use of Estimates
The preparation of financial statements in conformity with generally accepted accounting principles in the United States ("GAAP") requires management to make estimates and assumptions that affect the reported amounts of assets and liabilities and disclosure of contingent assets and liabilities at the date of the financial statements and the reported amounts of revenue and expenses during the reporting period. Significant estimates are associated with accounts receivable, inventories, intangible assets other than goodwill, goodwill, long-lived assets, derivative financial instruments, deferred income taxes, warranty obligations, revenue recognized using the percentage of completion method, pension obligations and stock-based compensation expense. Although the Company regularly assesses these estimates, actual results could differ from those estimates. Changes in estimates are recorded in the period in which they become known.
Foreign Currency Translation
Some transactions of the Company and its subsidiaries are made in currencies different from their functional currency. Foreign currency gains (losses) on these transactions or balances are recorded in “Other income, net” when incurred. Net foreign currency transaction losses totaled $1.2 million, $0.9 million and $0.4 million for the fiscal years ended September 30, 2014, 2013 and 2012, respectively. For non-U.S. subsidiaries, assets and liabilities are translated at period-end exchange rates, and statements of operations items are translated at the average exchange rates for the period. The local currency is considered to be the functional currency for all of the Company's foreign subsidiaries and, accordingly, translation adjustments are reported in “Accumulated other comprehensive income.” Foreign currency translation adjustments are one of the components of comprehensive income (loss).
Derivative Financial Instruments
All derivatives, whether designated in a hedging relationship or not, are recorded on the Consolidated Balance Sheets at fair value. The accounting for changes in fair value of a derivative instrument depends on whether it has been designated and qualifies as part of a hedging relationship and further, on the type of hedging relationship. For those derivative instruments that are designated and qualify as hedging instruments, the Company must designate the hedging instrument, based on the exposure being hedged, as a fair value hedge, cash flow hedge or a hedge of a net investment in a foreign operation. Certain derivatives held by the Company are not designated as hedges but are used in managing exposure to changes in foreign exchange rates.
43
NOTES TO CONSOLIDATED FINANCIAL STATEMENTS - (Continued)
A fair value hedge is a derivative instrument designated for the purpose of hedging the exposure of changes in fair value of an asset or a liability resulting from a particular risk. If the derivative is designated as a fair value hedge, the changes in the fair value of the derivative and of the hedged item attributable to the hedged risk are both recognized in the same caption in the Consolidated Statements of Operations and Consolidated Statements of Comprehensive Income (Loss).
A cash flow hedge is a derivative instrument designated for the purpose of hedging the exposure to variability in future cash flows resulting from a particular risk. If the derivative is designated as a cash flow hedge, the effective portions of changes in the fair value of the derivative are recorded in accumulated other comprehensive income and are recognized in the results of operations when the hedged item affects earnings. Ineffective portions of changes in the fair value of cash flow hedges are recognized in the results of operations.
A hedge of a net investment in a foreign operation is achieved through a derivative instrument designated for the purpose of hedging the exposure of changes in value of investments in foreign subsidiaries. If the derivative is designated as a hedge of a net investment in a foreign operation, the effective portions of changes in the fair value of the derivative are recorded in other comprehensive income as a part of the currency translation adjustment. Ineffective portions of net investment hedges are recognized in the results of operations.
For derivative instruments not designated as hedging instruments, changes in fair value are recognized in the Consolidated Statements of Operations as gains and losses consistent with the classification of the underlying risk.
Cash and Cash Equivalents
Cash and cash equivalents include cash and highly liquid investments with original maturities of three months or less. At September 30, 2014 and 2013, cash equivalents were $6.4 million and $7.8 million, respectively. Cash equivalents are held at cost which approximates fair value due to their short-term maturities and varying interest rates.
Concentration of Credit Risk
Financial instruments, which potentially subject the Company to concentrations of credit risk, are cash deposits and cash equivalents, marketable securities, derivative instruments and accounts receivable. All of the Company’s cash, cash equivalents, marketable securities and derivative instruments are maintained by major financial institutions. The Company invests cash not required for use in operations in high credit quality securities based on the Company's investment policy. The Company's investment policy provides guidelines and limits regarding credit quality, investment concentration, investment type, and maturity that the Company believes will provide liquidity and reduce risk of loss of capital. The Company’s customers are concentrated in the semiconductor industry, and relatively few customers account for a significant portion of the Company’s revenue. The Company regularly monitors the creditworthiness of its customers and believes that it has adequately provided for exposure to potential credit losses. The Company's top ten largest customers account for approximately 37%, 40% and 45% of revenue for the fiscal years ended September 30, 2014, 2013 and 2012, respectively. One of the Company's customers accounted for 11% of revenue for the fiscal year ended September 30, 2014. At September 30, 2014, no single customer represented 10% of the Company’s accounts receivable.
Fair Value of Financial Instruments
The Company's financial instruments include cash and cash equivalents, restricted cash, marketable securities, derivative instruments, accounts receivable, note receivable and accounts payable. In the case of marketable securities and derivative instruments, measurement is based on quoted market prices for identical or similar securities or instruments which represent fair value. The carrying amounts of other financial instruments reported in the Consolidated Balance Sheets approximate their fair value because of their short-term nature.
Accounts Receivable and Allowance for Doubtful Accounts and Sales Returns
Trade accounts receivable are recorded at the invoiced amount and do not bear interest. The allowance for doubtful accounts is the Company's best estimate of the amount of probable credit losses in its existing accounts receivable. The Company determines the allowance based on a number of factors, including an evaluation of customer credit worthiness, the age of the outstanding receivable, economic trends and historical experience. The Company reviews its allowance for doubtful accounts on a quarterly basis and changes in estimates are reflected in the period in which they become known. Accounts receivable balances are written-off against the allowance for doubtful accounts when the Company determines that the receivable is not recoverable. Provisions for doubtful accounts are recorded in "Selling, general and administrative expenses" in the Consolidated Statements of Operations. The allowance for sales returns is the Company's best estimate of probable returns from its customers. Provisions for sales returns are recorded in "Revenue" in the Consolidated Statements of Operations. The Company does not have any off-balance-sheet credit exposure related to its customers.
44
NOTES TO CONSOLIDATED FINANCIAL STATEMENTS - (Continued)
Inventories
Inventories are stated at the lower of cost or market, cost being determined using a standard costing system which approximates cost based on a first-in, first-out method. The Company provides inventory reserves for excess, obsolete or damaged inventory based on changes in customer demand, technology and other economic factors.
Fixed Assets, Intangible Assets and Impairment of Long-lived Assets
Property, plant and equipment are stated at cost less accumulated depreciation. Depreciation is computed using the straight-line method. Depreciable lives are summarized below:
Buildings | 20 - 40 years |
Computer equipment and software | 2 - 7 years |
Machinery and equipment | 2 - 10 years |
Furniture and fixtures | 3 - 10 years |
Leasehold improvements are amortized over the shorter of their estimated useful lives or the term of the respective leases. Equipment used for demonstrations to customers is included in machinery and equipment and is depreciated over its estimated useful life. Repair and maintenance costs are expensed as incurred.
The Company has developed software for internal use. Internal and external labor costs incurred during the application development stage of a project are capitalized. Costs incurred prior to application development and post implementation are expensed as incurred. Training and data conversion costs are also expensed as incurred.
When an asset is retired, the cost of the asset disposed of and the related accumulated depreciation are removed from the accounts, and any resulting gain or loss is included in the determination of operating income (loss).
As a result of the Company's acquisitions, the Company has identified finite-lived intangible assets other than goodwill. Finite-lived intangible assets are valued based on estimates of future cash flows and amortized over their estimated useful life using methods that approximate the pattern in which the economic benefits are expected to be realized.
Finite-lived intangibles assets and fixed assets are tested for impairment when indicators of impairment are present. For purposes of this test, long-lived assets are grouped with other assets and liabilities at the lowest level for which identifiable cash flows are largely independent of the cash flows of other assets and liabilities. When the Company determines that indicators of potential impairment exist, the next step of the impairment test requires that the potentially impaired long-lived asset group is tested for recoverability. The test for recoverability compares the undiscounted future cash flows of the long-lived asset group to its carrying value. The future cash flow period is based on the future service life of the primary asset within the long-lived asset group. If the carrying values of the long-lived asset group exceed the future cash flows, the assets are considered to be potentially impaired. The next step in the impairment process is to determine the fair value of the individual net assets within the long-lived asset group. If the aggregate fair values of the individual net assets of the group are less than their carrying values, an impairment is recorded equal to the excess of the aggregate carrying value of the group over the aggregate fair value. The loss is allocated to each asset within the group based on their relative carrying values, with no asset reduced below its fair value.
The amortizable lives of intangible assets, including those identified as a result of purchase accounting, are summarized as follows:
Patents | 7 - 15 years |
Completed technology | 5 - 10 years |
Customer relationships | 5 - 13 years |
Goodwill
Goodwill represents the excess of purchase price over the fair value of net tangible and identifiable intangible assets of the businesses the Company acquired. The Company performs an annual impairment test of its goodwill on September 30 of each fiscal year unless interim indicators of impairment exist. Management's judgments are based on market and operational conditions at the time of the evaluation and can include management's best estimate of future business activity, which in turn drives estimates of future cash flows from these assets and the reporting units with associated goodwill. These periodic evaluations could cause management to conclude that impairment factors exist, requiring an adjustment of these assets to their then-current fair market value. Future business conditions and/or activity could differ materially from the projections made by management causing the need for additional adjustments and impairment charges.
The testing of goodwill for impairment is performed at a level referred to as a reporting unit. A reporting unit is either the “operating segment level” or one level below, which is referred to as a “component.” The level at which the impairment test is performed requires an assessment as to whether the operations below the operating segment constitute a self-sustaining
45
NOTES TO CONSOLIDATED FINANCIAL STATEMENTS - (Continued)
business, in which case testing is generally required to be performed at this level. The Company currently has four reporting units that have goodwill, including two components that are part of the Brooks Product Solutions operating segment, one reporting unit that is the Brooks Global Services operating segment and one reporting unit that is the Brooks Life Science Systems operating segment.
The Company determines the fair value of its reporting units using an Income Approach, specifically the Discounted Cash Flow Method (“DCF Method”). The DCF Method includes future cash flow projections, which are discounted to present value, and an estimate of terminal values, which are also discounted to present value. Terminal values represent the present value an investor would pay today for the rights to the cash flows of the business for the fiscal years subsequent to the discrete cash flow projection period. The Company considers the DCF Method to be the most appropriate valuation indicator as the DCF analyses are based on management's long-term financial projections. Given the dynamic nature of the cyclical semiconductor equipment market, management's projections as of the valuation date are considered more objective than comparisons to market metrics for peer companies, which fluctuate over the cycle. However, the Company also uses market-based valuation techniques to test the reasonableness of the reporting unit fair values determined by the DCF Method and compares the aggregate fair value of its reporting units plus its net corporate assets to its overall market capitalization.
Goodwill impairment testing is a two-step process. The first step of the goodwill impairment test, used to identify potential impairment, compares the fair value of each reporting unit to its respective carrying amount, including goodwill. If the fair value of the reporting unit exceeds its carrying amount, goodwill of the reporting unit is not considered impaired. If the reporting unit's carrying amount exceeds the fair value, the second step of the goodwill impairment test must be completed to measure the amount of the impairment loss, if any. The second step compares the implied fair value of goodwill with the carrying value of goodwill. The implied fair value is determined by allocating the fair value of the reporting unit to all of the assets and liabilities of that unit, the excess of the fair value over amounts assigned to its assets and liabilities is the implied fair value of goodwill. The implied fair value of goodwill determined in this step is compared to the carrying value of goodwill. If the implied fair value of goodwill is less than the carrying value of goodwill, an impairment loss is recognized equal to the difference.
Pension Plans
The cost and obligations of the Company's defined benefit pension plans are calculated using many assumptions to estimate the benefits that the employee earns while working, the amount of which cannot be completely determined until the benefit payments cease. Major assumptions used in the accounting for these employee benefit plans include the discount rate, expected return on plan assets and rate of increase in employee compensation levels. Assumptions are determined based on Company data and appropriate market indicators in consultation with third-party actuaries, and are evaluated each year as of the plans' measurement date.
Revenue Recognition
Product revenue is associated with the sale of hardware systems, components and spare parts as well as product license revenue. Service revenue is associated with service contracts, repairs, upgrades and field service. Shipping and handling fees, billed to customers, if any, are recognized as revenue. The related shipping and handling costs are recognized in cost of revenue.
The Company recognizes revenue when the following criteria have been met: persuasive evidence of an arrangement exists with the customer; delivery of the specified products has occurred or services have been rendered; fees are fixed or determinable; and collection of the related receivable is reasonably assured. The arrangements for the sale of certain of the Company's products include customer acceptance provisions. These provisions are included in these arrangements to ensure that the product delivered to the customer meets published specifications. Prior to shipment of its products, the Company typically inspects the product, tests its functionality and documents that it meets the published specifications. In general, the Company's inspections and testing replicate the testing that will be performed at the customer site prior to final acceptance by the customer. In situations where the Company has sufficient history of objectively demonstrating that the acceptance criteria in the arrangement has been achieved prior to delivery, which are typically for products with limited customization, revenue is recognized in advance of final customer acceptance because there are no remaining substantive contingencies. Arrangements with certain customers also include contingent revenue provisions, in which a portion of the selling price of a delivered item is contingent on the delivery of other items or on the delivered items meeting specified performance criteria. In arrangements that include contingent revenue, the amount of revenue that the Company recognizes is limited to the lower of either: the amount billed that is not contingent on acceptance; or the value of the arrangement consideration allocated to the delivered elements, if the product is part of a multiple-element arrangement. When significant on-site customer acceptance provisions are present in the arrangement, or the Company is not able to objectively demonstrate that the acceptance criteria have been met, revenue is recognized upon receiving acceptance from the customer.
Revenue from product sales that include significant customization, which primarily include life science automation systems, is recorded using the percentage of completion method. Under the percentage of completion method revenue is
46
NOTES TO CONSOLIDATED FINANCIAL STATEMENTS - (Continued)
recorded as work progresses based on a percentage that incurred labor effort to date bears to total projected labor effort. Profit estimates on long-term contracts are revised periodically based on changes in circumstances, and any losses on contracts are accrued in the same period the Company determines that the loss is probable. If the Company determines that a loss is probable, it estimates the amount of the loss by comparing total estimated contract revenue to the total estimated contract costs. Significant judgment is required when estimating total labor costs and progress to completion on these arrangements, as well as whether a loss is expected to be incurred on the contract due to several factors, including the degree of customization required and the customer’s existing environment. The Company uses historical experience, project plans, and an assessment of the risks and uncertainties inherent in the arrangement to establish these estimates. Uncertainties in these arrangements include implementation delays or performance issues that may or may not be within the Company's control. The Company also has certain arrangements for products with significant customization that include contractual terms that prohibit use of the percentage of completion method. In some circumstances, percentage of completion is not appropriate, as it relates to the contractual rights of the customer, and in these cases the Company uses the completed-contract method. Under the completed-contract method, income is recognized only when a contract is completed or substantially completed.
Revenue associated with service agreements is generally recognized ratably over the term of the contract, with payments from customers being recorded as deferred revenue. Revenue from repair services or upgrades of customer-owned equipment is recognized upon completion of the repair effort and upon the shipment of the repaired item back to the customer. In instances where the repair or upgrade includes installation, revenue is recognized when the installation is completed.
A portion of the revenue arrangements for the Company's products, particularly in sales of life science automation systems, are multiple element arrangements that can include product, service and other elements. For revenue arrangements with multiple elements, arrangement consideration is allocated to each element based upon their relative selling price using vendor-specific objective evidence (“VSOE”), or third-party evidence (“TPE”) or based upon the relative selling price using estimated selling prices if VSOE or TPE does not exist. The Company relies primarily on estimated selling prices because it generally does not have VSOE or TPE. The Company recognizes revenue on each element of the arrangement in accordance with its policies for revenue recognition. The fair value of any undelivered elements is deferred until the undelivered element is delivered and all other criteria for revenue recognition have been met.
Warranty
The Company offers warranties on the sales of certain of its products and records an accrual for estimated future claims. Such accruals are based upon historical experience and management's estimate of the level of future claims.
Research and Development Expenses
Research and development costs are charged to expense when incurred.
Stock-Based Compensation
The Company measures compensation cost for all employee stock awards at fair value on the date of grant and recognizes compensation expense over the service period for awards expected to vest. The fair value of restricted stock is determined based on the number of shares granted and the closing price of the Company's common stock quoted on NASDAQ on the date of grant, and the fair value of stock options is determined using the Black-Scholes valuation model. Such value is recognized as expense ratably over the service period, net of estimated forfeitures. The estimation of stock awards that will ultimately vest requires significant judgment. The Company considers many factors when estimating expected forfeitures, including types of awards, employee class, and historical experience. In addition, for stock-based awards where vesting is dependent upon achieving certain operating performance goals, the Company estimates the likelihood of achieving the performance goals. Actual results, and future changes in estimates, may differ substantially from the Company's current estimates.
The following table reflects stock-based compensation expense, excluding amounts related to discontinued operations, recorded during the fiscal years ended September 30, 2014, 2013 and 2012 (in thousands):
Year ended September 30, | |||||||||||
2014 | 2013 | 2012 | |||||||||
Restricted stock | $ | 10,469 | $ | 7,112 | $ | 7,949 | |||||
Employee stock purchase plan | 445 | 496 | 549 | ||||||||
$ | 10,914 | $ | 7,608 | $ | 8,498 | ||||||
47
NOTES TO CONSOLIDATED FINANCIAL STATEMENTS - (Continued)
Valuation Assumptions for Employee Stock Purchase Plan
The fair value of shares issued under the employee stock purchase plan was estimated on the commencement date of each offering period using the Black-Scholes option-pricing model with the following assumptions for the fiscal years ended September 30, 2014, 2013 and 2012:
Year ended September 30, | ||||||||
2014 | 2013 | 2012 | ||||||
Risk-free interest rate | 0.1 | % | 0.1 | % | 0.1 | % | ||
Volatility | 25 | % | 32 | % | 45 | % | ||
Expected life | 6 months | 6 months | 6 months | |||||
Dividend yield | 3.40% | 3.30% - 3.40% | 2.75% - 3.30% | |||||
The risk-free rate is based on the U.S. Treasury yield curve in effect at the time of grant for periods corresponding with the expected life of the share; expected volatilities are based on historical volatilities of the Company's common stock; and the expected life represents the weighted average period of time that employee stock purchase plan shares are expected to be purchased. Dividend yields are projected based on the Company's history of dividends declared, and management's intention for future dividend declarations.
Equity Incentive Plans
The Company's equity incentive plans are intended to attract and retain employees and to provide an incentive for them to assist the Company to achieve long-range performance goals and to enable them to participate in the long-term growth of the Company. The equity incentive plans consist of plans under which employees may be granted options to purchase shares of the Company's stock, restricted stock and other equity incentives. Stock options generally had a vesting period of 4 years and are exercisable for a period not to exceed 10 years from the date of issuance. Restricted stock awards generally vest over 3 years. At September 30, 2014, a total of 2,486,983 shares were reserved and available for the issuance of awards under the plans.
Income Taxes
The Company records income taxes using the asset and liability method. Deferred income tax assets and liabilities are recognized for the future tax consequences attributable to differences between the financial statement carrying amounts of existing assets and liabilities and their respective income tax bases, and operating loss and tax credit carryforwards. The Company's consolidated financial statements contain certain deferred tax assets which have arisen primarily as a result of operating losses, as well as other temporary differences between financial and tax accounting. A valuation allowance is established if the likelihood of realization of the deferred tax assets is not considered more likely than not based on an evaluation of positive and negative evidence and the extent to which that evidence is objectively verifiable. Significant management judgment is required in determining the Company's provision for income taxes, the Company's deferred tax assets and liabilities and any valuation allowance recorded against those net deferred tax assets. The Company evaluates the weight of all available evidence to determine whether it is more likely than not that some portion or all of the net deferred income tax assets will not be realized.
The calculation of the Company's tax liabilities involves dealing with uncertainties in the application of complex tax regulations. The Company recognizes liabilities for uncertain tax positions based on a two-step process. The first step is to evaluate the tax position for recognition by determining if the weight of available evidence indicates that it is more likely than not that the position will be sustained on audit, including resolution of related appeals or litigation processes, if any. If the Company determines that a tax position will more likely than not be sustained on audit, the second step requires the Company to estimate and measure the tax benefit as the largest amount that is more than 50% likely to be realized upon ultimate settlement. It is inherently difficult and subjective to estimate such amounts, as the Company has to determine the probability of various possible outcomes. The Company re-evaluates these uncertain tax positions on a quarterly basis. This evaluation is based on factors such as changes in facts or circumstances, changes in tax law, new audit activity, and effectively settled issues. Determining whether an uncertain tax position is effectively settled requires judgment. Such a change in recognition or measurement would result in the recognition of a tax benefit or an additional charge to the tax provision.
Earnings Per Share
Basic earnings per share is calculated based on the weighted average number of common shares outstanding during the period. Diluted earnings per share is calculated based on the weighted average number of common shares and dilutive common equivalent shares assumed outstanding during the period. Shares used to compute diluted earnings per share exclude common share equivalents if their inclusion would have an anti-dilutive effect.
48
NOTES TO CONSOLIDATED FINANCIAL STATEMENTS - (Continued)
Recent Accounting Pronouncements
In July 2013, the Financial Accounting Standards Board ("FASB") issued an amendment to the accounting guidance for presentation of unrecognized tax benefits. The prior guidance related to unrecognized tax benefits did not explicitly address financial statement presentation of unrecognized tax benefits when a net operating loss carryforward, a similar tax loss or a tax credit carryforward exists. The amended guidance eliminates the existing diversity in practice in the presentation of unrecognized tax benefits in these instances. Under the amended guidance, an unrecognized tax benefit, or a portion of an unrecognized tax benefit, will be presented in the financial statements as a reduction of a deferred tax asset when an operating loss carryforward, a similar tax loss or a tax credit carryforward exists, with limited exceptions. This amended guidance is effective for fiscal years beginning on or after December 15, 2013. The adoption of this guidance will not have a material impact on the Company's financial position or results of operations.
In April 2014, the FASB issued an amendment to the accounting guidance for reporting discontinued operations. The amended guidance raises the threshold for disposals to qualify as a discontinued operation by requiring a component of an entity that is held for sale, or has been disposed of by sale, to represent a strategic shift that has or will have a major effect on operations and financial results. Under the amended guidance, a strategic shift could include the disposal of a major line of business, a major geographical area, a major equity method investment or other major parts of an entity. In addition, the new guidance allows companies to have significant continuing involvement and continuing cash flows with the discontinued operation. The amended guidance is effective for fiscal years beginning on or after December 15, 2014. Early adoption is permitted but not required for disposals, or classifications as held for sale, that have not been previously reported in financial statements. The Company has elected not to adopt this amended guidance in regard to the Granville-Phillips discontinued operation.
In May 2014, the FASB issued new accounting guidance for reporting revenue recognition. The guidance recognizes revenue when promised goods or services are transferred to customers in an amount that reflects the consideration that is expected to be received for those goods or services. The five step process may make it possible that more judgment and estimation will be required within the revenue recognition process than required under existing GAAP, including identifying performance obligations in the contract, estimating the amount of variable consideration to include in the transaction price and allocating the transaction price to each separate performance obligation. This guidance is effective for fiscal years beginning after December 15, 2016. Early adoption is not permitted. The Company is evaluating the impact that the adoption of this guidance will have on its financial position and results of operations.
49
NOTES TO CONSOLIDATED FINANCIAL STATEMENTS - (Continued)
3. Discontinued Operations
The Granville-Phillips business unit develops, manufactures, sells and services vacuum measurement and gas analysis instrumentation to semiconductor and non-semiconductor customers. In March 2014, the Company entered into an agreement to sell this business for $87.0 million in cash. The sale was completed on May 30, 2014. The Company’s historical financial statements have been revised to present the operating results of the Granville-Phillips business as a discontinued operation. Summarized results of the discontinued operation are as follows for the fiscal years ended September 30, 2014, 2013 and 2012 (in thousands):
Year Ended September 30, | |||||||||||
2014 | 2013 | 2012 | |||||||||
Revenue | $ | 18,921 | $ | 28,512 | $ | 30,468 | |||||
Income from discontinued operations | $ | 4,888 | $ | 7,779 | $ | 7,919 | |||||
Gain on the sale of the discontinued operations | 56,804 | — | — | ||||||||
Income tax provision | 31,690 | 2,815 | 2,919 | ||||||||
Income from discontinued operations, net of tax | $ | 30,002 | $ | 4,964 | $ | 5,000 | |||||
The operating results of the Granville-Phillips business were historically included in the results of operations for the Brooks Product Solutions segment, except for revenues and expenses associated with support and repair services that were included in the Brooks Global Services segment.
The presentation of the Granville-Phillips business as a discontinued operation had no impact on previously reported net income (loss) or stockholders' equity.
Assets and liabilities identifiable within the Granville-Phillips business are reported as "Assets held for sale" and "Liabilities held for sale," respectively, in the Consolidated Balance Sheets. The major classes of assets and liabilities of the discontinued operation as of September 30, 2013 is as follows (in thousands):
September 30, 2013 | |||
Inventory | $ | 3,308 | |
Property, plant and equipment | 364 | ||
Goodwill | 24,106 | ||
Assets held for sale | $ | 27,778 | |
Deferred revenue | $ | 43 | |
Accrued warranty and retrofit costs | 89 | ||
Liabilities held for sale | $ | 132 | |
50
NOTES TO CONSOLIDATED FINANCIAL STATEMENTS - (Continued)
4. Acquisitions
Acquisitions Completed in 2014
On April 30, 2014, the Company acquired all the outstanding stock of Dynamic Micro Systems Semiconductor Equipment GmbH (“DMS”), a German provider of automated contamination control solutions for front opening unified pod, or "FOUP," carriers and reticle storage, which are targeted at improving yield of semiconductor processes at semiconductor fabrication plants. The Company paid, in cash, aggregate merger consideration of $31.6 million, net of cash acquired. The acquisition of DMS expands the Company’s capabilities at semiconductor fabrication plants for yield improvement on new technology nodes.
The Company recorded the assets and liabilities associated with DMS at their fair values as of the acquisition date. The preliminary amounts recorded were as follows (in thousands):
Accounts receivable | $ | 15,262 | |
Inventory | 10,051 | ||
Prepaid and other current assets | 2,727 | ||
Property, plant and equipment | 2,049 | ||
Completed technology | 3,610 | ||
Customer relationships | 7,100 | ||
Goodwill | 11,638 | ||
Accounts payable | (10,393 | ) | |
Accrued liabilities | (5,522 | ) | |
Deferred revenue | (1,309 | ) | |
Long-term deferred tax liabilities | (3,588 | ) | |
Total purchase price, net of cash acquired | $ | 31,625 | |
The purchase price was allocated based on the fair value of the identified assets acquired and liabilities assumed as of the acquisition date from a market participant’s perspective.
The Company reached settlement on certain working capital adjustments with the sellers of DMS' stock in the fourth quarter of fiscal year 2014. As a result of this settlement, the Company will receive a refund of approximately $2.2 million from certain escrows established at the date of acquisition. The amount to be received is reflected in the allocation presented above as a reduction in the consideration transferred. At September 30, 2014, $3.2 million remained in escrow related to potential future claims against the sellers of DMS' stock. The Company has not yet completed the final allocation of the consideration paid in connection with the acquisition of DMS with respect to matters associated with the balances held in escrow and the potential impact of these matters on deferred tax liabilities. However, the Company expects to complete the final allocation within the measurement period.
The Company used the relief-from-royalty method, a form of the income approach, to value the completed technology acquired. The principle behind this method is that the value of an intangible asset is equal to the present value of the after-tax royalty savings attributable to owning that intangible asset. The Company used the excess-earnings method, a form of the income approach, to value the customer relationship acquired. The principle behind this method is that the value of the intangible asset is equal to the present value of the after-tax cash flows attributable to the intangible asset only. The weighted average amortization periods for intangible assets acquired in the DMS acquisition are 5.0 years for completed technologies and 8.0 years for customer relationships. The intangible assets acquired will be amortized using methods that approximate the pattern in which the economic benefits are expected to be realized, including variable declining balance and straight-line methods.
Goodwill represents the excess of the consideration transferred over the net assets acquired and has been assigned to the Company's Brooks Product Solutions segment. Goodwill is primarily the result of expected synergies from combining the operations of DMS with the Company. Goodwill arising from the acquisition of DMS is not deductible for tax purposes.
The operating results of DMS have been included in the results of operations for the Brooks Product Solutions segment from the date of the acquisition. Revenue from DMS for the fiscal year ended September 30, 2014 was $5.5 million and the net loss was $4.5 million. The net loss includes charges to expense of $1.9 million related to the step-up in value of the acquired inventories, $0.9 million of amortization expense and $0.3 million of restructuring charges.
51
NOTES TO CONSOLIDATED FINANCIAL STATEMENTS - (Continued)
The following pro forma summary presents consolidated information of the Company for the fiscal years ended September 30, 2014 and 2013, as if the acquisition of DMS occurred on October 1, 2012 (in thousands):
Year ended September 30, | |||||||
2014 | 2013 | ||||||
Revenue | $ | 501,951 | $ | 456,588 | |||
Income (loss) from continuing operations | (4,788 | ) | (10,678 | ) | |||
Net income (loss) attributable to Brooks Automation, Inc. | 25,053 | (5,779 | ) | ||||
The pro forma income (loss) from continuing operations and net income (loss) attributable to Brooks Automation, Inc. have been adjusted to reflect additional amortization from adjustments to intangible assets as if those adjustments had been applied as of October 1, 2012.
Acquisitions Completed in 2013
In August 2013, the Company acquired certain assets and assumed certain liabilities of Matrical, Inc.’s (“Matrical”) life science businesses (collectively “the Matrical Assets”) for cash consideration of approximately $9.3 million, net of cash acquired. Matrical is a Spokane, Washington-based, privately held company that provided biological sample preparation, management and storage solutions to customers in agricultural biotechnology, biotechnology, life science and pharmaceutical markets. The acquisition of the Matrical Assets provides the Company with the opportunity to enhance its existing product offerings in biobanking and sample management for the Brooks Life Science Systems segment.
In October 2012, the Company acquired all the outstanding stock of Crossing Automation Inc. (“Crossing”), a Fremont, California based provider of automation solutions and services primarily to global semiconductor front-end markets. The Company paid, in cash, an aggregate merger consideration of $59.0 million, net of cash acquired. The acquisition of Crossing provides the Company with the opportunity to enhance its existing capabilities with respect to manufacturing of atmospheric and vacuum automation solutions within the semiconductor front-end market.
The Company recorded the assets and liabilities associated with the purchase of the Matrical Assets and Crossing at their fair values as of their respective acquisition dates. The amounts recorded were as follows (in thousands):
Matrical Assets | Crossing | ||||||
Accounts receivable | $ | 636 | $ | 5,356 | |||
Inventory | 2,095 | 8,668 | |||||
Prepaid and other current assets | 103 | 1,968 | |||||
Property, plant and equipment | 534 | 2,270 | |||||
Completed technology | 500 | 10,530 | |||||
Customer relationships | 1,500 | 20,010 | |||||
Goodwill | 7,076 | 26,453 | |||||
Other long-term assets | — | 885 | |||||
Debt | (902 | ) | — | ||||
Accounts payable | (294 | ) | (3,024 | ) | |||
Deferred revenue | (351 | ) | (319 | ) | |||
Customer deposits | (1,249 | ) | — | ||||
Other current liabilities | (322 | ) | (5,560 | ) | |||
Other long-term liabilities | — | (8,232 | ) | ||||
Total purchase price, net of cash acquired | $ | 9,326 | $ | 59,005 | |||
The purchase prices were allocated based upon the fair value of the identified assets acquired and liabilities assumed as of the acquisition date from a market participant’s perspective. The Company finalized the purchase price allocations for these acquisitions within the measurement periods. Subsequent adjustments to the initially reported purchase price allocations were not material.
The Company used the relief-from-royalty method to value the completed technology and the excess-earnings method to value the customer relationships. The weighted-average amortization periods for the intangible assets acquired in connection with the Matrical Assets are 4.6 years for completed technologies and 7.0 years for customer relationships and are being amortized using the straight-line method because it approximates the pattern in which the economic benefits are expected to be realized. The weighted-average amortization periods for intangible assets acquired in the Crossing acquisition are 7.7 years for
52
NOTES TO CONSOLIDATED FINANCIAL STATEMENTS - (Continued)
completed technologies and 8.0 years for customer relationships and are being amortized using methods that approximate the pattern in which the economic benefits are expected to be realized, including variable declining balance and straight-line methods.
Goodwill represents the excess of the purchase price over the fair values of the net tangible and intangible assets acquired and is primarily the result of expected synergies from combining the acquired products with the Company’s existing products and integrating the operations of the acquired businesses into those of the Company. The goodwill resulting from the acquisition of the Matrical Assets has been allocated to the Brooks Life Science Systems segment and goodwill resulting from the Crossing acquisition has been allocated to the Brooks Product Solutions and Brooks Global Services segments. Goodwill from the acquisition of the Matrical Assets is deductible for tax purposes. Goodwill from the acquisition of Crossing is not deductible for tax purposes.
Acquisitions Completed in 2012
In March 2012, the Company acquired assets, consisting primarily of intellectual property, from Intevac, Inc. for $3.0 million. Management evaluated this asset purchase to determine if this acquisition would be considered an acquisition of a business. Since only limited assets were acquired, management concluded that the inputs and processes required to meet the definition of a business were not acquired, and therefore, this transaction was treated as the purchase of an asset group. The Company expensed essentially all of this asset purchase as an in-process research and development cost in 2012.
In December 2011, the Company acquired the Celigo® automated Cell Cytometer product line (“Celigo”) from Cyntellect, Inc., for $8.7 million in cash, plus a deferred cash payment of $0.5 million that was paid in July 2012. The Celigo product line provided life science customers with cellular imaging in a high-throughput and easy-to-use platform. The Celigo product line was part of the Brooks Life Science Systems segment and provided a complementary analysis tool for customers currently using the Company’s automated sample management systems.
The Company completed the sale of the Celigo product line in the second quarter of fiscal year 2014. The Company has recorded impairment charges totaling $2.4 million related to long-lived assets acquired with the Celigo product line in connection with the sale. The impairment charge is described more fully in “Note 8. Goodwill and Intangible Assets."
5. Marketable Securities
The Company invests in marketable securities and classifies them as available-for-sale. The Company records these securities at fair value. Marketable securities reported as current assets represent investments that mature within one year from the balance sheet date. Long-term marketable securities represent investments with maturity dates greater than one year from the balance sheet date. At the time that the maturity dates of these investments become one year or less, the securities are reclassified to current assets. Unrealized gains and losses are excluded from earnings and reported as a separate component of accumulated other comprehensive income until the security is sold or matures. At the time of sale, any gains or losses, calculated by the specific identification method, will be recognized as a component of operating results.
53
NOTES TO CONSOLIDATED FINANCIAL STATEMENTS - (Continued)
The following is a summary of marketable securities (included in short and long-term marketable securities in the Consolidated Balance Sheets), including accrued interest receivable, as of September 30, 2014 and 2013 (in thousands):
Amortized Cost | Gross Unrealized Gains | Gross Unrealized Losses | Fair Value | ||||||||||||
September 30, 2014: | |||||||||||||||
U.S. Treasury securities and obligations of U.S. government agencies | $ | 26,052 | $ | 1 | $ | (39 | ) | $ | 26,014 | ||||||
Corporate securities | 74,614 | 23 | (174 | ) | 74,463 | ||||||||||
Mortgage-backed securities | 964 | 36 | — | 1,000 | |||||||||||
Other debt securities | 7,358 | — | (10 | ) | 7,348 | ||||||||||
Municipal securities | 15,888 | 1 | (16 | ) | 15,873 | ||||||||||
Bank certificate of deposits | 26,645 | 2 | (3 | ) | 26,644 | ||||||||||
$ | 151,521 | $ | 63 | $ | (242 | ) | $ | 151,342 | |||||||
September 30, 2013: | |||||||||||||||
U.S. Treasury securities and obligations of U.S. government agencies | $ | 19,528 | $ | 6 | $ | (13 | ) | $ | 19,521 | ||||||
Corporate securities | 35,045 | 11 | (47 | ) | 35,009 | ||||||||||
Mortgage-backed securities | 1,093 | 25 | (1 | ) | 1,117 | ||||||||||
Other debt securities | 88 | — | — | 88 | |||||||||||
Municipal securities | 25,199 | 15 | (7 | ) | 25,207 | ||||||||||
Bank certificate of deposits | 9,451 | — | (2 | ) | 9,449 | ||||||||||
$ | 90,404 | $ | 57 | $ | (70 | ) | $ | 90,391 | |||||||
Gross realized gains on sales of available-for-sale marketable securities included in “Other income, net” in the Consolidated Statements of Operations was $35,000, $57,000 and $15,000 for the fiscal years ended September 30, 2014, 2013 and 2012, respectively. Gross realized losses of $8,000 and $36,000 for the fiscal years ended September 30, 2014 and 2013, respectively, were also recorded in "Other income, net." There were no gross realized losses for the fiscal year ended September 30, 2012.
The fair value of the marketable securities at September 30, 2014 by contractual maturity, are shown below (in thousands). Expected maturities could differ from contractual maturities because the issuers of the securities may have the right to prepay obligations without prepayment penalties.
Fair Value | |||
Due in one year or less | $ | 68,130 | |
Due after one year through five years | 79,885 | ||
Due after ten years | 3,327 | ||
$ | 151,342 | ||
6. Fair Value Measurements
The fair value measurement guidance establishes a fair value hierarchy which requires an entity to maximize the use of observable inputs and minimize the use of unobservable inputs when measuring fair value. The standard describes three levels of inputs that may be used to measure fair value:
Level 1: Quoted prices in active markets for identical assets or liabilities as of the reporting date. Active markets are those in which transactions for the asset and liability occur in sufficient frequency and volume to provide pricing information on an ongoing basis.
Level 2: Observable inputs other than Level 1 prices, such as quoted prices for similar assets or liabilities; quoted prices in markets that are not active; or other inputs that are observable or can be corroborated by observable market data for substantially the full term of the assets or liabilities.
Level 3: Unobservable inputs that are supported by little or no market activity and that are significant to the fair value of the assets or liabilities.
54
NOTES TO CONSOLIDATED FINANCIAL STATEMENTS - (Continued)
Assets and liabilities of the Company measured at fair value on a recurring basis as of September 30, 2014 and 2013 are summarized as follows (in thousands):
Fair Value Measurements at Reporting Date Using | ||||||||||||||||
Description | September 30, 2014 | Quoted Prices in Active Markets for Identical Assets (Level 1) | Significant Other Observable Inputs (Level 2) | Significant Unobservable Inputs (Level 3) | ||||||||||||
Assets | ||||||||||||||||
Cash equivalents | $ | 6,404 | $ | 5,166 | $ | 1,238 | $ | — | ||||||||
Available-for-sale securities | 151,342 | — | 151,342 | — | ||||||||||||
Total Assets | $ | 157,746 | $ | 5,166 | $ | 152,580 | $ | — | ||||||||
Liabilities | ||||||||||||||||
Foreign exchange contracts | $ | 58 | $ | — | $ | 58 | $ | — | ||||||||
Fair Value Measurements at Reporting Date Using | ||||||||||||||||
Description | September 30, 2013 | Quoted Prices in Active Markets for Identical Assets (Level 1) | Significant Other Observable Inputs (Level 2) | Significant Unobservable Inputs (Level 3) | ||||||||||||
Assets | ||||||||||||||||
Cash equivalents | $ | 7,754 | $ | 6,152 | $ | 1,602 | $ | — | ||||||||
Available-for-sale securities | 90,391 | 2,199 | 88,192 | — | ||||||||||||
Foreign exchange contracts | 31 | — | 31 | — | ||||||||||||
Total Assets | $ | 98,176 | $ | 8,351 | $ | 89,825 | $ | — | ||||||||
Liabilities | ||||||||||||||||
Foreign exchange contracts | $ | 5 | $ | — | $ | 5 | $ | — | ||||||||
Cash Equivalents
Cash equivalents of $5.2 million and $6.2 million at September 30, 2014 and 2013, respectively, consisting of Money Market Funds, are classified within Level 1 of the fair value hierarchy because they are valued using quoted market prices in active markets. Cash equivalents of $1.2 million and $1.6 million at September 30, 2014 and 2013, respectively, consisting primarily of Bank Certificate of Deposits, are classified within Level 2 of the hierarchy because they are not actively traded.
Available-For-Sale Securities
Available-for-sale securities of $2.2 million at September 30, 2013 consisting of highly rated Corporate Bonds, are classified within Level 1 of the fair value hierarchy because they are valued using quoted market prices in active markets of identical assets or liabilities. Available-for-sale securities of $151.3 million and $88.2 million at September 30, 2014 and 2013, respectively, consisting of Municipal Securities, Bank Certificate of Deposits, Commercial Paper, U.S. Treasury Securities and Obligations of U.S. Government Agency Securities, and Mortgage-Backed Securities are classified within Level 2 of the fair value hierarchy because they are not actively traded and are valued using matrix pricing and benchmarking. Matrix pricing is a mathematical technique used to value securities by relying on the securities’ relationship to other benchmark quoted prices.
Foreign Exchange Contracts
Foreign exchange contract assets and liabilities are classified within Level 2 of the fair value hierarchy because there may not be an active market for each contract. However, the inputs used to calculate the value of the contract were obtained from an active market.
Nonrecurring Fair Value Measurements
In addition to the assets and liabilities recorded at fair value on a recurring basis, the Company has a note receivable that is measured at fair value on a nonrecurring basis. During the third quarter of fiscal year 2014, the Company evaluated the recoverability of a loan provided to a strategic partner (the "Borrower") and adjusted its value based on fair value methods. The loan is represented by a note receivable, which is classified as a Level 3 instrument, as the inputs used in the analysis are unobservable and required significant management judgment. The fair value of the loan was determined by considering the fair value of the collateral using valuation techniques, principally the discounted cash flow method, and the subordination of the Company’s note to debt provided by a new lender as described in "Note 11. Note Receivable." The fair value of the loan, which
55
NOTES TO CONSOLIDATED FINANCIAL STATEMENTS - (Continued)
the Company currently estimates to be $1.0 million, could be different under different conditions or different assumptions, including the varying assumptions regarding future cash flows of the Borrower or discount rates.
7. Property, Plant and Equipment
Property, plant and equipment as of September 30, 2014 and 2013, excluding amounts related to the discontinued operations, were as follows (in thousands):
September 30, | |||||||
2014 | 2013 | ||||||
Buildings and land | $ | 47,639 | $ | 38,539 | |||
Computer equipment and software | 59,962 | 72,240 | |||||
Machinery and equipment | 42,104 | 49,947 | |||||
Furniture and fixtures | 4,774 | 9,456 | |||||
Leasehold improvements | 17,771 | 13,937 | |||||
Capital projects in progress | 1,528 | 2,042 | |||||
173,778 | 186,161 | ||||||
Less accumulated depreciation and amortization | (123,595 | ) | (138,655 | ) | |||
Property, plant and equipment, net | $ | 50,183 | $ | 47,506 | |||
Depreciation expense, excluding amounts related to the discontinued operations, was $12.7 million, $13.7 million and $13.1 million for the fiscal years ended September 30, 2014, 2013 and 2012, respectively.
8. Goodwill and Intangible Assets
The Company performed its goodwill impairment test as of September 30, 2014 and 2013, and determined that no adjustment to goodwill was necessary. As of September 30, 2014, the fair value of all reporting units substantially exceeded the respective carrying values. The observable inputs used in the Company's DCF Method for the reporting units include discount rates at our above the Company's weighted-average cost of capital. The Company derives discount rates that are commensurate with the risks and uncertainties inherent in the respective businesses and its internally developed projections of future cash flows. In addition, the Company determined the terminal value using the Gordon growth method which assumes that the reporting unit will grow and generate free cash flow at a constant rate. The Company believes that the Gordon growth method is the most appropriate method for determining the terminal value because the terminal value is calculated at the point in which the Company has assumed that the reporting units have reached stable growth rates.
The components of the Company’s goodwill, excluding amounts related to the discontinued operations, by business segment at September 30, 2014 and 2013 are as follows (in thousands):
Brooks Product Solutions | Brooks Global Services | Brooks Life Science Systems | Other | Total | |||||||||||||||
Gross goodwill at September 30, 2012 | $ | 461,738 | $ | 151,238 | $ | 40,302 | $ | 26,014 | $ | 679,292 | |||||||||
Acquisitions and adjustments during fiscal year 2013 | 20,899 | 5,554 | 7,137 | — | 33,590 | ||||||||||||||
Gross goodwill at September 30, 2013 | 482,637 | 156,792 | 47,439 | 26,014 | 712,882 | ||||||||||||||
Acquisitions and adjustments during fiscal year 2014 | 11,638 | — | (61 | ) | — | 11,577 | |||||||||||||
Gross goodwill at September 30, 2014 | $ | 494,275 | $ | 156,792 | $ | 47,378 | $ | 26,014 | $ | 724,459 | |||||||||
Accumulated goodwill impairments at September 30, 2012 | $ | (437,706 | ) | $ | (151,238 | ) | $ | — | $ | (26,014 | ) | $ | (614,958 | ) | |||||
Impairments recorded during fiscal year 2013 | — | — | — | — | — | ||||||||||||||
Accumulated goodwill impairments at September 30, 2013 | (437,706 | ) | (151,238 | ) | — | (26,014 | ) | (614,958 | ) | ||||||||||
Impairments recorded during fiscal year 2014 | — | — | — | — | — | ||||||||||||||
Accumulated goodwill impairments at September 30, 2014 | $ | (437,706 | ) | $ | (151,238 | ) | $ | — | $ | (26,014 | ) | $ | (614,958 | ) | |||||
Goodwill, less accumulated impairments at September 30, 2013 | $ | 44,931 | $ | 5,554 | $ | 47,439 | $ | — | $ | 97,924 | |||||||||
Goodwill, less accumulated impairments at September 30, 2014 | $ | 56,569 | $ | 5,554 | $ | 47,378 | $ | — | $ | 109,501 | |||||||||
The Company is required to test certain long-lived assets when indicators of impairment are present. The Company determined that impairment indicators were present for the long-lived assets related to the Celigo product line as of September 30, 2013. The long-lived assets in question were tested for recoverability by comparing the sum of the undiscounted cash flows
56
NOTES TO CONSOLIDATED FINANCIAL STATEMENTS - (Continued)
directly attributable to the assets to their carrying values, which resulted in the conclusion that the carrying amounts of the assets were not recoverable. The fair values of the assets were then evaluated to determine the amount of the impairment, if any. The fair value of the assets was based primarily on market-based valuation techniques. As a result of this analysis, management determined that an impairment loss of $2.0 million had occurred as of September 30, 2013, and allocated the loss amount to the long-lived assets in the impaired asset group based on the carrying value of each asset, with no asset reduced below its respective fair value. The Company revised its estimate of the fair value of these assets in the first fiscal quarter of 2014 and determined that an additional impairment loss of $0.4 million, representing the remaining carrying value of the long-lived assets, was required. These impairment losses were recorded in the Brooks Life Science Systems segment. The impairment charge was allocated in the Consolidated Statements of Operations for the fiscal years ended September 30, 2014 and 2013 as follows (in thousands):
Year Ended September 30, | |||||||
2014 | 2013 | ||||||
Reported as cost of revenue: | |||||||
Completed technology intangible asset impairment | $ | 398 | $ | 1,910 | |||
Reported as selling, general and administrative expense: | |||||||
Trademarks and trade name intangible asset impairment | — | 50 | |||||
Total impairment charges | $ | 398 | $ | 1,960 | |||
The Company completed the sale of the Celigo product line in the second quarter of fiscal year 2014. The sale of the Celigo product line did not have a material impact on the Company's financial position or result of operations.
Components of the Company’s identifiable intangible assets, excluding amounts related to the discontinued operations, as of September 30, 2014 and 2013 are as follows (in thousands):
September 30, 2014 | September 30, 2013 | ||||||||||||||||||||||
Cost | Accumulated Amortization | Net Book Value | Cost | Accumulated Amortization | Net Book Value | ||||||||||||||||||
Patents | $ | 7,808 | $ | 7,300 | $ | 508 | $ | 7,808 | $ | 7,196 | $ | 612 | |||||||||||
Completed technology | 57,155 | 41,539 | 15,616 | 57,050 | 40,354 | 16,696 | |||||||||||||||||
Trademarks and trade names | 3,496 | 3,496 | — | 3,564 | 3,554 | 10 | |||||||||||||||||
Customer relationships | 73,389 | 29,963 | 43,426 | 66,687 | 23,917 | 42,770 | |||||||||||||||||
$ | 141,848 | $ | 82,298 | $ | 59,550 | $ | 135,109 | $ | 75,021 | $ | 60,088 | ||||||||||||
Amortization expense, excluding amounts related to the discontinued operations, for intangible assets was $10.6 million, $9.8 million and $6.7 million for the fiscal years ended September 30, 2014, 2013 and 2012, respectively.
Estimated future amortization expense for the intangible assets recorded by the Company as of September 30, 2014 is as follows (in thousands):
Year ended September 30, | |||
2015 | $ | 11,555 | |
2016 | 10,240 | ||
2017 | 9,536 | ||
2018 | 7,229 | ||
2019 | 6,660 | ||
Thereafter | 14,330 | ||
$ | 59,550 | ||
9. Equity Method Investments
The Company accounts for certain of its investments using the equity method of accounting. Under this method of accounting, the Company records in income its proportionate share of the earnings (losses) of the investee with a corresponding increase (decrease) in the carrying value of the investment.
57
NOTES TO CONSOLIDATED FINANCIAL STATEMENTS - (Continued)
BioCision, LLC
In March 2014, the Company acquired a 22% equity interest in BioCision, LLC (“BioCision”), a privately-held company based in Larkspur, California, for $4.0 million. BioCision develops, manufactures and markets cell cryopreservation products used to improve and standardize the tools and methods for biomaterial sample handling.
The Company determined that the level of equity investment at risk was not sufficient for BioCision to finance its activities without additional financial support and as a result, represented a variable interest entity. However, the Company does not have the power to direct the activities that most significantly impact BioCision’s economic performance and would not absorb the majority of the expected losses, and therefore does not qualify as the primary beneficiary. The Company has no future contractual funding commitments to BioCision and as a result, the Company's exposure to loss was limited to the amount of its investment.
For the fiscal year ended September 30, 2014, the Company recorded a loss of $0.3 million representing its proportional share in the losses of BioCision. At September 30, 2014, the carrying value of the investment in BioCision in the Company’s Consolidated Balance Sheet was $3.7 million.
ULVAC Cryogenics, Inc.
The Company participates in a 50% joint venture, ULVAC Cryogenics, Inc. (“UCI”) with ULVAC Corporation of Chigasaki, Japan. UCI manufactures and sells cryogenic vacuum pumps, principally to ULVAC Corporation. At September 30, 2014 and 2013, the carrying value of UCI in the Company's Consolidated Balance Sheet was $22.6 million and $22.7 million, respectively. For the fiscal years ended September 30, 2014, 2013 and 2012, the Company recorded income associated with UCI of $1.6 million, $2.6 million and $2.0 million, respectively. For the fiscal years ended September 30, 2014, 2013 and 2012, management fee payments received by the Company from UCI were $0.6 million, $0.6 million and $1.0 million, respectively. For the fiscal years ended September 30, 2014, 2013 and 2012, the Company incurred charges from UCI for products or services of $0.4 million, $0.5 million and $0.8 million, respectively. At September 30, 2014 and 2013, the Company owed UCI $79,000 and $26,000, respectively, in connection with accounts payable for unpaid products and services. During the fiscal years ended September 30, 2014 and 2013, the Company received $0.9 million and $5.0 million, respectively, of cash dividends from UCI which reduced the carrying value of the Company's investment.
Yaskawa Brooks Automation, Inc.
The Company participates in a 50% joint venture with Yaskawa Electric Corporation (“Yaskawa”) called Yaskawa Brooks Automation, Inc. (“YBA”) to exclusively market and sell Yaskawa's semiconductor robotics products and Brooks' automation hardware products to semiconductor customers in Japan. At September 30, 2014 and 2013, the carrying value of YBA in the Company's Consolidated Balance Sheet was $2.6 million and $3.0 million, respectively. For the fiscal years ended September 30, 2014, 2013 and 2012, the Company recorded income (expense) associated with YBA of $(0.1) million, $(0.2) million and $0.1 million, respectively. For the fiscal years ended September 30, 2014, 2013 and 2012, the Company earned revenue for sales to YBA of $7.4 million, $6.3 million and $8.0 million, respectively. The amount due from YBA included in accounts receivable at September 30, 2014 and 2013 was $2.1 million and $2.3 million, respectively. For the fiscal years ended September 30, 2014, 2013 and 2012, the Company incurred charges from YBA for products or services of $0.7 million, $0.5 million and $0.5 million, respectively. At September 30, 2014 and 2013 the Company owed YBA $133,000 and $47,000, respectively, in connection with accounts payable for unpaid products and services.
58
NOTES TO CONSOLIDATED FINANCIAL STATEMENTS - (Continued)
10. Earnings per Share
Below is a reconciliation of weighted average common shares outstanding for purposes of calculating basic and diluted earnings per share for the fiscal years ended September 30, 2014, 2013 and 2012 (in thousands, except per share data):
Year ended September 30, | |||||||||||
2014 | 2013 | 2012 | |||||||||
Income (loss) from continuing operations | $ | 1,520 | $ | (7,114 | ) | $ | 131,835 | ||||
Income from discontinued operations, net of tax | 30,002 | 4,964 | 5,000 | ||||||||
Net income (loss) | 31,522 | (2,150 | ) | 136,835 | |||||||
Net income attributable to noncontrolling interests | (161 | ) | (65 | ) | (46 | ) | |||||
Net income (loss) attributable to Brooks Automation, Inc. | $ | 31,361 | $ | (2,215 | ) | $ | 136,789 | ||||
Weighted average common shares outstanding used in computing basic earnings per share | 66,648 | 65,912 | 65,128 | ||||||||
Dilutive common stock options and restricted stock units | 996 | — | 594 | ||||||||
Weighted average common shares outstanding for purposes of computing diluted earnings per share | 67,644 | 65,912 | 65,722 | ||||||||
Basic net income (loss) per share attributable to Brooks Automation, Inc. common stockholders: | |||||||||||
Income (loss) from continuing operations | $ | 0.02 | $ | (0.11 | ) | $ | 2.02 | ||||
Income from discontinued operations, net of tax | 0.45 | 0.08 | 0.08 | ||||||||
Basic net income (loss) per share attributable to Brooks Automation, Inc. | $ | 0.47 | $ | (0.03 | ) | $ | 2.10 | ||||
Diluted net income (loss) per share attributable to Brooks Automation, Inc. common stockholders: | |||||||||||
Income (loss) from continuing operations | $ | 0.02 | $ | (0.11 | ) | $ | 2.01 | ||||
Income from discontinued operations, net of tax | 0.44 | 0.08 | 0.08 | ||||||||
Diluted net income (loss) per share attributable to Brooks Automation, Inc. common stockholders | $ | 0.46 | $ | (0.03 | ) | $ | 2.08 | ||||
Options to purchase approximately 11,000 and 238,000 shares of common stock and 0 and 2,000 restricted stock units were excluded from the computation of diluted earnings per share attributable to Brooks Automation, Inc. common stockholders for the fiscal years ended September 30, 2014 and 2012, respectively, as their effect would be anti-dilutive. Outstanding stock options of 43,000 shares and 3,006,000 of unvested shares of restricted stock units were excluded from the computation of diluted earnings per share for the fiscal year ended September 30, 2013 as a result of the net loss for that period.
11. Note Receivable
In 2012, the Company provided the Borrower a loan of $3.0 million to support the Borrower's future product development and other working capital requirements. The loan had a stated interest rate of 9% and the outstanding principal and interest was payable in May 2015. The Company also received a warrant to purchase the Borrower's common stock in the event of an equity offering by the Borrower and certain other rights related to conversion of the loan, first refusal to acquire the Borrower and a redemption premium. The loan was secured by a security agreement granting the Company a first-priority security interest in all of the assets of the Borrower.
The Company determined that the level of equity investment at risk was not sufficient for the entity to finance its activities without additional financial support and as a result, represented a variable interest entity. However, the Company does not have the power to direct the activities that most significantly impact the Borrower's economic performance and would not absorb the majority of the expected losses from the Borrower, and therefore does not qualify as the primary beneficiary. The Company has no future contractual funding commitments to the Borrower and as a result, the Company's exposure to loss was limited to the outstanding principal and interest under the loan.
During the third quarter of fiscal year 2014, the Borrower informed the Company of its intent to secure additional funding from an investment program funded by the Commonwealth of Massachusetts designed to support early-stage
59
NOTES TO CONSOLIDATED FINANCIAL STATEMENTS - (Continued)
companies. In connection with the Borrower’s efforts to secure additional financing, the Company agreed to subordinate its security interest in the assets of the Borrower to the new lender. Additionally, the Company agreed to extend the due date of its loan by approximately 5 years, to September 2019, in order to coincide with the due date of the new loan. The amended loan has a stated interest rate of 10%.
In connection with its efforts to secure additional financial support, the Borrower developed revised assumptions about its future cash flows. Based on the information provided by the Borrower, and the subordination to the new lender, the Company determined it was probable that it would not recover all amounts due from the loan and recorded an impairment charge of $2.6 million in the third quarter of fiscal year 2014. The impairment charge was recorded in the Consolidated Statements of Operations in selling, general and administrative expenses.
The fair value of the loan was determined by considering the fair value of the collateral using valuation techniques, principally the discounted cash flow method, less amounts committed by the new lender. The observable inputs used in the Company's analysis were limited primarily to the discount rate, which was based on a rate commensurate with the risks and uncertainties of the Borrower. As a result, the fair value of the loan at September 30, 2014, which the Company currently estimates to be $1.0 million, could be different under different conditions or different assumptions, including the varying assumptions regarding future cash flows of the Borrower or discount rates.
12. Derivative Instruments
In June 2013, the Company entered into foreign exchange contracts to reduce its exposure to changes in foreign exchange rates associated with an order for multiple automated sample management systems. The Company concluded that these foreign currency contracts met the criteria to qualify as a cash flow hedge. Accordingly, the Company reflected changes in the fair value of the effective portion of these foreign currency contracts in accumulated other comprehensive income. In the third quarter of fiscal year 2014, the Company reclassified the realized gain of $0.1 million on these contracts into revenue to coincide with recognition of the hedged transaction. The Company did not recognize any amounts related to ineffectiveness in the results of operations for the fiscal years ended September 30, 2014 or 2013 with respect to these contracts. The Company did not have any notional amounts outstanding under foreign currency contracts that qualify for cash flow hedge accounting at September 30, 2014.
The Company has transactions and balances denominated in currencies other than the U.S. dollar. Most of these transactions or balances are denominated in Euros, British Pounds and a variety of Asian currencies. These transactions and balances, including short-term advances between the Company and its subsidiaries, subject the Company's operations to exposure from exchange rate fluctuations. The impact of currency exchange rate movement can be positive or negative in any period. The Company mitigates the impact of potential currency translation gains and losses on short-term intercompany advances through timely settlement of each transaction, generally within 30 days.
The Company also enters into foreign exchange contracts to reduce its exposure to currency translation. Under forward contract arrangements, the Company typically agrees to purchase a fixed amount of U.S. dollars in exchange for a fixed amount of a foreign currency on specified dates with maturities of three months or less. These transactions do not qualify for hedge accounting. Net gains and losses recorded as a component of "Other income, net" in the Consolidated Statements of Operations related to these contracts is as follows for the fiscal years ended September 30, 2014, 2013 and 2012 (in thousands):
Year ended September 30, | ||||||||||||
2014 | 2013 | 2012 | ||||||||||
Realized gains (losses) on derivative instruments not designated as hedging instruments | $ | 185 | $ | 123 | $ | (151 | ) | |||||
60
NOTES TO CONSOLIDATED FINANCIAL STATEMENTS - (Continued)
The Company had the following notional amounts outstanding under foreign currency contracts that do not qualify for hedge accounting at September 30, 2014 and 2013 (in thousands):
September 30, 2014:
Buy Currency | Notional Amount of Buy Currency | Sell Currency | Maturity | Notional Amount of Sell Currency | Fair Value of Assets | Fair Value of Liabilities | ||||||||||||
U.S. dollar | 1,736 | Japanese yen | October 2014 to December 2014 | 190,000 | $ | — | $ | 11 | ||||||||||
U.S. dollar | 1,395 | Euro | October 2014 | 1,100 | — | 16 | ||||||||||||
U.S. dollar | 656 | Taiwan dollar | October 2014 | 20,000 | — | 5 | ||||||||||||
U.S. dollar | 650 | British pound | October 2014 | 400 | — | 5 | ||||||||||||
U.S. dollar | 731 | Israeli shekel | October 2014 | 2,700 | — | 5 | ||||||||||||
U.S. dollar | 76 | Korean won | October 2014 | 80,000 | — | 1 | ||||||||||||
British pound | 3,513 | Euro | October 2014 | 4,500 | — | 15 | ||||||||||||
$ | — | $ | 58 | |||||||||||||||
September 30, 2013:
Buy Currency | Notional Amount of Buy Currency | Sell Currency | Maturity | Notional Amount of Sell Currency | Fair Value of Assets | Fair Value of Liabilities | ||||||||||||
U.S. dollar | 2,762 | Japanese yen | October 2013 to December 2013 | 273,000 | $ | 8 | $ | — | ||||||||||
Korean won | 740,000 | U.S. dollar | October 2013 | 688 | — | 2 | ||||||||||||
U.S. dollar | 304 | Israeli shekel | October 2013 | 1,075 | — | 3 | ||||||||||||
U.S. dollar | 231 | Singapore dollar | October 2013 | 290 | — | — | ||||||||||||
$ | 8 | $ | 5 | |||||||||||||||
The fair values of the forward contracts described above are recorded in the Company's Consolidated Balance Sheets as prepaid expenses and other current assets and accrued expenses and other current liabilities.
13. Income Taxes
The components of the income tax benefit, excluding amounts related to the discontinued operations, for the fiscal years ended September 30, 2014, 2013 and 2012 are as follows (in thousands):
Year Ended September 30, | |||||||||||
2014 | 2013 | 2012 | |||||||||
Current income tax provision (benefit): | |||||||||||
Federal | $ | 15 | $ | 15 | $ | 15 | |||||
State | 177 | 70 | 213 | ||||||||
Foreign | 1,417 | 681 | (1,374 | ) | |||||||
Total current income tax provision (benefit) | 1,609 | 766 | (1,146 | ) | |||||||
Deferred income tax benefit: | |||||||||||
Federal | (2,276 | ) | (5,245 | ) | (121,203 | ) | |||||
State | (35 | ) | (183 | ) | (439 | ) | |||||
Foreign | (1,278 | ) | (323 | ) | (3,413 | ) | |||||
Total deferred income tax benefit | (3,589 | ) | (5,751 | ) | (125,055 | ) | |||||
Income tax benefit | $ | (1,980 | ) | $ | (4,985 | ) | $ | (126,201 | ) | ||
61
NOTES TO CONSOLIDATED FINANCIAL STATEMENTS - (Continued)
The components of income (loss) before income taxes and equity in earnings of equity method investments for the fiscal years ended September 30, 2014, 2013 and 2012 are as follows (in thousands):
Year Ended September 30, | |||||||||||
2014 | 2013 | 2012 | |||||||||
Domestic | $ | (7,338 | ) | $ | (14,747 | ) | $ | (5,715 | ) | ||
Foreign | 5,643 | 206 | 9,216 | ||||||||
$ | (1,695 | ) | $ | (14,541 | ) | $ | 3,501 | ||||
The differences between the income tax benefit and income taxes computed using the applicable U.S. statutory federal tax rate for the fiscal years ended September 30, 2014, 2013 and 2012 are as follows (in thousands):
Year Ended September 30, | |||||||||||
2014 | 2013 | 2012 | |||||||||
Income tax provision (benefit) computed at federal statutory rate | $ | (217 | ) | $ | (4,257 | ) | $ | 1,957 | |||
State income taxes, net of federal benefit | (12 | ) | (101 | ) | 112 | ||||||
Foreign income taxed at different rates | (596 | ) | 493 | (832 | ) | ||||||
Dividends | (1,373 | ) | 115 | 956 | |||||||
Change in deferred tax asset valuation allowance | 453 | 523 | (125,479 | ) | |||||||
Reduction in uncertain tax positions | (1,236 | ) | (1,022 | ) | (3,732 | ) | |||||
Nondeductible compensation | 1,064 | 474 | 1,339 | ||||||||
Tax credits | (704 | ) | (2,002 | ) | (1,195 | ) | |||||
Travel and entertainment | 220 | 124 | 139 | ||||||||
Merger costs | 187 | 251 | — | ||||||||
Other | 234 | 417 | 534 | ||||||||
Income tax benefit | $ | (1,980 | ) | $ | (4,985 | ) | $ | (126,201 | ) | ||
The Company has not provided for U.S. income taxes on the unremitted earnings of certain foreign subsidiaries as these earnings are considered to be indefinitely reinvested. These earnings amounted to approximately $25.2 million at September 30, 2014. It is not practicable to compute the estimated deferred tax liability on these earnings as they vary with a high dependence on numerous factors including the timing of such future remittance and the future results of various foreign operations.
The significant components of the net deferred tax assets and liabilities as of September 30, 2014 and 2013 are as follows (in thousands):
September 30, | |||||||
2014 | 2013 | ||||||
Accruals and reserves not currently deductible | $ | 12,456 | $ | 11,050 | |||
Federal, state and foreign tax credits | 20,434 | 20,084 | |||||
Other assets | 3,523 | 1,859 | |||||
Net operating loss carryforwards | 67,380 | 101,717 | |||||
Inventory reserves and valuation | 9,956 | 9,052 | |||||
Deferred tax assets | 113,749 | 143,762 | |||||
Depreciation and intangible amortization | 12,198 | 12,208 | |||||
Deferred tax liabilities | 12,198 | 12,208 | |||||
Valuation allowance | (18,354 | ) | (16,509 | ) | |||
Net deferred tax asset | $ | 83,197 | $ | 115,045 | |||
The net deferred tax assets, including current and noncurrent, decreased from $115.0 million to $83.2 million during the fiscal year ended September 30, 2014. The decrease of $31.8 million was primarily driven by a tax provision of $29.9 million related to the taxable gain on the sale of discontinued operations. When the business was sold, the Company realized a higher gain on a tax basis than the gain reported on a GAAP basis. The higher taxable gain resulted in an effective tax rate on the sale
62
NOTES TO CONSOLIDATED FINANCIAL STATEMENTS - (Continued)
of 52.6% when calculated on GAAP results. The gain on sale of discontinued operations was reported net of the tax effect in the Consolidated Statements of Operations.
Management has considered the weight of all available evidence in determining whether a valuation allowance is required against its deferred tax assets at September 30, 2014. After consideration of both positive and negative evidence management has concluded that it is more likely than not that a substantial portion of its deferred tax assets will be realized. The positive evidence considered was three year U.S. historical cumulative profitability, projected future taxable income and length of carry-forward periods of net operating losses and tax credits. The primary negative evidence considered is the volatile semiconductor industry in which the Company operates.
The Company recorded a tax benefit of $121.8 million resulting from the reduction in the valuation allowance during the fiscal year ended September 30, 2012. The Company has continued to maintain a valuation allowance in the United States against certain tax credits and state net operating losses due to the uncertainty of their realization based on long-term Company forecasts and the expiration dates on these attributes. The Company has also continued to maintain a valuation allowance in certain jurisdictions that have not generated historical cumulative profitability.
If future operating results of the U.S. or these foreign jurisdictions deviate from expectations, it is reasonably possible that there could be a further change in the valuation allowance in the future. A change in the valuation allowance, in whole or in part, would result in a non-cash income tax expense or benefit during the period of change.
As of September 30, 2014, the Company had federal, state and foreign net operating loss carryforwards of approximately $143.5 million, $97.9 million and $29.5 million, respectively, and federal and state research and development tax credit carryforwards of approximately $24.4 million available to reduce future tax liabilities, which expire at various dates through 2034. The net operating loss carryforward includes excess deductions related to stock compensation in the amount of $11.7 million which have not been recognized for financial statement purposes. The benefits of these tax deductions will be credited to additional paid-in capital upon being realized.
The Company has performed studies to determine if there are any annual limitations on the federal net operating losses under section 382 of the Internal Revenue Code of 1986, as amended (the “Internal Revenue Code”). As a result of these studies, the Company has determined that ownership changes have occurred primarily in connection with acquisitions when the Company has issued stock to the sellers, as well as ownership changes in the subsidiaries acquired by the Company. Certain limitations have been calculated and the benefits of the net operating losses that will expire before utilization have not been recorded as deferred tax assets in the financial statements. The Company's U.S. net operating losses expire at various dates through 2030.
A reconciliation of the beginning and ending amount of the consolidated liability for unrecognized income tax benefits during the fiscal years ended September 30, 2014, 2013 and 2012 is as follows (in thousands):
Unrecognized Tax Benefit | Interest and Penalties | Total | |||||||||
Balance at October 1, 2011 | $ | 9,011 | $ | 1,989 | $ | 11,000 | |||||
Additions for tax positions of prior years | 242 | 247 | 489 | ||||||||
Reductions from lapses in statutes of limitations | (3,125 | ) | (607 | ) | (3,732 | ) | |||||
Foreign exchange rate adjustment | (167 | ) | 15 | (152 | ) | ||||||
Balance at September 30, 2012 | 5,961 | 1,644 | 7,605 | ||||||||
Additions for tax positions of prior years | — | 228 | 228 | ||||||||
Additions for tax positions related to acquired entities | 116 | — | 116 | ||||||||
Reductions from lapses in statutes of limitations | (944 | ) | (78 | ) | (1,022 | ) | |||||
Foreign exchange rate adjustment | 14 | — | 14 | ||||||||
Balance at September 30, 2013 | 5,147 | 1,794 | 6,941 | ||||||||
Additions for tax positions of prior years | — | 286 | 286 | ||||||||
Reductions from lapses in statutes of limitations | (861 | ) | (375 | ) | (1,236 | ) | |||||
Foreign exchange rate adjustment | (24 | ) | — | (24 | ) | ||||||
Balance at September 30, 2014 | $ | 4,262 | $ | 1,705 | $ | 5,967 | |||||
As of September 30, 2014, all of the Company's unrecognized tax benefits, if recognized, would affect the effective tax rate. The Company recognizes interest related to unrecognized benefits as a component of tax expense, of which $0.3 million, $0.2 million and $0.2 million was recognized for the fiscal years ended September 30, 2014, 2013 and 2012, respectively.
63
NOTES TO CONSOLIDATED FINANCIAL STATEMENTS - (Continued)
The Company is subject to U.S. federal income tax and various state, local and international income taxes in various jurisdictions. The amount of income taxes paid is subject to the Company's interpretation of applicable tax laws in the jurisdictions in which it files. In the normal course of business, the Company is subject to examination by taxing authorities throughout the world. The statute of limitations lapsed on several uncertain tax positions in the foreign jurisdictions during fiscal year 2014 that resulted in a $1.2 million reduction in gross unrecognized tax benefits that impacted the effective tax rate. The Company is subject to income tax audits in various global jurisdictions in which it operates. In the Company's U.S. and international jurisdictions, the years that may be examined vary, with the earliest tax year being 2008. Based on the outcome of these examinations, or the expiration of statutes of limitations for specific jurisdictions, it is reasonably possible that the related unrecognized tax benefits could change from those recorded in the Company's statement of financial position. The Company currently anticipates that it is reasonably possible that the unrecognized tax benefit will be reduced by an amount in the range between $1.2 million and $2.3 million during the next twelve months primarily as the result of statutes of limitations expiring.
14. Postretirement Benefits
Defined Benefit Pension Plans
The Company has two active defined benefit pension plans (collectively, the “Plans”). The Plans cover substantially all of the Company’s employees in Switzerland and Taiwan. Retirement benefits are generally earned based on years of service and compensation during active employment; however, the level of benefits varies within the Plans. Eligibility is determined in accordance with local statutory requirements.
The Company previously had a defined benefit pension plan that covered certain employees in the United States. The Company settled its pension obligation with the participants of this plan in the fourth quarter of fiscal year 2012 which resulted in accelerated cash payments to the participants of approximately $6.4 million. In addition, the settlement resulted in a charge of $8.9 million for accelerated amortization of prior pension losses. The charge related to the settlement is included as a pension settlement charge in the Consolidated Statements of Operations.
The Company uses a September 30th measurement date in the determination of net periodic benefit costs, benefit obligations and the value of plan assets for all plans. The following tables set forth the funded status and amounts recognized in the Company’s Consolidated Balance Sheets as of September 30, 2014 and 2013 (in thousands):
September 30, | |||||||
2014 | 2013 | ||||||
Benefit obligation at beginning of fiscal year | $ | 7,107 | $ | 10,181 | |||
Service cost | 406 | 604 | |||||
Interest cost | 154 | 148 | |||||
Actuarial loss (gain) | 968 | (670 | ) | ||||
Benefits paid | (141 | ) | (1,421 | ) | |||
Settlements paid | — | (1,383 | ) | ||||
Curtailment gain | — | (500 | ) | ||||
Foreign currency translation | (281 | ) | 148 | ||||
Benefit obligation at end of fiscal year | $ | 8,213 | $ | 7,107 | |||
Fair value of assets at beginning of fiscal year | $ | 5,996 | $ | 8,015 | |||
Actual return on plan assets | 98 | 304 | |||||
Disbursements | (264 | ) | (1,573 | ) | |||
Employer contributions | 302 | 292 | |||||
Employee contributions | 200 | 194 | |||||
Settlements paid | — | (1,383 | ) | ||||
Foreign currency translation | (201 | ) | 147 | ||||
Fair value of assets at end of fiscal year | $ | 6,131 | $ | 5,996 | |||
Accrued benefit obligation | $ | 2,082 | $ | 1,111 | |||
The accumulated benefit obligation of the Plans is $7.3 million and $6.3 million at September 30, 2014 and 2013, respectively. All of the Plans have an accumulated benefit obligation and projected benefit obligation in excess of assets of the respective Plan at September 30, 2014 and 2013.
64
NOTES TO CONSOLIDATED FINANCIAL STATEMENTS - (Continued)
The following table provides pension amounts recorded within the account line items of the Company’s Consolidated Balance Sheets as of September 30, 2014 and 2013 (in thousands):
September 30, | |||||||
2014 | 2013 | ||||||
Accrued compensation and benefits | $ | 308 | $ | 296 | |||
Long-term pension liability | 1,774 | 815 | |||||
In addition, accumulated other comprehensive income at September 30, 2014 and 2013 includes unrecognized net actuarial gains (losses) of $(0.5) million and $0.5 million, respectively.
The components of the Company’s net pension cost for the fiscal years ended September 30, 2014, 2013 and 2012 is as follows (in thousands):
Year ended September 30, | |||||||||||
2014 | 2013 | 2012 | |||||||||
Service cost | $ | 406 | $ | 604 | $ | 787 | |||||
Interest cost | 154 | 148 | 984 | ||||||||
Expected return on plan assets | (214 | ) | (247 | ) | (1,072 | ) | |||||
Amortization of losses | 2 | 4 | 620 | ||||||||
Other | — | 160 | — | ||||||||
Net periodic pension cost | 348 | 669 | 1,319 | ||||||||
Settlement loss | — | 87 | 8,937 | ||||||||
Total pension cost | $ | 348 | $ | 756 | $ | 10,256 | |||||
Other changes in Plan assets and benefit obligations recognized in other comprehensive loss as of September 30, 2014 and 2013 is as follows (in thousands):
September 30, | |||||||
2014 | 2013 | ||||||
Net loss (gain) | $ | 961 | $ | (791 | ) | ||
Amortization of net loss | (2 | ) | (3 | ) | |||
Curtailment loss | — | (675 | ) | ||||
Settlement loss | — | (87 | ) | ||||
Total recognized in other comprehensive income (loss) | 959 | (1,556 | ) | ||||
Total recognized in net periodic pension cost and other comprehensive income (loss) | $ | 1,307 | $ | (887 | ) | ||
Weighted-average assumptions used to determine the projected benefit obligation for the fiscal years ended September 30, 2014, 2013 and 2012 are as follows:
Year Ended September 30, | ||||||||
2014 | 2013 | 2012 | ||||||
Discount rate | 1.55 | % | 2.15 | % | 3.51 | % | ||
Expected return on plan assets | 2.18 | % | 2.17 | % | 2.18 | % | ||
Expected rate of compensation increases | 1.87 | % | 1.89 | % | 1.84 | % | ||
In selecting the appropriate discount rate for the Plans, the Company uses country-specific information, adjusted to reflect the duration of the particular plan. The expected return on plan assets is based on an evaluation of fixed income yield curves and equity return assumption studies applied to the asset allocation of the Plans.
The Company bases its determination of pension expense or benefit on a market-related valuation of assets, which reduces year-to-year volatility. This market-related valuation recognizes investment gains or losses over a five-year period from the year in which they occur. Investment gains or losses for this purpose are the difference between the expected return calculated using the market-related value of assets and the actual return on assets. Since the market-related value of assets recognizes gains or losses over a five-year period, the future value of assets will be impacted as previously deferred gains or
65
NOTES TO CONSOLIDATED FINANCIAL STATEMENTS - (Continued)
losses are recognized. As of September 30, 2014, under the Plans, the Company had cumulative investment losses of approximately $0.8 million, which remain to be recognized in the calculation of the market-related value of assets. The Company also had cumulative other actuarial gains of $0.3 million at September 30, 2014, which are amortized into net periodic benefit costs over the average remaining service period of active participants in the Plans.
Plan Assets
The fair value of plan assets for the Switzerland Plan and Taiwan Plan were $5.6 million and $0.5 million, respectively, at September 30, 2014. As is customary with Swiss pension plans, the assets are invested in a collective fund with multiple employers through a Swiss insurance company. The Company does not have any rights to the assets of this Plan. Investment holdings are primarily in highly rated debt securities. The assets of the Taiwan Plan are invested with a trustee that has been selected by the Taiwan government. The Company has no investment authority over the assets of either the Switzerland Plan or the Taiwan Plan. The asset allocation of the plan assets at September 30, 2014 was as follows:
Debt securities | 73 | % |
Equity securities | 6 | |
Cash | 2 | |
Other | 19 | |
100 | % | |
The fair value of pension assets by asset category and by level at September 30, 2014 were as follows (in thousands):
As of September 30, 2014 | |||||||||||||||
Total | Level 1 | Level 2 | Level 3 | ||||||||||||
Swiss Life collective foundation | $ | 5,608 | $ | — | $ | 5,608 | $ | — | |||||||
Taiwan collective trust | 523 | — | 523 | — | |||||||||||
Total | $ | 6,131 | $ | — | $ | 6,131 | $ | — | |||||||
See "Note 6. Fair Value Measurements" for a description of the levels of inputs used to determine fair value measurements.
Expected benefit payments over the next ten fiscal years are anticipated to be paid as follows (in thousands):
2015 | $ | 231 | |
2016 | 54 | ||
2017 | 55 | ||
2018 | 56 | ||
2019 | 57 | ||
2020-2024 | 664 | ||
The Company expects to contribute $0.3 million to its plans in fiscal year 2015 in order to meet the minimum funding targets.
Defined Contribution Plans
The Company sponsors defined contribution plans that meet the requirements of Section 401(k) of the Internal Revenue Code. All United States employees of the Company who meet minimum age and service requirements are eligible to participate in the plan. The plan allows employees to invest, on a pre-tax basis, a percentage of their annual salary subject to statutory limitations. The Company’s contribution expense for this United States defined contribution plan was $3.5 million, $3.2 million and $3.1 million for the fiscal years ended September 30, 2014, 2013 and 2012, respectively.
15. Stockholders’ Equity
Preferred Stock
At September 30, 2014 and 2013 there were one million shares of preferred stock, $0.01 par value per share authorized; no shares were issued or outstanding at September 30, 2014 or 2013. Preferred stock may be issued at the discretion of the Board of Directors without stockholder approval with such designations, rights and preferences as the Board of Directors may determine.
66
NOTES TO CONSOLIDATED FINANCIAL STATEMENTS - (Continued)
Accumulated Other Comprehensive Income
The following is a summary of the components of accumulated other comprehensive income, net of tax, at September 30, 2014, 2013 and 2012 (in thousands):
Currency Translation Adjustments | Unrealized Gains (Losses) on Available-for-Sale Securities | Unrealized Gains (Losses) on Cash Flow Hedges | Pension Liability Adjustments | Total | ||||||||||||||||
Balance at September 30, 2011 | $ | 26,917 | $ | (192 | ) | $ | — | $ | (9,401 | ) | $ | 17,324 | ||||||||
Other comprehensive income before reclassifications | (2,406 | ) | 408 | — | (606 | ) | (2,604 | ) | ||||||||||||
Amounts reclassified from accumulated other comprehensive income | — | (15 | ) | — | 8,937 | 8,922 | ||||||||||||||
Balance at September 30, 2012 | 24,511 | 201 | — | (1,070 | ) | 23,642 | ||||||||||||||
Other comprehensive income before reclassifications | (2,113 | ) | (114 | ) | 14 | 1,109 | (1,104 | ) | ||||||||||||
Amounts reclassified from accumulated other comprehensive income | — | (21 | ) | — | 87 | 66 | ||||||||||||||
Balance at September 30, 2013 | 22,398 | 66 | 14 | 126 | 22,604 | |||||||||||||||
Other comprehensive income before reclassifications | (6,296 | ) | (78 | ) | 79 | (503 | ) | (6,798 | ) | |||||||||||
Amounts reclassified from accumulated other comprehensive income | — | (26 | ) | (93 | ) | — | (119 | ) | ||||||||||||
Balance at September 30, 2014 | $ | 16,102 | $ | (38 | ) | $ | — | $ | (377 | ) | $ | 15,687 | ||||||||
Reclassifications from accumulated other comprehensive income, or AOCI, to net income related to available-for-sale securities result from sale of these securities as described in “Note 5. Marketable Securities.” Reclassifications from AOCI to net income related to cash flow hedges result from the settlement of this instrument as described in “Note 12. Derivative Instruments.” Reclassifications from AOCI to net income related to the Company’s pension plans relate to settlement losses under defined benefit pension plans as described in “Note 14. Postretirement Benefits.”
Noncontrolling Interests
Noncontrolling interests represents the minority shareholders’ proportionate share of the equity in the Company’s majority owned subsidiary, Brooks Automation Asia, Ltd. (“BAA”). The Company has historically consolidated the financial position and results of operations from BAA and presented the portion of the income attributable to the minority shareholders as “Net income attributable to noncontrolling interests” in the Consolidated Statements of Operations. In September 2014, the Company acquired the remaining interest in BAA from the minority shareholders for $3.2 million. Increases in ownership of a consolidated subsidiary are accounted for as equity transactions and as a result, no additional assets or liabilities were recognized related to the additional interest acquired. As of the date of acquisition, 100% of BAA’s pre-tax income has been reflected in the Company’s results of operations. The increase in the Company's proportional share of BAA's results were not material to the Company's results of operations for the fiscal year ended September 30, 2014. In addition, the Company will no longer report a noncontrolling interest in its Consolidated Balance Sheets. The payment to the minority shareholders has been classified as a financing activity on the Consolidated Statements of Cash Flows.
16. Stock Plans
Amended and Restated 2000 Equity Incentive Plan
The purposes of the Amended and Restated 2000 Equity Incentive Plan (the “2000 Plan”), are to attract and retain employees and to provide an incentive for them to assist the Company to achieve long-range performance goals and to enable them to participate in the long-term growth of the Company. Under the 2000 Plan the Company may grant (i) options intended to qualify as incentive stock options under Section 422 of the Internal Revenue Code, and (ii) options that are not qualified as incentive stock options (“nonqualified stock options”) and (iii) stock appreciation rights, performance awards and restricted stock. All employees of the Company or any affiliate of the Company, independent directors, consultants and advisors are eligible to participate in the 2000 Plan. Options under the 2000 Plan generally vest over four years and expire within ten years from the date of grant. A total of 9,000,000 shares of common stock was reserved for issuance under the 2000 Plan. As of September 30, 2014, no options are outstanding and 2,486,983 shares remain available for grant under the 2000 Plan.
67
NOTES TO CONSOLIDATED FINANCIAL STATEMENTS - (Continued)
Stock Options of Acquired Companies
In connection with the acquisition of Helix Technology Corporation ("Helix") on October 26, 2005, the Company assumed the outstanding options of multiple stock option plans that were adopted by Helix. At acquisition, 689,622 options to purchase shares of Helix common stock were outstanding and converted into 765,480 options to purchase shares of the Company’s common stock. A total of 5,550 options are outstanding and no shares remain available for grant under the Helix plans as of September 30, 2014.
Stock Option Activity
The following table summarizes stock option activity for all the above plans for the fiscal year ended September 30, 2014:
2014 | ||||||||||||
Shares | Weighted- Average Remaining Contractual Term | Weighted Average Price | Aggregate Intrinsic Value (In Thousands) | |||||||||
Options outstanding at September 30, 2013 | 15,540 | $ | 15.86 | |||||||||
Forfeited/expired | (9,990 | ) | $ | 17.34 | ||||||||
Options outstanding at September 30, 2014 | 5,550 | 0.3 years | $ | 13.20 | $ | — | ||||||
Vested at September 30, 2014 | 5,550 | 0.3 years | $ | 13.20 | $ | — | ||||||
Options exercisable at September 30, 2014 | 5,550 | 0.3 years | $ | 13.20 | $ | — | ||||||
Shares available for future grant | 2,486,983 | |||||||||||
Based on the Company’s closing stock price of $10.51 as of September 30, 2014, there was no intrinsic value to the option holders.
No stock options were granted in fiscal years 2014, 2013 or 2012. The total intrinsic value of options exercised during fiscal years 2014, 2013 or 2012 was $0, $19,000 and $56,000, respectively. The total cash received from participants as a result of stock option exercises during fiscal years 2014, 2013 or 2012 was $0, $67,000 and $103,000, respectively.
As of September 30, 2014, there was no future compensation cost related to stock options as all outstanding stock options have vested.
The Company settles employee stock option exercises with newly issued common shares.
Restricted Stock Activity
A summary of the status of the Company’s restricted stock as of September 30, 2014 and changes during the fiscal year is as follows:
2014 | ||||||
Shares | Weighted Average Grant-Date Fair Value | |||||
Outstanding at September 30, 2013 | 2,915,413 | $ | 11.25 | |||
Awards granted | 1,517,057 | $ | 9.49 | |||
Awards vested | (592,857 | ) | $ | 9.48 | ||
Awards canceled | (1,113,128 | ) | $ | 10.28 | ||
Outstanding at September 30, 2014 | 2,726,485 | $ | 11.05 | |||
The weighted average grant date fair value of restricted stock granted during fiscal years 2013 and 2012 was $9.33 and $11.80 per share, respectively. The fair value of restricted stock units vested during fiscal years 2014, 2013 and 2012 was $5.6 million, $7.3 million and $5.6 million, respectively.
As of September 30, 2014, the unrecognized compensation cost related to restricted stock units that is expected to vest is $17.2 million and will be recognized over an estimated weighted average amortization period of 1.7 years.
68
NOTES TO CONSOLIDATED FINANCIAL STATEMENTS - (Continued)
The Company grants restricted stock units that vest over a required service period and awards where vesting is dependent upon achieving certain operating performance goals. Restricted stock units granted with performance goals also have a required service period. The following table reflects restricted stock units granted, including awards related to the discontinued operation, during the years ended September 30, 2014, 2013 and 2012:
Total Units | Time-Based Units | Performance-Based Units | ||||||
Year ended September 30, 2014 | 1,517,057 | 678,307 | 838,750 | |||||
Year ended September 30, 2013 | 1,471,977 | 794,602 | 677,375 | |||||
Year ended September 30, 2012 | 1,887,419 | 767,169 | 1,120,250 | |||||
Units granted with a required service period typically have three year vesting schedules in which one-third vest at the first anniversary of the date of grant, one-third vest at the second anniversary of the date of grant and one-third vest at the third anniversary of the date of grant, except that time-based awards granted to the Company’s Board of Directors vest immediately. Performance-based units have performance criteria established by the Company’s Human Resources and Compensation Committee and the Board of Directors.
The criteria in performance-based awards are weighted and have minimum performance thresholds, which if not met result in no vesting as to that metric’s weighted percentage. Performance-based awards granted in fiscal year 2014 and 2013 included provisions where participants could achieve up to 200% of the targeted number of performance-based awards if the Company’s performance exceeds the target thresholds. The measurement of achievement against performance-based units granted in fiscal year 2014 and 2013 occurred at the end of the fiscal year in which the units were granted. The performance-based units granted in fiscal year 2012 had performance criteria to be measured over a three year period ending on September 30, 2014. The service requirements of the performance-based units are three years from date of grant. Performance-based units granted in fiscal 2014 and 2013 have three year vesting schedules in which one-half vest at the second anniversary of the date of grant and one-half vest at the third anniversary of the date of grant. The performance-based units granted in fiscal year 2012 had a three year vesting schedule in which all of the awards vested at the third anniversary of the date of grant.
In fiscal year 2014, the Company exceeded the financial objectives associated with the performance-based awards granted in fiscal year 2014. Under the terms of the award, a total of 1,297,546 shares could vest, subject to award holders satisfying the service requirement, which is an increase of 458,796 shares over of the target grant. The Company performed below target levels relative to the criteria outlined in awards granted in fiscal years 2013 and 2012. As a result, 460,615 shares of performance-based awards granted in fiscal year 2013 could vest, subject to award holders satisfying the service requirement, which is a decrease of 216,760 shares under the target grant. None of the performance-based awards granted in fiscal year 2012 will vest.
1995 Employee Stock Purchase Plan
On February 22, 1996, the stockholders approved the 1995 Employee Stock Purchase Plan (the “1995 Plan”) which enables eligible employees to purchase shares of the Company’s common stock. Under the 1995 Plan, eligible employees may purchase up to an aggregate of 3,000,000 shares during six-month offering periods commencing on February 1 and August 1 of each year at a price per share of 85% of the lower of the fair market value price per share on the first or last day of each six-month offering period. On February 8, 2012, the stockholders approved an amendment to the 1995 Plan to increase the number of shares of the Company’s common stock available for issuance by 1,000,000 shares, from 3,000,000 to 4,000,000 shares. Participating employees may elect to have up to 10% of their base pay withheld and applied toward the purchase of such shares. The rights of participating employees under the 1995 Plan terminate upon voluntary withdrawal from the plan at any time or upon termination of employment. As of September 30, 2014, 3,350,645 shares of common stock have been purchased under the 1995 Plan and 649,355 shares remain available for purchase.
17. Restructuring and Other Charges
Fiscal Year 2014 Activities
The Company recorded restructuring charges of $6.3 million for fiscal year 2014. These charges relate primarily to the Company's decision to discontinue certain product lines in the Brooks Life Science Systems and Brooks Product Solutions segments, the transition of manufacturing certain of the Company’s line of Polycold cryochillers and compressors to a third party contract manufacturer and other global programs designed to improve the Company’s cost structure.
Total severance charges related to the outsourcing of the Polycold manufacturing operation were $1.2 million, consisting of severance and retention fees. The charge for this program was recorded ratably over the period from notification of the closing in October 2012 to the actual service end date in September 2014.
69
NOTES TO CONSOLIDATED FINANCIAL STATEMENTS - (Continued)
Restructuring costs recorded in fiscal year 2014 consist of $5.7 million of severance costs and $0.6 million of facility related costs. Severance costs incurred in fiscal year 2014 relate to workforce reductions of approximately 70 positions. The Brooks Product Solutions segment incurred a severance charge of $2.4 million; the Brooks Global Services segment incurred a severance charge of $0.4 million; the Brooks Life Science Systems segment incurred severance charges of $1.6 million and $1.3 million was related to the reduction of positions in corporate and sales. Facility-related costs of $0.6 million consist of lease payments and fixed asset write-offs associated with our efforts to reduce the space used in our operations.
In addition to the workforce and facility-related charges described above, the Company recorded $0.3 million of inventory write-offs associated with discontinuing certain product lines. Inventory write-offs are included in cost of revenue in the Consolidated Statements of Operations.
Fiscal Year 2013 Activities
The Company recorded a restructuring charge of $6.4 million for fiscal year 2013. These charges related primarily to workforce reductions implemented to consolidate the operations of Crossing and the Company, to transition internal manufacturing of the Polycold product line to a third party contract manufacturer and other programs designed to improve the Company’s cost structure. Restructuring charges also included facility related costs incurred in connection with the consolidation of Crossing facilities with the Company’s facilities.
Restructuring costs recorded in fiscal year 2013 consisted of $5.5 million of severance costs and $0.8 million of facility related costs. Severance costs incurred in fiscal year 2013 related to the workforce reduction of approximately 200 positions. The Brooks Product Solutions segment incurred a severance charge of $2.5 million; the Brooks Global Services segment incurred a severance charge of $1.1 million; and the Company incurred $1.5 million related to the reduction of corporate positions. The Brooks Life Science Systems segment incurred severance charges of $0.4 million, mainly due to the consolidation of administrative functions. Restructuring and other charges recorded in fiscal year 2013 also included $0.1 million related to a partial settlement of a defined benefit pension plan that covered substantially all of the Company’s Swiss employees.
Fiscal Year 2012 Activities
The Company recorded a restructuring charge of $3.2 million for fiscal year 2012. These charges were related primarily to a series of workforce reductions implemented to improve the Company’s cost structure by eliminating 118 employees. The Brooks Product Solutions segment incurred a severance charge of $1.2 million; the Brooks Global Services segment incurred a severance charge of $1.0 million; and the Company incurred $0.7 million to reduce corporate support positions. The Brooks Life Science Systems segment incurred severance charges of $0.3 million to eliminate 14 positions, mainly due to the consolidation of administrative functions.
70
NOTES TO CONSOLIDATED FINANCIAL STATEMENTS - (Continued)
The activity related to the Company’s restructuring and other charges, excluding amounts related to the discontinued operations, for the fiscal years ended September 30, 2014, 2013 and 2012 are summarized below (in thousands):
Fiscal Year 2014 Activity | |||||||||||||||
Balance September 30, 2013 | Expense | Utilization | Balance September 30, 2014 | ||||||||||||
Facility and other contract termination costs | $ | 155 | $ | 583 | $ | (667 | ) | $ | 71 | ||||||
Workforce-related termination benefits | 1,257 | 5,706 | (3,559 | ) | 3,404 | ||||||||||
$ | 1,412 | $ | 6,289 | $ | (4,226 | ) | $ | 3,475 | |||||||
Fiscal Year 2013 Activity | |||||||||||||||
Balance September 30, 2012 | Expense | Utilization | Balance September 30, 2013 | ||||||||||||
Facility and other contract termination costs | $ | — | $ | 818 | $ | (663 | ) | $ | 155 | ||||||
Workforce-related termination benefits | 2,098 | 5,475 | (6,316 | ) | 1,257 | ||||||||||
$ | 2,098 | $ | 6,293 | $ | (6,979 | ) | $ | 1,412 | |||||||
Fiscal Year 2012 Activity | |||||||||||||||
Balance September 30, 2011 | Expense | Utilization | Balance September 30, 2012 | ||||||||||||
Workforce-related termination benefits | $ | 293 | $ | 3,153 | $ | (1,348 | ) | $ | 2,098 | ||||||
Accrued restructuring costs of $3.5 million as of September 30, 2014 are expected to be paid during fiscal year 2015.
18. Segment and Geographic Information
The Company reports financial results in three segments: Brooks Product Solutions, Brooks Global Services and Brooks Life Science Systems.
The Brooks Product Solutions segment provides a variety of products and solutions that enable improved throughput and yield in controlled operating environments. Those products include atmospheric and vacuum robots, robotic modules, and tool automation systems that provide precision handling and clean wafer environments as well as vacuum pumping and thermal management solutions used to create and control critical process vacuum applications.
The Brooks Global Services segment provides an extensive range of support services, including repair services, diagnostic support services, and installation services in support of the base equipment installed by the Company's Brooks Product Solutions segment, which enable its customers to maximize process tool uptime and productivity. This segment also provides end-user customers with spare parts to maximize customer tool productivity.
The Brooks Life Science Systems segment provides automated cold sample management systems for compound and bio sample storage, equipment for sample preparation and handling, consumables, and parts and support services to a wide range of life science customers including pharmaceutical companies, biotechnology companies, biobanks, national laboratories, research institutes and research universities.
The Company evaluates the performance of, and allocates resources to, each of its segments based on their revenues, operating income (loss) and returns on invested assets. Operating income (loss) for each segment includes selling, general and administrative expenses directly attributable to the segment. Other unallocated corporate expenses, amortization of acquired intangible assets (excluding completed technology) and restructuring and other charges, pension settlement and in-process research and development are excluded from the segments’ operating income (loss). The Company’s indirect overhead costs, which include various general and administrative expenses, are allocated among the segments based upon multiple cost drivers associated with the respective administrative function, including segment revenue, segment headcount, or an analysis of the segments that benefit from a specific administrative function. Segment assets exclude cash, cash equivalents, restricted cash, marketable securities, deferred tax assets, assets held for sale and equity method investments.
71
NOTES TO CONSOLIDATED FINANCIAL STATEMENTS - (Continued)
Financial information for the Company’s business segments, excluding amounts related to the discontinued operations, for the fiscal years ended September 30, 2014, 2013 and 2012 are as follows (in thousands):
Brooks Product Solutions | Brooks Global Services | Brooks Life Science Systems | Total | ||||||||||||
Year ended September 30, 2014 | |||||||||||||||
Revenue | |||||||||||||||
Product | $ | 325,639 | $ | 14,978 | $ | 46,415 | $ | 387,032 | |||||||
Services | — | 79,083 | 16,733 | 95,816 | |||||||||||
$ | 325,639 | $ | 94,061 | $ | 63,148 | $ | 482,848 | ||||||||
Gross profit | $ | 111,746 | $ | 32,168 | $ | 23,423 | $ | 167,337 | |||||||
Segment operating income (loss) | $ | 10,836 | $ | 12,451 | $ | (8,431 | ) | $ | 14,856 | ||||||
Depreciation expense | $ | 8,316 | $ | 2,361 | $ | 2,022 | $ | 12,699 | |||||||
Assets | $ | 252,944 | $ | 58,678 | $ | 103,498 | $ | 415,120 | |||||||
Year ended September 30, 2013 | |||||||||||||||
Revenue | |||||||||||||||
Product | $ | 290,523 | $ | 13,152 | $ | 31,336 | $ | 335,011 | |||||||
Services | — | 75,477 | 11,952 | 87,429 | |||||||||||
$ | 290,523 | $ | 88,629 | $ | 43,288 | $ | 422,440 | ||||||||
Gross profit | $ | 91,255 | $ | 26,912 | $ | 14,140 | $ | 132,307 | |||||||
Segment operating income (loss) | $ | 1,116 | $ | 9,592 | $ | (12,380 | ) | $ | (1,672 | ) | |||||
Depreciation expense | $ | 8,698 | $ | 2,746 | $ | 2,256 | $ | 13,700 | |||||||
Assets | $ | 226,759 | $ | 59,762 | $ | 105,221 | $ | 391,742 | |||||||
Year ended September 30, 2012 | |||||||||||||||
Revenue | |||||||||||||||
Product | $ | 351,432 | $ | 11,324 | $ | 39,749 | $ | 402,505 | |||||||
Services | — | 73,616 | 12,862 | 86,478 | |||||||||||
$ | 351,432 | $ | 84,940 | $ | 52,611 | $ | 488,983 | ||||||||
Gross profit | $ | 113,945 | $ | 25,093 | $ | 20,415 | $ | 159,453 | |||||||
Segment operating income (loss) | $ | 13,330 | $ | 8,898 | $ | (3,139 | ) | $ | 19,089 | ||||||
Depreciation expense | $ | 8,600 | $ | 2,344 | $ | 2,111 | $ | 13,055 | |||||||
72
NOTES TO CONSOLIDATED FINANCIAL STATEMENTS - (Continued)
A reconciliation of the Company’s reportable segment operating income (loss) and segment assets to the corresponding consolidated amounts as of and for the fiscal years ended September 30, 2014, 2013 and 2012 is as follows (in thousands):
As of and for the Year Ended September 30, | |||||||||||
2014 | 2013 | 2012 | |||||||||
Segment operating income (loss) | $ | 14,856 | $ | (1,672 | ) | $ | 19,089 | ||||
Other unallocated corporate expenses (1) | 5,096 | 3,002 | (1,833 | ) | |||||||
Amortization of acquired intangible assets | 6,170 | 5,694 | 4,164 | ||||||||
Impairment of acquired intangible assets | — | 50 | — | ||||||||
Restructuring and other charges | 6,289 | 6,380 | 3,153 | ||||||||
Pension settlement | — | — | 8,937 | ||||||||
In-process research and development | — | — | 3,026 | ||||||||
Total operating income (loss) | $ | (2,699 | ) | $ | (16,798 | ) | $ | 1,642 | |||
Segment assets | $ | 415,120 | $ | 391,742 | |||||
Cash, cash equivalents, restricted cash and marketable securities | 245,456 | 173,539 | |||||||
Deferred tax assets | 86,572 | 115,985 | |||||||
Assets held for sale | — | 27,778 | |||||||
Equity method investments | 28,944 | 25,687 | |||||||
Other unallocated corporate net assets | 1,946 | 2,032 | |||||||
Total assets | $ | 778,038 | $ | 736,763 | |||||
______________
(1) | Other unallocated corporate expenses for the fiscal year ended September 30, 2012 includes a credit of $3.3 million related to insurance proceeds received as reimbursement of litigation costs previously incurred. |
Net revenue based upon the source of the order by geographic area for the fiscal years ended September 30, 2014, 2013 and 2012 are as follows (in thousands):
Year Ended September 30, | |||||||||||
2014 | 2013 | 2012 | |||||||||
North America | $ | 174,343 | $ | 177,779 | $ | 214,060 | |||||
Asia/Pacific | 198,695 | 154,358 | 183,406 | ||||||||
Europe | 109,810 | 90,303 | 91,517 | ||||||||
$ | 482,848 | $ | 422,440 | $ | 488,983 | ||||||
Property, plant and equipment by geographic area as of September 30, 2014 and 2013 are as follows (in thousands):
September 30, | |||||||||
2014 | 2013 | ||||||||
North America | $ | 40,232 | $ | 38,505 | |||||
Asia/Pacific | 870 | 1,646 | |||||||
Europe | 9,081 | 7,355 | |||||||
$ | 50,183 | $ | 47,506 | ||||||
19. Significant Customers
The Company had one customer that accounted for more than 10% of revenue, at 11%, 11%, and 13%, in the fiscal years ended September 30, 2014, 2013 and 2012, respectively. The Company did not have any customers that accounted for more than 10% of its accounts receivable balance at September 30, 2014 or 2013.
For purposes of determining the percentage of revenue from any original equipment manufacturer ("OEM") customer, the Company does not include revenue from products sold to a contract manufacturer customer which in turn sells to the OEM. If the Company included revenue from products sold to contract manufacturer customers supporting the Company's OEM customers, the percentage of the Company's total revenue derived from certain OEM customers would be higher.
73
NOTES TO CONSOLIDATED FINANCIAL STATEMENTS - (Continued)
20. Other Balance Sheet Information
The following is a summary of accounts receivable at September 30, 2014 and 2013 (in thousands):
September 30, | |||||||
2014 | 2013 | ||||||
Accounts receivable | $ | 81,270 | $ | 78,460 | |||
Less allowance for doubtful accounts | (1,031 | ) | (863 | ) | |||
Less allowance for sales returns | (133 | ) | (114 | ) | |||
$ | 80,106 | $ | 77,483 | ||||
The allowance for doubtful accounts activity for the fiscal years ended September 30, 2014, 2013 and 2012 was as follows (in thousands):
Description | Balance at Beginning of Period | Provisions | Reversals of Bad Debt Expense | Write-offs and Adjustments | Balance at End of Period | |||||||||||||||
2014 Allowance for doubtful accounts | $ | 863 | $ | 438 | $ | (315 | ) | $ | 45 | $ | 1,031 | |||||||||
2013 Allowance for doubtful accounts | 851 | 48 | (143 | ) | 107 | 863 | ||||||||||||||
2012 Allowance for doubtful accounts | 617 | 367 | (130 | ) | (3 | ) | 851 | |||||||||||||
As part of the acquisition of Crossing in fiscal year 2013, the Company acquired a contract in which a certain customer has a right of return on the purchase of spare parts. The allowance for returns activity for the fiscal years ended September 30, 2014 and 2013 was as follows (in thousands):
Description | Balance at Beginning of Period | Provisions | Write-offs and Adjustments | Balance at End of Period | |||||||||||
2014 Allowance for sales returns | $ | 114 | $ | 19 | $ | — | $ | 133 | |||||||
2013 Allowance for sales returns | — | 72 | 42 | 114 | |||||||||||
The following is a summary of inventories at September 30, 2014 and 2013, excluding amounts related to discontinued operations (in thousands):
September 30, | |||||||
2014 | 2013 | ||||||
Inventories | |||||||
Raw materials and purchased parts | $ | 57,250 | $ | 57,678 | |||
Work-in-process | 20,068 | 19,991 | |||||
Finished goods | 16,249 | 16,742 | |||||
$ | 93,567 | $ | 94,411 | ||||
Reserves for excess and obsolete inventory were $26.0 million and $24.2 million, excluding amounts related to discontinued operations, at September 30, 2014 and 2013, respectively. The Company recorded charges to reserves for excess and obsolete inventory of $6.9 million, $5.4 million and $4.3 million in fiscal years 2014, 2013 and 2012, respectively. The Company reduced the reserves for excess and obsolete inventory by $5.1 million, $4.3 million and $5.8 million, in fiscal years 2014, 2013 and 2012, respectively, for disposals of inventory.
74
NOTES TO CONSOLIDATED FINANCIAL STATEMENTS - (Continued)
The Company provides for the estimated cost of product warranties, primarily from historical information, at the time product revenue is recognized and retrofit accruals at the time retrofit programs are established. The Company’s warranty obligation is affected by product failure rates, utilization levels, material usage, service delivery costs incurred in correcting a product failure, and supplier warranties on parts delivered to the Company. Product warranty and retrofit activity on a gross basis for the fiscal years ended September 30, 2014, 2013 and 2012, excluding amounts related to discontinued operations, is as follows (in thousands):
Balance at September 30, 2011 | $ | 7,438 | |
Adjustments for acquisitions and divestitures | 7 | ||
Accruals for warranties during the year | 13,551 | ||
Costs incurred during the year | (13,750 | ) | |
Balance at September 30, 2012 | 7,246 | ||
Adjustments for acquisitions and divestitures | 1,187 | ||
Accruals for warranties during the year | 9,968 | ||
Costs incurred during the year | (11,141 | ) | |
Balance at September 30, 2013 | 7,260 | ||
Adjustments for acquisitions and divestitures | 364 | ||
Accruals for warranties during the year | 9,969 | ||
Costs incurred during the year | (11,094 | ) | |
Balance at September 30, 2014 | $ | 6,499 | |
21. Sale of Building and Land
On September 27, 2013, the Company completed a Purchase and Sale Agreement ("Agreement") to sell a portion of its Chelmsford, Massachusetts campus to a real estate investment trust for $11.3 million. The property sold was an underutilized building and the related land. The components of the gain on the sale is as follows (in thousands):
Sale proceeds | $ | 11,275 | |
Net book value of building and land | (6,095 | ) | |
Deferred leasing costs and other | (3,718 | ) | |
Direct transaction costs | (437 | ) | |
Gain on the sale of building and land | $ | 1,025 | |
In December 2012, the Company entered into an agreement to lease this property to an unrelated third party. Unamortized deferred costs of $3.7 million, consisting primarily of commissions and tenant allowances, were written off and included in the determination of the gain on the sale. Direct transaction costs, consisting of broker commissions and legal fees were also included in the determination of the gain on the sale.
In addition, in fiscal year 2013, the Company sold certain buildings in Oberdiessbach, Switzerland for total proceeds of $3.2 million. The sale of these assets resulted in a gain of $0.2 million.
Gains related to the sale of these buildings are recorded in the Company's Consolidated Statements of Operations as a component of other income, net.
22. Commitments and Contingencies
Capital Lease Obligation
In March 2014, the Company exercised an option to renew the lease of a building and the related land on the Company's Chelmsford, Massachusetts campus. The Company has leased this building since 2002. By exercising this option, the Company has also contracted to purchase the building at the end of the lease period. The assets acquired under the lease were recorded at the net present value of the minimum lease payments which was then allocated to the building and the land based on their relative fair values. The cost of the building and the land under the capital lease are included in the Consolidated Balance Sheets as property, plant and equipment at $6.4 million and $2.1 million, respectively. Depreciation expense related to the building is computed using the straight-line method over the estimated useful life of the asset. Accumulated amortization related to the lease was $0.1 million at September 30, 2014.
75
NOTES TO CONSOLIDATED FINANCIAL STATEMENTS - (Continued)
The obligation related to the capital lease is recorded as a short-term or long-term obligation in the Consolidated Balance Sheets depending on when payments are due. The future minimum lease payments required under the capital lease and the present value of the net minimum lease payments, as of September 30, 2014, are as follows (in thousands):
Year ended September 30, | |||
2015 | $ | 881 | |
2016 | 881 | ||
2017 | 881 | ||
2018 | 6,901 | ||
Total minimum lease payments | 9,544 | ||
Less amounts representing interest | 1,246 | ||
Total capital lease obligation | 8,298 | ||
Less current portion of capital lease obligation | 881 | ||
Long-term capital lease obligation | $ | 7,417 | |
Operating Leases Commitments
The Company leases manufacturing and office facilities and certain equipment under operating leases that expire through 2019. Rental expense under operating leases, excluding expense recorded as a component of restructuring, for the fiscal years ended September 30, 2014, 2013 and 2012 was $8.2 million, $8.4 million and $4.8 million, respectively. Future minimum lease commitments on non-cancelable operating leases as of September 30, 2014 are as follows (in thousands):
Year ended September 30, 2015 | $ | 5,140 | |
2016 | 3,384 | ||
2017 | 1,748 | ||
2018 | 1,401 | ||
2019 | 706 | ||
Thereafter | 93 | ||
$ | 12,472 | ||
The Company is a guarantor on a lease in Mexico that expires in January 2018. As of September 30, 2014, the remaining payments under this lease are approximately $1.4 million.
Letters of Credit
At September 30, 2014, the Company had $21.1 million of letters of credit outstanding related primarily to customer advances and other performance obligations. These arrangements guarantee the refund of advance payments received from customers in the event that the product is not delivered or warranty obligations are not fulfilled in compliance with the terms of the contract. While the Company does not anticipate that these obligations will be called, they could be called by the beneficiaries at any time before the expiration date of the particular letter of credit should the Company fail to meet certain contractual requirements.
Purchase Commitments
The Company has non-cancelable contracts and purchase orders for inventory of $71.0 million at September 30, 2014.
Contingencies
The Company is subject to various legal proceedings, both asserted and unasserted, that arise in the ordinary course of business. The Company cannot predict the ultimate outcome of such legal proceedings or in certain instances provide reasonable ranges of potential losses. However, as of the date of this report, the Company believes that none of these claims will have a material adverse effect on its consolidated financial condition or results of operations. In the event of unexpected subsequent developments and given the inherent unpredictability of these legal proceedings, there can be no assurance that the Company's assessment of any claim will reflect the ultimate outcome and an adverse outcome in certain matters could, from time to time, have a material adverse effect on the Company's consolidated financial condition or results of operations in particular quarterly or annual periods.
23. Subsequent Events
On October 1, 2014, the Company acquired all of the outstanding stock of FluidX Ltd. (“FluidX”), a UK based provider of biological sample storage tubes and complementary bench-top instruments. The Company agreed to a purchase price of approximately $16.0 million of cash, subject to a working capital adjustment. The acquisition of FluidX provides the Company
76
NOTES TO CONSOLIDATED FINANCIAL STATEMENTS - (Continued)
with the opportunity to enhance its existing capabilities with respect to biobanking solutions in the Life Science Systems segment.
On November 5, 2014, the Company’s Board of Directors declared a cash dividend of $0.10 per share payable on December 26, 2014 to common stockholders of record on December 5, 2014. Dividends are declared at the discretion of the Company’s Board of Directors and depend on actual cash from operations, the Company’s financial condition and capital requirements and any other factors the Company’s Board of Directors may consider relevant. Future dividend declarations, as well as the record and payment dates for such dividends, will be determined by the Company’s Board of Directors on a quarterly basis.
77
Item 9. | Changes In and Disagreements With Accountants on Financial Accounting and Financial Disclosure |
As previously reported, effective November 20, 2012, the Audit Committee of the Company’s Board of Directors elected not to retain PricewaterhouseCoopers LLP as its independent registered public accounting firm and engaged BDO USA, LLP as the Company’s independent registered public accounting firm for fiscal year 2013. This change in accounting firms was reported in the Company’s Form 8-K filed with the United States Securities and Exchange Commission on November 27, 2012.
Item 9A. | Controls and Procedures |
Evaluation of Disclosure Controls and Procedures
Under the supervision and with the participation of our management, including our chief executive officer and chief financial officer, we conducted an evaluation of our disclosure controls and procedures, as such term is defined under Rule 13a-15(e) promulgated under the Exchange Act. Disclosure controls and procedures are designed to ensure that information required to be disclosed by us in the reports we file or submit under the Exchange Act is recorded, processed, summarized and reported on a timely basis and that such information is accumulated and communicated to management, including the chief executive officer and chief financial officer, as appropriate, to allow timely decisions regarding required disclosure. Based upon this evaluation, our chief executive officer and our chief financial officer concluded that our disclosure controls and procedures were effective as of the end of the period covered by this annual report.
Management’s Report on Internal Control Over Financial Reporting
Our management is responsible for establishing and maintaining adequate internal control over financial reporting. Internal control over financial reporting is defined in Rules 13a-15(f) and 15d-15(f) under the Exchange Act, as a process designed by, or under the supervision of our chief executive and chief financial officers and effected by our board of directors, management and other personnel to provide reasonable assurance regarding the reliability of financial reporting and the preparation of financial statements for external purposes in accordance with generally accepted accounting principles and includes those policies and procedures that:
• | pertain to the maintenance of records that in reasonable detail accurately and fairly reflect the transactions and disposition of our assets; |
• | provide reasonable assurance that transactions are recorded as necessary to permit preparation of financial statements in accordance with generally accepted accounting principles, and that our receipts and expenditures are being made only in accordance with authorization of our management and directors; and |
• | provide reasonable assurance regarding prevention or timely detection of unauthorized acquisition, use or disposition of our assets that could have a material effect on the financial statements. |
Because of its inherent limitations, internal control over financial reporting may not prevent or detect misstatements. Projections of any evaluation of effectiveness to future periods are subject to the risks that controls may become inadequate because of changes in conditions, or that the degree of compliance with the policies or procedures may deteriorate.
Under the supervision and with the participation of our management, including our chief executive officer and chief financial officer, we conducted an assessment of the effectiveness of our internal control over financial reporting as of September 30, 2014. In making this assessment, we used the criteria set forth in the 1992 framework established by the Committee of Sponsoring Organizations of the Treadway Commission (COSO) in Internal Control-Integrated Framework. Based on our assessment, we concluded that, as of September 30, 2014, our internal control over financial reporting was effective.
Our audited consolidated financial statements include the results of Dynamic Micro Systems Semiconductor Equipment GmbH, or DMS, which we acquired in April 2014. The scope of our assessment of the effectiveness of our internal control over financial reporting as of September 30, 2014 does not include the internal controls of DMS as management determined that it would not be practical to conduct a sufficiently comprehensive assessment of the internal controls of DMS based on the date of the acquisition and managements’ other time commitments. Guidance issued by the Securities and Exchange Commission permits companies to exclude acquisitions from their assessment of internal control over financial reporting for the first fiscal year in which the acquisition occurred. Our consolidated revenue for the fiscal year ended September 30, 2014 was $482.8 million, of which DMS represented $5.5 million. Our total assets as of September 30, 2014 were $778.0 million, of which DMS tangible assets represented $22.3 million. Our net assets as of September 30, 2014 were $642.9 million, of which DMS represented $16.6 million.
The effectiveness of our internal control over financial reporting as of September 30, 2014 has been audited by BDO USA LLP, an independent registered public accounting firm, as stated in the following report:
78
Report of Independent Registered Public Accounting Firm
Board of Directors and Stockholders
Brooks Automation, Inc.
Chelmsford, Massachusetts
We have audited Brooks Automation Inc.’s internal control over financial reporting as of September 30, 2014, based on criteria established in Internal Control - Integrated Framework (1992) issued by the Committee of Sponsoring Organizations of the Treadway Commission (the COSO criteria). Brooks Automation, Inc.’s management is responsible for maintaining effective internal control over financial reporting and for its assessment of the effectiveness of internal control over financial reporting, included in the accompanying Management Report on Internal Control Over Financial Reporting appearing under Item 9A. Our responsibility is to express an opinion on the Company’s internal control over financial reporting based on our audit.
We conducted our audit in accordance with the standards of the Public Company Accounting Oversight Board (United States). Those standards require that we plan and perform the audit to obtain reasonable assurance about whether effective internal control over financial reporting was maintained in all material respects. Our audit included obtaining an understanding of internal control over financial reporting, assessing the risk that a material weakness exists, and testing and evaluating the design and operating effectiveness of internal control based on the assessed risk. Our audit also included performing such other procedures as we considered necessary in the circumstances. We believe that our audit provides a reasonable basis for our opinion.
A company’s internal control over financial reporting is a process designed to provide reasonable assurance regarding the reliability of financial reporting and the preparation of financial statements for external purposes in accordance with generally accepted accounting principles. A company’s internal control over financial reporting includes those policies and procedures that (1) pertain to the maintenance of records that, in reasonable detail, accurately and fairly reflect the transactions and dispositions of the assets of the company; (2) provide reasonable assurance that transactions are recorded as necessary to permit preparation of financial statements in accordance with generally accepted accounting principles, and that receipts and expenditures of the company are being made only in accordance with authorizations of management and directors of the company; and (3) provide reasonable assurance regarding prevention or timely detection of unauthorized acquisition, use, or disposition of the company’s assets that could have a material effect on the financial statements.
Because of its inherent limitations, internal control over financial reporting may not prevent or detect misstatements. Also, projections of any evaluation of effectiveness to future periods are subject to the risk that controls may become inadequate because of changes in conditions, or that the degree of compliance with the policies or procedures may deteriorate.
As indicated in the accompanying Item 9A, Management's Report on Internal Control Over Financial Reporting, management's assessment of and conclusion on the effectiveness of internal control over financial reporting did not include the internal controls of Dynamic Micro Systems Semiconductor Equipment GmbH (“DMS”), which was acquired on April 30, 2014, and which is included in the consolidated balance sheet of Brooks Automation, Inc. as of September 30, 2014, and the related consolidated statement of operations, comprehensive income (loss), changes in equity, and cash flows for the year then ended. DMS constituted 3% and 3% of total assets and net assets, respectively, as of September 30, 2014, and 1% of revenues for the year then ended. Management did not assess the effectiveness of internal control over financial reporting of DMS because of the timing of the acquisition which was completed on April 30, 2014. Our audit of internal control over financial reporting of Brooks Automation, Inc. also did not include an evaluation of the internal control over financial reporting of DMS.
In our opinion, Brooks Automation, Inc. maintained, in all material respects, effective internal control over financial reporting as of September 30, 2014, based on the COSO criteria.
We also have audited, in accordance with the standards of the Public Company Accounting Oversight Board (United States), the consolidated balance sheet of Brooks Automation, Inc. as of September 30, 2014 and the related consolidated statements of operations, comprehensive income (loss), changes in equity, and cash flows for the year then ended and our report dated November 13, 2014 expressed an unqualified opinion thereon.
/s/ BDO USA, LLP
Boston, Massachusetts
November 13, 2014
Changes in Internal Control Over Financial Reporting
There were no changes in internal control over financial reporting during the fiscal fourth quarter ended September 30, 2014, that have materially affected, or are reasonably likely to materially affect, our internal control over financial reporting.
79
Item 9B. | Other Information |
None.
PART III
Item 10. | Directors, Executive Officers and Corporate Governance |
The information required by this Item 10 is contained in our definitive proxy statement for our 2015 annual meeting of shareholders to be filed by us within 120 days after the close of our fiscal year (the "2015 Proxy Statement") under the caption "Proposal No. 1-Election of Directors," "Other Matters-Section 16(a) Beneficial Ownership Compliance," "Other Matters-Standards of Conduct," "Other Matters-Stockholder Proposals and Recommendations for Directors" and "Corporate Governance" and is incorporated herein by reference.
Item 11. | Executive Compensation |
The information required by this Item 11 is contained under the caption "Corporate Governance and Director Compensation" and "Executive Officers" in the 2015 Proxy Statement to be filed by us within 120 days after the close of our fiscal year and is incorporated herein by reference.
Item 12. | Security Ownership of Certain Beneficial Owners and Management and Related Stockholder Matters |
The information required by this Item 12 is contained under the caption "General Information-Security Ownership of Certain Beneficial Owners" and "Equity Compensation Plan Information" in the 2015 Proxy Statement to be filed by us within 120 days after the close of our fiscal year and is incorporated herein by reference.
Item 13. | Certain Relationships and Related Transactions, and Director Independence |
The information required by this Item 13 is contained under the caption "Related Party Transactions" and "Corporate Governance and Director Compensation" in the 2015 Proxy Statement to be filed by us within 120 days after the close of our fiscal year and is incorporated herein by reference.
Item 14. | Principal Accountant Fees and Services |
The information required by this Item 14 is contained under the caption "Independent Auditor Fees and Other Matters" in the 2015 Proxy Statement to be filed by us within 120 days after the close of our fiscal year and is incorporated herein by reference.
PART IV
Item 15. | Exhibits and Financial Statement Schedules |
(a) Financial Statements and Financial Statement Schedules
The consolidated financial statements of the Company are listed in the index under Part II, Item 8, in this Form 10-K.
Other financial statement schedules are omitted because of the absence of conditions under which they are required or because the required information is given in the supplementary consolidated financial statements or notes thereto.
(b) Exhibits
Exhibit No. | Description | |
3.01 | Restated Certificate of Incorporation of the Company (incorporated herein by reference to Exhibit 3.01 to the Company’s registration statement on Form S-3 (Reg. No. 333-189582), filed on June 25, 2013). | |
3.02 | Amended and Restated Bylaws (incorporated herein by reference to Exhibit 3.01 of the Company's current report on Form 8-K, filed on February 11, 2008). | |
4.01 | Specimen Certificate for shares of the Company's common stock (incorporated herein by reference to the Company's registration statement on Form S-3 (Reg. No. 333-88320), filed on May 15, 2002). | |
10.01 | Shareholders’ Agreement, dated as of June 30, 2006, among Yaskawa Electric Corporation, Brooks Automation, Inc. and Yaskawa Brooks Automation, Inc. (incorporated herein by reference to Exhibit 10.01 to the Company's 2010 10-K, filed on November 23, 2010 (the "2010 10-K")). | |
10.02 | U.S. Robot Supply Agreement, made as of June 30, 2006, by and between Brooks Automation, Inc. and Yaskawa Electric Corporation (incorporated herein by reference to Exhibit 10.02 to the 2010 10-K). | |
10.03 | Brooks Japan Robot Supply Agreement, made as of June 30, 2006, by and between Yaskawa Brooks Automation, Inc. and Brooks Automation, Inc. (incorporated herein by reference to Exhibit 10.03 to the 2010 10-K). | |
10.04 | Basic agreement between the Company and Ulvac Corporation dated August 17, 1981 (incorporated herein by reference to Exhibit 10.13 of the registration statement on Form S-2 (Reg. No. 2-84880) filed by Helix Technology Corporation). | |
10.05 | Form of Indemnification Agreement for directors and officers of the Company (incorporated herein by reference to the Company's registration statement on Form S-1 (Reg. No. 333-87296), filed on December 13, 1994 (the “Brooks S-1”)). | |
10.06 | Employment Agreement, effective as of April 5, 2010, by and between Brooks Automation, Inc. and Stephen S. Schwartz (incorporated herein by reference to Exhibit 10.01 to the Company's quarterly report on Form 10-Q for the fiscal quarter ended March 31, 2010, filed on May 6, 2010). | |
10.07 | Offer letter dated December 1, 2011 between the Company and Mark D. Morelli (incorporated herein by reference to Exhibit 10.08 to the Company's annual report on Form 10-K for the fiscal year ended September 30, 2012, as filed on November 21, 2012 (the “2012 10-K”)). | |
10.08 | Offer letter dated September 5, 2013 between the Company and Lindon G. Robertson (incorporated herein by reference to Exhibit 10.11 to the Company's 2013 10-K, filed on November 22, 2013). | |
10.09 | 1995 Employee Stock Purchase Plan, as amended (incorporated herein by reference to Exhibit 10.13 to the 2010 10-K). | |
10.10 | Second Amended and Restated 2000 Equity Incentive Plan, restated as of May 7, 2013 (incorporated herein by reference to Exhibit 10.01 to the Company's current report on Form 8-K, filed on May 9, 2013). | |
10.11 | Helix Technology Corporation 1996 Equity Incentive Plan (incorporated herein by reference to Exhibit 4.1 of the Company's registration statement on Form S-8 (Reg. No. 333-129724), filed on November 16, 2005). | |
10.12 | Form of 2000 Equity Incentive Plan New Employee Nonqualified Stock Option Agreement (incorporated herein by reference to Exhibit 10.18 to the 2010 10-K). | |
10.13 | Form of 2000 Equity Incentive Plan Existing Employee Nonqualified Stock Option Agreement (incorporated herein by reference to Exhibit 10.19 to the 2010 10-K). | |
10.14 | Form of 2000 Equity Incentive Plan Director Stock Option Agreement (incorporated herein by reference to Exhibit 10.20 to the 2010 10-K). | |
10.15 | Form of Restricted Stock Agreement (incorporated herein by reference to Exhibit 10.21 to the 2010 10-K). | |
10.16 | Form of Restricted Stock Unit Award Notice (incorporated herein by reference to Exhibit 10.18 to the Company's annual report on Form 10-K for the fiscal year ended September 30, 2011, as filed on November 28, 2011 (the “2011 10-K”)) . | |
10.17 | Non-Employee Directors Stock Grant/Restricted Stock Unit Election Form (incorporated herein by reference to Exhibit 10.40 to the 2010 10-K). | |
10.18 | Brooks Automation, Inc. Deferred Compensation Plan, as amended (incorporated herein by reference to Exhibit 10.25 to the 2010 10-K). | |
10.19 | Amendment No. 2008-01 to the Brooks Automation, Inc. Deferred Compensation Plan (incorporated herein by reference to Exhibit 10.01 to the Company's quarterly report on Form 10-Q for the quarter ended June 30, 2008, filed on August 8, 2008). | |
10.20 | Lease between the Company and BerCar II, LLC for 12 Elizabeth Drive, Chelmsford, Massachusetts dated October 23, 2002 (incorporated herein by reference to Exhibit 10.28 to the Company's 2008 10-K filed on November 26, 2008 (the "2008 10-K")). | |
10.21 | First Amendment to Lease between the Company and BerCar II, LLC for 12 Elizabeth Drive, Chelmsford, Massachusetts dated November 1, 2002 (incorporated herein by reference to Exhibit 10.29 to the 2008 10-K). | |
81
10.21.1 | Amendment to Lease between the Company and BerCar II, LLC for 12 Elizabeth Drive, Chelmsford, Massachusetts dated September 30, 2013 (incorporated herein by reference to Exhibit 10 to the Company's quarterly report on Form 10-Q for the quarter ended March 30, 2014, filed on May 8, 2014). | |
10.22 | Lease, dated May 14, 1999, between MUM IV, LLC as Lessor and the Company as Lessee (incorporated herein by reference to Exhibit 10.30 to the 2010 10-K). | |
10.23 | Lease dated September 6, 2001 between The Harry Friedman and Edith B. Friedman Revocable Living Trust Dated May 15, 1986 et al as Lessor and the Company (IGC - Polycold Systems Inc.) as Lessee (incorporated herein by reference to Exhibit 10.37 to the 2010 10-K). | |
10.24 | Lease dated August 8, 2008 between the Company and Koll/Intereal Bay Area for 4051 Burton Drive, Santa Clara, CA (incorporated herein by reference to Exhibit 10.38 to the 2008 10-K). | |
10.25 | Standard Industrial lease dated May 31, 2010 by and between Brooks Automation, Inc. (formerly Nexus Biosystems, Inc.) and Crest Partners-Poway One Danielson for 14100 Danielson Street, Building 100, Poway, California (incorporated herein by reference to Exhibit 10.29 to the 2011 10-K). | |
10.26 | Purchase Agreement dated July 31, 2013 between Brooks Automation, Inc. and Ram Management Co., Inc. (incorporated herein by reference to Exhibit 10.01 to the Company's current report on Form 8-K filed on August 5, 2013). | |
10.27 | Asset Purchase Agreement dated March 17, 2014 by and between Brooks Automation, Inc. and MKS Instruments, Inc., as amended (incorporated herein by reference to Exhibit 10.1 to the Company's current report on Form 8-K, filed on May 30, 2014). | |
10.28 | Share Purchase and Transfer Agreement, effective as of April 29, 2014, by and among Brooks Automation, Inc., Brooks Automation (Germany) GmbH, DMS Beteiligungs GmbH, and HSH Nordbank AG (incorporated herein by reference to Exhibit 2.1 to the Company's current report on Form 8-K, filed on May 5, 2014). | |
16.1 | Letter of PricewaterhouseCoopers LLP dated November 27, 2012 (incorporated herein by reference to Exhibit 16.1 to the Company's current report on Form 8-K filed on November 27, 2012). | |
21.01 | Subsidiaries of the Company. | |
23.01 | Consent of BDO (Independent registered public accounting firm for the Company). | |
23.02 | Consent of PricewaterhouseCoopers LLP (Independent registered public accounting firm for the Company). | |
31.01 | Certification of the Company's Principal Executive Officer pursuant to Section 302 of the Sarbanes-Oxley Act of 2002. | |
31.02 | Certification of the Company's Principal Financial Officer pursuant to Section 302 of the Sarbanes-Oxley Act of 2002. | |
32 | Certification of the Company's Principal Executive Officer and Principal Financial Officer pursuant to Section 906 of the Sarbanes-Oxley Act of 2002. | |
101 | The following material from the Company's Annual Report on Form 10-K, for the year ended September 30, 2014, formatted in XBRL (Xtensible Business Reporting Language): (i) the Consolidated Balance Sheets; (ii) the Consolidated Statements of Operations; (iii) the Consolidated Statements of Comprehensive Income (Loss) (iv) the Consolidated Statements of Cash Flows; (v) the Consolidated Statements of Changes in Equity; and (vi) the Notes to Consolidated Financial Statements. | |
82
SIGNATURES
Pursuant to the requirements of Section 13 or 15(d) of the Securities Exchange Act of 1934, the registrant has duly caused this report to be signed on its behalf by the undersigned, thereunto duly authorized.
BROOKS AUTOMATION, INC. | |
By: | /S/ STEPHEN S. SCHWARTZ |
Stephen S. Schwartz Chief Executive Officer | |
Date: November 13, 2014
Pursuant to the requirements of the Securities Exchange Act of 1934, this report has been signed below by the following persons on behalf of the registrant and in the capacities and on the dates indicated.
Signature | Title | Date |
/S/ STEPHEN S. SCHWARTZ | Director and Chief Executive Officer | November 13, 2014 |
Stephen S. Schwartz | (Principal Executive Officer) | |
/S/ LINDON G. ROBERTSON | Executive Vice President and | November 13, 2014 |
Lindon G. Robertson | Chief Financial Officer | |
(Principal Financial Officer) | ||
/S/ DAVID PIETRANTONI | Vice President - Finance and | November 13, 2014 |
David Pietrantoni | Corporate Controller | |
(Principal Accounting Officer) | ||
/S/ A. CLINTON ALLEN | Director | November 13, 2014 |
A. Clinton Allen | ||
/S/ ROBYN C. DAVIS | Director | November 13, 2014 |
Robyn C. Davis | ||
/S/ JOSEPH R. MARTIN | Director | November 13, 2014 |
Joseph R. Martin | ||
/S/ JOHN K. MCGILLICUDDY | Director | November 13, 2014 |
John K. McGillicuddy | ||
/S/ KRISHNA G. PALEPU | Director | November 13, 2014 |
Krishna G. Palepu | ||
/S/ KIRK P. POND | Director | November 13, 2014 |
Kirk P. Pond | ||
/S/ ALFRED WOOLLACOTT III | Director | November 13, 2014 |
Alfred Woollacott III | ||
/S/ MARK S. WRIGHTON | Director | November 13, 2014 |
Mark S. Wrighton | ||
/S/ ELLEN M. ZANE | Director | November 13, 2014 |
Ellen M. Zane | ||
83