Attached files
| file | filename |
|---|---|
| 8-K - FORM 8-K - XERIUM TECHNOLOGIES INC | d251823d8k.htm |
| EX-99.3 - SUPPLEMENTAL RECONCILIATIONS OF NON-GAAP INFORMATION - XERIUM TECHNOLOGIES INC | d251823dex993.htm |
| EX-99.1 - PRESS RELEASE - XERIUM TECHNOLOGIES INC | d251823dex991.htm |
 Xerium Technologies, Inc.
Third Quarter 2011
Selected Data –
Earnings Call
November 9, 2011
EXHIBIT 99.2 |
 Forward Looking Statements
•
This presentation and the remarks we may make today about Xerium’s future
expectations, plans and prospects are forward-looking statements which
reflect our current views with respect to future events and financial
performance. Any forward- looking statements which we make in this
presentation or in our remarks today, represent our views only as of today.
We disclaim any duty to update any of these forward-looking
statements. •
Forward-looking statements involve risks and uncertainties, both known and
unknown. Our actual results may differ materially from these
forward-looking statements due to a number of factors, including those
factors discussed in our earnings
press
release
dated
November
8,
2011,
and
other
factors
discussed
in
our
filings with the SEC, including our Form 10-K for the year ended December 31,
2010 and our Form 10-Qs for the quarters ended March 31 and June 30,
2011. Copies of these filings are available from the SEC and in the
investor relations section of our website at
www.xerium.com. •
These slides, the associated remarks and comments made during our third quarter
2011 financial results conference call, our earnings release dated November
8, 2011 and the reconciliation of certain non-GAAP financial
information posted in the investor relations section of our website are
integrally related and are intended to be presented and understood
together. 2 |
 Bookings Analysis –
Total Xerium
Order bookings for Q3 2011 were $134.5M compared to Q3 2010 of $142.7M, an $8.2M
decrease. Bookings in 2011 have been positively influenced as compared
to 2010 by the USD/Euro exchange rate.
3 |
 Bookings Analysis –
Roll Coverings
Rolls
Q3
2011
order
bookings
of
$50.1M
were
slightly
higher
than
Q3
2010’s
$49.4M.
Bookings in 2011 have been positively influenced as compared to 2010 by the
USD/Euro exchange rate.
4 |
 Bookings Analysis –
Paper Machine Clothing
New PMC order bookings of $84.5M are lower than Q3 2010 levels of $93.2M and down
slightly vs. Q2 2011 of $86.9M. Bookings of certain types of PMC are
being constrained to prevent
lead
time
extension.
Bookings
in
2011
have
been
positively
influenced
as
compared
to
2010
by
the
USD/Euro
exchange
rate.
5 |
 Percent of Revenue from Asia-Pacific Markets
6
Generally,
over
time,
we
expect
growth
in
paper
production
to
be
greater
in
Asia-Pacific
than
in
the more mature North America and Western European regions.
|
 New
Product Sales as a Percent of Revenue Meaningful progress
continues on Xerium’s goal to increase its technological leadership. Our
goal is to derive 60% of XRM’s sales revenue from products developed within
the prior five years, that make a measurable improvement in customer
performance, are defendable long term and simultaneously reduce our
operating costs. 7 |
 Xerium’s New Product Categorization
8
New products are categorized by their level of innovation and strategic purpose
|
 Total
Xerium Quarterly Sales and Gross Margin Q3 2011 sales increased 9.1% over Q3
2010 primarily due to increased sales volume and favorable currency.
Gross margin % is down slightly due primarily to higher raw material,
unfavorable product mix due to higher growth of lower margin product lines and
increased obsolescence expense due to favorable recovery in 2010 related to
the sale of aged inventory. 9 |
 S G
& A as a Percent of Revenue, excluding Operational & Financial
Restructuring Expenses (A)
Excludes operational restructuring expenses
Note –
a reconciliation of SG&A as a percentage of revenue excluding operational
restructuring expenses is available in the investor relations section of the
Company’s website at www.xerium.com. In Q3 2011, SG&A as a percent
of sales is 24.8% as compared to Q3 2010 of 26.9%. The improvement is
driven primarily by higher sales, decreased environmental expense and decreased
incentive compensation. These were offset by unfavorable currency impacts on
SG&A. 10 |
 Trailing Twelve Month (“TTM”) Adjusted EBITDA
Note:
Adjusted
EBITDA
at
each
quarter
was
the
amount
as
calculated
per
the
definition
in
the
New
Credit
Facility
with
the
exception
that
we
have
added
back
to
net
income
(loss)
per
the
terms
of
our
prior
credit
facility
financial
restructuring
costs
incurred
in
Q1
($9.6M)
and
Q2
($15.3M)
of
2010
as
part
of
the
reorganization.
A
reconciliation of Trailing Twelve Month Adjusted EBITDA to Net Income (Loss) and
operating cash flows is available in the investor relations section of the Company’s
website at www.xerium.com.
11 |
 Trade Working Capital (“TWC”) as a Percent of
Revenue
Trade working capital % decreased 120 basis points versus Q2 2011 due to the
strengthening of the dollar and reduced levels of inventories. The inventory
pre-build implemented earlier in the year was completed in Q3.
Note: a reconciliation of Trade Working Capital to Revenue is available in the
investor relations section of the Company’s website at www.xerium.com.
12 |
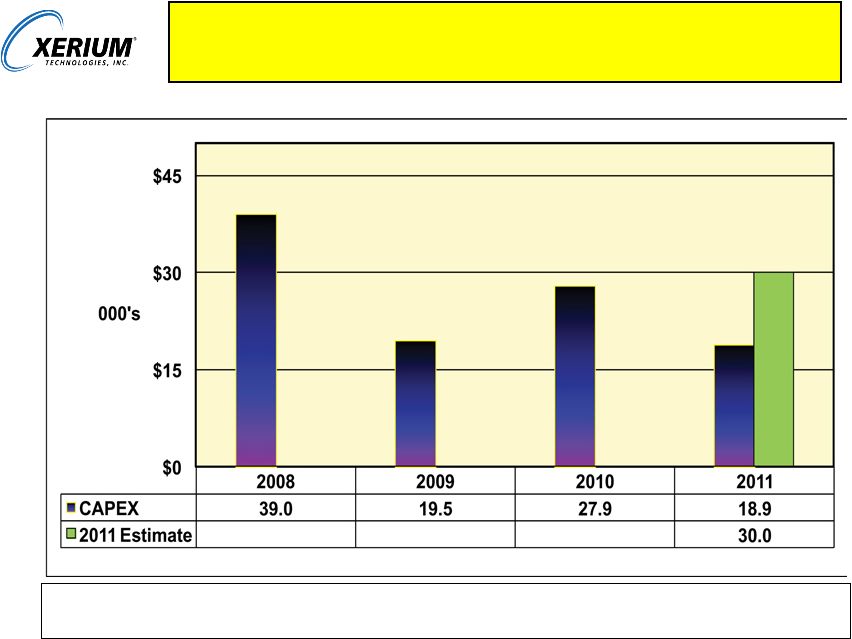 Total Xerium Annual Capital Expenditures
2011 investments focus on new products and existing equipment capacity and
performance upgrades.
13 |