Attached files
| file | filename |
|---|---|
| EX-99.1 - EXHIBIT 99.1 - DITECH HOLDING Corp | c24424exv99w1.htm |
| 8-K - FORM 8-K - DITECH HOLDING Corp | c24424e8vk.htm |
Exhibit 99.2
| Third Quarter 2011 Earnings Support November 7, 2011 |
| Important Disclosures Safe Harbor Statement Certain statements in this release and in any of Walter Investment Management Corp.'s public documents referred to herein, contain or incorporate by reference "forward-looking" statements as defined in Section 27A of the Securities Act of 1933, as amended, and Section 21E of the Securities Exchange Act of 1934, as amended. Walter Investment Management Corp. is including this cautionary statement to make applicable and take advantage of the safe harbor provisions of the Private Securities Litigation Reform Act of 1995. Statements that are not historical fact are forward- looking statements. Words such as "expect," "believe," "anticipate," "project," "estimate," "forecast," "objective," "plan," "goal," "apparent" and similar expressions, and the opposites of such words and expressions are intended to identify forward-looking statements. Forward-looking statements, including the guidance provided in this release, are based on the Company's current beliefs, intentions and expectations; however, forward-looking statements involve known and unknown risks, uncertainties and other important factors that could cause actual results, performance or achievements, to differ materially from those reflected in the statements made or incorporated in this release. Thus, these forward-looking statements are not guarantees of future performance and should not be relied upon as predictions of future events. The risks and uncertainties referred to above include, but are not limited to: local regional, national and global economic and political trends and developments in general and local, regional and national real estate and residential mortgage market trends in particular; the occurrence of anticipated growth of the specialty servicing sector; the effects of competition from a variety of local, regional, national and other mortgage servicers; our ability to successfully integrate the Green Tree business into our historical business and to achieve expected synergies; the continuation of regulatory pressures on large banks relating to their mortgage servicing, as well as regulatory pressure on the rest of the mortgage servicing sector, including increased performance standards and reporting obligations, changes to our insurance business, including the involuntary placement of insurance for mortgagors, and/or the rights and obligations of property owners, mortgagees and tenants; the effect of Company risk management strategies, including the management and protection of personal and private information of our customers and mortgage holders and the protection of our information systems from third party interference (cyber-security); unexpected losses resulting from pending, threatened or unforeseen litigation or other third party claims against the Company; risks related to the financing incurred in connection with the acquisition of Green Tree, including our ability to achieve revenues sufficient to carry our debt and otherwise to meet the covenants of our debt; and other risks detailed from time to time in the Company's filings with the Securities and Exchange Commission (the "SEC"). The acquisition of Green Tree has resulted in significant changes to our risk factors. The reader is directed to our Quarterly Report on Form 10-Q for the quarter ended June 30, 2011 filed with the SEC on August 8, 2011 for a detailed explanation of our current risk factors. All forward-looking statements set forth herein are qualified by this cautionary statement and are made only as of November 7, 2011. The Company undertakes no obligation to update or revise the information contained herein, including without limitation, any forward-looking statements, whether as a result of new information, subsequent events or circumstances, or otherwise, unless otherwise required by law. Basis of Presentation Unless noted otherwise in this presentation, all reported financial data is being presented as of the period ended September 30, 2011. |
| Use of Non-GAAP Measures Generally Accepted Accounting Principles ("GAAP") is the term used to refer to the standard framework of guidelines for financial accounting. GAAP includes the standards, conventions, and rules accountants follow in recording and summarizing transactions and in the preparation of financial statements. In addition to reporting financial results in accordance with GAAP, the Company has provided non-GAAP financial measures, which it believes are useful to help investors better understand its financial performance, competitive position and prospects for the future. Core earnings (pre-tax and after-tax) ,core earnings per share and pro-forma adjusted EBITDA are financial measures that are not in accordance with GAAP. See the Non-GAAP Reconciliations above for a reconciliation of these measures to the most directly comparable GAAP financial measures. Core earnings (pre-tax and after-tax) and core earnings per share measure the Company's financial performance excluding depreciation and amortization costs related to business combination transactions, transaction and merger integration-related costs, certain other non-cash adjustments, and the net impact of the consolidated Non-Residual Trust VIEs. Pro-forma adjusted EBITDA measures the Company's financial performance excluding depreciation and amortization costs, corporate and MSR facility interest expense, transaction and merger integration-related costs, certain other non-cash adjustments, the net impact of the consolidated Non-Residual Trust VIEs and certain other items as defined by our first and second lien credit agreements, including, but not limited to pro-forma synergies. Core earnings (pre-tax and after-tax) and core earnings per share may also include other adjustments, as applicable based upon facts and circumstances, consistent with the intent of providing investors a means of evaluating our core operating performance. The Company believes that these Non-GAAP Financial Measures can be useful to investors because they provide a means by which investors can evaluate the Company's underlying key drivers and operating performance of the business, exclusive of certain adjustments and activities that investors may consider to be unrelated to the underlying economic performance of the business for a given period. Use of Core Earnings and Pro-Forma Adjusted EBITDA by Management The Company manages the business and has designed certain management incentives based upon the achievement of core earnings, pro-forma adjusted EBITDA and similar targets in order to assess the underlying operational performance of the continuing operations of the business for the year and to have a basis to compare underlying operating results to prior and future periods. Limitations on the Use of Core Earnings and Pro-Forma Adjusted EBITDA Since core earnings (pre-tax and after-tax) and core earnings per share measure the Company's financial performance excluding depreciation and amortization costs related to acquisitions, transaction and merger integration-related costs, certain other non-cash adjustments, and the net impact of the consolidated Non-Residual Trust VIEs, they may not reflect all amounts associated with our results as determined in accordance with GAAP. Pro-forma adjusted EBITDA measures the Company's financial performance excluding depreciation and amortization costs, corporate and MSR facility interest expense, transaction and merger integration-related costs, certain other non-cash adjustments, the net impact of the consolidated Non-Residual Trust VIEs and certain other items as defined by our first and second lien credit agreements, including, but not limited to pro-forma synergies, they may not reflect all amounts associated with our results as determined in accordance with GAAP Core earnings (pre-tax and after-tax), core earnings per share and pro-forma adjusted EBITDA involve differences from segment profit (loss), income (loss) before income taxes, net income (loss), basic earnings (loss) per share and diluted earnings (loss) per share computed in accordance with GAAP. Core earnings (pre-tax and after-tax) ,core earnings per share and pro-forma adjusted EBITDA should be considered as supplementary to, and not as a substitute for, segment profit (loss), income (loss) before income taxes, net income (loss), basic earnings (loss) per share and diluted earnings (loss) per share computed in accordance with GAAP as a measure of the Company's financial performance. Any non-GAAP measures should be considered in context with the GAAP financial presentation and should not be considered in isolation or as a substitute for GAAP earnings. Further, the non-GAAP measures presented by Walter Investment may be defined or calculated differently from similarly titled measures of other companies. . . |

| Q3 2011 Operating Highlights and Market Overview Walter Investment Operating Highlights Expected 12/31/2011 serviced UPB of approximately $85 billion and over 1,000,000 accounts Added 97,000 accounts with a UPB of approximately $19 billion during Q3 Approximately 85,000 accounts with UPB of $15 billion transferred November 1 Anticipate transfers of approximately 65,000 accounts with UPB of nearly $13.0 billion in December Core earnings after tax of $16.5 million; $0.58 per diluted share Pro-forma adjusted EBITDA of $53.4 Market Overview Increasing momentum in industry cyclical and secular shifts underway Servicing transfers, through subservicing arrangements and MSR sales, continue to grow Consolidation and contraction of servicing capacity Compliance with regulatory requirements an important component of client's decision to award business |

| Q3 2011 Financial Performance Core earnings after tax of $16.5 million or $0.58 per share Pro-forma adjusted EBITDA of $53.4 million $26.0 million of depreciation and amortization $21.5 million of interest expense on corporate debt Dramatic growth in serviced portfolio expected to make meaningful financial contribution in 2012 and beyond Net income before certain items of $0.3 million, $0.01 per diluted share Q3 certain items $59.8 million, $2.10 per diluted share, tax charge associated with loss of REIT status $3.6 million, $0.08 per diluted share, transaction and integration related charges Reported GAAP net loss of $61.8 million or $2.17 per diluted share |
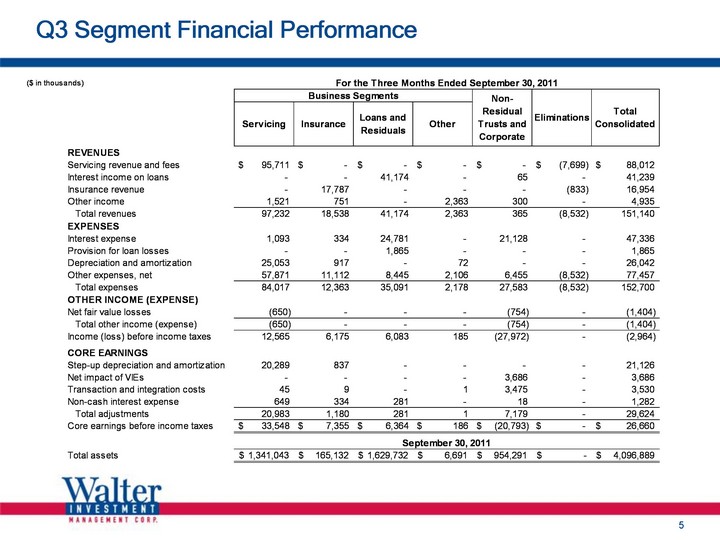
| Q3 Segment Financial Performance |

| Q3 2011 Loans and Residuals Segment $6.4 million of core earnings Portfolio performance remains strong and stable Q3 2011 delinquencies of 5.30% Historical seasonal uptick between June and December 22% reduction in REO levels since the beginning of the year Q3 2011 loss severities of 17.6% Loans and Residuals Segment Highlights Key Statistics |

| Q3 2011 Summary Balance Sheet ($ in thousands, except per share amounts) |
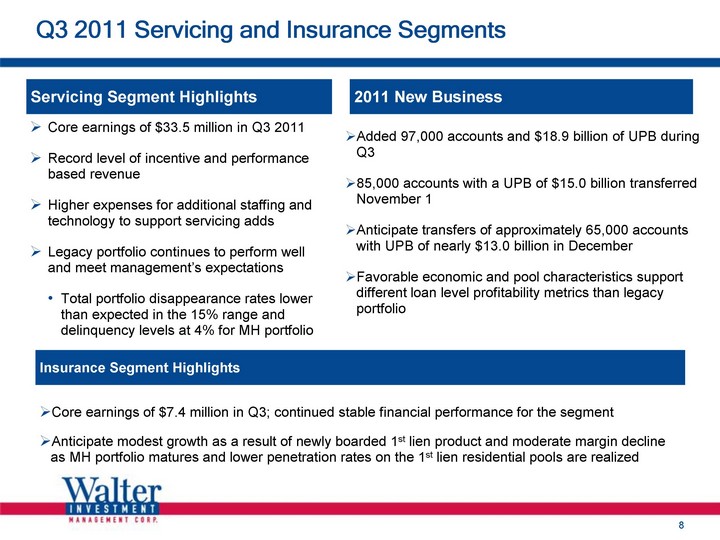
| Q3 2011 Servicing and Insurance Segments Core earnings of $33.5 million in Q3 2011 Record level of incentive and performance based revenue Higher expenses for additional staffing and technology to support servicing adds Legacy portfolio continues to perform well and meet management's expectations Total portfolio disappearance rates lower than expected in the 15% range and delinquency levels at 4% for MH portfolio Servicing Segment Highlights 2011 New Business Insurance Segment Highlights Core earnings of $7.4 million in Q3; continued stable financial performance for the segment Anticipate modest growth as a result of newly boarded 1st lien product and moderate margin decline as MH portfolio matures and lower penetration rates on the 1st lien residential pools are realized Added 97,000 accounts and $18.9 billion of UPB during Q3 85,000 accounts with a UPB of $15.0 billion transferred November 1 Anticipate transfers of approximately 65,000 accounts with UPB of nearly $13.0 billion in December Favorable economic and pool characteristics support different loan level profitability metrics than legacy portfolio |
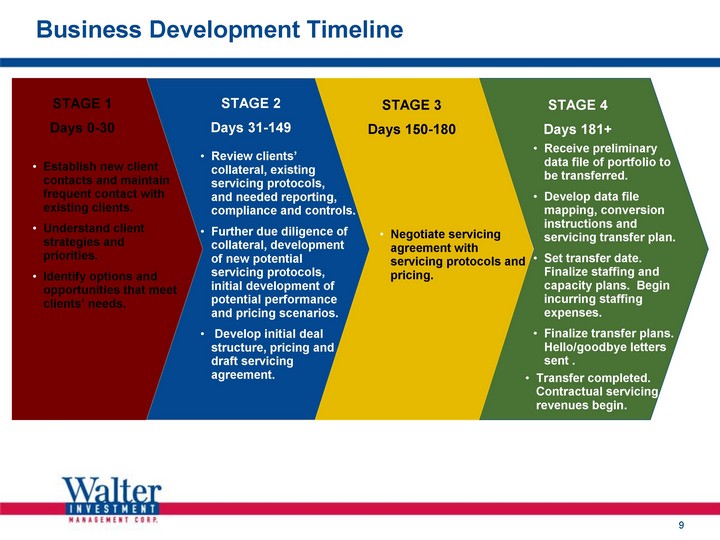
| Business Development Timeline Establish new client contacts and maintain frequent contact with existing clients. Understand client strategies and priorities. Identify options and opportunities that meet clients' needs. STAGE 1 Days 0-30 STAGE 2 Days 31-149 STAGE 3 Days 150-180 STAGE 4 Days 181+ Negotiate servicing agreement with servicing protocols and pricing. Receive preliminary data file of portfolio to be transferred. Develop data file mapping, conversion instructions and servicing transfer plan. Set transfer date. Finalize staffing and capacity plans. Begin incurring staffing expenses. Finalize transfer plans. Hello/goodbye letters sent . Review clients' collateral, existing servicing protocols, and needed reporting, compliance and controls. Further due diligence of collateral, development of new potential servicing protocols, initial development of potential performance and pricing scenarios. Develop initial deal structure, pricing and draft servicing agreement. Transfer completed. Contractual servicing revenues begin. |
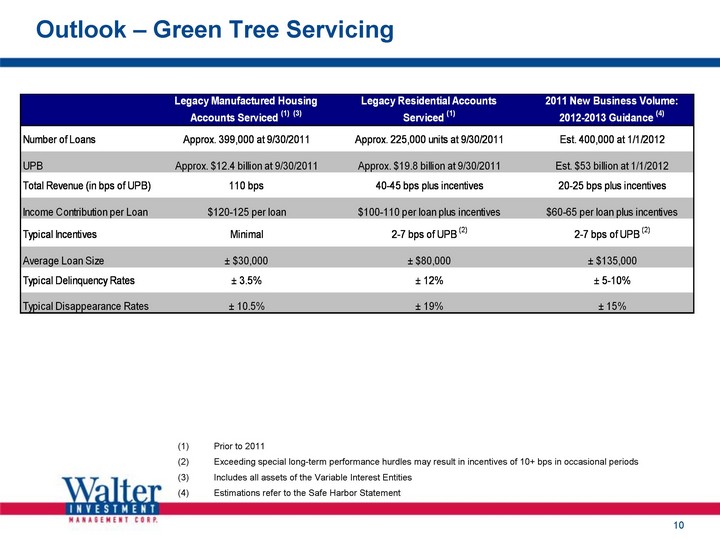
| Outlook - Green Tree Servicing Prior to 2011 Exceeding special long-term performance hurdles may result in incentives of 10+ bps in occasional periods Includes all assets of the Variable Interest Entities Estimations refer to the Safe Harbor Statement |
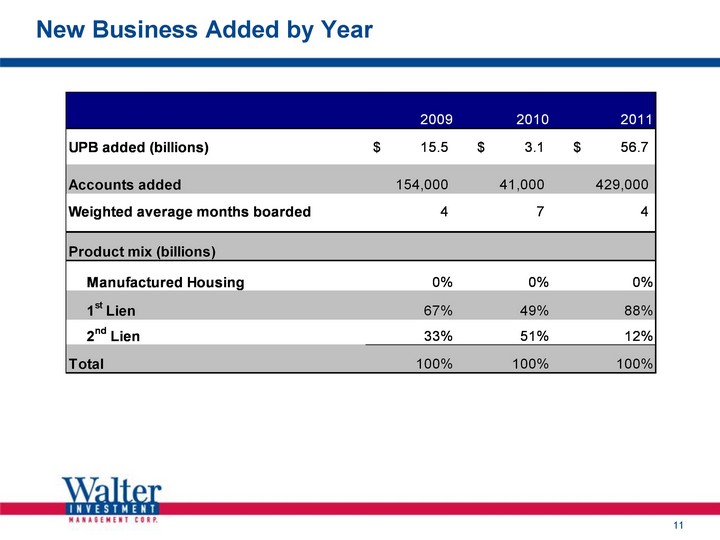
| New Business Added by Year |

| Pro Forma Adjusted EBITDA Comparisons ($ in millions) $210 - .$200 $210 - .$200 $209. 2012 New Business Disappearance Rate 2011 New Business ($19) $10-$20 ($25-$30) $25-$30 (1) Pro-forma adjusted EBITDA for 2010 differs from the previously communicated pro-forma adjusted EBITDA of $236 million as a result of a) a one-time cash release from Trust X in 2010 of approximately $7 million; b) debt service of approximately $11 million associated with the issuance of the BBB bonds from the 2010-1 securitization which was treated as acquisition debt and deducted from free cash flow in the original calculation; and c) negative cash flow and operating variances of approximately $8 million including higher insurance claims and higher advancing requirements. |

| Shareholder returns WAC total returns (since inception) WAC YTD total returns Management team has generated solid total returns and strong financial performance for our shareholders. 302% 44% |
| Appendix |
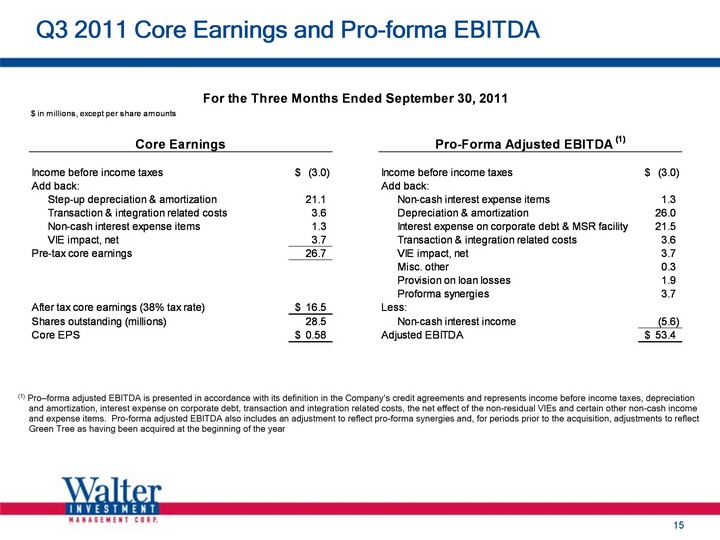
| Q3 2011 Core Earnings and Pro-forma EBITDA (1) Pro-forma adjusted EBITDA is presented in accordance with its definition in the Company's credit agreements and represents income before income taxes, depreciation and amortization, interest expense on corporate debt, transaction and integration related costs, the net effect of the non-residual VIEs and certain other non-cash income and expense items. Pro-forma adjusted EBITDA also includes an adjustment to reflect pro-forma synergies and, for periods prior to the acquisition, adjustments to reflect Green Tree as having been acquired at the beginning of the year |