Attached files
| file | filename |
|---|---|
| 8-K - FORM 8-K - S1 CORP /DE/ | c24364e8vk.htm |
Exhibit 99.1

| S1 Corporation Q3 2011 Earnings Call Presentation November 8, 2011 Copyright (c) 2011. S1 Corporation. All rights reserved. 1 |

| This presentation contains forward-looking statements. These forward-looking statements are not guarantees of future performance and are subject to risks and uncertainties that could cause actual results to differ materially from those contemplated by the forward-looking statements. These statements, including without limitation statements and projections regarding our revenue, expenses, Adjusted EBITDA, revenue backlog, capital expenditures, earnings per share, product development projects, future economic performance, management objectives or any transaction with ACI Worldwide, Inc. ("ACI"), are based on our beliefs as well as assumptions made using information currently available to us. Because these statements reflect our current views concerning future events, they involve risks, uncertainties and assumptions. Therefore, actual results may differ materially from those contemplated by the forward-looking statements. The forward-looking statements are made pursuant to the safe harbor provisions of the Private Securities Litigation Reform Act of 1995. All of the forward-looking statements are expressly qualified by the risk factors discussed in the Company's filings with the Securities and Exchange Commission ("SEC"). For a detailed discussion of these risk factors, please review the Company's filings with the SEC, including our Annual Report on Form 10-K for the fiscal year ended December 31, 2010, our Quarterly Reports on Form 10-Q for the quarters ended March 30, 2011 and June 30, 2011, and subsequent filings. Except as required by law, the Company will not update forward-looking statements over the course of future periods. For questions related to this information, please contact Paul Parrish, Chief Financial Officer, at 404- 923-3500 or paul.parrish@S1.com. Forward Looking Statements Copyright (c) 2011. S1 Corporation. All rights reserved. 2 |

| Key Themes - Q3 2011 Entered into an agreement with ACI pursuant to which ACI will acquire the Company Strong year over year revenue growth: 15% (total Company) and 23% (excluding Custom Projects) Added nine new customers Sales Bookings (trailing six months) Payments and Banking: Large FI segments (ex Custom Projects) $54.6M as of 9/30/11 from $58.0M as of 9/30/10 Revenue Backlog 15% increase to $65.2M as of 9/30/11 from $56.7M as of 9/30/10 Balance Sheet: $88.1M in cash and cash equivalents as of 9/30/11 Copyright (c) 2011. S1 Corporation. All rights reserved. 3 Revenue (CHART) In millions US$ (CHART) In millions US$ Adjusted EBITDA *Adjusted EBITDA excludes expenses related to ACI and Fundtech transactions. See Non-GAAP Measures in Appendix. |
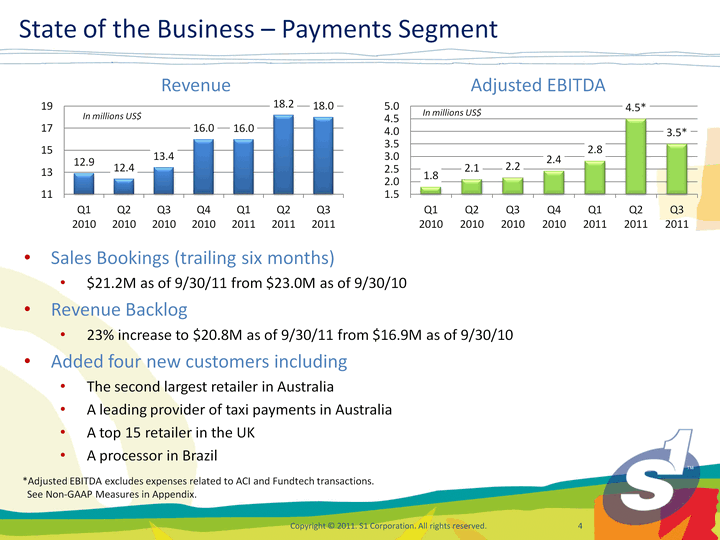
| State of the Business - Payments Segment Copyright (c) 2011. S1 Corporation. All rights reserved. 4 Revenue Sales Bookings (trailing six months) $21.2M as of 9/30/11 from $23.0M as of 9/30/10 Revenue Backlog 23% increase to $20.8M as of 9/30/11 from $16.9M as of 9/30/10 Added four new customers including The second largest retailer in Australia A leading provider of taxi payments in Australia A top 15 retailer in the UK A processor in Brazil (CHART) In millions US$ (CHART) In millions US$ Adjusted EBITDA *Adjusted EBITDA excludes expenses related to ACI and Fundtech transactions. See Non-GAAP Measures in Appendix. |
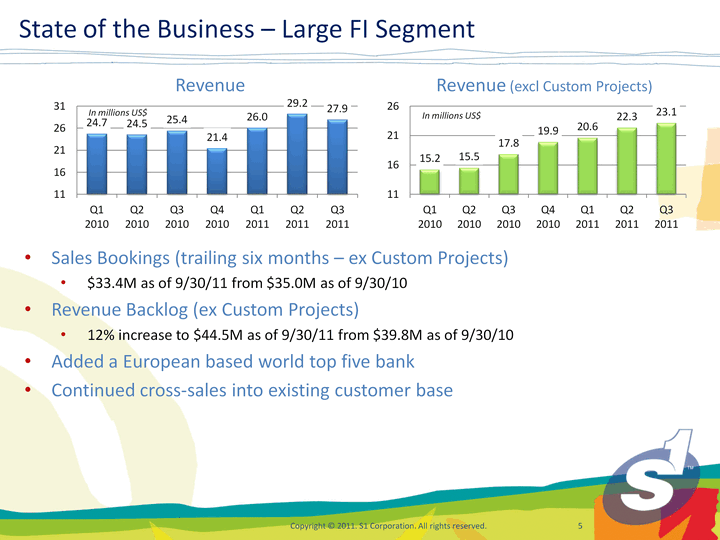
| State of the Business - Large FI Segment Copyright (c) 2011. S1 Corporation. All rights reserved. 5 Sales Bookings (trailing six months - ex Custom Projects) $33.4M as of 9/30/11 from $35.0M as of 9/30/10 Revenue Backlog (ex Custom Projects) 12% increase to $44.5M as of 9/30/11 from $39.8M as of 9/30/10 Added a European based world top five bank Continued cross-sales into existing customer base Revenue (CHART) Revenue (excl Custom Projects) (CHART) In millions US$ |

| State of the Business - Community FI Segment Copyright (c) 2011. S1 Corporation. All rights reserved. 6 Added four new customers All for internet banking One bank and three credit unions New platform roll-out - over 290 instances Internet Banking (Retail & Business) / Voice Banking / Mobile Banking Conversions are rolling-out according to plan Additional investment costs still projected to wind-down during 2011 Revenue (CHART) (CHART) Adjusted EBITDA *Adjusted EBITDA excludes expenses related to ACI and Fundtech transactions. See Non-GAAP Measures in Appendix. |

| Financials Copyright (c) 2011. S1 Corporation. All rights reserved. 7 |

| Financial Summary - Consolidated Revenue Copyright (c) 2011. S1 Corporation. All rights reserved. 8 Software licenses primarily impacted by increase in number of licenses recognized over implementation period and increased license sales Support and maintenance primarily impacted by continued growth in Payments and Banking: Large FI segments' licensing activity Professional services primarily impacted by: Growth of project revenue due to increased bookings Reduced Custom Project revenue (State Farm and international branch customer) 2010 negatively impacted by increases in the size and complexity of certain projects In millions Three Months Ended September 30, Three Months Ended September 30, Total revenue: 2011 2010 Software licenses $ 9.7 $ 6.8 Support and maintenance 17.5 15.6 Professional services 20.2 17.4 Hosting 14.1 13.9 Total revenue $ 61.5 $ 53.7 |

| Financial Summary - Segment Revenue Copyright (c) 2011. S1 Corporation. All rights reserved. 9 Payments: Increase in the number of Software licenses recognized over implementation period and upon delivery Support and maintenance primarily impacted by continued growth in licensing activity Increase in Professional services from project growth due to increased bookings and Q3 2010 negatively impacted by increases in the size and complexity of certain projects Banking: Large FI: Software licenses increased primarily due to increased licenses internationally Support and maintenance primarily impacted by continued growth in licensing activity Increase in Professional services from project growth in the U.S. due to increased bookings reduced by $1.4M decline in State Farm and $0.6M decline in international branch customer Banking: Community FI: Growth from credit union business (PM Systems) primarily for Hosting revenue In millions Payments Banking: Large FI Banking: Community FI Total Total revenue: Q3 2011 $ 18.0 $ 27.9 $ 15.6 $ 61.5 Q3 2010 13.4 25.4 14.9 53.7 Revenue growth $ 4.6 $ 2.5 $ 0.7 $ 7.8 % change 34% 10% 5% 15% |
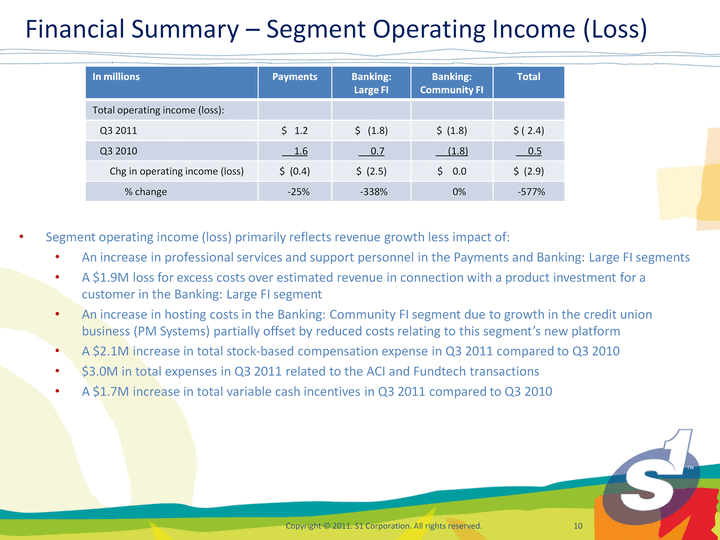
| Financial Summary - Segment Operating Income (Loss) Copyright (c) 2011. S1 Corporation. All rights reserved. 10 Segment operating income (loss) primarily reflects revenue growth less impact of: An increase in professional services and support personnel in the Payments and Banking: Large FI segments A $1.9M loss for excess costs over estimated revenue in connection with a product investment for a customer in the Banking: Large FI segment An increase in hosting costs in the Banking: Community FI segment due to growth in the credit union business (PM Systems) partially offset by reduced costs relating to this segment's new platform A $2.1M increase in total stock-based compensation expense in Q3 2011 compared to Q3 2010 $3.0M in total expenses in Q3 2011 related to the ACI and Fundtech transactions A $1.7M increase in total variable cash incentives in Q3 2011 compared to Q3 2010 In millions Payments Banking: Large FI Banking: Community FI Total Total operating income (loss): Q3 2011 $ 1.2 $ (1.8) $ (1.8) $ ( 2.4) Q3 2010 1.6 0.7 (1.8) 0.5 Chg in operating income (loss) $ (0.4) $ (2.5) $ 0.0 $ (2.9) % change -25% -338% 0% -577% |

| Financial Summary - Diluted Income Per Share Copyright (c) 2011. S1 Corporation. All rights reserved. 11 Interest and other income, net, in 3Q 2011 impacted primarily by the receipt of an $11.9M fee associated with the termination of the Fundtech merger agreement U.S. NOLs total approximately $223M as of 9/30/11 In millions, except per share data Three Months Ended September 30, Three Months Ended September 30, 2011 2010 Operating (loss) income $ (2.4) $ 0.5 Interest and other income (expense), net 11.3 (0.5) Income tax (expense) benefit (0.9) 0.9 Net income $ 8.0 $ 0.9 Diluted income per share $ 0.14 $ 0.02 Weighted average common shares outstanding - diluted 55.7 53.5 Adjusted EBITDA $ 5.9 $ 3.6 |
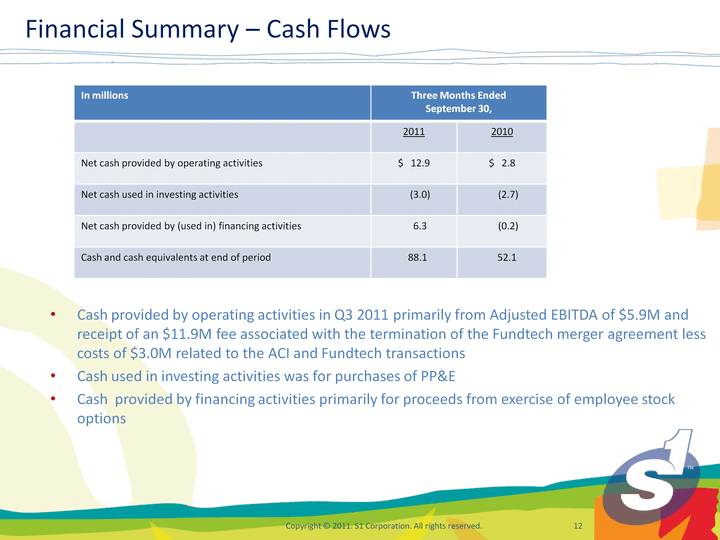
| Financial Summary - Cash Flows Copyright (c) 2011. S1 Corporation. All rights reserved. 12 Cash provided by operating activities in Q3 2011 primarily from Adjusted EBITDA of $5.9M and receipt of an $11.9M fee associated with the termination of the Fundtech merger agreement less costs of $3.0M related to the ACI and Fundtech transactions Cash used in investing activities was for purchases of PP&E Cash provided by financing activities primarily for proceeds from exercise of employee stock options In millions Three Months Ended September 30, Three Months Ended September 30, 2011 2010 Net cash provided by operating activities $ 12.9 $ 2.8 Net cash used in investing activities (3.0) (2.7) Net cash provided by (used in) financing activities 6.3 (0.2) Cash and cash equivalents at end of period 88.1 52.1 |

| Closing Remarks Copyright (c) 2011. S1 Corporation. All rights reserved. 13 |

| Closing Remarks Copyright (c) 2011. S1 Corporation. All rights reserved. 14 Very pleased with the Q3 performance despite the distractions during the quarter Our staff has done an excellent job remaining focused on our customers Continue to see very good sales opportunities in the marketplace Foundation of the Company is sound, providing a platform for growth Product set is very competitive - continue to add new customers Working diligently to close the ACI transaction as quickly as possible Reaffirming full year guidance Revenue: $240M to $250M Adjusted EBITDA*: $27M to $31M *Adjusted EBITDA excludes expenses related to ACI and Fundtech transactions. See Non-GAAP Measures in Appendix. |

| Thank You Copyright (c) 2011. S1 Corporation. All rights reserved. 15 |

| Appendix Copyright (c) 2011. S1 Corporation. All rights reserved. 16 |
| This presentation includes references to Adjusted EBITDA, a non-GAAP financial measure, the most directly comparable U.S. GAAP equivalent of which is Net income for our consolidated results and Operating income for our segment results. We define Adjusted EBITDA as, in the case of our consolidated results, Net income plus interest and other expense (income), plus income taxes or, in the case of our segment results, Operating income, in each case adjusted for depreciation, amortization of intangibles, stock-based compensation expense and expenses related to the ACI and Fundtech transactions. Although we believe our presentation of non-GAAP financial measures provide useful supplemental information to investors regarding our results of operations, our non- GAAP financial measures should only be considered in addition to, and not as a substitute for or superior to, our financial measures prepared in accordance with U.S. GAAP. The use of non-GAAP financial measures is subject to inherent limitations because they do not include all the expenses that must be included under U.S. GAAP and because they involve the exercise of management's judgment of which charges should properly be excluded from the non-GAAP financial measure. Management accounts for these limitations by not relying exclusively on non-GAAP financial measures, but only using such information to supplement U.S. GAAP financial results. Our non- GAAP financial measures may be different from such measures used by other companies. We believe that the presentation of this non-GAAP financial measure provides useful information to investors regarding our results of operations. A reconciliation of our non-GAAP financial measure to the most directly comparable financial measure calculated and presented in accordance with U.S. GAAP is detailed in the Appendix to this presentation. Non-GAAP Measures Copyright (c) 2011. S1 Corporation. All rights reserved. 17 |

| Non-GAAP Measures Copyright (c) 2011. S1 Corporation. All rights reserved. 18 In millions Payments Banking: Large FI Banking: Community FI Total Company Net income $ 8.0 Interest and other income, net (11.3) Income tax expense 0.9 Operating income (loss) $ 1.2 $ (1.8) $ (1.8) (2.4) Depreciation and amortization 0.6 1.2 1.1 2.9 Expenses related to ACI and Fundtech transactions 0.9 1.3 0.8 3.0 Stock-based compensation 0.7 1.1 0.6 2.4 Non-GAAP Adjusted EBITDA $ 3.5 $ 1.8 $ 0.6 $ 5.9 Reconciliation of Adjusted EBITDA and Net Income for the three months ended September 30, 2011 |
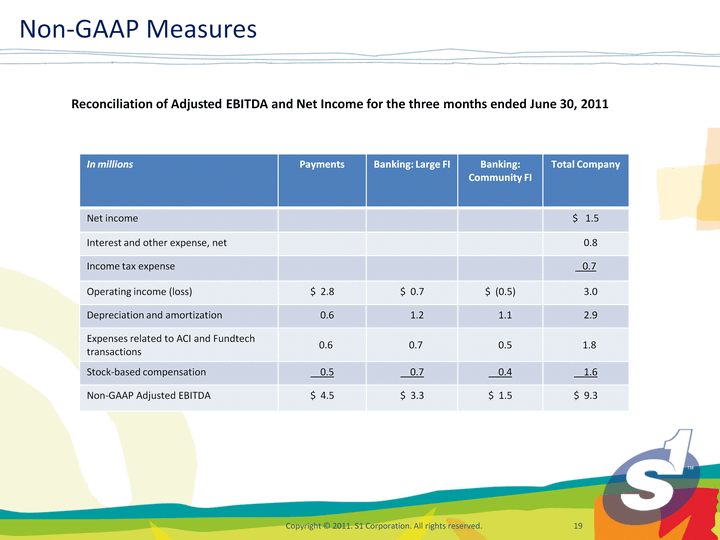
| Non-GAAP Measures Copyright (c) 2011. S1 Corporation. All rights reserved. 19 In millions Payments Banking: Large FI Banking: Community FI Total Company Net income $ 1.5 Interest and other expense, net 0.8 Income tax expense 0.7 Operating income (loss) $ 2.8 $ 0.7 $ (0.5) 3.0 Depreciation and amortization 0.6 1.2 1.1 2.9 Expenses related to ACI and Fundtech transactions 0.6 0.7 0.5 1.8 Stock-based compensation 0.5 0.7 0.4 1.6 Non-GAAP Adjusted EBITDA $ 4.5 $ 3.3 $ 1.5 $ 9.3 Reconciliation of Adjusted EBITDA and Net Income for the three months ended June 30, 2011 |

| Non-GAAP Measures Copyright (c) 2011. S1 Corporation. All rights reserved. 20 In millions Payments Banking: Large FI Banking: Community FI Total Company Net income $ 0.7 Interest and other expense, net 0.2 Income tax expense 0.5 Operating income (loss) $ 2.0 $ 0.3 $ (0.9) 1.4 Depreciation and amortization 0.5 1.3 1.1 2.9 Stock-based compensation 0.3 0.3 0.2 0.8 Non-GAAP Adjusted EBITDA $ 2.8 $ 1.9 $ 0.4 $ 5.1 Reconciliation of Adjusted EBITDA and Net Income for the three months ended March 31, 2011 |

| Non-GAAP Measures Copyright (c) 2011. S1 Corporation. All rights reserved. 21 In millions Payments Banking: Large FI Banking: Community FI Total Company Net loss $ (4.3) Interest and other expense, net 0.5 Income tax benefit (0.5) Operating income (loss) $ 1.2 $ (4.3) $ (1.2) (4.3) Depreciation and amortization 0.4 1.2 1.2 2.8 Stock-based compensation 0.8 1.0 0.5 2.3 Non-GAAP Adjusted EBITDA $ 2.4 $ (2.1) $ 0.5 $ 0.8 Reconciliation of Adjusted EBITDA and Net Loss for the three months ended December 31, 2010 |

| Non-GAAP Measures Copyright (c) 2011. S1 Corporation. All rights reserved. 22 In millions Payments Banking: Large FI Banking: Community FI Total Company Net income $ 0.9 Interest and other expense, net 0.4 Income tax benefit (0.8) Operating income (loss) $ 1.6 $ 0.7 $ (1.8) 0.5 Depreciation and amortization 0.5 1.2 1.2 2.9 Stock-based compensation 0.1 0.0 0.1 0.2 Non-GAAP Adjusted EBITDA $ 2.2 $ 1.9 $ (0.5) $ 3.6 Reconciliation of Adjusted EBITDA and Net Income for the three months ended September 30, 2010 |

| Non-GAAP Measures Copyright (c) 2011. S1 Corporation. All rights reserved. 23 In millions Payments Banking: Large FI Banking: Community FI Total Company Net loss $ (1.8) Interest and other expense, net 0.4 Income tax expense 0.9 Operating income (loss) $ 1.3 $ (0.3) $ (1.5) (0.5) Depreciation and amortization 0.5 1.2 1.2 2.9 Stock-based compensation 0.3 0.3 0.2 0.8 Non-GAAP Adjusted EBITDA $ 2.1 $ 1.2 $ (0.1) $ 3.2 Reconciliation of Adjusted EBITDA and Net Loss for the three months ended June 30, 2010 |

| Non-GAAP Measures Copyright (c) 2011. S1 Corporation. All rights reserved. 24 In millions Payments Banking: Large FI Banking: Community FI Total Company Net loss $ (1.1) Interest and other expense, net 0.3 Income tax expense 0.7 Operating income (loss) $ 1.2 $ 0.2 $ (1.5) (0.1) Depreciation and amortization 0.5 1.1 0.9 2.5 Stock-based compensation 0.2 0.1 0.1 0.4 Non-GAAP Adjusted EBITDA $ 1.8 $ 1.5 $ (0.5) $ 2.8 Reconciliation of Adjusted EBITDA and Net Loss for the three months ended March 31, 2010 |

| This presentation contains an estimate of revenue backlog for our Payments and Banking: Large Financial Institution segments which is defined as an estimate of revenue for software licenses, including term licenses, professional services, and hosting services, in each case as specified in executed contracts that we believe will be recognized in revenue over the next 12 months. The portion of the estimate from our Banking: Large Financial Institution segment does not include revenue associated with the State Farm business or the custom development for an international branch customer ("Custom Projects"). Our estimate of revenue backlog requires substantial judgment of our management, is based on a number of assumptions, which may turn out to be inaccurate or wrong, and is subject to a number of factors and uncertainties, many of which are outside of our control. Such assumptions, factors and uncertainties include, but are not limited to, the following: Revenue for term licenses and hosting services are the annualized amount expected over the next 12 months as of the date presented; Foreign currency exchange rates are assumed to remain constant over the 12 month period for contracts stated in currencies other than the U.S. Dollar; Perpetual licenses and professional services are based on current estimates of project completion over the next 12 months; Our customers may attempt to renegotiate or terminate their contracts for a number of reasons, including mergers, changes in their financial condition or general changes in economic conditions within their industries or geographic locations; We may experience delays in the development or delivery of products or services specified in customer contracts; and Our estimate is based on constant hosting transaction volumes, and changes in hosting transaction volumes may impact the amount of revenue actually recognized in future periods. Non-GAAP Measures Copyright (c) 2011. S1 Corporation. All rights reserved. 25 |
| Estimates of future financial results are inherently unreliable. Accordingly, there can be no assurance that the amounts included in our estimate of revenue backlog will be recognized over the next 12 months, or at all. Additionally, because our estimate of revenue backlog is an operating metric, it is not subject to the same level of internal review or control as a U.S. GAAP financial measure. We believe that presenting this estimate provides supplemental information and an alternative presentation useful to investors understanding trends in our business including the shift we have experienced towards recognizing more software license revenue using the percentage of completion method. The revenue backlog and sales bookings measures are considered non-GAAP financial measures as defined by SEC Regulation G. Although we believe our presentation of non-GAAP financial measures provides useful supplemental information to investors regarding our results of operations, our non-GAAP financial measures should only be considered in addition to, and not as a substitute for or superior to, our financial measures prepared in accordance with U.S. GAAP. The use of non-GAAP financial measures is subject to inherent limitations because they involve the exercise of management's judgment. Management accounts for these limitations by not relying exclusively on non-GAAP financial measures, but only using such information to supplement U.S. GAAP financial results. Our non-GAAP financial measures may be different from such measures used by other companies. We believe that the presentation of these non-GAAP financial measure provides useful information to investors regarding our results of operations. Non-GAAP Measures Copyright (c) 2011. S1 Corporation. All rights reserved. 26 |

| Additional Information and Where to Find It In connection with the previously announced pending transaction with ACI, S1 has filed a Solicitation/Recommendation Statement on Schedule 14D-9, as amended, with the Securities and Exchange Commission ("SEC"). INVESTORS AND STOCKHOLDERS ARE URGED TO READ THAT STATEMENT AND OTHER MATERIALS FILED WITH THE SEC BY S1 AND ACI BECAUSE THEY CONTAIN IMPORTANT INFORMATION. S1 stockholders and other interested parties may obtain, free of charge, copies of S1's Schedule 14D-9, as amended, and other documents filed by S1 and ACI with the SEC at the SEC's website at http://www.sec.gov. In addition, free copies of the documents filed by S1 with the SEC with respect to the exchange offer may be obtained by contacting S1's Investor Relations at (404) 923-3500 or by accessing S1's investor relations website at www.s1.com. 27 Copyright (c) 2011. S1 Corporation. All rights reserved. 27 |
