Attached files
| file | filename |
|---|---|
| EX-31.1 - CERTIFICATION OF CHIEF EXECUTIVE OFFICER PURSUANT TO SECTION 302 - EPOCH HOLDING CORP | d234318dex311.htm |
| EX-32.1 - CERTIFICATION OF CHIEF EXECUTIVE OFFICER AND CHIEF FINANCIAL OFFICER - EPOCH HOLDING CORP | d234318dex321.htm |
| EXCEL - IDEA: XBRL DOCUMENT - EPOCH HOLDING CORP | Financial_Report.xls |
| EX-31.2 - CERTIFICATION OF PRINCIPAL FINANCIAL OFFICER PURSUANT TO SECTION 302 - EPOCH HOLDING CORP | d234318dex312.htm |
Table of Contents
UNITED STATES
SECURITIES AND EXCHANGE COMMISSION
Washington, D.C. 20549
FORM 10-Q
(Mark One)
| þ | QUARTERLY REPORT PURSUANT TO SECTION 13 OR 15(d) OF THE SECURITIES EXCHANGE ACT OF 1934 |
For the Quarterly Period Ended September 30, 2011
OR
| ¨ | TRANSITION REPORT PURSUANT TO SECTION 13 OR 15(d) OF THE SECURITIES EXCHANGE ACT OF 1934 |
For the Transition Period from to
Commission File Number: 1-9728

EPOCH HOLDING CORPORATION
(Exact Name of Registrant as Specified in Its Charter)
| Delaware | 20-1938886 | |
| (State or Other Jurisdiction of Incorporation or Organization) |
(I.R.S. Employer Identification No.) |
640 Fifth Avenue, New York, NY 10019
(Address of Principal Executive Offices)
(212) 303-7200
(Registrant’s Telephone Number, Including Area Code)
Indicate by check mark whether the registrant (1) has filed all reports required to be filed by Section 13 or 15(d) of the Securities Exchange Act of 1934 during the preceding 12 months (or for such shorter period that the registrant was required to file such reports) and (2) has been subject to such filing requirements for the past 90 days. Yes þ No ¨
Indicate by check mark whether the registrant is a large accelerated filer, an accelerated filer, a non-accelerated filer, or a smaller reporting company. See the definitions of “large accelerated filer,” “accelerated filer,” “non-accelerated filer” and “smaller reporting company” in Rule 12b-2 of the Exchange Act.
| Large accelerated filer ¨ |
Accelerated filer þ | Non-accelerated filer ¨ | Smaller reporting company ¨ | |||
| (Do not Check if Smaller Reporting Company) |
Indicate by check mark whether the registrant has submitted electronically and posted on its corporate web site, if any, every Interactive Data File required to be submitted and posted pursuant to Rule 405 of Regulation S-T (§232.405 of this chapter) during the preceding 12 months (or for such shorter period that the registrant was required to submit and post such files). Yes þ No ¨
Indicate by check mark whether the registrant is a shell company (as defined in Rule 12b-2 of the Exchange Act). Yes ¨ No þ
As of November 1, 2011, there were 23,272,900 shares of the registrant’s common stock, $0.01 par value per share, issued and outstanding.
Table of Contents

EPOCH HOLDING CORPORATION AND SUBSIDIARIES
QUARTERLY REPORT ON FORM 10-Q
FOR THE FISCAL QUARTER ENDED SEPTEMBER 30, 2011
| Form 10-Q |
Page No. |
|||||
| PART I. FINANCIAL INFORMATION | ||||||
| Item 1. |
1 | |||||
| Condensed Consolidated Balance Sheets—September 30, 2011 (Unaudited) and June 30, 2011 |
1 | |||||
| 2 | ||||||
| 3 | ||||||
| 4 | ||||||
| 5 | ||||||
| Notes to Condensed Consolidated Financial Statements (Unaudited) |
6 | |||||
| Item 2. |
Management’s Discussion and Analysis of Financial Condition and Results of Operations |
14 | ||||
| Item 3. |
32 | |||||
| Item 4. |
35 | |||||
| PART II. OTHER INFORMATION | ||||||
| Item 1. |
36 | |||||
| Item 1A. |
36 | |||||
| Item 2. |
Unregistered Sales of Equity Securities and Use of Proceeds. |
36 | ||||
| Item 5. |
36 | |||||
| Item 6. |
37 | |||||
| 39 | ||||||
Items other than those listed above have been omitted because they are not applicable.
i
Table of Contents
| Item 1. | Financial Statements. |
EPOCH HOLDING CORPORATION AND SUBSIDIARIES
CONDENSED CONSOLIDATED BALANCE SHEETS
(in thousands, except share data)
| September 30, 2011 |
June 30, 2011 |
|||||||
| (Unaudited) | ||||||||
| ASSETS |
||||||||
| Current assets: |
||||||||
| Cash and cash equivalents |
$ | 35,315 | $ | 29,128 | ||||
| Accounts receivable |
15,880 | 17,183 | ||||||
| Deferred income taxes, net |
2,457 | 2,344 | ||||||
| Held-to-maturity securities, at amortized cost (fair value of $354 and $357, respectively)—(Note 3) |
353 | 355 | ||||||
| Prepaid and other current assets |
3,165 | 1,034 | ||||||
|
|
|
|
|
|||||
| Total current assets |
57,170 | 50,044 | ||||||
| Held-to-maturity securities, at amortized cost (fair value of $1,639 and $1,651, respectively)—(Note 3) |
1,597 | 1,605 | ||||||
| Other investments, at fair value (cost of $8,149 and $8,360, respectively)—(Note 4) |
8,111 | 8,907 | ||||||
| Deferred income taxes, net |
8,495 | 8,240 | ||||||
| Property and equipment, net of accumulated depreciation of $3,547 and $3,282, respectively |
1,462 | 1,580 | ||||||
| Security deposits |
486 | 485 | ||||||
|
|
|
|
|
|||||
| Total assets |
$ | 77,321 | $ | 70,861 | ||||
|
|
|
|
|
|||||
| LIABILITIES AND STOCKHOLDERS’ EQUITY |
||||||||
| Current liabilities: |
||||||||
| Accounts payable and accrued liabilities |
$ | 1,481 | $ | 1,233 | ||||
| Accrued compensation and benefits |
9,497 | 6,549 | ||||||
| Income taxes payable |
— | 649 | ||||||
|
|
|
|
|
|||||
| Total current liabilities |
10,978 | 8,431 | ||||||
| Deferred rent |
654 | 695 | ||||||
|
|
|
|
|
|||||
| Total liabilities |
11,632 | 9,126 | ||||||
|
|
|
|
|
|||||
| Commitments and contingencies—(Note 6) |
||||||||
| Stockholders’ equity: |
||||||||
| Common stock, $0.01 par value per share, 60,000,000 shares authorized; 23,971,244 issued and 23,293,297 outstanding at September 30, 2011 and 23,944,660 issued and 23,364,644 outstanding at June 30, 2011, respectively |
240 | 239 | ||||||
| Additional paid-in capital |
67,594 | 64,737 | ||||||
| Retained earnings |
5,055 | 2,041 | ||||||
| Accumulated other comprehensive income/(loss), net of tax |
(147 | ) | 183 | |||||
| Less: Treasury stock, at cost, 677,947 and 580,016 shares, respectively |
(7,053 | ) | (5,465 | ) | ||||
|
|
|
|
|
|||||
| Total stockholders’ equity |
65,689 | 61,735 | ||||||
|
|
|
|
|
|||||
| Total liabilities and stockholders’ equity |
$ | 77,321 | $ | 70,861 | ||||
|
|
|
|
|
|||||
The accompanying notes are an integral part of these condensed consolidated financial statements.
1
Table of Contents
EPOCH HOLDING CORPORATION AND SUBSIDIARIES
CONDENSED CONSOLIDATED STATEMENTS OF INCOME (UNAUDITED)
(in thousands, except per share data)
| Three Months Ended September 30, |
||||||||
| 2011 | 2010 | |||||||
| Operating Revenues: |
||||||||
| Investment advisory and management fees |
$ | 18,111 | $ | 14,795 | ||||
| Performance fees |
898 | 180 | ||||||
|
|
|
|
|
|||||
| Total operating revenues |
19,009 | 14,975 | ||||||
|
|
|
|
|
|||||
| Operating Expenses: |
||||||||
| Employee compensation and benefits |
7,817 | 6,748 | ||||||
| Occupancy and technology |
1,185 | 1,040 | ||||||
| General and administrative |
1,084 | 572 | ||||||
| Professional fees and services |
825 | 815 | ||||||
|
|
|
|
|
|||||
| Total operating expenses |
10,911 | 9,175 | ||||||
|
|
|
|
|
|||||
| Operating Income |
8,098 | 5,800 | ||||||
| Other income/(loss) |
(194 | ) | 158 | |||||
|
|
|
|
|
|||||
| Income Before Income Taxes |
7,904 | 5,958 | ||||||
| Provision for income taxes |
3,486 | 2,612 | ||||||
|
|
|
|
|
|||||
| Net Income |
$ | 4,418 | $ | 3,346 | ||||
|
|
|
|
|
|||||
| Earnings Per Share:—(Note 7) |
||||||||
| Basic |
$ | 0.19 | $ | 0.15 | ||||
|
|
|
|
|
|||||
| Diluted |
$ | 0.19 | $ | 0.15 | ||||
|
|
|
|
|
|||||
| Weighted-Average Shares Outstanding: |
||||||||
| Basic |
23,355 | 22,786 | ||||||
|
|
|
|
|
|||||
| Diluted |
23,537 | 22,959 | ||||||
|
|
|
|
|
|||||
| Cash dividends declared and paid per share |
$ | 0.06 | $ | 0.05 | ||||
|
|
|
|
|
|||||
The accompanying notes are an integral part of these condensed consolidated financial statements.
2
Table of Contents
EPOCH HOLDING CORPORATION AND SUBSIDIARIES
CONDENSED CONSOLIDATED STATEMENTS OF COMPREHENSIVE INCOME (UNAUDITED)
(in thousands)
| Three Months Ended September 30, |
||||||||
| 2011 | 2010 | |||||||
| Net income |
$ | 4,418 | $ | 3,346 | ||||
|
|
|
|
|
|||||
| Other comprehensive income/(loss), net of tax—(Note 8) |
||||||||
| Net unrealized gains/(losses) on available-for-sale securities |
(415 | ) | 248 | |||||
| Reclassification for net (gains)/losses included in net income |
85 | 3 | ||||||
|
|
|
|
|
|||||
| Other comprehensive income/(loss) |
(330 | ) | 251 | |||||
|
|
|
|
|
|||||
| Comprehensive income |
$ | 4,088 | $ | 3,597 | ||||
|
|
|
|
|
|||||
The accompanying notes are an integral part of these condensed consolidated financial statements.
3
Table of Contents
EPOCH HOLDING CORPORATION AND SUBSIDIARIES
CONDENSED CONSOLIDATED STATEMENTS OF CHANGES IN STOCKHOLDERS’ EQUITY
FOR THE YEAR ENDED JUNE 30, 2011 AND THREE MONTHS ENDED SEPTEMBER 30, 2011
(dollars and shares in thousands)
| Common Stock | Additional Paid-in Capital |
Retained Earnings |
Accumulated Other Comprehensive Income/(Loss) |
Treasury Stock | Total Stockholders’ Equity |
|||||||||||||||||||||||||||
| Shares | Amount | Shares | Amount | |||||||||||||||||||||||||||||
| Balances at June 30, 2010 |
22,787 | $ | 233 | $ | 56,893 | $ | 2,668 | $ | (223 | ) | 482 | $ | (3,956 | ) | $ | 55,615 | ||||||||||||||||
| Net income |
— | — | — | 21,566 | — | — | — | 21,566 | ||||||||||||||||||||||||
| Other comprehensive income |
— | — | — | — | 406 | — | — | 406 | ||||||||||||||||||||||||
| Issuance and forfeitures of restricted share awards |
567 | 5 | 912 | — | — | — | — | 917 | ||||||||||||||||||||||||
| Amortization of share-based compensation |
— | — | 5,391 | — | — | — | — | 5,391 | ||||||||||||||||||||||||
| Common stock dividends |
— | — | — | (22,193 | ) | — | — | — | (22,193 | ) | ||||||||||||||||||||||
| Income tax benefit from dividends paid on unvested shares |
— | — | 466 | — | — | — | — | 466 | ||||||||||||||||||||||||
| Exercises of stock options |
108 | 1 | 668 | — | — | — | — | 669 | ||||||||||||||||||||||||
| Net sales/purchases of shares for employee withholding |
— | — | 97 | — | — | — | — | 97 | ||||||||||||||||||||||||
| Repurchase of common shares |
(98 | ) | — | — | — | — | 98 | (1,509 | ) | (1,509 | ) | |||||||||||||||||||||
| Excess income tax benefit from share-based compensation |
— | — | 310 | — | — | — | — | 310 | ||||||||||||||||||||||||
|
|
|
|
|
|
|
|
|
|
|
|
|
|
|
|
|
|||||||||||||||||
| Balances at June 30, 2011 |
23,364 | 239 | 64,737 | 2,041 | 183 | 580 | (5,465 | ) | 61,735 | |||||||||||||||||||||||
| Net income |
— | — | — | 4,418 | — | — | — | 4,418 | ||||||||||||||||||||||||
| Other comprehensive loss—(Note 8) |
— | — | — | — | (330 | ) | — | — | (330 | ) | ||||||||||||||||||||||
| Issuance and forfeitures of restricted share awards |
16 | — | (19 | ) | — | — | — | — | (19 | ) | ||||||||||||||||||||||
| Amortization of share-based compensation |
— | — | 1,462 | — | — | — | — | 1,462 | ||||||||||||||||||||||||
| Common stock dividends |
— | — | — | (1,404 | ) | — | — | — | (1,404 | ) | ||||||||||||||||||||||
| Income tax benefit from dividends paid on unvested shares |
— | — | 30 | — | — | — | — | 30 | ||||||||||||||||||||||||
| Exercise of stock options |
11 | 1 | 70 | — | — | — | — | 71 | ||||||||||||||||||||||||
| Net sales/purchases of shares for employee withholding |
(42 | ) | — | — | — | — | 42 | (801 | ) | (801 | ) | |||||||||||||||||||||
| Repurchase of common shares |
(56 | ) | — | — | — | — | 56 | (787 | ) | (787 | ) | |||||||||||||||||||||
| Excess income tax benefit from share-based compensation |
— | — | 1,314 | — | — | — | — | 1,314 | ||||||||||||||||||||||||
|
|
|
|
|
|
|
|
|
|
|
|
|
|
|
|
|
|||||||||||||||||
| Balances at September 30, 2011 (Unaudited) |
23,293 | $ | 240 | $ | 67,594 | $ | 5,055 | $ | (147 | ) | 678 | $ | (7,053 | ) | $ | 65,689 | ||||||||||||||||
|
|
|
|
|
|
|
|
|
|
|
|
|
|
|
|
|
|||||||||||||||||
The accompanying notes are an integral part of these condensed consolidated financial statements.
4
Table of Contents
EPOCH HOLDING CORPORATION AND SUBSIDIARIES
CONDENSED CONSOLIDATED STATEMENTS OF CASH FLOWS (UNAUDITED)
(in thousands)
| Three Months Ended September 30, |
||||||||
| 2011 | 2010 | |||||||
| Cash flows from operating activities: |
||||||||
| Net income |
$ | 4,418 | $ | 3,346 | ||||
| Adjustments to reconcile net income to net cash provided by operating activities: |
||||||||
| Benefit from deferred income taxes |
(113 | ) | (135 | ) | ||||
| Share-based compensation |
1,443 | 1,279 | ||||||
| Depreciation and amortization |
265 | 205 | ||||||
| Net realized losses on investments |
151 | 6 | ||||||
| Equity in net loss/(income) from limited liability company |
74 | (31 | ) | |||||
| Amortization of bond premiums |
10 | 10 | ||||||
| Excess income tax benefit from share-based compensation |
(1,314 | ) | (31 | ) | ||||
| Income tax benefit from dividends paid on unvested shares |
(30 | ) | (25 | ) | ||||
| (Increase)/decrease in operating assets: |
||||||||
| Accounts receivable |
1,303 | (1,025 | ) | |||||
| Prepaid and other current assets |
(2,131 | ) | (70 | ) | ||||
| Increase/(decrease) in operating liabilities: |
||||||||
| Accounts payable and accrued liabilities |
248 | (30 | ) | |||||
| Accrued compensation and benefits |
2,948 | 2,598 | ||||||
| Income taxes payable |
695 | 24 | ||||||
| Deferred rent |
(41 | ) | (30 | ) | ||||
|
|
|
|
|
|||||
| Net cash provided by operating activities |
7,926 | 6,091 | ||||||
|
|
|
|
|
|||||
| Cash flows from investing activities: |
||||||||
| Investments in Company-sponsored products and other investments, net |
(14 | ) | (2,012 | ) | ||||
| Capital expenditures |
(147 | ) | (133 | ) | ||||
| Security deposits |
(1 | ) | 286 | |||||
|
|
|
|
|
|||||
| Net cash used in investing activities |
(162 | ) | (1,859 | ) | ||||
|
|
|
|
|
|||||
| Cash flows from financing activities: |
||||||||
| Cash dividends on common stock |
(1,404 | ) | (1,141 | ) | ||||
| Repurchase of common shares, net |
(1,588 | ) | (338 | ) | ||||
| Excess income tax benefit from share-based compensation |
1,314 | 31 | ||||||
| Income tax benefit from dividends paid on unvested shares |
30 | 25 | ||||||
| Proceeds from stock option exercises |
71 | — | ||||||
| Net gain on sale of shares for employee withholding |
— | 3 | ||||||
|
|
|
|
|
|||||
| Net cash used in financing activities |
(1,577 | ) | (1,420 | ) | ||||
|
|
|
|
|
|||||
| Net increase in cash and cash equivalents during period |
6,187 | 2,812 | ||||||
| Cash and cash equivalents at beginning of period |
29,128 | 36,447 | ||||||
|
|
|
|
|
|||||
| Cash and cash equivalents at end of period |
$ | 35,315 | $ | 39,259 | ||||
|
|
|
|
|
|||||
| Supplemental disclosure of cash flow information: |
||||||||
| Cash paid for income taxes |
$ | 4,942 | $ | 2,875 | ||||
|
|
|
|
|
|||||
| Supplemental disclosures of non-cash investing activities: |
||||||||
| Net change in unrealized gains on available-for-sale securities, net of tax |
$ | (330 | ) | $ | 251 | |||
|
|
|
|
|
|||||
The accompanying notes are an integral part of these condensed consolidated financial statements.
5
Table of Contents
EPOCH HOLDING CORPORATION AND SUBSIDIARIES
NOTES TO CONDENSED CONSOLIDATED FINANCIAL STATEMENTS
FOR THE THREE MONTHS ENDED SEPTEMBER 30, 2011 AND 2010
(Unaudited)
Note 1—Organization and Basis of Presentation
Organization
Epoch Holding Corporation (“Epoch” or the “Company”), a Delaware corporation, is a holding company whose sole line of business is investment advisory and investment management services. The operations of the Company are conducted through its wholly-owned subsidiary, Epoch Investment Partners, Inc. (“EIP”). EIP is a registered investment adviser under the Investment Advisers Act of 1940, as amended. EIP provides investment advisory and investment management services to clients including corporations, retirement plans, public pension funds, endowments, foundations, financial institutions and high net worth individuals. These services are provided through both separately managed accounts and commingled vehicles, such as private investment funds and mutual funds. Headquartered in New York City, the Company’s current investment strategies include U.S. Value, U.S. All Cap Value, Global Equity Shareholder Yield, Global Absolute Return, Global Choice, U.S. Choice, U.S. Smid Cap (small/mid) Value, International Small Cap, U.S. Small Cap Value, Global Small Cap, and Balanced.
Basis of Presentation
The unaudited condensed consolidated financial statements of the Company included herein have been prepared in accordance with accounting principles generally accepted in the United States of America (“U.S. GAAP”), and in accordance with the instructions to Form 10-Q pursuant to the rules and regulations of the United States Securities and Exchange Commission (“SEC”). Certain information and note disclosures normally included in annual financial statements prepared in accordance with U.S. GAAP have been condensed or omitted pursuant to those rules and regulations, although the Company believes that the disclosures made herein are adequate to make the information not misleading. The fiscal year-end Condensed Consolidated Balance Sheet was derived from audited financial statements and, in accordance with interim financial statement standards, does not include all disclosures required by U.S. GAAP for annual financial statements.
These financial statements rely, in part, on estimates. Actual results could differ from these estimates. In the opinion of management, these unaudited condensed consolidated financial statements reflect all adjustments, consisting of normal recurring adjustments, necessary for a fair presentation of the Company’s financial position, interim results of operations, comprehensive income and cash flows. All material intercompany accounts and transactions have been eliminated in consolidation. The nature of our business is such that the results for the interim periods are not necessarily indicative of the results to be obtained for a full fiscal year. The Company’s unaudited condensed consolidated financial statements and the related notes should be read in conjunction with the consolidated financial statements and the related notes thereto included in the Company’s Annual Report on Form 10-K for the fiscal year ended June 30, 2011.
Certain items previously reported have been reclassified to conform to the current year presentation. Specifically, in the Condensed Consolidated Statements of Income, prior year amounts related to share-based compensation have been reclassified and combined with employee compensation and benefits, and depreciation expense has been combined and presented as part of occupancy and technology expenses. Such reclassifications had no impact on net income.
There have been no changes in significant accounting policies during the three months ended September 30, 2011. For a complete listing of the Company’s significant accounting policies, please refer to the Company’s Annual Report on Form 10-K for the fiscal year ended June 30, 2011.
6
Table of Contents
EPOCH HOLDING CORPORATION AND SUBSIDIARIES
NOTES TO CONDENSED CONSOLIDATED FINANCIAL STATEMENTS (Continued)
FOR THE THREE MONTHS ENDED SEPTEMBER 30, 2011 AND 2010
(Unaudited)
Note 1—Organization and Basis of Presentation (Continued)
Recently Issued Accounting Pronouncements
In May 2011, the Financial Accounting Standards Board (“FASB”) issued Accounting Standards Update (“ASU”) No. 2011-04, Fair Value Measurement (Topic 820): Amendments to Achieve Common Fair Value Measurement and Disclosure Requirements in U.S. GAAP and IFRS. ASU No. 2011-04 generally provides a uniform framework for fair value measurements and related disclosures between U.S. GAAP and International Financial Reporting Standards (“IFRS”). Additional disclosure requirements in the update include, among other things, the disclosure of all transfers between Level 1 and Level 2 of the fair value hierarchy. ASU No. 2011-04 will be effective for the interim and annual periods beginning on or after December 15, 2011. Early adoption is not permitted. The Company does not expect the adoption of this standard to have a material impact on its consolidated financial position, results of operations, or cash flows.
Note 2—Accounts Receivable
The Company’s accounts receivable balances do not include an allowance for doubtful accounts for the periods presented and there have been no bad debt expenses recognized during the three months ended September 30, 2011 and 2010. Management believes the September 30, 2011 accounts receivable balances are fully collectible.
Significant Customers
The Company’s client base consists of a large number of geographically diverse clients across many industries. For the three months ended September 30, 2011 and 2010, New York Life Investment Management, through the MainStay Epoch Funds and other funds sub-advised by EIP, accounted for approximately 18% and 19% of consolidated operating revenues, respectively.
Note 3—Held-to-Maturity Securities
The Company’s investment securities classified as held-to-maturity consist of high-grade debt securities. These investments are carried at amortized cost. Gross unrecognized gains and losses, and fair value of these securities at September 30, 2011 and June 30, 2011 are as follows (in thousands):
| September 30, 2011 | June 30, 2011 | |||||||||||||||||||||||||||||||
| Amortized Cost |
Gross Unrecognized | Aggregate Fair Value |
Amortized Cost |
Gross Unrecognized | Aggregate Fair Value |
|||||||||||||||||||||||||||
| Gains | Losses | Gains | Losses | |||||||||||||||||||||||||||||
| Current |
$ | 353 | $ | 1 | $ | — | $ | 354 | $ | 355 | $ | 2 | $ | — | $ | 357 | ||||||||||||||||
| Long-Term |
1,597 | 42 | — | 1,639 | 1,605 | 46 | — | 1,651 | ||||||||||||||||||||||||
|
|
|
|
|
|
|
|
|
|
|
|
|
|
|
|
|
|||||||||||||||||
| $ | 1,950 | $ | 43 | $ | — | $ | 1,993 | $ | 1,960 | $ | 48 | $ | — | $ | 2,008 | |||||||||||||||||
|
|
|
|
|
|
|
|
|
|
|
|
|
|
|
|
|
|||||||||||||||||
The fair value of investments in held-to-maturity securities is valued under the market approach through the use of quoted prices for similar investments in active markets.
7
Table of Contents
EPOCH HOLDING CORPORATION AND SUBSIDIARIES
NOTES TO CONDENSED CONSOLIDATED FINANCIAL STATEMENTS (Continued)
FOR THE THREE MONTHS ENDED SEPTEMBER 30, 2011 AND 2010
(Unaudited)
Note 3—Held-to-Maturity Securities (Continued)
The contractual maturities of the investment securities classified as held-to-maturity at September 30, 2011 are as follows (in thousands):
| Contractual Maturities |
Amortized Cost |
Aggregate Fair Value |
Weighted- Average Interest Rate |
|||||||||
| Less than 1 year |
$ | 353 | $ | 354 | 1.67 | % | ||||||
| Due after 1 year through 3 years |
1,597 | 1,639 | 2.31 | % | ||||||||
|
|
|
|
|
|
|
|||||||
| Total |
$ | 1,950 | $ | 1,993 | 2.19 | % | ||||||
|
|
|
|
|
|
|
|||||||
Note 4—Other Investments
The Company’s other investments at September 30, 2011 and June 30, 2011 are summarized as follows (in thousands):
| September 30, 2011 | June 30, 2011 | |||||||||||||||||||||||||||||||
| Cost | Gross Unrealized | Fair Value |
Cost | Gross Unrealized | Fair Value |
|||||||||||||||||||||||||||
| Gains | Losses | Gains | Losses | |||||||||||||||||||||||||||||
| Available-for-sale securities: |
||||||||||||||||||||||||||||||||
| Epoch Global All Cap separate account |
$ | 2,513 | $ | 219 | $ | (161 | ) | $ | 2,571 | $ | 2,652 | $ | 445 | $ | (36 | ) | $ | 3,061 | ||||||||||||||
| Company-sponsored mutual funds |
1,187 | 26 | (224 | ) | 989 | 1,185 | 91 | (97 | ) | 1,179 | ||||||||||||||||||||||
| Investment in limited partnership |
4,000 | 102 | — | 4,102 | 4,000 | 144 | — | 4,144 | ||||||||||||||||||||||||
|
|
|
|
|
|
|
|
|
|
|
|
|
|
|
|
|
|||||||||||||||||
| Total available-for-sale securities |
7,700 | 347 | (385 | ) | 7,662 | 7,837 | 680 | (133 | ) | 8,384 | ||||||||||||||||||||||
| Equity method investment: |
||||||||||||||||||||||||||||||||
| Epoch Global Absolute Return Fund, LLC |
449 | — | — | 449 | 523 | — | — | 523 | ||||||||||||||||||||||||
|
|
|
|
|
|
|
|
|
|
|
|
|
|
|
|
|
|||||||||||||||||
| Total Other Investments |
$ | 8,149 | $ | 347 | $ | (385 | ) | $ | 8,111 | $ | 8,360 | $ | 680 | $ | (133 | ) | $ | 8,907 | ||||||||||||||
|
|
|
|
|
|
|
|
|
|
|
|
|
|
|
|
|
|||||||||||||||||
The unrealized losses for each period presented have been unrealized for twelve months or more. Management has reviewed its investment securities for other-than-temporary impairment in accordance with its accounting policy outlined in Note 2 of the Company’s Annual Report on Form 10-K for the fiscal year ended June 30, 2011. When evaluating whether an unrealized loss on an available-for-sale investment is other than temporary, management reviews such factors as extent and duration of the loss, reduction or cessation of dividend payments, and overall financial condition of the issuer.
Based on management’s assessment, the Company does not believe that the declines are other-than-temporary for all periods presented. The gross unrealized losses from available-for-sale securities were primarily caused by overall weakness in the financial markets and world economy. The securities are expected to recover their value over time, and management has the intent and ability to hold these investments until such recovery occurs. Unrealized gains or losses from available-for-sale securities are recorded in accumulated other comprehensive income/(loss), net of tax, as a separate component of stockholders’ equity until realized.
8
Table of Contents
EPOCH HOLDING CORPORATION AND SUBSIDIARIES
NOTES TO CONDENSED CONSOLIDATED FINANCIAL STATEMENTS (Continued)
FOR THE THREE MONTHS ENDED SEPTEMBER 30, 2011 AND 2010
(Unaudited)
Note 4—Other Investments (Continued)
Proceeds as well as realized gains and losses recognized from investments classified as available-for-sale are as follows (in thousands):
| September 30, 2011 | September 30, 2010 | |||||||||||||||||||||||
| Proceeds | Gross Realized | Proceeds | Gross Realized | |||||||||||||||||||||
| Gains | Losses | Gains | Losses | |||||||||||||||||||||
| Epoch Global All Cap separate account |
$ | 1,373 | $ | 42 | $ | (193 | ) | $ | 442 | $ | 30 | $ | (36 | ) | ||||||||||
|
|
|
|
|
|
|
|
|
|
|
|
|
|||||||||||||
Realized gains and losses from available-for-sale securities are included in other income in the Condensed Consolidated Statements of Income using the specific identification method.
Note 5—Fair Value Measurements
Fair value is defined as the price in a transaction to sell an asset or paid to transfer a liability (i.e. the “exit price”) in an orderly transaction between market participants at the measurement date. The Company utilizes a three-level valuation hierarchy for disclosure of fair value measurements in accordance with FASB Accounting Standard Codification Topic 820. The valuation hierarchy is based upon the transparency of inputs to the valuation of an asset or liability as of the reported date. The three levels are defined as follows:
| • | Level 1—unadjusted quoted prices in active markets that are available for identical assets or liabilities as of the reported date. |
| • | Level 2—quoted prices in markets that are not active or other pricing inputs that are either directly or indirectly observable as of the reported date. |
| • | Level 3—prices or valuation techniques that are both significant to the fair value measurement and unobservable as of the reported date. These financial instruments do not have active markets and are measured using management’s best estimate of fair value, where the inputs into the determination of fair value require significant management judgment or estimation. |
Assets and liabilities measured and reported at fair value are classified and disclosed in one of the above categories based on the nature of the inputs that are significant to the fair value measurement in its entirety. In certain cases, the inputs used to measure fair value may fall into different levels of the fair value hierarchy. In such cases, an investment’s classification within the fair value hierarchy is based on the lowest level of input that is significant to the fair value measurement.
Other Investments
Other investments primarily consist of investments in Company-sponsored investment vehicles, including mutual funds, an investment strategy separate account, and a limited liability company. Other investments also include an investment in a non-affiliated investment limited partnership.
The investments in the mutual funds and in the separate account are accounted for as available-for-sale investments and valued under the market approach through the use of unadjusted quoted market prices available in an active market, and are classified within Level 1 of the valuation hierarchy. The fair value of these investments at September 30, 2011 was $3.6 million.
9
Table of Contents
EPOCH HOLDING CORPORATION AND SUBSIDIARIES
NOTES TO CONDENSED CONSOLIDATED FINANCIAL STATEMENTS (Continued)
FOR THE THREE MONTHS ENDED SEPTEMBER 30, 2011 AND 2010
(Unaudited)
Note 5—Fair Value Measurements (Continued)
During the fiscal year ended June 30, 2011, the Company invested $4.0 million in a non-affiliated investment limited partnership. At September 30, 2011, the Company held less than a 2% ownership interest in this limited partnership. This investment is accounted for as available-for-sale and is valued based upon the Company’s ownership interest in the partnership’s net assets. The value of net assets is based on the underlying assets and liabilities of the limited partnership, which primarily include exchange-listed common stocks and money market funds. This investment seeks to generate capital appreciation. The Company’s investment may be redeemed as of the end of the partnership’s fiscal year, provided that 30 days prior written notice is given to the general partner. Redemptions may be more frequent at the option of the general partner. There is no lock-up and the Company has no unfunded commitments. The investment limited partnership is classified within Level 2 of the valuation hierarchy. The fair value of this investment at September 30, 2011 was $4.1 million.
The following table presents, for each of the hierarchy levels previously described, the Company’s assets that are measured at fair value as of September 30, 2011 and June 30, 2011, respectively (in thousands):
| September 30, 2011 | June 30, 2011 | |||||||||||||||||||||||||||||||
| Fair Value Measurements |
Level 1 | Level 2 | Level 3 | Fair Value Measurements |
Level 1 | Level 2 | Level 3 | |||||||||||||||||||||||||
| Available-for-sale: |
||||||||||||||||||||||||||||||||
| Epoch Global All Cap separate account |
$ | 2,571 | $ | 2,571 | $ | — | $ | — | $ | 3,061 | $ | 3,061 | $ | — | $ | — | ||||||||||||||||
| Company-sponsored mutual funds |
989 | 989 | — | — | 1,179 | 1,179 | — | — | ||||||||||||||||||||||||
| Investment in limited partnership |
4,102 | — | 4,102 | — | 4,144 | — | 4,144 | — | ||||||||||||||||||||||||
|
|
|
|
|
|
|
|
|
|
|
|
|
|
|
|
|
|||||||||||||||||
| Total available-for-sale securities |
$ | 7,662 | $ | 3,560 | $ | 4,102 | $ | — | $ | 8,384 | $ | 4,240 | $ | 4,144 | $ | — | ||||||||||||||||
|
|
|
|
|
|
|
|
|
|
|
|
|
|
|
|
|
|||||||||||||||||
There were no transfers into or out of the Level 1, 2 and 3 categories in the fair value measurement hierarchy for the periods presented.
The investment in the limited liability company is accounted for under the equity method, whereby the Company records its percentage share of realized and unrealized earnings or losses in the Condensed Consolidated Statement of Income. Consequently, this investment is not recorded at, but approximates, fair value. The total carrying value of this investment was $0.4 million at September 30, 2011 and $0.5 million at June 30, 2011.
The Company did not hold any financial liabilities measured at fair value at September 30, 2011 or June 30, 2011.
Note 6—Commitments and Contingencies
Employment Agreements
Besides the employment contract with our Chief Executive Officer dated December 20, 2010, there are no employment contracts with any other officer or employee of the Company. There are written agreements with
10
Table of Contents
EPOCH HOLDING CORPORATION AND SUBSIDIARIES
NOTES TO CONDENSED CONSOLIDATED FINANCIAL STATEMENTS (Continued)
FOR THE THREE MONTHS ENDED SEPTEMBER 30, 2011 AND 2010
(Unaudited)
Note 6—Commitments and Contingencies (Continued)
certain employees, which provide for sales commissions or bonuses, subject to the attainment of certain performance criteria or continuation of employment. Such commitments under the various agreements total approximately $2.5 million at September 30, 2011. Of this amount, approximately $1.0 million is included in accrued compensation and benefits in the Condensed Consolidated Balance Sheet at September 30, 2011. An additional $0.5 million will be accrued during the remainder of the fiscal year ending June 30, 2012 and shortly thereafter. Approximately $1.0 million represents restricted stock awards to be issued during the remainder of the fiscal year ending June 30, 2012 and shortly thereafter.
Strategic Relationship
In July 2009, EIP entered into a strategic relationship with New York Life Investments, whereby the MainStay Group of Funds adopted the Company’s family of mutual funds (the “Epoch Funds”). The adoption was completed in November 2009. EIP is responsible for the day-to-day investment management of the funds through a sub-advisory relationship, while MainStay Investments (“MainStay”), the retail distribution arm of New York Life Investments, is responsible for the distribution and administration of the funds. Each former Epoch Fund is now co-branded as a “MainStay Epoch” Fund.
In addition to an existing sub-advisory relationship between EIP and New York Life Investments for certain funds, and the adoption of the Epoch Funds indicated above, EIP and New York Life Investments have entered into an arrangement wherein, among other things, EIP and an affiliate of New York Life Investments have established a distribution and administration relationship with respect to certain separately managed account and unified managed account strategies, and for a period of three years commencing November 2009 New York Life Investments agrees to pay certain additional base fees and meet minimum distribution targets.
Legal Matters
From time to time, the Company or its subsidiaries may become parties to claims, legal actions and complaints arising in the ordinary course of business. Management is not aware of any claims which would have a material effect on its condensed consolidated financial position, results of operations, or cash flows.
Note 7—Earnings Per Share
Basic earnings per share (“EPS”) is computed by dividing net income by the weighted-average number of common shares outstanding during the period.
Diluted EPS is computed by dividing net income, adjusted for the effect of dilutive securities, by the weighted-average number of common and common equivalent shares outstanding during the period. The Company uses the treasury stock method to reflect the dilutive effect of outstanding stock options.
The Company had 452,655 and 572,448 outstanding stock options at September 30, 2011 and 2010, respectively. The calculation of diluted EPS included all of the outstanding stock options.
11
Table of Contents
EPOCH HOLDING CORPORATION AND SUBSIDIARIES
NOTES TO CONDENSED CONSOLIDATED FINANCIAL STATEMENTS (Continued)
FOR THE THREE MONTHS ENDED SEPTEMBER 30, 2011 AND 2010
(Unaudited)
Note 7—Earnings Per Share (Continued)
The table below presents the computation of basic and diluted EPS for the three months ended September 30, 2011 and 2010, respectively (in thousands, except per share data):
| Three Months Ended September 30, |
||||||||
| 2011 | 2010 | |||||||
| Numerator: |
||||||||
| Net income |
$ | 4,418 | $ | 3,346 | ||||
|
|
|
|
|
|||||
| Denominator: |
||||||||
| Weighted-average common shares outstanding |
23,355 | 22,786 | ||||||
| Net common stock equivalents assuming the exercise of in-the-money stock options |
182 | 173 | ||||||
|
|
|
|
|
|||||
| Weighted-average common and common equivalent shares outstanding, assuming dilution |
23,537 | 22,959 | ||||||
|
|
|
|
|
|||||
| Earnings Per Share: |
||||||||
| Basic |
$ | 0.19 | $ | 0.15 | ||||
|
|
|
|
|
|||||
| Diluted |
$ | 0.19 | $ | 0.15 | ||||
|
|
|
|
|
|||||
Note 8—Other Comprehensive Income
The components of other comprehensive income/(loss) include the changes in fair value of available-for-sale securities and are as follows (in thousands):
| Three Months Ended September 30, | ||||||||||||||||||||||||
| 2011 | 2010 | |||||||||||||||||||||||
| Pre-tax Amount |
Tax (Expense)/ Benefit |
Net-of-tax Amount |
Pre-tax Amount |
Tax (Expense)/ Benefit |
Net-of-tax Amount |
|||||||||||||||||||
| Net unrealized gains/(losses) on available-for-sale securities |
$ | (735 | ) | $ | 320 | $ | (415 | ) | $ | 432 | $ | (184 | ) | $ | 248 | |||||||||
| Reclassifications for net (gains)/losses included in net income |
151 | (66 | ) | 85 | 5 | (2 | ) | 3 | ||||||||||||||||
|
|
|
|
|
|
|
|
|
|
|
|
|
|||||||||||||
| Total |
$ | (584 | ) | $ | 254 | $ | (330 | ) | $ | 437 | $ | (186 | ) | $ | 251 | |||||||||
|
|
|
|
|
|
|
|
|
|
|
|
|
|||||||||||||
12
Table of Contents
EPOCH HOLDING CORPORATION AND SUBSIDIARIES
NOTES TO CONDENSED CONSOLIDATED FINANCIAL STATEMENTS (Continued)
FOR THE THREE MONTHS ENDED SEPTEMBER 30, 2011 AND 2010
(Unaudited)
Note 9—Geographic Area Information
The Company operates under one business segment, investment management. Geographical information pertaining to the Company’s operating revenues is presented below. The amounts are aggregated by the client’s domicile (in thousands):
| Three Months Ended September 30, |
||||||||
| 2011 | 2010 | |||||||
| United States |
$ | 12,415 | $ | 10,245 | ||||
| Australia |
2,559 | 1,236 | ||||||
| Canada |
2,301 | 1,758 | ||||||
| Europe |
1,399 | 1,471 | ||||||
| Asia/Africa |
335 | 265 | ||||||
|
|
|
|
|
|||||
| Total operating revenues |
$ | 19,009 | $ | 14,975 | ||||
|
|
|
|
|
|||||
Note 10—Subsequent Events
Dividends
On October 5, 2011, the Board of Directors approved an increase in the quarterly dividend on the Company’s common stock from $0.06 to $0.08 per share. The aggregate quarterly dividend is approximately $1.9 million. The dividend is payable on November 11, 2011 to all shareholders of record at the close of business on October 28, 2011.
We currently expect to continue paying regular quarterly dividends. However, the actual declaration and payment of any future cash dividends are subject to determination by our Board of Directors each quarter after its review of our financial performance, as well as general business conditions, capital requirements, and any legal or regulatory restrictions. We may change our dividend policy at any time.
Share Repurchase Plan
On October 5, 2011, the Board of Directors authorized the Company to repurchase up to an additional 350,000 shares of its outstanding common stock. These shares are in addition to the approximately 150,000 shares which remained available for repurchase as of October 4, 2011, under prior authorization.
Market Volatility and Impact on AUM
Subsequent to September 30, 2011, optimism over a potential resolution to the European debt crisis, along with improved economic data and corporate earnings, led to a sharp rise in global equity markets. Broad market indices rose in excess of 10% during the month of October 2011. As a result, the Company’s AUM increased from $16.0 billion at September 30, 2011 to approximately $18.4 billion at October 31, 2011, reflective of both market performance and net inflows.
*****
13
Table of Contents
Item 2. Management’s Discussion and Analysis of Financial Condition and Results of Operations.
Set forth on the following pages is management’s discussion and analysis of our financial condition and results of operations for the three months ended September 30, 2011 and 2010. Such information should be read in conjunction with our unaudited condensed consolidated financial statements together with the notes to the unaudited condensed consolidated financial statements. When we use the terms “Company,” “Firm,” “management,” “we,” “us,” and “our,” we mean Epoch Holding Corporation, a Delaware corporation, and its consolidated subsidiaries.
Forward-Looking Statements
Certain information included or incorporated by reference in this Quarterly Report on Form 10-Q and other materials filed or to be filed by Epoch Holding Corporation (“Epoch” or the “Company”) with the United States Securities and Exchange Commission (“SEC”) contain statements that may be considered forward-looking within the meaning of the Private Securities Litigation Reform Act of 1995. In some cases, you can identify these statements by forward-looking words such as “may,” “might,” “will,” “should,” “expect,” “plan,” “anticipate,” “believe,” “estimate,” “predict,” “potential,” “continue” and the negative of these terms and other comparable terminology. These forward-looking statements, which are subject to known and unknown risks, uncertainties and assumptions about our Company, may include projections of our future financial performance based on our anticipated growth strategies and trends in our business. These statements are only predictions based on our current expectations and projections about future events. There are important factors that could cause our actual results, level of activity, performance or achievements to differ materially from the results, level of activity, performance or achievements expressed or implied by our forward-looking statements. In particular, you should consider the risks and uncertainties outlined in “Factors Which May Affect Future Results.”
These risks and uncertainties are not exhaustive. Other sections of this Quarterly Report on Form 10-Q may include additional factors which could adversely impact our business and financial performance. Moreover, we operate in a very competitive and rapidly changing environment. New risks and uncertainties emerge from time to time, and it is not possible for us to predict all risks and uncertainties, nor can we assess the impact of all factors on our business or the extent to which any factor, or combination of factors, may cause actual results to differ materially from those contained in any forward-looking statements.
Although we believe the expectations reflected in the forward-looking statements are reasonable, we cannot guarantee future results, level of activity, performance or achievements. Moreover, neither we nor any other person assumes responsibility for the accuracy or completeness of any of these forward-looking statements. You should not rely upon forward-looking statements as predictions of future events. We are under no duty to update any of these forward-looking statements after the date of this Quarterly Report on Form 10-Q, nor to conform our prior statements to actual results or revised expectations, and we do not intend to do so.
Forward-looking statements include, but are not limited to, statements about our:
| • | business environment, |
| • | expectations with respect to the economy, securities markets, the market for asset management activity and other industry trends, |
| • | competitive position, |
| • | business strategy, |
| • | strategic relationships, |
| • | investment products, |
| • | recruitment and retention of employees, |
| • | possible or assumed future results of operations and operating cash flows, |
| • | potential operating performance, achievements, productivity improvements, technological changes, efficiency and cost reduction efforts, |
14
Table of Contents
| • | realization of deferred tax assets, |
| • | expected tax rates, and |
| • | the effect of future legislation and regulation on our Company. |
Reports we file electronically with the SEC via the SEC’s Electronic Data Gathering, Analysis and Retrieval system (“EDGAR”) may be accessed through the internet. The SEC maintains a website that contains reports, proxy and information statements, and other information regarding issuers that file electronically with the SEC, at www.sec.gov. In addition, the public may read and copy any material that we file with the SEC at the SEC’s Public Reference Room at 100 F Street, N.E., Washington, D.C. 20549. Information on the operation of the Public Reference Room may be obtained by calling the SEC at 1-800-SEC-0330.
We maintain a website which contains current information on operations and other matters. The website address is www.eipny.com. Through the Investor Relations section of our website, and the “Financial Information” tab therein, we make available, free of charge, our Annual Report on Form 10-K, Quarterly Reports on Form 10-Q, Current Reports on Form 8-K, Proxy Statement, and any amendments to those reports filed or furnished pursuant to Section 13(a) or 15(d) of the Securities Exchange Act of 1934, as amended (the “Exchange Act”) as soon as reasonably practicable after we electronically file such material with, or furnish it to, the SEC. Our website also includes information concerning purchases and sales of our equity securities by our executive officers and directors. The information on our website is not, and shall not be deemed to be a part hereof or incorporated into this or any other filings with the SEC.
Also available free of charge on our website within the Investors Relations section, and the “Corporate Governance” tab therein, is our Code of Ethics and Business Conduct, as well as charters for the Audit, Nominating/Corporate Governance, and the Compensation Committees of our Board of Directors.
Factors Which May Affect Future Results
There are numerous factors which may affect our results of operations. These include, but are not limited to, the ability to attract and retain clients, performance of the financial markets and invested assets we manage, retention of key employees and members of management, and significant changes in regulations.
In addition, our ability to expand or alter our investment strategy offerings and distribution network, whether through acquisitions or internal development, is critical to our long-term success and has inherent risks. This success is dependent on the ability to identify and fund those developments or acquisitions on terms which are favorable to us. There can be no assurance that any of these operating factors or acquisitions can be achieved or, if undertaken, will be successful.
Other risks and uncertainties that we do not presently consider to be material or of which we are not presently aware may become important factors that affect us in the future.
These and other risks related to our Company are discussed in detail under Part I, Item 1A. “Risk Factors” in our Annual Report on Form 10-K for the fiscal year ended June 30, 2011.
Critical Accounting Estimates
Our significant accounting estimates are described in Note 2 of the Notes to the Consolidated Financial Statements, as well as Management’s Discussion and Analysis of Financial Condition and Results of Operations, in our Annual Report on Form 10-K for the fiscal year ended June 30, 2011, and have not changed from those described therein.
Overview
We are a global asset management with accomplished and experienced professionals. Our professional investment staff averages over 20 years of industry experience. Our Company was formed with the specific goal of responding to paradigm shifts occurring within the sources of global equity investment returns and within the structure of the investment management business as a whole.
15
Table of Contents
We had approximately $16.0 billion in assets under management (“AUM”) as of September 30, 2011. We remain debt-free and continue to have substantial capital resources available to fund current operations and implement our long-term growth strategy.
Our operating subsidiary, Epoch Investment Partners, Inc. (“EIP”), is a registered investment adviser under the Investment Advisers Act of 1940, as amended. Our sole line of business is to provide investment advisory and investment management services to our clients including corporations, retirement plans, public pension funds, endowments, foundations, financial institutions, and high net worth individuals. These services are provided through both separately managed accounts and commingled vehicles, such as private investment funds and mutual funds. Our investment strategies are primarily distributed through sub-advisory and institutional channels.
Our client base consists of a large number of geographically diverse clients across many industries. For the three months ended September 30, 2011, we generated approximately 35% of our total revenue from clients domiciled outside the U.S.
Revenues are generally derived as a percentage of AUM. Therefore, among other factors, our revenues are dependent upon:
| • | performance of financial markets, |
| • | performance of our investment strategies, |
| • | our ability to retain existing clients and attract new ones, and |
| • | changes in the composition of AUM. |
Our most significant operating expense is employee compensation and benefits, comprising fixed salaries, variable incentive compensation, share-based compensation, and employee benefits. Variable incentive compensation is primarily based upon management fee revenue, operating income, and investment performance. Our level of compensation reflects our plan to maintain competitive compensation levels to retain key personnel.
Our discussion and analysis of our financial condition and results of operations is based upon our Condensed Consolidated Financial Statements, which have been prepared in accordance with generally accepted accounting principles in the United States of America (“U.S. GAAP”). The preparation of these financial statements requires us to make estimates and judgments that affect the reported amounts of assets, liabilities, revenue and expenses and related disclosures of contingent assets and liabilities. On an ongoing basis, we evaluate our estimates, including those related to incentive compensation, share-based compensation, effective income tax rate, valuation of deferred tax assets, and fair value. We base our estimates on historical experience and on various assumptions that we believe to be reasonable under current circumstances, the results of which form the basis for making judgments about the carrying value of assets and liabilities. Actual results may differ from these estimates.
AUM Fair Value Measurement
AUM consists of actively traded securities. The fair value of these securities is determined by an independent pricing service, which uses publicly available, unadjusted, quoted market prices for measurement. We substantiate the values obtained with another independent pricing service to confirm that all prices are valid. There is no judgment involved in the calculation of AUM in a manner that would directly impact our revenue recognition.
16
Table of Contents
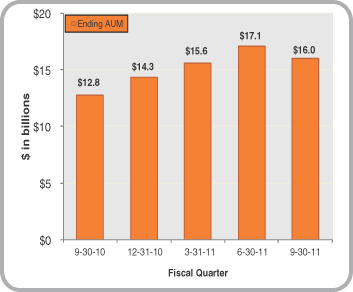
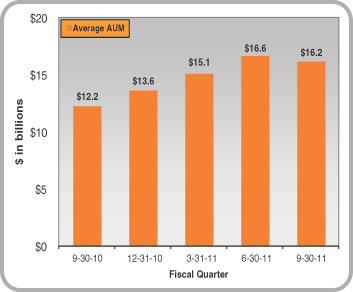
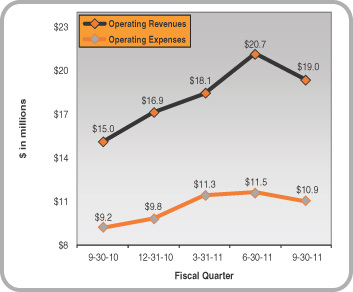
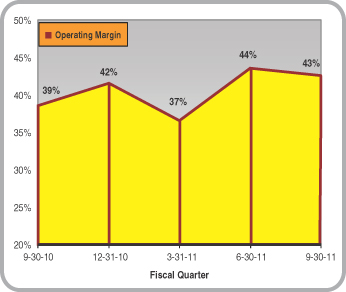
Key Performance Indicators
We monitor a variety of key performance indicators to evaluate our business results. The charts that follow depict our quarterly performance in certain key financial measures over the past five quarters:
| (1) | Ending AUM |
| (2) | Average AUM |
| (3) | Operating Revenues vs. Operating Expenses |
| (4) | Operating Margin* |
|
| |
|
| |
| * | defined as operating income divided by operating revenue |
17
Table of Contents
Financial and Business Highlights
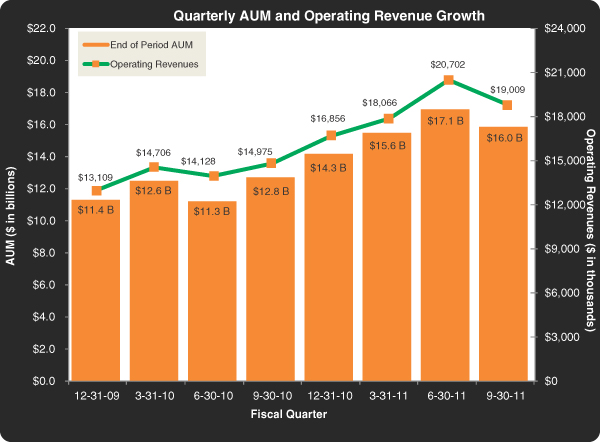
During the three months ended September 30, 2011, unfavorable market conditions impacted our AUM through market depreciation. Global equity market declines ranged from approximately 12% to 22% during the period. While both AUM and operating revenues declined from the previous three months ended June 30, 2011, the firm attracted net inflows during the period and continues to grow on a year over year basis. Some highlights for the period ended September 30, 2011 were as follows:
| • | Our AUM was $16.0 billion at September 30, 2011, an increase of 25% from $12.8 billion at September 30, 2010. AUM declined $1.1 billion, or 7%, from $17.1 billion at the previous quarter ended June 30, 2011. |
| • | Net client inflows during the quarter were approximately $1.6 billion, the highest quarterly net inflow since the firm’s inception, despite a challenging market environment. |
| • | Operating revenues increased 27% from the same period a year ago as a result of higher AUM levels. |
| • | Operating expenses increased by 19% from the same period a year ago. Increased employee compensation, stemming from additions to our investment and client relations teams to support firm growth and an increase in incentive compensation, was the primary reason for the increase. |
| • | Operating margin was approximately 43%, compared with 39% for the comparable period a year ago, as we continue to benefit from revenue growth and our operating leverage. |
| • | Basic earnings per share increased to $0.19 for the three months ended September 30, 2011 compared to $0.15 for the same period a year ago. |
| • | At September 30, 2011, working capital was $46.2 million. Liquid assets, comprising cash, cash equivalents and accounts receivable, were $51.2 million. We remain debt-free. |
| • | A quarterly dividend of $0.06 per share, or approximately $1.4 million in aggregate, was paid in August 2011. Subsequent to September 30, 2011, our Board approved an increase in the quarterly dividend rate to $0.08 per share and authorized the repurchase of up to an additional 350,000 shares of outstanding common stock under the Company’s share repurchase plan. |
The table below presents key operating and financial indicators for the three months ended September 30, 2011 and 2010, respectively:
| Three Months Ended September 30, |
’11 vs. ’10 Change |
|||||||||||||||
| 2011 | 2010 | Amt | % | |||||||||||||
| Operating Indicators ($ in millions): |
||||||||||||||||
| AUM at end of the period |
$ | 15,972 | $ | 12,765 | $ | 3,207 | 25 | % | ||||||||
| Average AUM for the period |
$ | 16,154 | $ | 12,150 | $ | 4,004 | 33 | % | ||||||||
| Net client flows |
$ | 1,555 | $ | (18 | ) | $ | 1,573 | N/M | ||||||||
| Financial Indicators ($ in thousands): |
||||||||||||||||
| Operating Revenue |
$ | 19,009 | $ | 14,975 | $ | 4,034 | 27 | % | ||||||||
| Operating Income |
$ | 8,098 | $ | 5,800 | $ | 2,298 | 40 | % | ||||||||
| Net Income |
$ | 4,418 | $ | 3,346 | $ | 1,072 | 32 | % | ||||||||
| Earnings Per Share: |
||||||||||||||||
| Basic |
$ | 0.19 | $ | 0.15 | $ | 0.04 | 27 | % | ||||||||
| Diluted |
$ | 0.19 | $ | 0.15 | $ | 0.04 | 27 | % | ||||||||
| Operating Margin(1) |
43 | % | 39 | % | NM | NM | ||||||||||
| NM | not meaningful |
| (1) | Defined as operating income divided by operating revenues. |
18
Table of Contents
Business Environment
As an investment management and advisory firm, our results are impacted by the prevailing global economic climate, including such factors as corporate profitability, investor confidence, and interest rates. These factors can directly affect investor sentiment and global equity markets.
During the three months ended September 30, 2011, global equity markets endured their worst quarterly performance since the global financial crisis in 2008. The news was dominated by significant political and macroeconomic events that caused extreme market volatility and depressed investor sentiment. In particular, the continued concerns over the widening European debt crisis, partisan gridlock by the U.S. Congress in expanding the debt ceiling, and the first-ever downgrade of U.S. debt weighed on the markets. Investors were also concerned about continued global economic weakness and high unemployment, generating speculation about a double-dip recession spreading across the globe. Broad market indices suffered double-digit losses during the quarter as investors sold equities in favor of less risky investments.
Broad Market Indices*
| Period Ended September 30, 2011 | ||||||||
| Index |
Three Months | Twelve Months | ||||||
| Dow Jones Industrial Average(1) |
(11.5 | %) | 1.2 | % | ||||
| NASDAQ Composite(2) |
(12.9 | %) | (0.9 | %) | ||||
| S&P 500(3) |
(13.9 | %) | 1.1 | % | ||||
| MSCI World (net)(4) |
(16.6 | %) | (4.3 | %) | ||||
| * | assumes dividend re-investment |
| (1) | Dow Jones Industrial Average is a trademark of Dow Jones & Company, which is not affiliated with Epoch. |
| (2) | NASDAQ is a trademark of the NASDAQ Stock Market, Inc., which is not affiliated with Epoch. |
| (3) | S&P is a trademark of Standard & Poor’s, a division of the McGraw-Hill Companies, Inc., which is not affiliated with Epoch. |
| (4) | MSCI World is a trademark of MSCI Inc., which is not affiliated with Epoch. |
Market Volatility and Impact on AUM Subsequent to Quarter End
Subsequent to September 30, 2011, optimism over a potential resolution to the European debt crisis, along with improved economic data and corporate earnings, led to a sharp rise in global equity markets. Broad market indices rose in excess of 10% during the month of October 2011. As a result, the Company’s AUM increased from $16.0 billion at September 30, 2011 to approximately $18.4 billion at October 31, 2011, reflective of both market performance and net inflows.
Business Outlook
We believe we are entering a long, protracted economic recovery. While the U.S. economy has proven to be quite resilient, gross domestic product growth will likely be relatively low for an extended period of time. Volatility in the market place is expected to remain high.
Despite lingering economic uncertainties, we believe equities remain far more attractive in this business environment than fixed income securities. Stock selection will be crucial. We remain focused on identifying companies producing significant free cash flow and led by management with a history of effective capital allocation. We believe that this approach, combined with a portfolio construction process directed at providing superior long-term returns on a risk-adjusted basis, has led, and will continue to lead to demand for our investment services. Interest in our approach has increased with the increased volatility we have witnessed in the capital markets this past year. Given our strong, liquid balance sheet, our history of long-term investment performance, and our expanding distribution, we believe we continue to be well-positioned for the future.
19
Table of Contents
Assets under Management (“AUM”)
The graph below depicts the quarterly AUM and revenue growth over the past eight quarters:
20
Table of Contents
AUM and Flows
While the three months ended September 30, 2011 was a challenging market environment, we continued to attract new assets. On a year over year basis, we continued to expand our institutional and sub-advisory channels and grow our client base. The following table sets forth the changes in our AUM for the periods presented (dollars in millions):
| Three Months Ended September 30, |
||||||||
| 2011 | 2010 | |||||||
| Beginning of period AUM |
$ | 17,087 | $ | 11,344 | ||||
|
|
|
|
|
|||||
| Client flows: |
||||||||
| Inflows/new accounts |
1,880 | 359 | ||||||
| Outflows/closed accounts |
(325 | ) | (377 | ) | ||||
|
|
|
|
|
|||||
| Net inflows |
1,555 | (18 | ) | |||||
| Market performance |
(2,670 | ) | 1,439 | |||||
|
|
|
|
|
|||||
| Net change |
(1,115 | ) | 1,421 | |||||
|
|
|
|
|
|||||
| End of period AUM |
$ | 15,972 | $ | 12,765 | ||||
|
|
|
|
|
|||||
| Percent change in total AUM |
(6.5 | %) | 12.5 | % | ||||
| Net inflows/Beginning of period AUM |
9.1 | % | (0.2 | %) | ||||
For the three months ended September 30, 2011 and 2010, approximately 47% and 48%, respectively of investment advisory and management fees were earned from services to mutual funds under advisory and sub-advisory contracts whose fees are calculated based upon daily net asset values, and approximately 53% and 52%, respectively, of fees were earned from services provided for separate accounts whose fees are calculated based upon asset values at the end of the period. A significant portion of the net inflows during the three months ended September 30, 2011 transpired in September.
Investment Philosophy
We are global equity investors with a long-term perspective on the drivers of shareholder return. Our investment philosophy is focused on achieving superior long-term, risk-adjusted returns by investing in companies that generate free cash flow, appropriately allocate capital to create returns for shareholders, have understandable business models, possess transparent financial statements, and are undervalued relative to our investment team’s value determinations. Security selection and portfolio construction processes are designed to reduce the likelihood of significant losses in declining markets while participating in returns from rising markets.
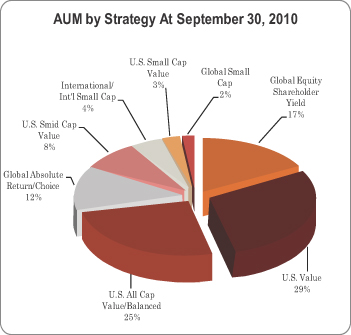
Investment Strategies
The table below depicts our investment strategies’ AUM as of September 30, 2011, June 30, 2011 and September 30, 2010, respectively, as well as the three-month and one-year changes (dollars in millions):
| September
30, 2011 |
June
30, 2011 |
September
30, 2010 |
3-Month Change |
1-Year Change |
||||||||||||||||||||||||
| Strategy | Amt | % | Amt | % | ||||||||||||||||||||||||
| Global Equity Shareholder Yield |
$ | 4,592 | $ | 3,811 | $ | 2,203 | $ | 781 | 20 | % | $ | 2,389 | 108 | % | ||||||||||||||
| U.S. Value |
4,016 | 4,661 | 3,708 | (645 | ) | (14 | %) | 308 | 8 | % | ||||||||||||||||||
| U.S. All Cap Value/Balanced |
3,299 | 3,900 | 3,187 | (601 | ) | (15 | %) | 112 | 4 | % | ||||||||||||||||||
| Global Absolute Return/Choice |
2,015 | 2,131 | 1,592 | (116 | ) | (5 | %) | 423 | 27 | % | ||||||||||||||||||
| U.S. Smid Cap Value |
773 | 1,115 | 958 | (342 | ) | (31 | %) | (185 | ) | (19 | %) | |||||||||||||||||
| International/Int’l Small Cap |
715 | 778 | 527 | (63 | ) | (8 | %) | 188 | 36 | % | ||||||||||||||||||
| U.S. Small Cap Value |
323 | 374 | 338 | (51 | ) | (14 | %) | (15 | ) | (4 | %) | |||||||||||||||||
| Global Small Cap |
239 | 317 | 252 | (78 | ) | (25 | %) | (13 | ) | (5 | %) | |||||||||||||||||
|
|
|
|
|
|
|
|
|
|
|
|||||||||||||||||||
| Total AUM |
$ | 15,972 | $ | 17,087 | $ | 12,765 | $ | (1,115 | ) | (7 | %) | $ | 3,207 | 25 | % | |||||||||||||
|
|
|
|
|
|
|
|
|
|
|
|
|
|
|
|||||||||||||||
21
Table of Contents
The charts that follow show our investment strategies as a percentage of AUM as of September 30, 2011 and 2010, respectively:
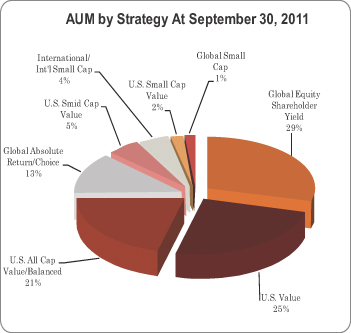
|
|
22
Table of Contents
Investment Strategy Performance
We measure relative investment performance by comparing our investment returns to competing investment strategies, industry benchmarks and client investment objectives. As long-term fundamental investors, we believe that our investment strategies yield the most benefits, and are best evaluated, over a long-term time horizon. The following table displays our investment strategies’ composite returns, net of management fees, for the three months ended, as well as the one, three and five year periods ended September 30, 2011 and since investment strategy inception as measured against their applicable benchmarks:
| Returns (%)(2)(3) | ||||||||||||||||||||||||
| Strategy |
Inception Date(1) |
3 Months |
1 Year |
3 Years |
5 Years |
Since Inception |
||||||||||||||||||
| U.S. Value |
7/31/01 | (16.1 | ) | (0.3 | ) | 1.5 | 0.7 | 4.0 | ||||||||||||||||
| Russell 1000 |
(14.7 | ) | 0.9 | 1.6 | (0.9 | ) | 1.7 | |||||||||||||||||
| Russell 1000 Value |
(16.2 | ) | (1.9 | ) | (1.5 | ) | (3.5 | ) | 2.1 | |||||||||||||||
| U.S. All Cap Value |
7/31/94 | (18.5 | ) | (1.7 | ) | 0.6 | 0.0 | 9.5 | ||||||||||||||||
| Russell 3000 |
(15.3 | ) | 0.5 | 1.5 | (0.9 | ) | 7.5 | |||||||||||||||||
| Russell 3000 Value |
(16.6 | ) | (2.2 | ) | (1.6 | ) | (3.5 | ) | 7.8 | |||||||||||||||
| Global Equity Shareholder Yield |
12/31/05 | (9.8 | ) | 4.8 | 5.7 | 2.6 | 4.7 | |||||||||||||||||
| MSCI World (Net) |
(16.6 | ) | (4.3 | ) | (0.1 | ) | (2.2 | ) | (0.2 | ) | ||||||||||||||
| Global Absolute Return |
12/31/01 | (14.0 | ) | (1.2 | ) | 3.1 | 1.2 | 7.9 | ||||||||||||||||
| MSCI World (Net) |
(16.6 | ) | (4.3 | ) | (0.1 | ) | (2.2 | ) | 2.9 | |||||||||||||||
| Global Choice |
9/30/05 | (13.8 | ) | (0.4 | ) | 2.5 | 1.6 | 5.2 | ||||||||||||||||
| MSCI World (Net) |
(16.6 | ) | (4.3 | ) | (0.1 | ) | (2.2 | ) | 0.3 | |||||||||||||||
| U.S. Choice |
4/30/05 | (16.5 | ) | 1.1 | 2.8 | 0.5 | 3.6 | |||||||||||||||||
| Russell 3000 |
(15.3 | ) | 0.5 | 1.5 | (0.9 | ) | 2.1 | |||||||||||||||||
| U.S. Smid Cap Value |
8/31/06 | (19.4 | ) | (3.5 | ) | 2.2 | 0.8 | 1.0 | ||||||||||||||||
| Russell 2500 |
(21.2 | ) | (2.2 | ) | 2.3 | 0.2 | 0.4 | |||||||||||||||||
| Russell 2500 Value |
(21.1 | ) | (4.7 | ) | 0.1 | (1.7 | ) | (1.5 | ) | |||||||||||||||
| International Small Cap |
1/31/05 | (22.6 | ) | (11.3 | ) | 4.9 | 0.3 | 6.0 | ||||||||||||||||
| MSCI World ex USA Small Cap (Net) |
(18.9 | ) | (5.6 | ) | 6.3 | (1.2 | ) | 3.3 | ||||||||||||||||
| U.S. Small Cap Value |
12/31/02 | (18.5 | ) | 0.1 | 1.0 | 0.6 | 7.1 | |||||||||||||||||
| Russell 2000 |
(21.9 | ) | (3.5 | ) | (0.4 | ) | (1.0 | ) | 7.5 | |||||||||||||||
| Russell 2000 Value |
(21.5 | ) | (6.0 | ) | (2.8 | ) | (3.1 | ) | 7.0 | |||||||||||||||
| Global Small Cap |
12/31/02 | (20.7 | ) | (5.2 | ) | 4.6 | 2.1 | 9.8 | ||||||||||||||||
| MSCI World Small Cap (Net) |
(20.4 | ) | (4.0 | ) | 4.7 | (0.3 | ) | 10.4 | ||||||||||||||||
| (1) | Epoch Investment Partners, Inc. became a registered investment adviser under the Investment Advisers Act of 1940 in June 2004. Performance from April 2001 through May 2004 is for Epoch’s investment team and accounts while at Steinberg Priest & Sloane Capital Management, LLC. For the period from July 1994 through March 2001, Co-Chief Investment Officer and Chief Executive Officer William W. Priest managed the accounts while at Credit Suisse Asset Management and was the only individual responsible for selecting the securities to buy and sell. |
| (2) | Index and investment strategy returns assume dividend re-investment. Index and investment strategy returns for the one, three, and five year periods, and since inception represent annualized returns. Investment strategy returns are net of management fees. |
| (3) | Past performance is not indicative of future results. |
23
Table of Contents
Distribution Channels
Our AUM is distributed through multiple channels. Our institutional sales efforts include building strong relationships with institutional consultants and also establishing direct relationships with institutional clients.
We have sub-advisory relationships that provide access to market segments that we would not otherwise serve. For example, we currently serve as sub-advisor to mutual funds offered by major financial institutions in retail channels. These mandates are attractive to us because we have chosen not to build the large team of sales professionals typically required to sell directly to retail clients. We approach the servicing of those relationships in a manner similar to our approach with large institutional account clients.
The table below presents our AUM by distribution channel as of September 30, 2011, June 30, 2011 and September 30, 2010, respectively (dollars in millions):
| September 30, 2011 | June 30, 2011 | September 30, 2010 | ||||||||||||||||||||||
| Distribution Channel |
Amount | % of AUM | Amount | % of AUM | Amount | % of AUM | ||||||||||||||||||
| Sub-advisory |
$ | 7,977 | 50 | % | $ | 8,680 | 51 | % | $ | 6,943 | 54 | % | ||||||||||||
| Institutional |
7,759 | 49 | % | 8,140 | 48 | % | 5,562 | 44 | % | |||||||||||||||
| Other |
236 | 1 | % | 267 | 1 | % | 260 | 2 | % | |||||||||||||||
|
|
|
|
|
|
|
|
|
|
|
|
|
|||||||||||||
| Total AUM |
$ | 15,972 | 100 | % | $ | 17,087 | 100 | % | $ | 12,765 | 100 | % | ||||||||||||
|
|
|
|
|
|
|
|
|
|
|
|
|
|||||||||||||
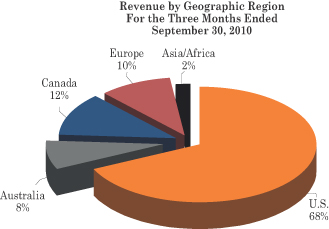
Revenue by Geographic Region
We continued to expand our global distribution network. Operating revenues from clients domiciled outside the U.S. represent approximately 35% of our total operating revenue. The following charts show our operating revenue by geographic region as a percentage of total operating revenue for the three months ended September 30, 2011 and 2010:
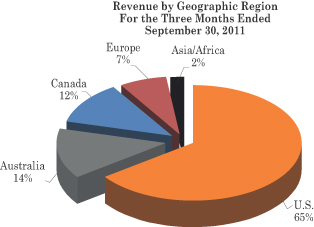
|
|
24
Table of Contents
Results of Operations
For Three Months Ended September 30, 2011 and 2010
For the three months ended September 30, 2011, net income was $4.4 million, compared to $3.3 million for the same period a year ago. Basic earnings per share were $0.19 compared to $0.15 per share for the same period a year ago.
Drivers for the change in net income were as follows:
| • | Total operating revenues increased by 27%, as AUM increased approximately 25% from the same period a year ago. Average AUM increased by 33%. |
| • | Operating margin increased to 43% for the three months ended September 30, 2011 compared to 39% for the three months ended September 30, 2010, as a result of revenue growth and our operating leverage. |
Operating Revenues:
| Sept.
30, 2011 |
Sept.
30, 2010 |
’11 vs. ’10 Change |
||||||||||||||
| (Dollars in thousands) |
$ | % | ||||||||||||||
| Investment advisory and management fees |
$ | 18,111 | $ | 14,795 | $ | 3,316 | 22% | |||||||||
|
The increase in investment advisory and management fees is attributable to the increase in AUM levels, primarily as a result of net inflows from new and existing clients during the past twelve months. Net client inflows were $1.6 billion for the three months ended September 30, 2011 and $3.4 billion for the twelve months ended September 30, 2011.
For the three months ended September 30, 2011 and 2010, New York Life Investment Management accounted for approximately 18% and 19%, of consolidated operating revenues, respectively. |
| |||||||||||||||
| Sept.
30, 2011 |
Sept.
30, 2010 |
’11 vs. ’10 Change |
||||||||||||||
| (Dollars in thousands) |
$ | % | ||||||||||||||
| Performance fees |
$ | 898 | $ | 180 | $ | 718 | 399% | |||||||||
|
We have certain fee agreements that allow us to earn performance fees in the event that investment returns meet or exceed certain pre-established benchmarks specified in the agreements. Revenues for these incentives are recognized only when such performance targets are met or exceeded at the end of the measurement period.
The increase in performance fees stems from the addition of new clients with performance fee agreements, coupled with relative performance on both the new and existing performance fee accounts.
Operating Expenses:
We are continuously managing and reviewing our resource allocation. Our largest expense is compensation. Our ability to compete depends, in part, on our ability to attract and retain key employees while managing our compensation and other costs.
|
| |||||||||||||||
| Sept.
30, 2011 |
Sept.
30, 2010 |
’11 vs. ’10 Change |
||||||||||||||
| (Dollars in thousands) |
$ | % | ||||||||||||||
| Employee compensation and benefits |
$ | 7,817 | $ | 6,748 | $ | 1,069 | 16% | |||||||||
| As a percent of total revenue |
41% | 45% | ||||||||||||||
25
Table of Contents
|
Employee related costs include salaries, incentive compensation, share-based compensation, benefits, signing bonuses, commissions and severance. Recruiting and retaining high-caliber, experienced employees are critical to our growth strategy. We place a high emphasis on pay for performance. As such, changes in our Company’s performance as well as changes in underlying performance of our investment strategies have an impact on our employee compensation and benefit costs.
The increase for the period presented is primarily a result of additions to professional staff. Average headcount increased approximately 12% for the three months ended September 30, 2011 compared to the previous year. Several additions were made to our investment and client relations teams to support our business expansion. A modest increase in base salaries due to merit raises at the beginning of the calendar year 2011, as well as an increase in accrued incentive compensation and share-based compensation based on our operating results, also contributed to the increase. Compensation as a percentage of revenue, however, continues to decline. | ||||||||
| Sept.
30, 2011 |
Sept.
30, 2010 |
’11 vs. ’10 Change |
||||||||||||||
| (Dollars in thousands) |
$ | % | ||||||||||||||
| Occupancy and technology |
$ | 1,185 | $ | 1,040 | $ | 145 | 14% | |||||||||
| As a percent of total revenue |
6% | 7% | ||||||||||||||
|
Occupancy and technology costs consist primarily of office space rentals, market data services, information technology costs and depreciation. An increase in market data services was the primary reason for the increase.
As a result of our planned growth we are in the process of exploring opportunities for additional office space to accommodate staffing and may enter into a contractual obligation within the next twelve months.
|
| |||||||||||||||
| Sept.
30, 2011 |
Sept.
30, 2010 |
’11 vs. ’10 Change |
||||||||||||||
| (Dollars in thousands) |
$ | % | ||||||||||||||
| General and administrative |
$ | 1,084 | $ | 572 | $ | 512 | 90% | |||||||||
| As a percent of total revenue |
6% | 4% | ||||||||||||||
|
General and administrative costs consist primarily of expenses for travel and entertainment, product distribution, advertising and marketing, insurance, and other office related items. Increased product distribution costs and travel expenses to support new client mandates and the expansion of our distribution efforts were the primary reasons for the increase.
|
| |||||||||||||||
| Sept.
30, 2011 |
Sept.
30, 2010 |
’11 vs. ’10 Change |
||||||||||||||
| (Dollars in thousands) |
$ | % | ||||||||||||||
| Professional fees and services |
$ | 825 | $ | 815 | $ | 10 | 1% | |||||||||
| As a percent of total revenue |
4% | 5% | ||||||||||||||
|
These expenses include outside legal fees for general corporate counsel, independent accountants’ fees, consulting fees, employee placement fees and other professional services. This expense was virtually unchanged from the comparable period a year ago.
|
| |||||||||||||||
| Sept.
30, 2011 |
Sept.
30, 2010 |
’11 vs. ’10 Change |
||||||||||||||
| (Dollars in thousands) |
$ | % | ||||||||||||||
| Other income/(loss) |
$ | (194 | ) | $ | 158 | $ | (352 | ) | (223% | ) | ||||||
| As a percent of income before income taxes |
(2% | ) | 3% | |||||||||||||
26
Table of Contents
|
Other income primarily includes realized gains and losses on sales of investments, dividends from investments, and interest income. The current period includes realized losses on investments of $0.2 million. Additionally, the decline from the comparable period a year ago reflects a reduction in sublease income due to the expiration of a sublease of premises to a third party.
|
| |||||||||||||||
| Sept.
30, 2011 |
Sept.
30, 2010 |
’11 vs. ’10 Change |
||||||||||||||
| (Dollars in thousands) |
$ | % | ||||||||||||||
| Provision for income taxes |
$ | 3,486 | $ | 2,612 | $ | 874 | 33% | |||||||||
| Effective income tax rate |
44% | 44% | ||||||||||||||
The increase in the provision for income taxes is the result of higher pre-tax income levels when compared with the same period a year ago.
At the end of each interim period, we estimate the annual effective income tax rate and apply that rate to our ordinary quarterly earnings. The effect of changes in enacted tax laws or rates is recognized in the interim period in which the change occurs. The computation of the annual estimated effective tax rate at each interim period requires certain estimates and judgments including, but not limited to, the expected operating income for the year, projections of the proportion of income earned and taxed in various jurisdictions, and permanent differences. The accounting estimates used to compute the provision for income taxes may change as new events occur, additional information is obtained, or as the tax environment changes.
Three Months Ended September 30, 2011 and Prior Three Months Ended June 30, 2011
The table below presents key operating and financial indicators for the three months ended September 30, 2011 and the three months ended June 30, 2011, respectively:
| Three Months Ended | Change | |||||||||||||||
| Sept.
30 2011 |
June
30 2011 |
|||||||||||||||
| Amt | % | |||||||||||||||
| Operating Indicators ($ in millions): |
||||||||||||||||
| AUM at end of period |
$ | 15,972 | $ | 17,087 | $ | (1,115 | ) | (7% | ) | |||||||
| Average AUM for the period |
$ | 16,154 | $ | 16,628 | $ | (474 | ) | (3% | ) | |||||||
| Net AUM flows |
$ | 1,555 | $ | 1,240 | $ | 315 | 25% | |||||||||
| Financial Indicators ($ in thousands): |
||||||||||||||||
| Operating Revenue |
$ | 19,009 | $ | 20,702 | $ | (1,693 | ) | (8% | ) | |||||||
| Operating Income |
$ | 8,098 | $ | 9,197 | $ | (1,099 | ) | (12% | ) | |||||||
| Net Income |
$ | 4,418 | $ | 5,314 | $ | (896 | ) | (17% | ) | |||||||
| Earnings Per Share: |
||||||||||||||||
| Basic |
$ | 0.19 | $ | 0.22 | $ | (0.03 | ) | (14% | ) | |||||||
| Diluted |
$ | 0.19 | $ | 0.22 | $ | (0.03 | ) | (14% | ) | |||||||
| Operating Margin(1) |
43% | 44% | (1% | ) | NM | |||||||||||
| NM | not meaningful. |
| (1) | Defined as operating income divided by total operating revenues. |
Our operating income decreased by 12%, and is reflective of the decrease in operating revenue, partially offset by lower operating expenses. The decline in operating revenue was caused by global equity market declines ranging from approximately 12% to 22% during the three months ended September 30, 2011. While both AUM and operating revenues declined from the previous three months ended June 30, 2011, the firm attracted significant net inflows during the period, with a substantial portion transpiring during the month of September. A reduction in employee placement fees and share-based compensation expense were the primary contributors to the reduction in operating expenses during the current three month period.
27
Table of Contents
Liquidity and Capital Resources
We believe our ability to generate cash from operating activities is one of our fundamental financial strengths. We do not have any debt and we do not foresee any reason to incur debt unless a significant business opportunity warrants such action. We routinely evaluate our strategic position and maintain a disciplined acquisition and alliance effort, which seeks complementary investment strategies or new investment strategies that would benefit our clients and be accretive to our long-term business strategy. While we plan to actively seek such opportunities, there can be no assurance that any such acquisitions or alliances can be identified or consummated on terms that will be attractive to us.
Sources of Liquidity
Our principal source of liquidity is cash flows from operating activities, particularly investment management fees. Our current financial condition is highly liquid, with a significant amount of our assets comprised of cash and cash equivalents and accounts receivable. While it is currently our intention to hold the held-to-maturity securities until maturity and the other investments long term, we have the ability to convert these items into cash and cash equivalents during any fiscal year. Cash and cash equivalents, accounts receivable, held-to-maturity securities, and other investments accounted for approximately 79% of total assets as of September 30, 2011.
We realized excess tax benefits of $1.3 million during the three months ended September 30, 2011. Excess tax benefits reduce the amount of income taxes to be paid. Excess tax benefits arise in connection with our share-based compensation. When a restricted stock award vests, the market price on the date the stock vests to the employee may be higher than the original grant-date fair market value of the award. If so, the difference between the cumulative amount that has been recognized through the Statement of Income and the vesting amount results in an excess tax benefit. Excess tax benefits reduce income taxes payable and increase additional paid-in capital in the period they are recognized.
The following table summarizes our principal and potential sources of liquidity as of September 30, 2011 and June 30, 2011 (dollars in thousands):
| September 30, 2011 |
June 30, 2011 |
|||||||
| Balance Sheet Data: |
||||||||
| Cash and cash equivalents |
$ | 35,315 | $ | 29,128 | ||||
| Accounts receivable |
15,880 | 17,183 | ||||||
| Held-to-maturity securities |
1,950 | 1,960 | ||||||
| Other investments |
8,111 | 8,907 | ||||||
|
|
|
|
|
|||||
| Total |
$ | 61,256 | $ | 57,178 | ||||
|
|
|
|
|
|||||
We believe that the sources of liquidity described above as well as our continuing cash flows from operations will be sufficient to meet our operating needs for the foreseeable future and will enable us to continue implementing our growth strategy. We do not maintain or anticipate a need for an external source of liquidity.
Uses of Liquidity
We remain committed to growing our business in this challenging market environment and expect that our main uses of cash will be to pay corporate operating expenses, recruit key personnel, enhance our operating and technology infrastructure, pay quarterly dividends, and repurchase shares of our common stock when appropriate.
Our philosophy regarding the maintenance of a balance sheet with a large component of cash and cash equivalents reflects our views on potential future capital requirements relating to enhancement of our investment capabilities, creation and expansion of distribution channels, potential strategic acquisitions or transactions, and
28
Table of Contents
possible challenges to our business. If we believe that no such prudent and reasonable opportunity exists, our approach is to return capital to our shareholders. We regularly assess our position in view of our current and potential future needs.
Cash Flows Analysis
Operating cash flows are primarily influenced by the timing and receipt of investment management fees, and the payment of operating expenses, including cash incentive compensation to our employees. Investment management fees are generally collected within 90 days of quarter-end.
Investing cash flows are principally influenced by investments and capital expenditures for property and equipment.
Financing cash flows are predominantly influenced by the payment of cash dividends, the repurchase of our common stock and excess tax benefits on share-based compensation. We have been making continuous quarterly dividend payments on our common stock since the quarter ended December 31, 2007 and have paid three special dividends.
A summary of the Statement of Cash Flows for the three months ended September 30, 2011 and 2010, respectively, is as follows (in thousands):
| Three Months Ended September 30, |
||||||||
| 2011 | 2010 | |||||||
| Cash flows provided by/(used in): |
||||||||
| Operating activities |
$ | 7,926 | $ | 6,091 | ||||
| Investing activities |
(162 | ) | (1,859 | ) | ||||
| Financing activities |
(1,577 | ) | (1,420 | ) | ||||
|
|
|
|
|
|||||
| Net increase in cash and cash equivalents |
6,187 | 2,812 | ||||||
| Cash and cash equivalents at beginning of period |
29,128 | 36,447 | ||||||
|
|
|
|
|
|||||
| Cash and cash equivalents at end of period |
$ | 35,315 | $ | 39,259 | ||||
|
|
|
|
|
|||||
A more detailed analysis of the Statement of Cash Flows is as follows:
Cash Flows from Operating Activities
Our cash flows from operating activities are calculated by adjusting net income to reflect certain significant non-cash items such as share-based compensation, depreciation and changes in deferred tax balances, and timing differences in the cash settlement of operating assets and liabilities.
For the three months ended September 30, 2011, our net cash provided by operating activities totaled $7.9 million. The increase from the prior year period reflects the increase in revenues and related operating income as well as the timing differences in the cash settlement of assets and liabilities.
Accounts receivable decreased by $1.3 million at September 30, 2011 from June 30, 2011 and is reflective of lower management fees earned during the three months ended September 30, 2011 as a result of the lower levels of AUM and revenue. The $2.1 million increase in prepaid and other current assets primarily reflects higher quarterly estimated tax payments. Accrued compensation and benefits increased by $2.9 million from the June 30, 2011 balance and primarily represents accruals for incentive compensation. This liability is generally paid shortly after the calendar year end.
29
Table of Contents
Cash Flows from Investing Activities
Our cash flows from investing activities consist primarily of capital expenditures, as well as investments in Company-sponsored investment strategies and other investments.
Cash flows used in investing activities totaled $0.2 million for the three months ended September 30, 2011 and reflects capital expenditures for technology equipment and the re-investment of earnings from Company-sponsored investment strategies. During the prior year period, an investment of $2.0 million in a non-affiliated investment limited partnership accounted for most of the cash flows used in investing activities.
Cash Flows from Financing Activities
Our cash flows from financing activities primarily reflect the payment of common stock dividends, the repurchase of our common stock, and the recognition of excess tax benefits associated with share-based compensation.
The primary cash flows used in financing activities during the three months ended September 30, 2011 were $1.4 million for the payment of the quarterly dividend and $1.6 million for the repurchase of common stock. Approximately $0.8 million of the repurchase of common stock was under our authorized share repurchase program and approximately $0.8 million was in conjunction with the relinquishment of shares by employees to cover payroll taxes in connection with employee stock vesting. Excess tax benefits of $1.3 million in connection with share-based compensation partially offset the cash used in financing activities.
Working Capital
Our working capital and current ratio at September 30, 2011 and June 30, 2011 are set forth in the table below (in thousands):
| September
30, 2011 |
June
30, 2011 |
Change | ||||||||||||||
| $ | % | |||||||||||||||
| Current Assets |
$ | 57,170 | $ | 50,044 | $ | 7,126 | 14 | % | ||||||||
| Current Liabilities |
10,978 | 8,431 | 2,547 | 30 | % | |||||||||||
|
|
|
|
|
|
|
|||||||||||
| Working Capital |
$ | 46,192 | $ | 41,613 | $ | 4,579 | 11 | % | ||||||||
|
|
|
|
|
|
|
|
|
|||||||||
| Current Ratio(1) |
5.2 | 5.9 | (0.7 | ) | (12 | %) | ||||||||||
|
|
|
|
|
|
|
|
|
|||||||||
| (1) | Current assets divided by current liabilities. |
Quarterly Dividends on Common Stock
A quarterly dividend of approximately $1.4 million was paid in August 2011. On October 5, 2011, our Board of Directors approved an increase in the quarterly dividend on our common stock from $0.06 to $0.08 per share. The dividend is payable on November 11, 2011 to all shareholders of record at the close of business on October 28, 2011.
We expect regular quarterly cash dividends to be paid in February, May, August and November of each fiscal year. However, the actual declaration of future cash dividends, and the establishment of record and payment dates, are subject to determination by our Board of Directors each quarter after its review of our financial performance, as well as general business conditions, capital requirements, and any legal or regulatory restrictions. We may change our dividend policy at any time.
Common Stock Repurchase Plan
We maintain a stock repurchase plan with the objective of maximizing shareholder value. Subject to applicable law, the shares may be purchased from time to time in the open market and/or in privately negotiated transactions. Such purchases will be at times and in amounts as we deem appropriate, based on factors such as prevailing market conditions, legal requirements and other business considerations.
30
Table of Contents
During the three months ended September 30, 2011, we repurchased 55,600 of our common shares at a weighted-average price of $14.15 per share pursuant to the share repurchase plan. As of September 30, 2011, we repurchased a cumulative total of 635,616 shares and had a total of 164,384 shares remaining available for repurchase under the existing repurchase plan.
On October 5, 2011, the Board of Directors authorized the Company to repurchase up to an additional 350,000 shares of its outstanding common stock.
All shares repurchased are shown as treasury stock at cost, in the stockholders’ equity section of the Condensed Consolidated Balance Sheets. For additional information regarding repurchases of our equity securities, see Part II, Item 2, (c) “Purchases of Equity Securities by the Issuer”.
Employee Tax Withholding
To satisfy statutory employee tax withholding requirements related to the vesting of common shares, employees may elect to have the Company withhold shares and remit the necessary tax withholding on their behalf. We may promptly sell these shares in the open market on behalf of employees or acquire them as treasury shares. Any resulting gain or loss on sale is accounted for as an adjustment to additional paid-in capital. During the three months ended September 30, 2011, a total of 42,331 employee relinquished shares related to employee tax withholding were acquired as treasury shares.
Fair Value Measurements
Our other investments consist of investments in Company-sponsored investment vehicles, including mutual funds, an investment strategy separate account, and a limited liability company. Other investments also include an investment in a non-affiliated investment limited partnership.
The investments in mutual funds and in the separate account are accounted for as available-for-sale, and the fair values are determined under the market approach through the use of unadjusted quoted market prices. The investment in the non-affiliated investment limited partnership is also accounted for as available-for-sale, and its fair value is determined based on our ownership interest in the partnership’s net assets. The value of net assets is based on the underlying assets and liabilities of the partnership, which primarily include exchange-listed common stocks and money market funds.
The investment in the limited liability company is accounted for under the equity method, whereby we record our percentage share of realized and unrealized earnings and losses in the Condensed Consolidated Statement of Income. Consequently, this investment is not recorded at fair value, but approximates fair value.
The gross unrealized losses from available-for-sale securities were primarily caused by overall weakness in the financial markets and world economy. The securities are expected to recover their value over time. We have the intent and ability to hold these investments until such recovery occurs.
We do not hold any derivative instruments or financial liabilities. See Note 5 to the Condensed Consolidated Financial Statements for a further discussion on Fair Value Measurements.
Contractual Obligations
Our contractual obligations are summarized in our Annual Report on Form 10-K for the fiscal year ended June 30, 2011. At September 30, 2011, there were no material changes in our contractual obligations from June 30, 2011.
We believe our present office space is adequate for our existing operating needs. However, we anticipate the need for additional office space with future growth. Therefore, we are in the process of exploring opportunities for additional office space to accommodate staffing and may enter into a contractual obligation within the next twelve months.
31
Table of Contents
Off-Balance Sheet Arrangements
As of September 30, 2011, we had no off-balance sheet arrangements.
New Accounting Pronouncements
In May 2011, the Financial Accounting Standard Board (“FASB”) issued Accounting Standards Update (“ASU”) No. 2011-04, Fair Value Measurement (Topic 820): Amendments to Achieve Common Fair Value Measurement and Disclosure Requirements in U.S. GAAP and IFRS. ASU No. 2011-04 generally provides a uniform framework for fair value measurements and related disclosures between U.S. GAAP and International Financial Reporting Standards (“IFRS”). Additional disclosure requirements in the update include, among other things, the disclosure of all transfers between Level 1 and Level 2 of the fair value hierarchy. ASU No. 2011-04 will be effective for the interim and annual periods beginning on or after December 15, 2011. Early adoption is not permitted. The Company does not expect the adoption of this standard to have a material impact on its consolidated financial position, results of operations, or cash flows.
Item 3. Quantitative and Qualitative Disclosures About Market Risk.
In the normal course of business, our results of operations and financial position are subject to different types of risk, including market risk. Market risk is the risk that our investment strategies we manage will incur losses primarily due to adverse changes in equity prices, interest rates, or currency exchange rates. As an investment manager, we continuously identify, assess, and manage market and other risks. The following information, together with information included in other parts of Item 2, “Management’s Discussion and Analysis of Financial Condition and Results of Operations,” illustrate the significant characteristics of certain items that cause market risk to us.
In evaluating market risk, it is important to note that substantially all of our revenue is based on the market value of AUM. As noted in “Risk Factors” in Item 1A of our June 30, 2011 Annual Report filed on Form 10-K, declines of equity market values negatively impact our revenue and net income.
The management of market risk on behalf of our clients and its impact on fees is a significant focus for us. We use a variety of risk measurement techniques to identify and manage market risk within client portfolios. However, at the corporate level, we have historically not attempted to hedge revenue fluctuations that arise from changes in fair value of our overall AUM.
Equity Price Risk
Revenues
Our predominant exposure to market risk is directly related to our role as an investment adviser to the separate accounts we manage and funds we sub-advise. Substantially all of our management fees are based upon the market value of our AUM. Accordingly, our investment management fees will change in proportion to changes in the market price of equity securities underlying our AUM. During the three months ended September 30, 2011, approximately 47% of our management fees were derived from daily net asset values, while the remaining 53% of management fees were derived from market values of AUM at the end of the quarter. Declines in equity security market prices could cause our revenues and net income to decline by causing:
| • | the value of our AUM to decrease, which would result in lower investment management fees; |
| • | the returns realized on our AUM to decrease, impacting performance fees; and |
| • | clients to withdraw funds in favor of investments in markets or investment strategies that they perceive as offering greater opportunity or lower risk, which would also result in lower investment management fees. |
In addition, a decline in the price of securities may present market conditions that could preclude us from increasing AUM and prevent us from realizing higher revenue associated with such growth. Under performance of client accounts relative to competing investment strategies could exacerbate these factors.
32
Table of Contents
Our AUM was approximately $16.0 billion as of September 30, 2011. At September 30, 2011, we performed a sensitivity analysis to assess the potential loss in the fair value and associated revenue of our market-risk sensitive AUM. Assuming a 10% market decline in associated market indices, and the change proportionally distributed over all of our investment strategies, our AUM would decrease by an estimated $1.5 billion, which would cause an annualized decrease in total investment advisory and management fees of approximately $6.8 million. We do not hedge equity price risk on this exposure.
We earn performance fees on certain client accounts in the event that investment returns meet or exceed targeted amounts specified in the investment management agreements. Our performance fees will be impacted by changes in the market values of those accounts. However, several other factors may influence the degree of impact, including: the performance criteria for respective investment portfolio, the period over which the performance fee applies, and, to the extent applicable, the previous performance of the investment portfolio. As a result, the impact on changes in market risk factors on performance fees may vary widely and is therefore not readily predicted or estimated. Historically, less than 5% of our revenues have been generated from performance fees.
Company Investments
We are exposed to fluctuations in the market security price of the Company’s investments. Company investments primarily consist of investments in Company-sponsored investment vehicles, including mutual funds, an investment strategy separate account, and a limited liability company. Company investments also include an investment in a non-affiliated investment limited partnership. We do not hedge our market security price risk related to these investments and do not intend to do so in the future.
At September 30, 2011 and June 30, 2011, respectively, we performed a sensitivity analysis to assess the potential loss in the fair value of these market-risk sensitive securities. The following table represents the estimated impact on our financial position assuming a hypothetical 10% decline in associated market indices (in thousands):
| Fair Value | Fair Value Assuming 10% Decline(1) |
Decrease in Stockholders’ Equity(2) |
||||||||||
| At September 30, 2011: |
||||||||||||
| Available-for-sale securities: |
||||||||||||
| Investment in limited partnership |
$ | 4,102 | $ | 4,065 | $ | 21 | ||||||
| Epoch Global All Cap separate account |
2,571 | 2,304 | 151 | |||||||||
| Company-sponsored mutual funds |
989 | 895 | 53 | |||||||||
| Equity method investment: |
||||||||||||
| Epoch Global Absolute Return Fund, LLC |
449 | 408 | 23 | |||||||||
|
|
|
|
|
|
|
|||||||
| Total Other Investments |
$ | 8,111 | $ | 7,672 | $ | 248 | ||||||
|
|
|
|
|
|
|
|||||||
| At June 30, 2011: |
||||||||||||
| Available-for-sale securities: |
||||||||||||
| Investment in limited partnership |
$ | 4,144 | $ | 4,132 | $ | 7 | ||||||
| Epoch Global All Cap separate account |
3,061 | 2,752 | 174 | |||||||||
| Company-sponsored mutual funds |
1,179 | 1,067 | 63 | |||||||||
| Equity method investment: |
||||||||||||
| Epoch Global Absolute Return Fund, LLC |
523 | 477 | 26 | |||||||||
|
|
|
|
|
|
|
|||||||
| Total Other Investments |
$ | 8,907 | $ | 8,428 | $ | 270 | ||||||
|
|
|
|
|
|
|
|||||||
| (1) | Based upon the investment’s correlation with its associated market index, a hypothetical 10% decline in the associated market index may result in a change other than 10% in the respective investment. |
| (2) | Investments in the Company-sponsored mutual funds, the Epoch Global All-Cap separate account, and the investment limited partnership are classified as available-for-sale securities. Unrealized gains or losses on available-for-sale securities are excluded from earnings and recorded in accumulated other comprehensive |
33
Table of Contents
| income/(loss), net of tax, as a separate component of stockholders’ equity until realized. The investment in the Epoch Global Absolute Return Fund, LLC is accounted for using the equity method, under which our share of net realized and unrealized earnings or losses from the limited liability company is reflected in net income. All amounts shown in this column are net of tax. |
Interest Rate Risk
Held-to-Maturity Investments
Our investment income is subject to interest rate risk. Investment income consists primarily of interest income and realized gains and losses on our investments. We have invested in and continue to hold high-grade debt securities. Since it is our intent to hold these investments until they mature, we have accounted for them as held-to-maturity securities. We do not hedge our interest rate risk related to these securities and we do not intend to do so in the future. We believe that a hypothetical change in interest rates of 100 basis points would not have a material impact on our condensed consolidated results of operations, financial condition or cash flows.
The table below provides information about our investment securities held-to-maturity, including expected principal flows for the fiscal years June 30, 2012 through June 30, 2017 and thereafter (in thousands):
| Payments Due in Fiscal Years Ended June 30, |
||||||||||||||||||||||||||||||||
| 2012 | 2013 | 2014 | 2015 | 2016 | 2017 and Thereafter |
Total Principal Cash Flows |
Fair Market Value at September 30, 2011 |
|||||||||||||||||||||||||
| Long-term debt securities |
$ | 350 | $ | 1,050 | $ | 500 | $ | — | $ | — | $ | — | $ | 1,900 | $ | 1,993 | ||||||||||||||||
| Weighted-average interest rate |
1.67 | % | 2.14 | % | 2.66 | % | 2.19 | % | ||||||||||||||||||||||||
Cash and Cash Equivalents
Cash consists of amounts held in checking and money market accounts. Cash equivalents include highly liquid investments in money market funds consisting of short-term securities of the U.S. government and its agencies with maturities of three months or less when acquired. Cash and cash equivalents are exposed to market risk due to changes in interest rates, which impacts interest income.
We monitor the quality of the institution where our cash is deposited, the balance of which, at times, may be in excess of the Federal Deposit Insurance Corporation insurance limits. Presently, we neither participate in hedging activities nor have any derivative financial instruments.
While changes in interest rates could decrease our interest income, we do not believe we have a material exposure to changes in interest rates. We do not undertake any specific actions to cover our exposure to interest rate risk and are not a party to any interest rate risk transactions.
Foreign Currency Exchange Risk
Certain client portfolios include securities denominated in foreign currencies. Accordingly, foreign currency fluctuations may affect our AUM. For securities denominated in currencies other than U.S. dollars, an increase in the value of the U.S. dollar relative to those non-U.S. currencies may result in a decrease in the dollar value of our AUM, which, in turn, would result in lower U.S. dollar denominated revenues. We estimate that, as of September 30, 2011, a 10% weakening or strengthening of the U.S. dollar against all or any combination of currencies to which our portfolios have exposure to exchange rates would not have a material effect on our revenues.
While we operate in the U.S., we have clients in several countries outside the U.S. However, nearly all of our revenue from these clients and the associated expenses are denominated in U.S. dollars. Therefore, only a
34
Table of Contents
limited portion of our revenues and expenses are impacted by movements in currency exchange rates. The effect of a 10% change in exchange rates on such revenues and expenses would not have a material effect on our results of operations. We currently do not hedge our currency exposure, and we do not enter into foreign currency transactions for speculative purposes. Our exposure to currency movements may likely increase as our business outside the U.S. grows, and we will continue to monitor our foreign currency exposure accordingly.
Item 4. Controls and Procedures.
Evaluation of Disclosure Controls and Procedures
The Company has established and maintains disclosure controls and other procedures (as defined in Rule 13a-15(e) under the Securities Exchange Act of 1934, as amended (the “Exchange Act”)), that are designed to provide reasonable assurance that material information relating to Epoch Holding Corporation and its subsidiaries on a consolidated basis required to be disclosed in its reports filed or submitted under the Exchange Act, is recorded, processed, summarized and reported within the time periods specified in the SEC’s rules and forms, and that such information is accumulated and communicated accurately to the Company’s management, including its principal executive officer and principal financial and accounting officer, as appropriate, to allow timely decisions regarding required disclosure. There are inherent limitations to the effectiveness of any system of disclosure controls and procedures, including the possibility of human error and the circumvention or overriding of the controls and procedures. In designing and evaluating our disclosure controls and procedures, management recognized that disclosure controls and procedures, no matter how well conceived and operated, can only provide reasonable, not absolute assurance, that the objectives of the disclosure controls and procedures are met.
For the quarter ended September 30, 2011, management, with the participation of the Company’s principal executive officer and principal financial and accounting officer, has evaluated the effectiveness of the design and operation of the Company’s disclosure controls and procedures. Based on such evaluation of these disclosure controls and procedures, the Company’s principal executive officer and principal financial and accounting officer have concluded that the Company’s disclosure controls and procedures were effective during the period covered by this Quarterly Report on Form 10-Q.
The Company has also established and maintains internal control over financial reporting as a process designed to provide reasonable assurance regarding the reliability of financial reporting and the preparation of condensed consolidated financial statements for external purposes in accordance with accounting principles generally accepted in the United States. In the ordinary course of business, the Company routinely enhances its internal controls and procedures for financial reporting by either upgrading its current systems or implementing new systems. During the fiscal quarter ended September 30, 2011, there was no change in the Company’s internal controls over financial reporting (as defined in Rule 13a-15(f) under the Exchange Act) that has materially affected, or is reasonably likely to materially affect, the Company’s internal control over financial reporting.
35
Table of Contents
From time to time, we may become parties to claims, legal actions and complaints arising in the ordinary course of business. We are not aware of any claims which would have a material adverse effect on our consolidated financial position, results of operations, or cash flows.
See Part I. Item 2. “Management’s Discussion and Analysis of Financial Condition and Results of Operations—Business Environment” in this report for a discussion of the conditions in the financial markets and economic conditions affecting our business.
In addition, for further discussion of our potential risks and uncertainties, see information under the heading “Risk Factors” in our annual report on Form 10-K for the year ended June 30, 2011.
Item 2. Unregistered Sales of Equity Securities and Use of Proceeds.
(c) Purchases of Equity Securities by the Issuer.
Common Stock Repurchase Plan
The following table summarizes on a monthly basis, share repurchases under the Company’s Share Repurchase Plan during the three months ended September 30, 2011:
| Period |
Total Number of Shares Purchased |
Weighted- Average Price Paid Per Share(1) |
Total Number of Shares Purchased as Part of Publicly Announced Plan |
Maximum Number of Shares that May Yet be Purchased Under the Plan(2) |
||||||||||||||
| July 1—31 |
— | $ | — | — | 219,984 | |||||||||||||
| August 1—31 |
— | — | — | 219,984 | ||||||||||||||
| September 1—30 |
55,600 | 14.15 | 55,600 | 164,384 | ||||||||||||||
|
|
|
|
|
|
|
|
|
|||||||||||
| Total |
55,600 | $ | 14.15 | 55,600 | 164,384 | |||||||||||||
|
|
|
|
|
|
|
|
|
|||||||||||
| (1) | The weighted-average price per share is calculated on a trade date basis and includes commissions. |
| (2) | The Company’s Share Repurchase Plan was authorized in June 2008 by the Board of Directors and was subsequently amended in March 2009, December 2009, and October 2011 to increase the number of shares to be repurchased. The Share Repurchase Plan is not subject to an expiration date. |
Employee Tax Withholding
To satisfy statutory employee tax withholding requirements related to the vesting of common shares, employees may elect to have our Company withhold shares and remit the necessary tax withholding on their behalf. We may promptly sell these shares in the open market on behalf of employees or acquire them as treasury shares. Any resulting gain or loss on sale is accounted for as an adjustment to additional paid-in capital. During the three months ended September 30, 2011, a total of 42,331 employee relinquished shares related to employee tax withholding were acquired as treasury shares.
The Company’s Annual Meeting of Stockholders will be held on Thursday, December 1, 2011 at 9:00 A.M. E.S.T. at The Cornell Club, 6 East 44th Street, New York, New York 10017.
36
Table of Contents
| Exhibit Number |
Description | |
| (2) Plan of Acquisition, Reorganization, Arrangement, Liquidation or Succession | ||
| 2.1 | Agreement of Merger and Plan of Reorganization dated as of June 2, 2004, incorporated by reference to Exhibit 2.1 to the Current Report on Form 8-K, filed with the SEC on June 3, 2004. | |
| (3) Articles of Incorporation and Bylaws | ||
| 3.1 | Certificate of Incorporation of the Registrant, as amended, incorporated by reference to Exhibit 3.1 to the Current Report on Form 8-K, filed with the SEC on December 7, 2004. | |
| 3.2 | Amended and Restated By-Laws of Epoch Holding Corporation (as adopted April 2, 2008), incorporated by reference to Exhibit 3.1 to the Current Report on Form 8-K, filed with the SEC on April 2, 2008. | |
| (4) Instruments Defining the Rights of Security Holders | ||
| 4.1* | Amended and Restated 2004 Omnibus Long-Term Incentive Compensation Plan, incorporated by reference to Exhibit 4.1 to the Registration Statement on Form S-8, filed with the SEC on December 29, 2008. | |
| (10) Material Contracts | ||
| 10.1* | Amended and Restated Employment Agreement by and between Epoch Holding Corporation and William W. Priest, dated as of December 20, 2010 and effective as of January 1, 2011, incorporated by reference to Exhibit 10.1 to the Current Report on Form 8-K, filed with the SEC on December 20, 2010. | |
| 10.45 | Office lease between Vornado 640 Fifth Avenue LLC (Landlord) and Epoch Investment Partners, Inc. (Tenant), incorporated by reference to Exhibit 10.45 to the Annual Report on Form 10-K for the fiscal year ended June 30, 2005, filed with the SEC on September 28, 2005. | |
| 10.46 | Form of Restricted Stock Award, incorporated by reference to Exhibit 10.46 to the Annual Report, as amended, on Form 10-K/A for the fiscal year ended June 30, 2006, filed with the SEC on September 26, 2006. | |
| 10.47 | Office sublease between Centerview Partners Holdings LLC (Sublessor) and Epoch Investment Partners, Inc. (Sublessee), incorporated by reference to Exhibit 10.49 to the Quarterly Report on Form 10-Q for the quarter ended September 30, 2009, filed with the SEC on November 6, 2009. | |
| (31) Rule 13a-14(a)/15d-14(a) Certifications | ||
| 31.1† | Certification of Chief Executive Officer pursuant to Section 302 of the Sarbanes-Oxley Act of 2002. | |
| 31.2† | Certification of Principal Financial Officer pursuant to Section 302 of the Sarbanes-Oxley Act of 2002. | |
| (32) Section 1350 Certification | ||
| 32.1† | Certification of Chief Executive Officer and Chief Financial Officer pursuant to 18 U.S.C. Section 1350, as adopted pursuant to Section 906 of the Sarbanes-Oxley Act of 2002. | |
| (101) XBRL Documents | ||
| 101.INS** | XBRL Instance Document. | |
| 101.SCH** | XBRL Taxonomy Extension Schema Document. | |
37
Table of Contents
| Exhibit Number |
Description | |
| 101.CAL** | XBRL Taxonomy Extension Calculation Linkbase Document. | |
| 101.DEF** | XBRL Taxonomy Extension Definition Linkbase Document. | |
| 101.LAB** | XBRL Taxonomy Extension Label Linkbase Document. | |
| 101.PRE** | XBRL Taxonomy Extension Presentation Linkbase Document. | |
| † | Filed herewith. |
| * | Employment contract, compensatory plan or arrangement. |
| ** | XBRL (Extensible Business Reporting Language) information is furnished and not filed for purposes of sections 11 and 12 of the Securities Act of 1933 and Section 18 of the Securities Exchange Act of 1934. |
38
Table of Contents
Pursuant to the requirements of the Securities Exchange Act of 1934, the Registrant has duly caused this report to be signed on its behalf by the undersigned thereunto duly authorized.
| EPOCH HOLDING CORPORATION (Registrant) | ||||||
| Date: November 7, 2011 | By: | /s/ ADAM BORAK | ||||
| Adam Borak Chief Financial Officer (Principal Financial and Accounting Officer) | ||||||
39