Attached files
| file | filename |
|---|---|
| 8-K - FORM 8-K - SUNOCO INC | d249878d8k.htm |
| EX-99.1 - PRESS RELEASE - SUNOCO INC | d249878dex991.htm |
 3Q11 Earnings Conference Call
November 3, 2011
Exhibit 99.2 |
 2
This
slide
presentation
should
be
reviewed
in
conjunction
with
Sunoco’s
Third
Quarter
2011
earnings
conference
call
held
on
November
3,
2011
at
4:30
p.m.
ET.
You
may
listen
to
the
audio
portion
of
the
conference
call
on
the
website
or
an
audio
recording
will
be
available
after
the
call’s
completion
by
calling
1-866-465-1304
and
entering
conference
ID
#8748773.
Statements
in
this
presentation
that
are
not
historical
facts
are
forward-looking
statements
intended
to
be
covered
by
the
safe
harbor
provisions
of
Section
27A
of
the
Securities
Act
of
1933
and
Section
21E
of
the
Securities
Exchange
Act
of
1934.
These
forward-looking
statements
are
based
upon
assumptions
by
Sunoco
concerning
future
conditions,
any
or
all
of
which
ultimately
may
prove
to
be
inaccurate,
and
upon
the
current
knowledge,
beliefs
and
expectations
of
Sunoco
management.
These
forward-looking
statements
are
not
guarantees
of
future
performance.
Forward-looking
statements
are
inherently
uncertain
and
involve
significant
risks
and
uncertainties
that
could
cause
actual
results
to
differ
materially
from
those
described
during
this
presentation.
Such
risks
and
uncertainties
include
economic,
business,
competitive
and/or
regulatory
factors
affecting
Sunoco's
business,
as
well
as
uncertainties
related
to
the
outcomes
of
pending
or
future
litigation.
In
accordance
with
the
safe
harbor
provisions
of
the
Private
Securities
Litigation
Reform
Act
of
1995,
Sunoco
has
included
in
its
Annual
Report
on
Form
10-K
for
the
year
ended
December
31,
2010,
and
in
its
subsequent
Form
10-Q
and
Form
8-K
filings,
cautionary
language
identifying
important
factors
(though
not
necessarily
all
such
factors)
that
could
cause
future
outcomes
to
differ
materially
from
those
set
forth
in
the
forward-looking
statements.
For
more
information
concerning
these
factors,
see
Sunoco's
Securities
and
Exchange
Commission
filings,
available
on
Sunoco's
website
at
www.SunocoInc.com.
Sunoco
expressly
disclaims
any
obligation
to
update
or
alter
its
forward-looking
statements,
whether
as
a
result
of
new
information,
future
events
or
otherwise.
This
presentation
includes
certain
non-GAAP
financial
measures
intended
to
supplement,
not
substitute
for,
comparable
GAAP
measures.
Reconciliations
of
non-GAAP
financial
measures
to
GAAP
financial
measures
are
provided
in
the
Appendix
at
the
end
of
the
presentation.
Investors
are
urged
to
consider
carefully
the
comparable
GAAP
measures
and
the
reconciliations
to
those
measures
provided
in
the
Appendix,
or
on
our
website
at
www.SunocoInc.com.
Safe Harbor Statement |
 3
After-tax income before special items of $65MM* ($0.57/share diluted),
pretax
income of $57MM*
Strong performance from Logistics and Retail
Refining & Supply (R&S) reported a pretax loss of $17MM
Continue to deliver value to shareholders and position the Company for future
success
Completed $500 MM share repurchase program
Completed IPO of SunCoke in July
Pursuing growth in logistics and retail businesses
Completed exit from underperforming chemicals business
Pursuing sale of northeast refineries and plan to exit business by July
2012
Performing comprehensive strategic review
* For reconciliation to Net Income (Loss), see Slide 12. Special
Items in 3Q11 include a net
loss of $1,161MM after-tax.
Summary of 3
rd
Quarter 2011 Performance |
 4
Retail Marketing –
Pretax Earnings of $48MM
Average gasoline margins of 10.5 cpg in 3Q11
Higher volumes driven by growth; same store sales down ~2.9%, consistent with
EIA data
Logistics –
Pretax Earnings of $53MM
Record
quarterly
earnings
for
Sunoco
Logistics
Partners
for
the
2
nd
straight
quarter
driven
by
market
opportunities
in
the
crude
oil
segment,
as
well
as
contribution from recent acquisitions
SXL also had record acquisition growth in 2011 of almost $500 MM
Coke –
Pretax Earnings of $24MM
Improved operational performance/record domestic coke production
Successful Middletown plant start-up
Purchase of GE’s stake in Indiana Harbor
R&S –
Pretax Loss of $17MM
July and August profitable
Strong operational performance with 3Q crude utilization ~90%
September market margins deteriorated, averaging ~$2/B
* Pretax Business Unit Income (Loss) Before Special Items, excluding Income
Attributable to Noncontrolling Interests. For reconciliation to Net Income
(Loss), see Slide 12. Segment Pretax Results* -
3Q11 |
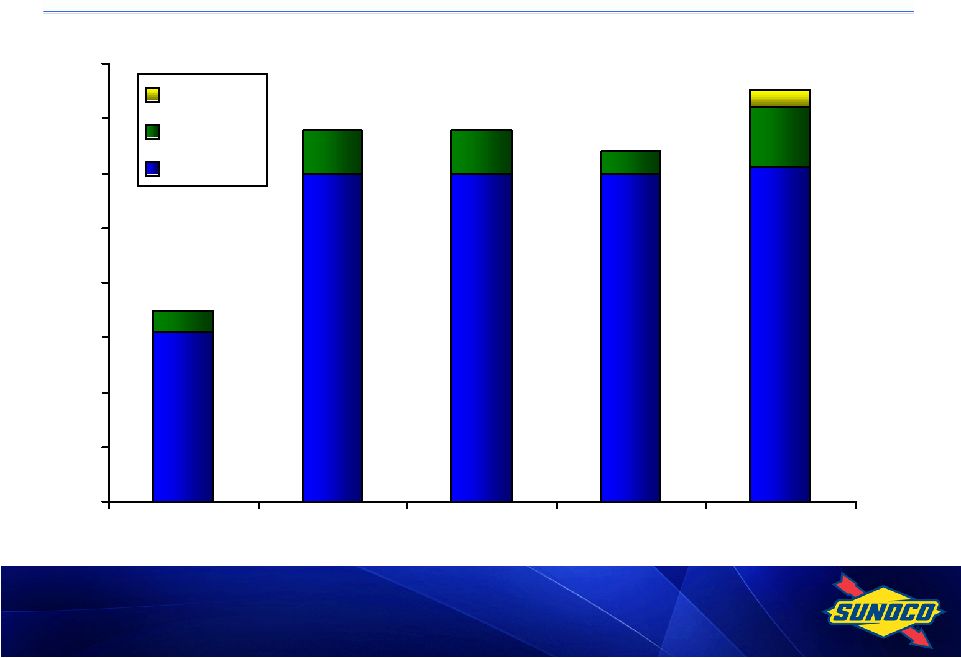
 5
YTD
1Q10
2Q10
3Q10
4Q10
1Q11
2Q11
3Q11
2011
Refining & Supply
(70)
138
(70)
(17)
(138)
(44)
(17)
(199)
Retail Marketing
34
73
68
1
12
69
48
129
Logistics
27
30
40
35
31
54
53
138
Coke
51
56
44
25
9
20
24
53
Discontinued Chemicals Operations
38
7
5
6
(9)
6
1
(2)
Corporate Expenses
(23)
(30)
(28)
(27)
(22)
(18)
(23)
(63)
Net Financing Expenses & Other
(28)
(27)
(28)
(27)
(24)
(16)
(29)
(69)
Pretax Income (Loss) Before Special Items
29
247
31
(4)
(141)
71
57
(13)
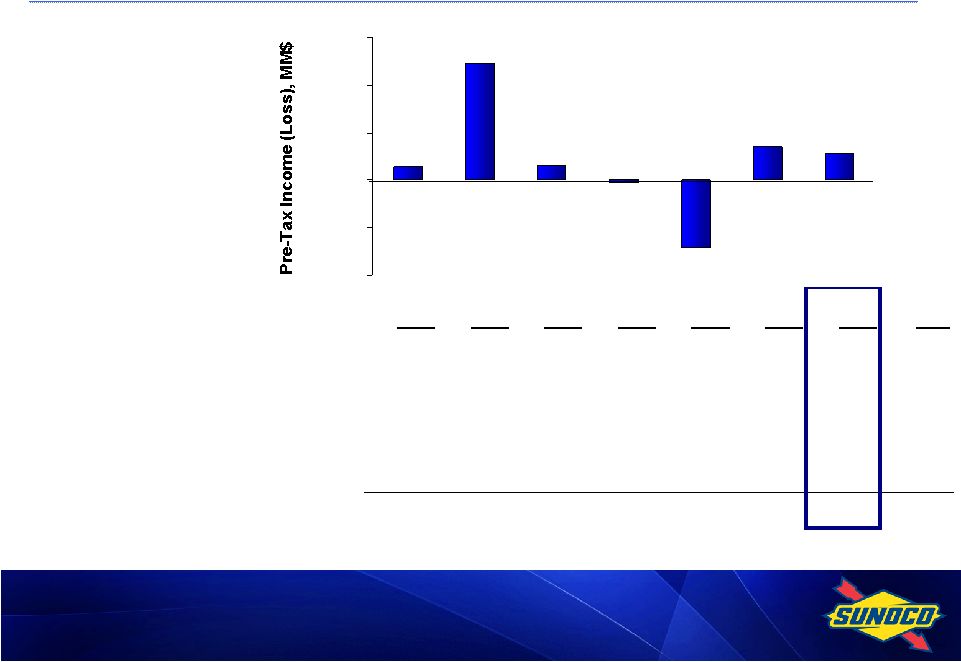
Pretax Income (Loss) Before Special Items*, MM$
57
71
(141)
(4)
31
247
29
($200)
($100)
$0
$100
$200
$300
* For reconciliation to Net Income (Loss), see Slide 12.
|
 6
1Q10
2Q10
3Q10
4Q10
FY10
1Q11
2Q11
3Q11
Refining & Supply
Realized Margin
4.08
7.34
3.88
4.77
5.04
3.14
4.31
4.89
Benchmark*
4.93
6.12
4.22
5.19
5.11
5.19
6.11
5.87
Differential
(0.85)
1.22
(0.34)
(0.42)
(0.07)
(2.05)
(1.80)
(0.98)
Margin Capture Rate
83%
120%
92%
92%
99%
61%
71%
83%
Actual vs. Benchmark:
Crude
(0.52)
0.73
(0.52)
(0.25)
(0.09)
(1.08)
(0.51)
(0.20)
Product
(0.33)
0.49
0.18
(0.17)
0.02
(0.97)
(1.29)
(0.78)
Differential
(0.85)
1.22
(0.34)
(0.42)
(0.07)
(2.05)
(1.80)
(0.98)
* For calculation, see Slide 21. Weighted benchmark in effect in 2010 and through
March 1, 2011. Realized R&S Margin vs. Benchmark, $/B
|
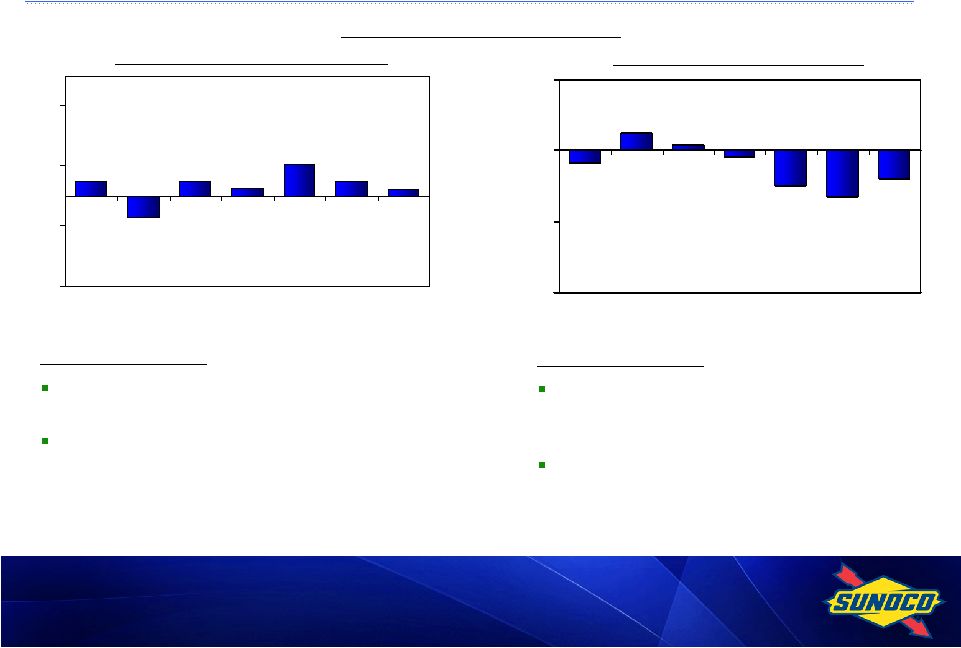 7
0.20
0.51
0.25
1.08
0.52
(0.73)
0.52
-3.00
-1.00
1.00
3.00
1Q10
2Q10
3Q10
4Q10
1Q11
2Q11
3Q11
Crude Cost vs. Benchmark
(0.78)
(1.29)
(0.97)
(0.17)
0.18
0.49
(0.33)
-4.00
-2.00
0.00
2.00
1Q10
2Q10
3Q10
4Q10
1Q11
2Q11
3Q11
Products vs. Benchmark
Total Refining & Supply
3Q11 Comments:
Quality differentials benefited from higher
volume of discounted crude purchases
Overall purchase volumes dropped in
September due to rate cuts, minimizing benefit
from falling prices
3Q11 Comments:
Vs 3Q 10, produced fuel net of yield gain
worse by over $1/B due to ~$35/B higher
absolute prices and lower yield volume gains
Propane and other non-crack margins lower
by ~.40/B vs
3Q 10 due to higher crude
prices
Realized R&S Margin vs. Benchmark*, $/B
* For calculation, see Slide 21. Weighted benchmark in effect in 2010 and through
March 1, 2011. |
 8
12/31/09
12/31/10
9/30/11
Sunoco (ex-SXL/SXC)*
32%
-6%
-43%
Sunoco (Consolidated)*
41%
20%
48%
Sunoco Net Debt/(Cash)
1,223
(182)
(389)
SXL Net Debt**
866
1,227
1,790
SXC Net Debt
N/A
N/A
587
Consolidated Net Debt, MM$
2,089
945
1,888
Total Cash, MM$***
375
1,483
1,537
* Sunoco Revolver Covenant basis. For calculation, see Slide 17.
** Includes intercompany loan due to Sunoco from SXL at 12/31/2010 and 9/30/2011
which is eliminated in consolidation.
*** Excludes cash on balance sheet of Sunoco Logistics Partners for all periods and
SunCoke Energy as of 9/30/11. Net Debt-to-Capital Ratio, %
41%
20%
48%
32%
-6%
-43%
Sunoco (Consolidated)*
Sunoco (ex-SXL/SXC)* |
 9
Cash Flow Split, MM$
SUN
SUN
SXL
SXC
(ex SXL/SXC)
Sunoco
SXL
SXC
(ex SXL/SXC)
Sunoco
Cash from ops excluding working capital
114
46
160
320
300
124
63
487
Working capital including interco activity
(40)
(3)
(358)
(401)
(183)
(60)
(682)
(925)
Cash flow from operations
74
43
(198)
(81)
117
64
(619)
(438)
Capital expenditures
(350)
(56)
(70)
(476)
(518)
(222)
(194)
(934)
Free cash flow
(276)
(13)
(268)
(557)
(401)
(158)
(813)
(1,372)
Divestments and other
-
-
113
113
-
-
955
955
Dividends to Sunoco shareholders
-
-
(19)
(19)
-
-
(55)
(55)
Distributions & other
(27)
(34)
2
(59)
(83)
(35)
5
(113)
Repurchase of common stock
-
-
(500)
(500)
-
-
(500)
(500)
SunCoke IPO /debt exchange
-
-
192
192
-
-
192
192
SXL distributions to Sunoco
(25)
-
25
-
(73)
-
73
-
Net cash flow before net debt activity
(328)
(47)
(455)
(830)
(557)
(193)
(143)
(893)
Intercompany debt activity*
-
(551)
551
-
-
(413)
413
-
Net debt activity, 3rd party
330
680
-
1,010
563
677
(176)
1,064
Net increase in cash & cash equivalents
2
82
96
180
6
71
94
171
YTD11
3Q11
*
Includes $575 MM paid to Sunoco from SunCoke with proceeds from debt issuance as repayment of
intercompany debt payable; the remaining balance represents a capital contribution from
Sunoco to SunCoke. |
 10
Remain focused on delivering value to shareholders
Strong results in retail and logistics
Completed $500MM share repurchase program
SunCoke IPO
Comprehensive strategic review
Positioning for future success
Growth through SXL ($500 million in acquisitions in 2011) and Retail (Central
PA, Ohio turnpike)
Divestment of non-core assets (e.g., Frankford, Haverhill)
Exit refining
Balance sheet: Cash balance provides strategic flexibility
Key Takeaways/Path Forward |
 Appendix |
 12
Earnings Profile, MM$
YTD
1Q10
2Q10
3Q10
4Q10
FY10
1Q11
2Q11
3Q11
2011
Refining & Supply
(70)
138
(70)
(17)
(19)
(138)
(44)
(17)
(199)
Retail Marketing
34
73
68
1
176
12
69
48
129
Logistics
27
30
40
35
132
31
54
53
138
Coke
51
56
44
25
176
9
20
24
53
Discontinued Chemicals Operations
38
7
5
6
56
(9)
6
1
(2)
Corporate and Other:
Corporate Expenses
(23)
(30)
(28)
(27)
(108)
(22)
(18)
(23)
(63)
Net Financing Expenses & Other
(28)
(27)
(28)
(27)
(110)
(24)
(16)
(29)
(69)
Pretax Income (Loss) attributable to Sunoco, Inc.
shareholders before special items
29
247
31
(4)
303
(141)
71
57
(13)
Income Tax Expense (Benefit) attributable to
Sunoco, Inc. shareholders
12
89
4
(17)
88
(19)
22
(8)
(5)
Income (Loss) attributable to Sunoco, Inc.
shareholders before special items
17
158
27
13
215
(122)
49
65
(8)
Special Items:
Continuing Operations*
(45)
(22)
62
123
118
51
(7)
(1,966)
(1,922)
Discontinued Operations**
(169)
-
-
-
(169)
-
(287)
32
(255)
Pretax Income (Loss) from special items
(214)
(22)
62
123
(51)
51
(294)
(1,934)
(2,177)
Income Tax Expense (Benefit)
(134)
(9)
24
49
(70)
30
(120)
(773)
(863)
Income (Loss) from special items
(80)
(13)
38
74
19
21
(174)
(1,161)
(1,314)
Net Income (Loss) attributable to
Sunoco, Inc. shareholders
(63)
145
65
87
234
(101)
(125)
(1,096)
(1,322)
* In 3Q 2011, recorded a $1,959MM noncash provision to write down assets at the
Philadelphia and Marcus Hook refineries to their
estimated
fair
values
in
connection
with
decision
to
exit
refining
business.
** In 1Q 2010 and 2Q 2011, recognized losses in connection with the divestment of
the chemicals business; In 3Q 2011, recognized a $14MM
gain on the divestment of the Frankford chemical facility and an $18 million gain attributable to a
settlement
connected
to
the
Tulsa
refining
operation
which
was
sold
in
2009. |
 13
Earnings Summary and EPS
YTD
MM$
1Q10
2Q10
3Q10
4Q10
FY10
1Q11
2Q11
3Q11
2011
Income (Loss) attributable to Sunoco, Inc.
shareholders before special items
17
158
27
13
215
(122)
49
65
(8)
Special Items:
Continuing Operations*
(45)
(22)
62
123
118
51
(7)
(1,966)
(1,922)
Discontinued Operations**
(169)
-
-
-
(169)
-
(287)
32
(255)
Pretax Income (Loss) from special items
(214)
(22)
62
123
(51)
51
(294)
(1,934)
(2,177)
Income Tax Expense (Benefit)
(134)
(9)
24
49
(70)
30
(120)
(773)
(863)
Income (Loss) from special items
(80)
(13)
38
74
19
21
(174)
(1,161)
(1,314)
Net Income (Loss) attributable to
Sunoco, Inc. shareholders
(63)
145
65
87
234
(101)
(125)
(1,096)
(1,322)
$/Share (diluted)
Earnings (Loss) per share of common stock (diluted):
Income (Loss) attributable to Sunoco, Inc.
shareholders before special items
0.14
1.31
0.22
0.11
1.79
(1.01)
0.40
0.57
(0.07)
Income (Loss) from special items
(0.67)
(0.11)
0.32
0.61
0.16
0.17
(1.43)
(10.19)
(11.08)
Net Income (Loss) attributable to
Sunoco, Inc. shareholders
(0.53)
1.20
0.54
0.72
1.95
(0.84)
(1.03)
(9.62)
(11.15)
* In 3Q 2011, recorded a $1,959MM noncash provision to write down assets at the
Philadelphia and Marcus Hook refineries to their estimated fair values in
connection with decision to exit refining business.
** In 1Q 2010 and 2Q 2011, recognized losses in connection with the divestment of
the chemicals business; In 3Q 2011, recognized
a
$14MM
gain
on
the
divestment
of
the
Frankford
chemical
facility
and
an
$18
million
gain
attributable
to
a
settlement
connected
to
the
Tulsa
refining
operation
which
was
sold
in
2009. |
 14
YTD
1Q10
2Q10
3Q10
4Q10
FY10
1Q11
2Q11
3Q11
2011
Total Refining & Supply
Crude Throughputs, MB/D
533
618
632
572
589
460
425
453
446
% Capacity
79
92
94
85
87
74
84
90
82
Net Prod. Available for Sale, MB/D
591
664
682
634
643
512
461
487
487
Net Prod. Available for Sale, MMB
53
61
62
58
234
46
42
45
133
Key Volume Indicators –
Refining & Supply |
 15
YTD
1Q10
2Q10
3Q10
4Q10
FY10
1Q11
2Q11
3Q11
2011
Realized Margin Indicators
Refining & Supply, $/B
4.08
7.34
3.88
4.77
5.04
3.14
4.31
4.89
4.10
Retail Marketing, cpg
Gasoline
8.9
11.5
10.5
6.6
9.4
6.9
12.4
10.5
10.0
Distillate
8.0
9.0
7.8
5.6
7.6
7.1
12.5
9.6
9.8
Market Indicators
Dated Brent Crude Oil, $/B
76.24
78.30
76.86
86.53
79.48
104.90
117.63
113.49
112.01
Natural Gas, $/DT
5.04
4.34
4.23
3.97
4.40
4.20
4.37
4.06
4.21
Key Indicators |
 16
YTD
1Q10
2Q10
3Q10
4Q10
FY10
1Q11
2Q11
3Q11
2011
Retail Marketing
Gasoline Sales, MM Gal
1,026
1,130
1,171
1,171
4,498
1,086
1,161
1,196
3,443
Middle Distillate Sales, MM Gal
91
114
117
110
432
97
106
118
321
Total Sales, MM Gal
1,117
1,244
1,288
1,281
4,930
1,183
1,267
1,314
3,764
Gasoline and Diesel Throughput
147
159
156
161
156
150
162
168
160
(Company-Owned or Leased Outlets)
(M Gal/Site/Month)
Merchandise Sales (M$/Store/Month)
87
101
103
92
96
85
97
105
96
Coke
Production, M Tons:
United States
842
883
953
916
3,594
861
922
964
2,747
Brazil
413
422
431
370
1,636
364
412
373
1,149
Key Volume Indicators –
Retail and Coke |
 17
Financial Ratios, MM$ except ratios
* Represents intercompany loan due to Sunoco from SXL which is eliminated in
consolidation. **
Represents
Partners’
Capital
for
SXL
and
Shareholders’
Equity
for
Sunoco.
*** The Net Debt / Capital ratio is used by Sunoco management in its internal
financial analysis and by investors and creditors
in
the
assessment
of
Sunoco’s
financial
position;
calculation
excludes
noncontrolling
interests
except
for
SXL as prescribed by the revolver covenant.
Proforma
Proforma
Proforma
SUN
SUN
SUN
(ex SXL
SXL
(ex SXL)
Sunoco
SXL
(ex SXL)
Sunoco
SXC
SXL
& SXC)
Sunoco
Debt
868
1,596
2,464
1,129
1,300
2,429
698
1,698
1,128
3,524
Intercompany Debt*
-
-
-
100
-
-
-
100
-
-
Plus: Debt Guarantees
-
2
2
-
1
1
-
-
20
20
Less: Cash
(2)
(375)
(377)
(2)
(1,483)
(1,485)
(111)
(8)
(1,537)
(1,656)
Net Debt
866
1,223
2,089
1,227
(182)
945
587
1,790
(389)
1,888
Equity**
862
2,557
2,557
965
3,046
3,046
569
1,081
1,302
1,302
SXL Noncontrolling Interest
-
-
488
77
-
692
-
101
-
754
SunCoke Noncontrolling Interest
-
-
74
-
-
61
35
-
-
149
Capital
1,728
3,780
5,208
2,269
2,864
4,744
1,191
2,972
913
4,093
Net Debt / Capital (Sunoco
Revolver Covenant
N/A
32%
41%
N/A
-6%
20%
N/A
N/A
-43%
48%
Basis)***
Debt / Capital
50%
38%
44%
54%
30%
39%
54%
60%
46%
62%
(GAAP Basis)
9/30/2011
12/31/2009
12/31/2010 |
 0.0
0.5
1.0
1.5
2.0
2.5
3.0
3.5
4.0
12/31/2009
12/31/2010
3/31/2011
6/30/2011
9/30/2011
SunCoke
SXL
Sunoco
18
Liquidity*, B$
*
Includes cash and cash equivalents of $0.4B, $1.5B, $1.5B, $1.5B, and $1.7B at
12/31/09, 12/31/10, 3/31/11, 6/30/11, and 9/30/11 respectively.
1.7
3.4
3.7
3.2
3.4 |
 19
YTD
1Q10
2Q10
3Q10
4Q10
FY10
1Q11
2Q11
3Q11
2011
Total Refining & Supply
Net Production, MB/D
590.5
664.2
681.5
633.9
642.8
512.4
461.1
487.0
486.8
Gasoline
52%
52%
52%
54%
52%
52%
51%
51%
51%
Middle Distillates
34%
37%
37%
35%
36%
36%
36%
37%
37%
Residual Fuel
6%
6%
5%
4%
5%
5%
7%
7%
6%
Petrochemicals
4%
3%
4%
4%
4%
3%
3%
3%
3%
Other
9%
7%
7%
8%
8%
9%
8%
7%
8%
Less Refinery Fuel
-5%
-5%
-5%
-5%
-5%
-5%
-5%
-5%
-5%
Refining & Supply –
Products Manufactured |
 20
YTD
1Q10
2Q10
3Q10
4Q10
FY10
1Q11
2Q11
3Q11
2011
Total Refining & Supply
Gasoline Production, MB/D
306.3
343.1
357.9
339.9
337.0
265.4
234.6
249.0
249.6
RFG / RBOB
47%
48%
43%
45%
46%
49%
63%
65%
59%
Conventional / CBOB
53%
52%
57%
55%
54%
51%
37%
35%
41%
Distillate Production, MB/D
202.4
244.5
250.1
225.1
230.6
183.6
165.5
181.9
177.0
On-Road Diesel Fuel
53%
66%
62%
52%
59%
52%
58%
64%
58%
Heating Oil / Off-Road Diesel
28%
15%
18%
25%
21%
26%
27%
19%
24%
Jet Fuel
17%
19%
19%
21%
19%
20%
13%
14%
16%
Kerosene / Other
2%
0%
1%
2%
1%
2%
2%
3%
2%
Refining & Supply –
Gasoline and Distillate Production |
 21
Toledo 4-3-1 Benchmark
4 WTI Crude: NYMEX Futures Close + $2.00 for transportation
3 Unleaded Gasoline: Chicago Pipeline Platt’s Low
1 Distillate: 50% ULSD Chicago Pipeline Platt’s Low
50% Jet Gulf Coast Pipe Platt’s Low
Northeast 6-3-2-1 Value-Added Benchmark**
6 Dated Brent Crude: Platt’s Mid + $2.75 for transportation
3 Gasoline: 50% Unleaded RBOB NY Harbor Barge Platt's Low
50% 83 CBOB NY Harbor Barge Platt's Low
2 Distillate: 55% ULSD NY Harbor Barge Platt's Low
20% Jet/Kero NY Harbor Barge Platt's Low
25% No.2 Fuel Oil NY Harbor Barge Platt's Low
1 Resid: 60% No. 6 0.3% Sulfur High Pour Resid: NY Harbor Barge Platt’s
Low 40% No. 6 1.0% Sulfur High Pour Resid: NY Harbor Barge Platt’s Low
YTD
1Q10
2Q10
3Q10
4Q10
FY10
Jan 11
Feb 11
Mar 11
1Q11
2Q11
3Q11
2011
Northeast 6-3-2-1
Value-Added Benchmark
5.17
5.42
3.39
4.90
4.72
3.93
2.79
5.11
3.94
6.11
5.87
5.31
Toledo 4-3-1
Benchmark
3.99
8.89
7.50
6.33
6.68
9.89
15.52
n/a
12.70
n/a
n/a
12.70
YTD
1Q10
2Q10
3Q10
4Q10
FY10
Jan 11
Feb 11
Mar 11
1Q11
2Q11
3Q11
2011
Northeast 6-3-2-1
at 80% weight*
4.13
4.34
2.72
3.92
3.78
3.14
2.24
5.11
3.50
6.11
5.87
5.16
Toledo 4-3-1
at 20% weight*
0.80
1.78
1.50
1.27
1.33
1.98
3.10
n/a
1.69
n/a
n/a
0.56
R&S Weighted Benchmark*
4.93
6.12
4.22
5.19
5.11
5.12
5.34
5.11
5.19
6.11
5.87
5.72
Sunoco R&S Benchmark Margin, $/B
*
Beginning
in
March
2011,
the
R&S
benchmark
is
no
longer
weighted
with
20%
of
Toledo
4-3-1
margin
due
to
the
sale of the Toledo refinery on 3/1/2011.
Prior to Toledo sale: 80% of NE 6-3-2-1 Value Added Margin and 20%
of Toledo 4-3-1 margin.
Post Toledo sale: 100% of NE 6-3-2-1 Value Added Margin.
**
Adjusted
in
2Q11
to
reflect
market
conditions
more
closely
associated
with
NE
refining
system.
2010
amounts
have been restated for comparative purposes. |
 22
Media releases and SEC filings are available
on our website at www.SunocoInc.com
Contact for more information:
Clare McGrory
(215) 977-6764
For More Information |