Attached files
| file | filename |
|---|---|
| 8-K - FORM 8-K - KEYCORP /NEW/ | d250032d8k.htm |
| Key
Corporate Bank Strong, Focused and Building Momentum
Christopher M. Gorman
President
Key Corporate Bank
BancAnalysts Association of Boston
Exhibit 99.1 |
 2
PRIVATE SECURITIES LITIGATION REFORM ACT OF
1995 FORWARD-LOOKING STATEMENT DISCLOSURE
This presentation contains forward-looking statements within the meaning of the
Private Securities Litigation Reform Act of 1995, including statements about
Key’s financial condition, results of operations, earnings outlook,
asset quality trends and profitability. Forward-looking statements are not
historical facts but instead represent only management’s current expectations
and forecasts regarding future events, many of which, by their nature, are
inherently uncertain and outside of Key’s control. Key’s
actual results and financial condition may differ, possibly materially, from the anticipated results
and financial condition indicated in these forward-looking statements.
Factors that could cause Key’s actual results to differ materially from
those described in the forward-looking statements may be found in
KeyCorp’s Annual Report on Form 10-K for the year ended December 31, 2010 and any Form 10-Q
filings for the subsequent quarterly periods ended during 2011, which have been
filed with the Securities and Exchange Commission and are available on
Key’s website (www.key.com/ir) and on the Securities and Exchange
Commission’s website (www.sec.gov). Forward-looking statements are
not guarantees of future performance and should not be relied upon as representing
management’s views as of any subsequent date. Key does not
undertake any obligation to update the forward- looking statements to
reflect the impact of circumstances or events that may arise after the date of the
forward-looking statements. |
 3
•
The
14
largest
U.S.
bank-based
financial
services company
•
Assets of approximately $89 billion
•
Market capitalization of $6 billion
•
15,490 employees
•
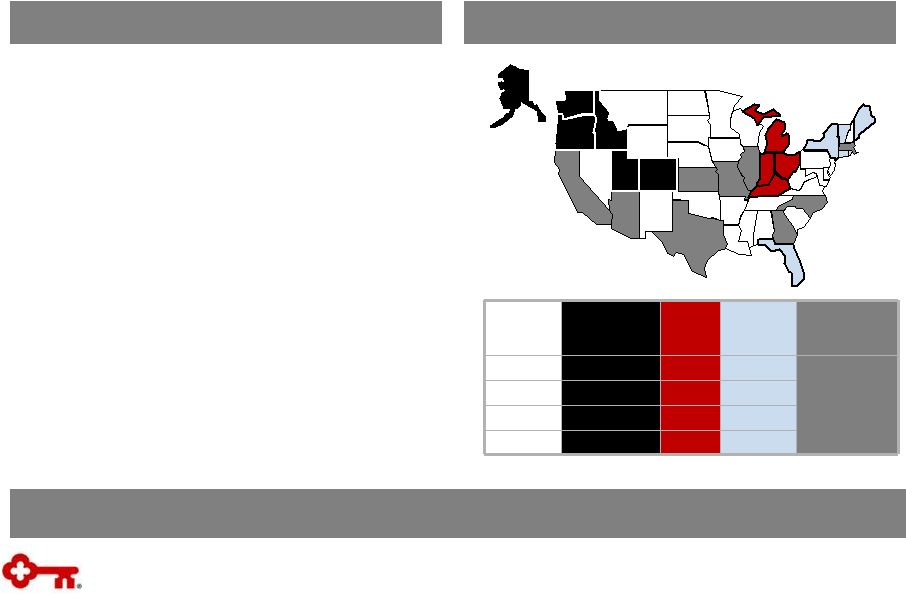
Unique and diverse geography
–
Building presence in higher-growth
markets in Rocky Mountain and Northwest
regions
–
Strong market share in Great Lakes and
Northeast regions
–
Targeting specific industries in selected
states outside branch footprint
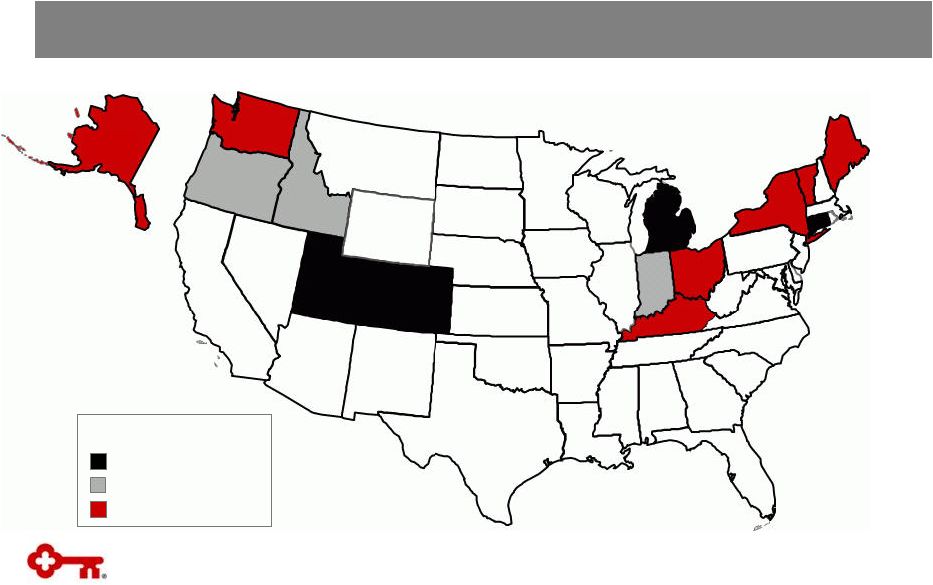
Diverse, Advantaged Geography
Key Facts
Note: All figures as of September 30, 2011
Provides combination of profitability and opportunities for growth
Key –
An Overview
Rocky
Mountain
& Northwest
Great
Lakes
Northeast
Corporate
Bank
Branches
403
354
306
Includes
offices in
these states
and all
Community
Bank regions
ATMs
582
559
443
Loans
$10.1B
$6.7B
$5.3B
Deposits
$15.8B
$15.3B
$14.1B
th |
 4
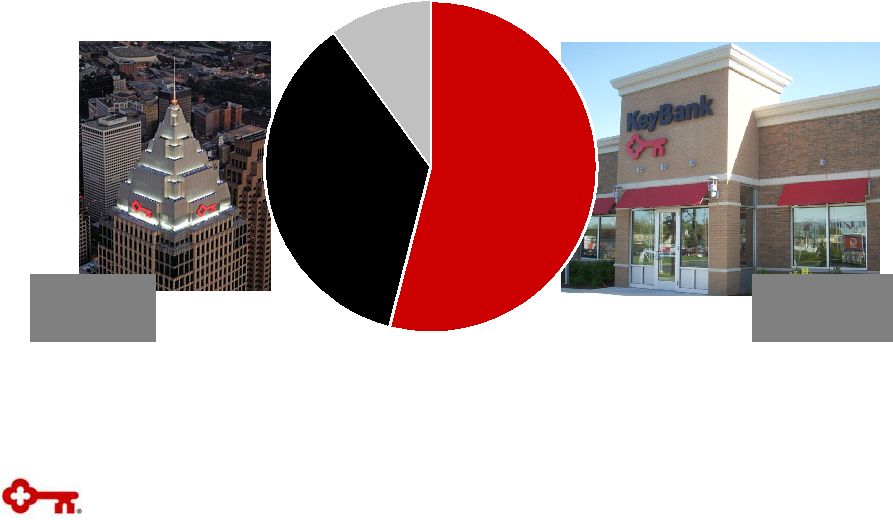
Community
Bank
Corporate
Bank
Diverse and Balanced Business Mix
2011 YTD Revenue
Note:
2011
YTD
Revenue
from
continuing
operations;
“Other”
consists
of
corporate
treasury,
principal
investing
and
exit
portfolios
Corporate
Bank
36%
Community
Bank
54%
Other
10% |
 5
•
Presentation provides detail about Key Corporate
Bank, which is comprised of the following
business units:
–
Real Estate Capital & Corporate Banking
Services (“REC”)
–
Institutional & Capital Markets (“ICM”)
–
Equipment Finance (“KEF”)
•
Information shown in KeyCorp’s SEC filings is
presented on a segment basis for:
–
Key Community Bank
–
Key Corporate Bank
•
Presentation illustrates the levers that drive
growth for Key Corporate Bank with details
provided on its business units
Key Corporate Bank Segment
As of 9/30/11
Corporate Bank LTM Revenue
Presentation Focus
Real Estate Capital
& Corporate
Banking Services
40%
Institutional &
Capital Markets
44%
Equipment
Finance
16% |
 6
•
National franchise focused on
REITs, long-term real estate
owners and healthcare clients
•
Highly rated, scalable third-party
commercial loan servicer
•
Provides derivatives, foreign
exchange and cash management
solutions to clients across Key
•
Leading middle-market corporate
and investment bank, focused on
serving consumer, energy,
healthcare, industrial, public
sector and real estate clients
•
Manages investment portfolios for
a national client base through
Victory Capital Management
•
6th largest bank-owned
equipment finance company (out
of 46)
•
Bank Channel supports franchise
relationships
•
Vendor Channel supports
healthcare, software and
technology manufacturers
Loans & Leases
(2)
PPNR
Fee Income
(1)
(%)
Revenue
Real Estate Capital &
Corporate Banking
Services
Institutional &
Capital Markets
Key Equipment Finance
LTM 3Q11
$640mm
35%
$374mm
$7.1B
LTM 3Q11
$693mm
71%
$263mm
$5.6B
LTM 3Q11
$260mm
NM
$66mm
$4.6B
(1)
Real Estate Capital fee income % adjusted downward 300bps to exclude $18mm in
Private Equity mark-to-market recoveries; Key Equipment Finance fee
income % excluded as it is primarily an asset generation business
(2)
Loans & Leases are as of September 30, 2011
Key Corporate Bank Overview
Employees
904
779
518
Net Income
$418mm
$189mm
$92mm |
 7
Product Breadth with an Industry Focus
Capital Solutions
Capital Solutions
Financial Advisory
Syndicated Finance
Equipment Finance
Foreign Exchange
Treasury Management
Equity Capital Markets
Banking Services
Banking Services
Asset Management
Commercial Loan Servicing
Public Finance
Equity Research
Debt Capital Markets
Derivatives
Commercial Mortgage
Banking
Private Capital
Vendor Leasing
Equity Sales & Trading
Fixed Income Sales & Trading
Client Sectors
Client Sectors
Industrials
Consumer
Energy
Healthcare
Public Sector
Real Estate
Asset-based Lending |
   8
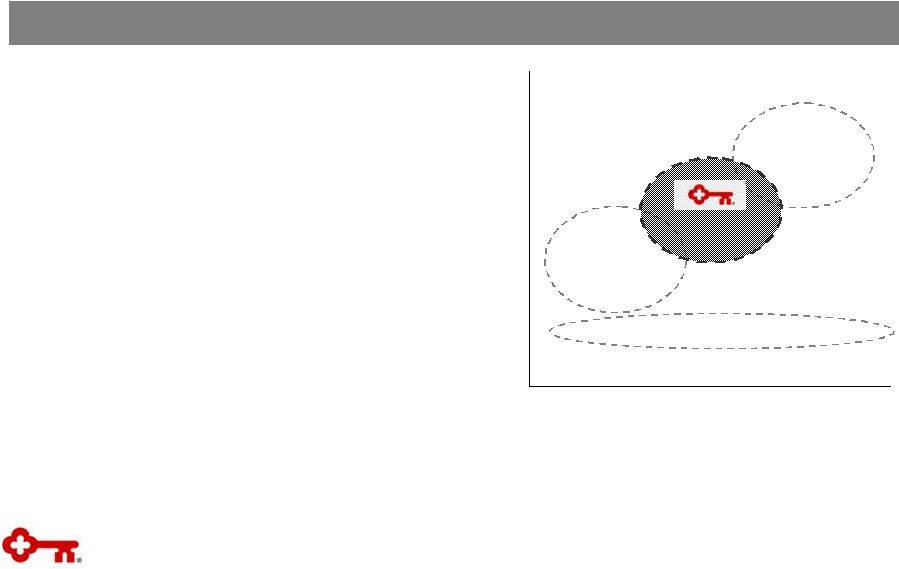
Competitive Advantage
•
Delivering more value to business clients by
combining the local knowledge and service of
a Community Bank with the specialized
expertise and industry knowledge of a
Corporate Bank
•
Distinctive knowledge and capabilities in the
middle market and targeted industries
•
Unique go-to-market alignment of Community
and Corporate Bank
•
Broadest range of products and expertise
delivered with local authority
Primary Focus Client Size (revenue)
<$10 million
$1 billion
Low
High
Breadth of
Industry &
Product
Capabilities
>$10 billion
$200 million
Bulge Bracket/
Universal Banks
Regional and
Community
Banks
Boutiques
KeyCorp
Corporate and Community Bank Business Continuum |
 9
Activity
•
Tight coordination between Real Estate
relationship managers and Capital Markets
execution bankers
Results
•
$106mm in LTM 3Q11 real estate Investment
Banking
Income
and
Debt
Placement
Fees
(1)
•
#1 among domestic regional banks in equity
capital markets fee revenue since 1Q10
Aligned to Serve Our Clients
Key’s integrated model is aligned to serve client needs
•
KEF product specialists are embedded in all
districts to deepen relationships with
colleagues and clients for tailored solutions
•
$497mm in Community Bank lease volume
LTM 3Q11, up 40% YoY
•
Commercial Banking-Investment Banking
initiative leverages local relationships with
industry/product
expertise
–
a
differentiator
•
Industry and capital markets specialists
complete 850 client calls with commercial
bankers
•
Regular, two-way referral activity between Key
Corporate Bank and Key Community Bank
•
Treasury Management, foreign exchange
and derivatives teams provide solutions to
clients across Key’s franchise
•
Treasury Management services provided to
Community Bank clients with more than $8B
in deposits
•
Provide foreign exchange and derivatives
solutions to nearly 3,000 Community Bank
clients
(1)
Includes debt and equity capital markets underwriting, loan syndication, M&A
advisory, and commercial mortgage banking private placement fees |
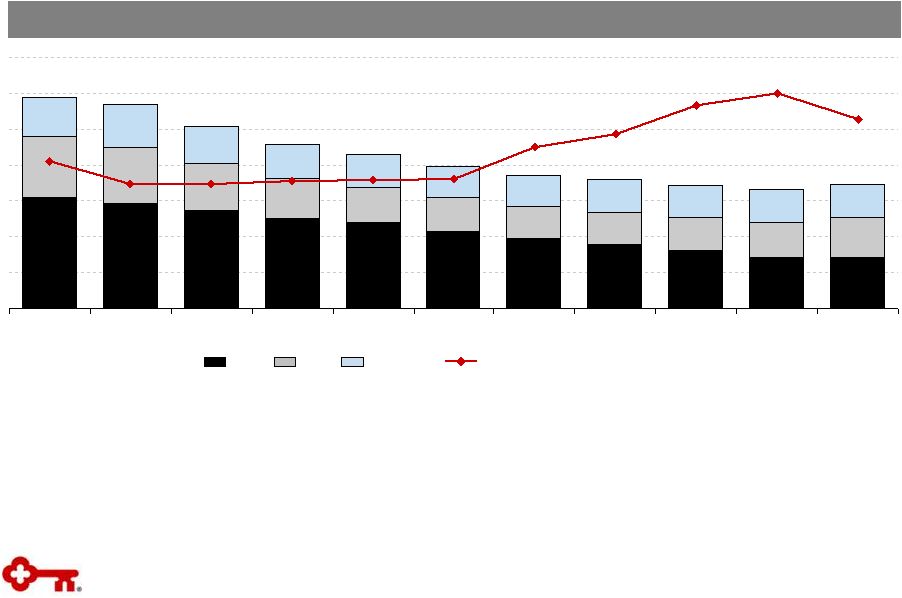 10
15.4
14.6
13.7
12.5
11.9
10.7
9.7
8.9
8.0
7.1
7.1
8.7
6.6
5.7
5.1
4.7
4.4
4.4
4.6
4.9
5.6
5.4
5.8
5.3
4.7
4.6
4.7
4.6
4.7
4.6
7.9
4.5
4.5
$227
$258
$243
$208
$193
$149
$149
$177
$153
$154
$155
1Q09
2Q09
3Q09
4Q09
1Q10
2Q10
3Q10
4Q10
1Q11
2Q11
3Q11
Loan Balances ($B)
REC
KEF
ICM
LTM Investment Banking Income and Debt Placement Fees ($mm)
Past the Inflection Point
•
Period-end loan balances increase for the first time since October 2008
–
Loan balances in Institutional & Capital Markets up $1.1B, or 25%, since trough
in 4Q10 with eight consecutive months of increase –
Period-end REC loans at 3Q11 show first QoQ increase since December 2008
•
Originated or renewed $15.2B of loan and lease commitments LTM 3Q11, up 49%
YoY –
More than 99% are to clients where we have or are actively developing franchise
relationships Ending
Loan
Balances
($B)
&
LTM
Investment
Banking
Income
and
Debt
Placement
Fees
($mm)
$29.4
$28.4
$25.5
$22.9
$21.5
$19.9
$18.7
$18.0
$17.2
$16.6
$17.3
Note: REC denotes Real Estate Capital & Corporate Banking Services; ICM
denotes Institutional & Capital Markets; KEF denotes Equipment Finance
The
inflection
point
analysis
provided
above
utilizes
period-end
loan
balances
as
opposed
to
average
quarterly
loan
balances,
which
we
report
in
our
Form 10-Q and Form 10-K filings with the
Securities and Exchange Commission Investment Banking Income and Debt
Placement Fees is shown on a rolling trailing twelve month basis and includes debt and equity capital markets
underwriting, loan syndication, M&A advisory, and commercial mortgage banking
private placement fees |
 11
Institutional
and Capital
Markets
•
Significant investment in commercial
mortgage banking professionals
•
Real estate private equity specialists
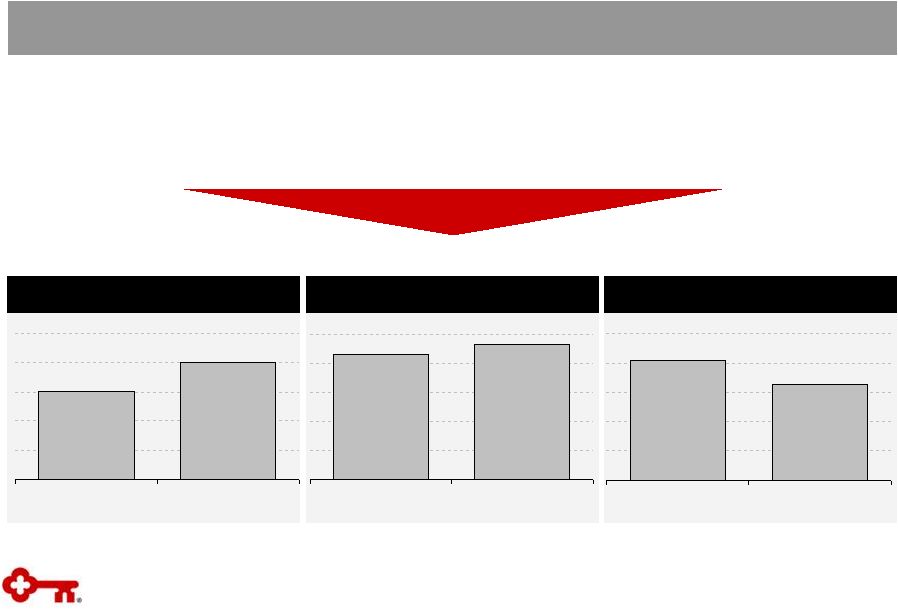
Investing in Relationships and Capabilities
Real Estate
Capital and
Corporate
Banking
Services
Equipment
Finance
•
New heads of U.S. Vendor, Federal
Finance and Healthcare Finance
•
Deepened capabilities in healthcare
and technology
•
Industry coverage bankers in
consumer, energy, industrial and real
estate
•
Product specialists in debt capital
markets, equity research, loan
syndications, M&A and public finance
•
$700mm increase in annual
commercial mortgage volume
–
Placement fees up 40%
–
Strong pipeline
•
Three new strategic vendor
programs YTD
•
YoY healthcare volume up 22% LTM
3Q11
•
$12mm of closed investment banking
fees with engaged backlog of $20mm
•
$430mm of credit commitments with
line utilization of 54%
•
45 new companies under research
Areas of Strategic Hire
Results from Strategic Hires
Key Corporate Bank has hired more than 100 senior professionals since 1Q10
|
 12
Fee Revenue
Assets
Converting New Client Relationships
New Clients Since January 2011
Financial Impact of New Clients
•
Tracking new client generation across the
franchise
•
Semi-annual prospect review sessions with
sales team leaders
•
Capital Markets pitch activity up 60% YoY
Note:
REC denotes Real Estate Capital & Corporate Banking Services; ICM denotes
Institutional & Capital Markets New ICM and REC client counts exclude
institutional investors, Victory Capital Management, public sector, Treasury Management and foreign exchange clients
KEF is excluded from the above analysis
•
New clients have significant financial impact
–
Average fee revenue from new clients is nearly
$0.3mm per client
–
New clients have superior line utilization vs.
existing clients, on average
•
Active effort to expand new client
relationships through product cross-sell
$45mm
$1.5B
65
89
REC
ICM |
 13
Growing Capital Markets Presence
Client Transactions & Capital Raised ($B)
Investment Banking Income and Debt
Placement Fees ($mm)
•
Our capital markets businesses raised $135B
for clients through LTM 3Q11, up $33B YoY
–
Growth driven by loan syndications
•
Transaction volume up 29%
•
LTM 3Q11, Key led 305 transactions (75%),
vs. 191 transactions (60%) in LTM 3Q10
Note:
Analysis excludes transactions where KeyCorp was the issuer as well as
TARP-related issuances by other Bank Holding Companies Investment
Banking Income and Debt Placement Fees includes debt and equity capital markets underwriting, loan syndication, M&A advisory, and
commercial mortgage banking private placement fees
Lead transaction includes Bookrun and Lead-Managed equity and debt capital
markets transactions, Agented syndicated finance transactions and originated
commercial mortgage banking transactions
•
Investment Banking Income and Debt
Placement Fees increased $34mm, or 17%,
YoY for LTM 3Q11
–
Strong fee income growth in commercial
mortgage banking private placements and loan
syndications
–
Solid commercial mortgage banking pipeline
$193
$227
LTM 3Q10
LTM 3Q11
# of Transactions
Capital Raised ($B)
316
409
$135
$102
LTM 3Q10
LTM 3Q11 |
 14
Targeted Collaboration for Growth
Community and Corporate Bank
Less than 10%
Between 10% -
20%
Greater than 20%
KEY client penetration
Our footprint contains more than 7,000 targets in our focus industry segments
with
revenue
between
$25
million
and
$1.5
billion
--
18%
are
clients
Source: Dun & Bradstreet, Capital IQ, Thomson Reuters
1,725
550
900
1,350
225
100
550
325
175
500
775
125
n = # of target
companies in
state
25
76 |
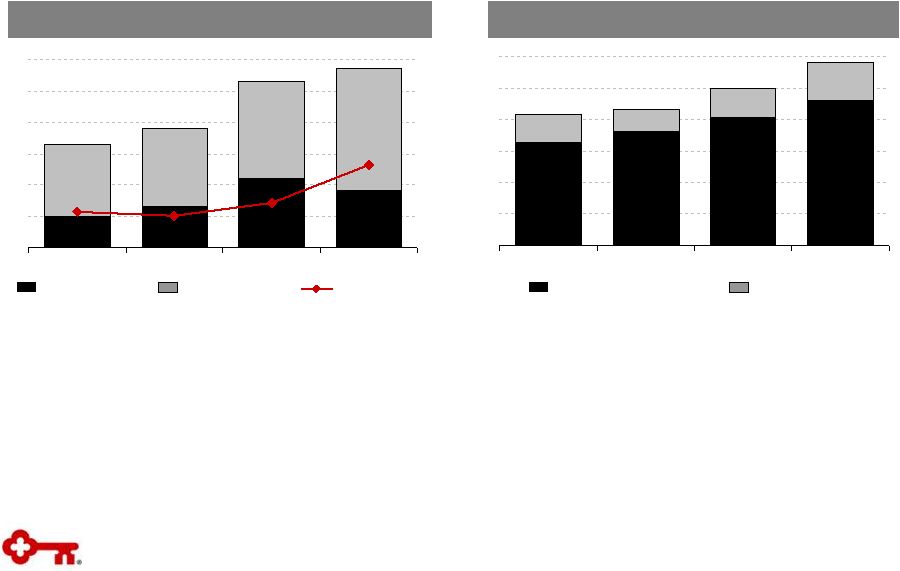
 15
•
Created a series of programs structured around acquiring and broadening client
relationships •
All Relationship Managers and business leaders participate in regular prospect
review sessions Fee Income %
Revenue per FTE ($000s)
Efficiency Ratio
(1)
We
are
aggressively
pursuing
client
acquisition
—
and
measuring
the
efficiency
and
effectiveness of our actions
Measuring Our Progress
Performance
Metrics
--
Key
Corporate
Bank
(1)
Efficiency ratio is adjusted to exclude OREO, intangible asset amortization and
provision for unfunded commitments. On an unadjusted basis, Key Corporate
Bank’s efficiency ratio is 68% and 56% for the twelve months ended 3Q10 and
3Q11, respectively 48%
54%
LTM 3Q10
LTM 3Q11
$724
$696
LTM 3Q10
LTM 3Q11
58%
64%
LTM 3Q10
LTM 3Q11 |
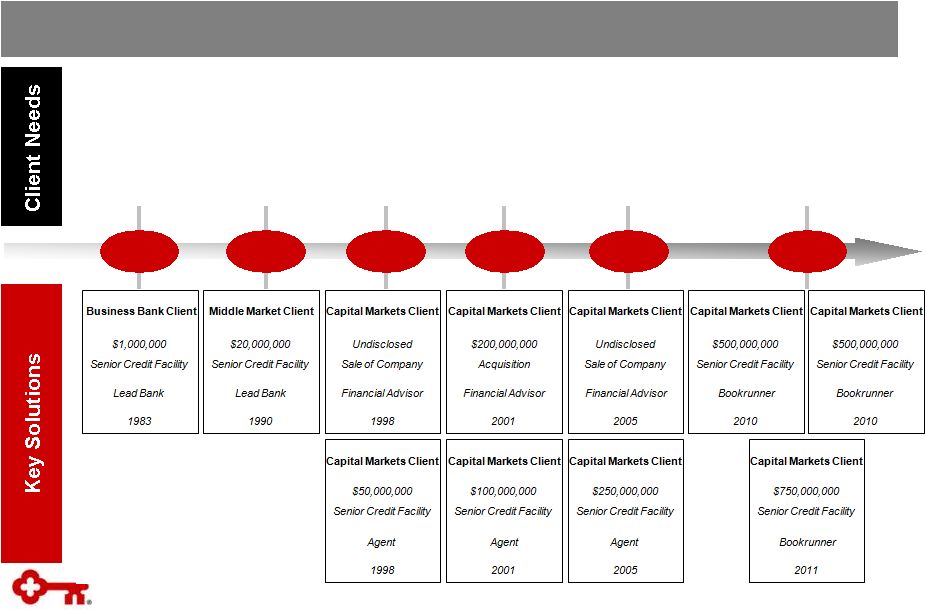 16
Key helped a business client grow from a small enterprise with less than
$1mm in annual revenue to a $1B national leader in its industry
•
Capital to Fund PP&E
1983
1990
1998
2001
2005
2011
•
Capital to Fund Strategic Acquisitions
•
Financial Advisory Solutions
Relationship Strategy in Action |
 17
Appendix |
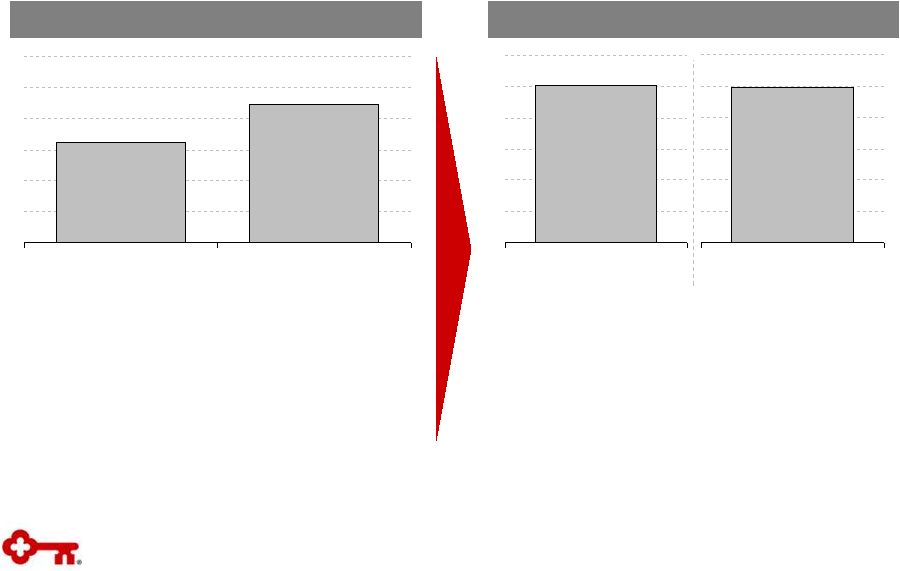
 18
Pre-Crisis
Today
Fragmented, inefficient & high-risk
•
1,000 real estate clients in all sectors and
states (raw land to industry REITs)
•
>50% construction loans
•
Investing in junior debt and equity capital
•
1,100 employees
Focused, efficient & de-risked
•
500 real estate clients in three segments
•
Emphasis on owners/operators
•
15% construction loans
•
Exited higher risk business activities/credits
•
624 employees
Building the Foundation for Growth
Real Estate Capital
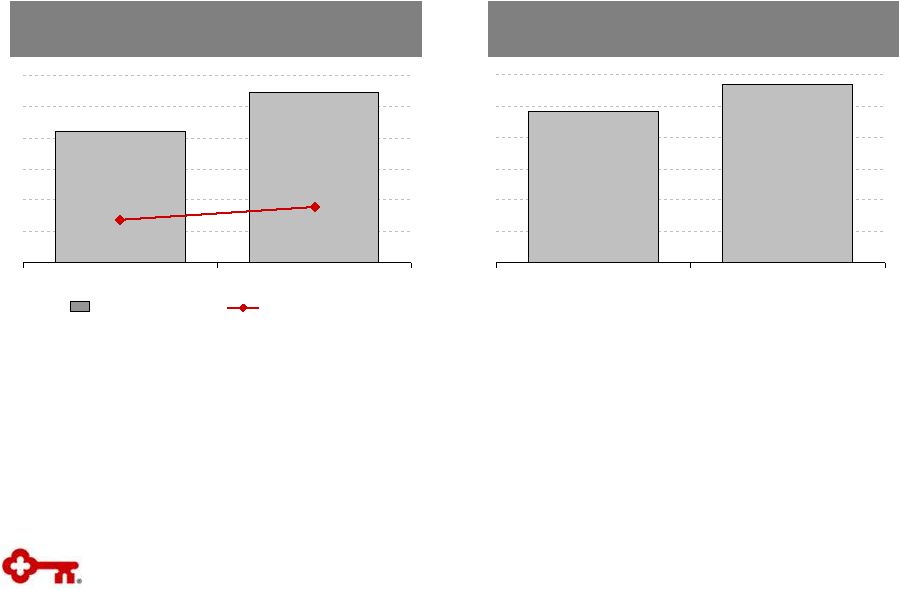
Credit-led sales strategy
•
$149mm of fee income with $23.9B of
commitments
•
Fee income 22% of revenue
•
Limited collaboration with KeyBanc Capital
Markets
Emphasis on fee revenue
•
$151mm of fee income with $10.2B of
commitments
•
Fee income 30% of revenue
(1)
•
$106mm in LTM 3Q11 real estate Investment
Banking Income and Debt Placement Fees
•
Treasury Management penetration of Real
Estate clients is 2x pre-crisis levels
Note:
Information above is for Real Estate Capital only and excludes Corporate Banking
Services Investment Banking Income and Debt Placement Fees includes debt and
equity capital markets underwriting, loan syndication, M&A advisory and
commercial mortgage banking private placement fees (1)
Real Estate Capital fee income % adjusted downward 300bps to exclude $18mm in
Private Equity mark-to-market recoveries |
 19
Senior Debt Bookrunner
Rank
Firm
# of Deals
Volume ($MM)
1
Bank of America Merrill Lynch
59
$13,954
2
JP Morgan
40
12,749
3
Wells Fargo & Company
43
8,090
4
Key
26
4,868
5
PNC
14
2,545
Equity Issuance (IPOs and Follow-ons)
Rank
Firm
# of Deals
Volume ($MM)
1
Bank of America Merrill Lynch
27
$2,589
2
Wells Fargo Securities
24
2,168
3
RBC Capital Markets
23
1,443
4
Key
18
1,287
4
UBS
18
1,589
Equity Issuance (IPOs only)
Rank
Firm
# of Deals
Volume ($MM)
1
RBC Capital Markets
4
$379
2
Key
3
370
2
Bank of America Merrill Lynch
3
474
4
Wells Fargo Securities LLC
2
406
4
Deutsche Bank Securities Inc
2
198
Industry-Leading Real Estate Franchise
Capabilities & Relationships
•
Deep relationships with REITs and real
estate operating companies
–
Key agents 78 REIT and real estate credits
–
Equity research coverage of 60 REITs
–
Helped REITs raise more than $40B in debt
and equity capital since 1Q10
•
Full complement of financing alternatives,
including balance sheet, mortgage banking,
private placements and equity capital
markets
•
Highly-rated third-party servicing business
with more than $100B in assets under
management
Source: Thomson Reuters
YTD U.S. REIT League Tables (by # of deals) |
 20
•
Bolstered Industrial, Consumer, Energy,
Public Sector and Financial Sponsor
coverage groups
•
Significant Debt Capital Markets investment
•
Enhanced equity research platform and
tightened
alignment
with
small-
and
mid-
cap strategy --
369 companies under
research coverage with market
capitalization <$5B
Pre-Crisis
Today
Early stage of integrating 14 distinct
business units
Refined relationship strategy
•
Narrowing focus to small and mid-size;
target clients where we can matter
•
$488mm fee income with $4.9B in average
loan and lease balances
•
Broadened advisory approach
Building the Foundation for Growth
Institutional & Capital Markets
Gaps in industry coverage and product
capability
Deepened industry coverage and enhanced
product support through senior hires
•
No explicit size focus
•
$455mm fee income and $6.7B average
loan and lease balances
•
Credit-led, narrow sales approach
•
No national financial sponsor effort
•
No high-yield debt origination capability
•
262 companies under research coverage
with market capitalization <$5B
Note:
Loan and lease balances are twelve month average figures
|
 21
22
18
31
13
10
25
23
39
$11
$10
$14
$26
3Q08
3Q09
3Q10
3Q11
Growing Equity Capital Markets Platform
Equity
Capital
Markets
Activity
(LTM
figures)
Equity
Research
Coverage
(#
of
companies)
•
Executed 57 equity transactions raising
more than $26B in capital for our clients in
LTM 3Q11
–
Completed 18 lead-managed transactions
including 11 bookrun offerings
•
Strong LTM performance in real estate
–
27 equity transactions for REITs
–
Key ranks #2 in REIT IPOs (by number of
transactions)
•
Niche focus within industry segments:
Basic Materials, Consumer, Energy,
Industrial and Real Estate
•
Focused
on
small-
and
mid-cap
companies
–
Nearly 80% of research coverage has market
capitalization < $5B
–
Increased coverage of small-
and mid-cap
companies by 41% since 3Q08
Note:
Analysis excludes transactions where KeyCorp was the issuer as well as
TARP-related issuances by other Bank Holding Companies Equity research
coverage counts are at period-end Source:
Thomson Reuters
333
346
400
464
33
38
53
57
262
291
326
369
71
55
74
95
3Q08
3Q09
3Q10
3Q11
Lead Transactions
Capital Raised ($B)
Other Transactions
<$5B Market Capitalization
>$4B Capitalization |
 22
Pre-Crisis
Today
Lack of focus
•
Significant volume outside Key footprint
•
Large, fragmented Vendor franchise
–
3,000 Vendor clients in five major industry
groups globally
–
Target size from small-ticket office equipment
to large project finance
•
Significant International operations
–
126 employees
–
18 country locations across Europe and Asia
•
Many unprofitable clients
Narrowed operating focus
•
Tightened alignment between KEF and Key
–
$497mm in Community Bank lease volume
YTD 3Q11, up 40% YoY
•
Highly focused Vendor franchise
–
900 Vendor clients
–
Domestic focus in three industry segments:
healthcare, technology equipment and
software
–
Concentrate on programs with annual volume
> $50mm
•
Limited International operations to support
domestic Vendor relationships
–
65 employees
–
Six country locations in Western Europe
•
Exiting and re-pricing unprofitable clients
and transaction types
Building the Foundation for Growth
Key Equipment Finance |
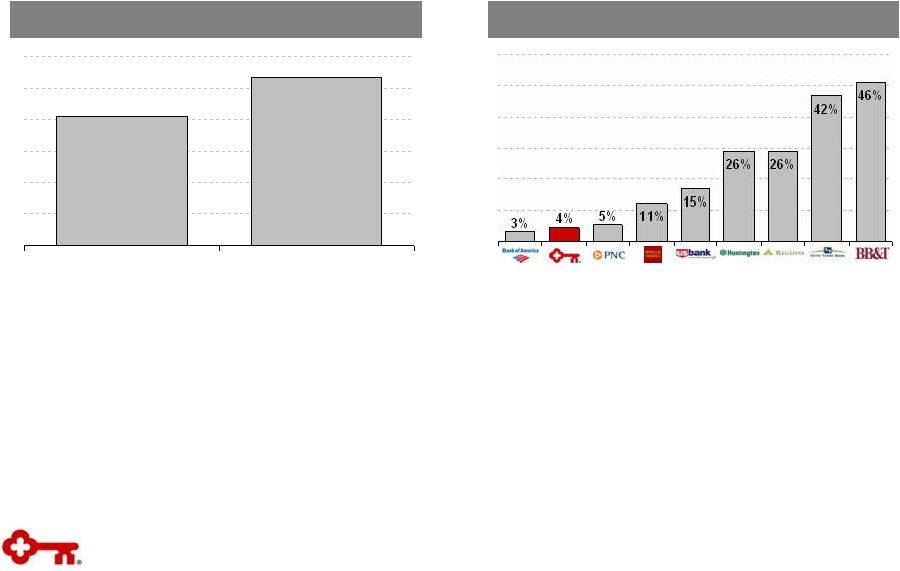 23
Strong Equipment Finance Business
New Asset Origination ($B)
Buy-desk
Activity
as
%
of
Originations
(1)
•
Originated $3.2B in gross new business
volume YTD 3Q11, up $756mm or 31% YoY
•
Growth driven by our focus on targeted
segments
–
Bank Channel up 73% YoY
–
Technology up 39% YoY
–
Healthcare up 22% YoY
•
Key is achieving volume targets while
remaining focused on our core client
relationship strategy
–
Much less reliant than many bank-owned
peers on third-party originated assets
(1)
Source: 2011 Monitor 100; Data are for FY10
$2.5
$3.2
LTM 3Q10
LTM 3Q11 |