Attached files
| file | filename |
|---|---|
| EX-32.1 - CERTIFICATION OF CHIEF EXECUTIVE OFFICER - Keyuan Petrochemicals, Inc. | f10q0610a3ex32i_keyuan.htm |
| EX-31.1 - CERTIFICATION OF CHIEF EXECUTIVE OFFICER - Keyuan Petrochemicals, Inc. | f10q0610a3ex31i_keyuan.htm |
| EX-31.2 - CERTIFICATION OF CHIEF FINANCIAL OFFICER - Keyuan Petrochemicals, Inc. | f10q0610a3ex31ii_keyuan.htm |
| EX-32.2 - CERTIFICATION OF CHIEF FINANCIAL OFFICER - Keyuan Petrochemicals, Inc. | f10q0610a3ex32ii_keyuan.htm |
U.S. SECURITIES AND EXCHANGE COMMISSION
WASHINGTON, D.C. 20549
FORM 10-Q/A3
(Mark One)
x QUARTERLY REPORT PURSUANT TO SECTION 13 OR 15(d) OF THE SECURITIES EXCHANGE ACT OF 1934
For the quarterly period ended June 30, 2010
o TRANSITION REPORT PURSUANT TO SECTION 13 OR 15(d) OF THE SECURITIES EXCHANGE ACT OF 1934
For the transition period from _______________ to _______________
Commission File Number
Keyuan Petrochemicals, Inc.
(Exact name of registrant as specified in its charter)
|
Nevada
|
45-0538522
|
|
|
(State or other jurisdiction
of incorporation or organization)
|
(IRS Employer Identification No.)
|
Qingshi Industrial Park
Ningbo Economic & Technological Development Zone
Ningbo, Zhejiang Province
P.R. China 315803
(86) 574-8623-2955
(Issuer's telephone number)
(Former address)
Check whether the issuer (1) filed all reports required to be filed by Section 13 or 15(d) of the Exchange Act of 1934 during the past 12 months (or for such shorter period that the registrant was required to file such reports), and (2) has been subject to such filing requirements for the past 90 days. Yes x No o
Indicate by check mark whether the registrant has submitted electronically and posted on its corporate Web site, if any, every Interactive Data File required to be submitted and posted pursuant to Rule 405 of Regulation S-T (Sec. 232.405 of this chapter) during the preceding 12 months (or for such shorter period that the registrant was required to submit and post such files).
Yes x No o
Indicate by check mark whether the registrant is a large accelerated filer, an accelerated filer or a non-accelerated filer. See definition of “accelerated filer and large accelerated filer” in Rule 12b-2 of the Exchange Act. (Check one)
|
Large Accelerated Filer
|
o
|
Accelerated Filer
|
o
|
|
|
Non-accelerated filer
|
o
|
Smaller reporting company
|
x
|
Indicate by check mark whether the registrant is a shell company (as defined in Rule 12b-2 of the Securities Exchange Act of 1934) Yes o No x
As of November 1, 2011, there were 57,579,490 shares of Common Stock, par value $0.001 outstanding and 5,400,010 shares of Series M Preferred Stock, par value is $.001.
EXPLANATORY NOTE
We are filing this Form 10-Q/A3 for the period ended June 30, 2010 (“Amended Report”) to revise our originally filed Form 10-Q/A2 (“Original Report”) for this same period regarding the following:
|
1.
|
We had originally recorded a tax benefit that we received from the local government as a tax credit for the period in which the income was generated. However, we now feel it is more appropriate to record the benefit as other income when we received it from the government. Accordingly, our effective estimated tax rate is changed to 25% and this preferential tax treatment is currently accounted for as other income when it was received.
|
|
2.
|
We have revised our calculation of basic earnings per share to include the shares of Series M preferred stock as participating securities under the two-class accounting method. As such, we have revised our calculation of basic earnings per share to include the shares of Series M preferred stock.
|
|
3.
|
Originally, the Series A preferred stock was classified as permanent equity. After review and consideration, management has now concluded that, as a result of certain potential merger and acquisition activity, there exists one potential situation where the redemption provision could occur outside of the control of the Company. Accordingly, the Series A preferred stock has now been classified as temporary equity.
|
|
4.
|
We have added additional disclosures of our related party transactions to ensure that we include all of the disclosures required under US GAAP and the rules and regulations of the Securities Exchange Commission (the “SEC”).
|
|
5.
|
Originally we accrued the 2nd quarter dividend for Series A shareholders in the 3rd quarter. We have revised to accrue the 2nd quarter dividend in the same quarter. |
|
6.
|
Though the amount of the off-the-books account during the period ending June 30, 2010 was determined to be immaterial to the earnings of the Company, we have updated subsequent event in the footnote in connection with its existence and also in connection with the investigation commenced by the Audit Committee in April 2011. |
|
7.
|
We have added revised disclosure of our internal controls and procedures over financial reporting (ICFR) for the three months ended December 31, 2010. |
This Amended Report does not reflect events occurring after the filing of the Original Report on October 15, 2010, nor does it modify or update those disclosures presented therein, except with regard to the modifications described in this Explanatory Note. As such, this Amended Report continues to speak as of October 15, 2010. Accordingly, this Amended Report should be read in conjunction with the Original Report and our other reports filed with the SEC subsequent to the filing of our Original Report, including any amendments to those filings.
In addition, pursuant to Rule 12b-15 under the Securities Exchange Act of 1934, as a result of this Amended Report, the certifications pursuant to Section 302 and Section 906 of the Sarbanes-Oxley Act of 2002, filed and furnished, respectively, as exhibits to the Original Report have been re-executed and re-filed as of the date of this Amended Report and are included as exhibits hereto.
TABLE OF CONTENTS
|
PART I - FINANCIAL INFORMATION
|
|
|
Item 1. Financial Statements
|
1
|
|
Report of Independent Registered Public Accounting Firm
|
1
|
|
Restated Consolidated Balance Sheets
|
2
|
|
Restated Consolidated Statements of Operations and Comprehensive Income (loss)
|
3
|
|
Restated Consolidated Statements of Changes in Equity
|
4
|
|
Restated Consolidated Statements of Cash Flows
|
5
|
|
Notes to Restated Consolidated Financial Statements (Unaudited)
|
6
|
|
Item 2. Management’s Discussion and Analysis or Plan of Operation
|
33
|
|
Item 3. Quantitative and Qualitative Disclosures About Market Risk
|
42
|
|
Item 4. Controls and Procedures
|
42
|
|
PART II – OTHER INFORMATION
|
45 |
|
Item 1. Legal Proceedings
|
45
|
|
Item 1A. Risk Factors
|
45
|
|
Item 2. Unregistered Sales of Equity Securities And Use Of Proceeds
|
45
|
|
Item 3. Defaults Upon Senior Securities
|
45
|
|
Item 4. (Removed and Reserved)
|
45
|
|
Item 5. Other Information
|
45
|
|
Item 6. Exhibits
|
45
|
PART I – FINANCIAL INFORMATION
Report of Independent Registered Public Accounting Firm
To the Board of Directors and Stockholders
Keyuan Petrochemicals, Inc.
We have reviewed the accompanying consolidated balance sheet of Keyuan Petrochemicals, Inc. (the “Company”) as of June 30, 2010, and the related consolidated statements of operations and comprehensive income (loss) for the three months and six months ended June 30, 2010 and 2009, consolidated statements of stockholders’ equity for the six months ended June 30, 2010, and the consolidated statements of cash flows for the six months ended June 30, 2010 and 2009. These consolidated financial statements are the responsibility of the Company’s management.
We conducted our reviews in accordance with the standards of the Public Company Accounting Oversight Board (United States). A review of interim financial information consists principally of applying analytical procedures and making inquiries of persons responsible for financial and accounting matters. It is substantially less in scope than an audit conducted in accordance with the standards of the Public Company Accounting Oversight Board (United States), the objective of which is the expression of an opinion regarding the financial statements taken as a whole. Accordingly, we do not express such an opinion.
Based on our review, we are not aware of any material modifications that should be made to the accompanying financial statements referred to above for them to be in conformity with accounting principles generally accepted in the United States of America.
As described in Note 24 to the consolidated financial statements, the June 30, 2010 and 2009 financial statements haves been restated to correct certain misstatements.
/s/ PATRIZIO & ZHAO, LLC
Parsippany, New Jersey
August 10, 2010
(Except for the Consolidated Statements of Changes in Equity
and Note 2, 7, 16, 20, 22, 23, 24, 25, 26 as to which the date is October 28, 2011)
1
Consolidated Balance Sheets
|
June 30,
|
December 31,
|
|||||||
|
2010
|
2009
|
|||||||
|
(Restated)
|
(Restated)
|
|||||||
|
Current assets:
|
(Unaudited)
|
|||||||
|
Cash and cash equivalents
|
$
|
5,522,675
|
$
|
14,030,655
|
||||
|
Restricted cash
|
33,808,001
|
6,012,690
|
||||||
|
Trade notes receivable
|
10,338,534
|
400,491
|
||||||
|
Inventories
|
67,500,925
|
32,595,045
|
||||||
|
Advance payments
|
13,663,490
|
7,417,202
|
||||||
|
Prepaid tax expense
|
26,555,299
|
15,263,949
|
||||||
|
Due from unrelated parties
|
-
|
1,068,741
|
||||||
|
Deferred tax assets
|
296,335
|
3,486,922
|
||||||
|
Other current assets
|
476,672
|
581,706
|
||||||
|
Total current assets
|
158,161,931
|
80,857,401
|
||||||
|
Property, plant and equipment, net
|
130,367,038
|
131,824,617
|
||||||
|
Other assets
|
||||||||
|
Intangible assets, net
|
6,408,044
|
6,378,316
|
||||||
|
Total assets
|
$
|
294,937,013
|
$
|
219,060,334
|
||||
|
Liabilities
|
||||||||
|
Current liabilities:
|
||||||||
|
Accounts payable – trade and accrued expenses
|
$
|
60,422,125
|
$
|
2,888,860
|
||||
|
Accounts payable – construction related
|
30,633,675
|
45,374,656
|
||||||
|
Short-term bank loans
|
83,961,000
|
82,885,500
|
||||||
|
Current portion of long-term debt
|
20,180,100
|
7,628,400
|
||||||
|
Trade notes payable
|
19,001,700
|
13,719,134
|
||||||
|
Advance from customers
|
13,526,054
|
16,549,644
|
||||||
|
Due to former shareholder
|
-
|
733,500
|
||||||
|
Due to unrelated parties
|
-
|
953,550
|
||||||
|
Dividend Payable
|
288,497
|
-
|
||||||
|
Other current liabilities
|
311,718
|
290,631
|
||||||
|
Total current liabilities
|
228,324,869
|
171,023,875
|
||||||
|
Long-term debt
|
23,568,000
|
37,408,500
|
||||||
|
Total liabilities
|
251,892,869
|
208,432,375
|
||||||
|
Equity:
|
||||||||
|
Temporary equity:
|
||||||||
|
Series A convertible preferred stock, $0.001 par value, 20,000,000 shares
|
||||||||
|
authorized, 6,738,336 shares issued and outstanding at
|
||||||||
|
June 30, 2010
|
21,018,143
|
-
|
||||||
|
Stockholders’ equity:
|
||||||||
|
Series M preferred stock, $0.001 par value, 47,658 shares
|
||||||||
|
authorized, issued and outstanding at June 30, 2010
|
48
|
48
|
||||||
|
Common stock, $0.001 par value, 50,000,000 shares authorized,
|
||||||||
|
3,181,504 issued and outstanding at June 30,2010
|
3,182
|
-
|
||||||
|
Additional paid-in capital
|
22,465,537
|
20,229,949
|
||||||
|
Accumulated deficit
|
(1,699,495
|
) |
(10,664,819
|
)
|
||||
|
Accumulated other comprehensive income
|
1,256,729
|
1,062,781
|
||||||
|
Total stockholders’ equity
|
22,026,001
|
10,627,959
|
||||||
|
Total equity
|
43,044,144
|
10,627,959
|
||||||
|
Total liabilities and equity
|
$
|
294,937,013
|
$
|
219,060,334
|
||||
See accompanying notes to consolidated financial statements.
2
Consolidated Statements of Operations and Comprehensive Income (loss)
(Unaudited)
|
For the Three Months
|
For the Six Months
|
|||||||||||||||
|
Ended June 30,
|
Ended June 30,
|
|||||||||||||||
|
2010
|
2009
|
2010
|
2009
|
|||||||||||||
|
(Restated)
|
(Restated)
|
(Restated)
|
(Restated)
|
|||||||||||||
|
Sales
|
||||||||||||||||
|
External parties
|
105,627,764
|
-
|
202,182,241
|
-
|
||||||||||||
|
Related parties
|
26,369,453
|
- |
|
47,186,862
|
-
|
|||||||||||
|
Total Sales
|
$
|
131,997,217
|
$
|
-
|
$
|
249,369,103
|
$
|
-
|
||||||||
|
Cost of sales
|
||||||||||||||||
|
External parties
|
98,516,344
|
-
|
187,429,672
|
-
|
||||||||||||
|
Related parties
|
24,835,031
|
-
|
44,478,145
|
-
|
||||||||||||
|
Cost of sales
|
123,351,375
|
-
|
231,907,817
|
-
|
||||||||||||
|
Gross profit
|
8,645,842
|
-
|
17,461,286
|
-
|
||||||||||||
|
Operating expenses
|
||||||||||||||||
|
Selling expenses
|
258,901
|
-
|
343,413
|
-
|
||||||||||||
|
General and administrative expenses
|
1,213,080
|
709,161
|
2,018,612
|
1,236,593
|
||||||||||||
|
Total operating expenses
|
1,471,981
|
709,161
|
2,362,025
|
1,236,593
|
||||||||||||
|
Income (loss) from operations
|
7,173,861
|
(709,161
|
)
|
15,099,261
|
(1,236,593
|
)
|
||||||||||
|
Other income (expenses):
|
||||||||||||||||
|
Interest expense, net
|
(1,589,937
|
)
|
(274,460
|
)
|
(2,663,462
|
)
|
(253,179
|
)
|
||||||||
|
Non-operating income (expenses)
|
118,802
|
(138,257
|
)
|
9,599
|
(140,906
|
)
|
||||||||||
|
Total other income (expenses)
|
(1,471,135
|
)
|
(412,717
|
)
|
(2,653,863
|
)
|
(394,085
|
)
|
||||||||
|
Income (loss) before provision for income
|
||||||||||||||||
|
taxes
|
5,702,726
|
(1,121,878
|
)
|
12,445,398
|
(1,630,678
|
)
|
||||||||||
|
Provision (benefit) for income taxes
|
||||||||||||||||
|
Current
|
1,504,063
|
(280,470
|
)
|
3,191,577
|
(407,670
|
)
|
||||||||||
|
Deferred
|
-
|
-
|
-
|
-
|
||||||||||||
|
Total
|
1,504,063
|
(280,470
|
)
|
3,191,577
|
(407,670
|
)
|
||||||||||
|
Net income (loss) attributable to Keyuan Petrochemicals, Inc. stockholders
|
4,198,663
|
(841,408
|
)
|
9,253,821
|
(1,223,008
|
)
|
||||||||||
|
Dividends to Series A convertible preferred stockholders
|
288,497
|
288,497
|
||||||||||||||
|
Net income (loss) attributable to Keyuan Petrochemicals, Inc. common stockholders
|
3,910,166
|
(841,408
|
) |
8,965,324
|
(1,223,008
|
) | ||||||||||
|
Other comprehensive income
|
||||||||||||||||
|
Foreign currency translation adjustment
|
192,224
|
9,160
|
193,948
|
(4,478
|
)
|
|||||||||||
|
Comprehensive Income (loss)
|
$
|
4,390,887
|
$
|
(832,248
|
)
|
$
|
9,447,769
|
$
|
(1,227,486
|
)
|
||||||
|
Earnings (loss) per share
|
||||||||||||||||
|
Attributable to common stock
|
||||||||||||||||
|
-Basic
|
$ |
0.08
|
$ |
0.00
|
$ |
0.18
|
$ |
0.00
|
||||||||
| -Diluted | $ | 0.08 | $ | 0.00 | $ | 0.18 | $ | 0.00 | ||||||||
|
Attributable to Series M preferred stocks
|
||||||||||||||||
|
-Basic
|
$ |
78.13
|
$ |
0.00
|
$ |
183.50
|
$ |
0.00
|
||||||||
| -Diluted | $ | 76.44 | $ | 0.00 | $ | 180.34 | $ | 0.00 | ||||||||
|
Weighted average number of common shares outstanding
|
||||||||||||||||
|
Basic
|
2,387,451
|
-
|
1,200,321
|
-
|
||||||||||||
|
Diluted
|
54,930,660
|
-
|
51,314,420
|
-
|
||||||||||||
See accompanying notes to consolidated financial statements.
3
Consolidated Statements of Changes in Equity
|
Accumulated
|
||||||||||||||||||||||||||||||||||||||||
|
Series M convertible
|
Common stock
|
Additional
|
other
|
Total
|
||||||||||||||||||||||||||||||||||||
|
preferred stock
|
paid-in
|
comprehensive
|
Retained
|
Stockholder's
|
Temporary
|
Total
|
||||||||||||||||||||||||||||||||||
|
shares
|
par value
|
shares
|
par value
|
capital
|
income
|
Earnings
|
Equity
|
Equity
|
Equity
|
|||||||||||||||||||||||||||||||
|
(Restated)
|
(Restated)
|
(Restated)
|
(Restated)
|
(Restated)
|
(Restated)
|
(Restated)
|
(Restated)
|
(Restated)
|
(Restated)
|
|||||||||||||||||||||||||||||||
|
Balance as of January 1, 2009
|
47,658 | $ | 48 | - | $ | - | $ | 10,529,952 | $ | 1,046,790.00 | $ | (1,831,750 | ) | $ | 9,745,040 | $ | - | $ | 9,745,040 | |||||||||||||||||||||
|
Net loss
|
- | - | - | - | - | - | (8,833,069 | ) | (8,833,069 | ) | - | (8,833,069 | ) | |||||||||||||||||||||||||||
|
Foreign currency translation
|
||||||||||||||||||||||||||||||||||||||||
|
adjustment, net of tax
|
- | - | - | - | - | 15,991 | - | 15,991 | - | 15,991 | ||||||||||||||||||||||||||||||
|
Comprehensive income
|
(8,817,078 | ) | - | (8,817,078 | ) | |||||||||||||||||||||||||||||||||||
|
Capital contribution from
|
||||||||||||||||||||||||||||||||||||||||
|
Stockholders
|
- | - | - | - | 9,699,997 | - | - | 9,699,997 | - | 9,699,997 | ||||||||||||||||||||||||||||||
|
Balance as of December 31, 2009
|
47,658 | $ | 48 | - | $ | - | $ | 20,229,949 | $ | 1,062,781 | $ | (10,664,819 | ) | $ | 10,627,959 | $ | - | $ | 10,627,959 | |||||||||||||||||||||
|
Net income
|
- | - | - | - | - | - | 9,253,821 | 9,253,821 | - | 9,253,821 | ||||||||||||||||||||||||||||||
|
Foreign currency translation
|
||||||||||||||||||||||||||||||||||||||||
|
adjustment, net of tax
|
- | - | - | - | - | 193,948 | - | 193,948 | - | 193,948 | ||||||||||||||||||||||||||||||
|
Fixed dividends for Series A convertible preferred stockholders
|
(288,497 | ) | (288,497 | ) | ||||||||||||||||||||||||||||||||||||
|
Comprehensive income
|
9,447,769 | - | 9,447,769 | |||||||||||||||||||||||||||||||||||||
|
Effect of reverse recapitalization
|
- | - | 5,696,800 | 5,697 | (5,697 | ) | - | - | - | - | - | |||||||||||||||||||||||||||||
|
Repurchase and cancellation of
|
||||||||||||||||||||||||||||||||||||||||
|
common stock
|
- | - | (3,264,000 | ) | (3,264 | ) | (396,736 | ) | - | - | (400,000 | ) | - | (400,000 | ) | |||||||||||||||||||||||||
|
Issuance of common stock on
|
||||||||||||||||||||||||||||||||||||||||
|
April 22, 2010 and May 18, 2010
|
||||||||||||||||||||||||||||||||||||||||
|
net of issuance costs
|
||||||||||||||||||||||||||||||||||||||||
|
of $221,661
|
- | - | 748,704 | 749 | 1,598,390 | - | - | 1,599,139 | - | 1,599,139 | ||||||||||||||||||||||||||||||
|
Issuance of Series A
|
||||||||||||||||||||||||||||||||||||||||
|
and Series B warrants,
|
||||||||||||||||||||||||||||||||||||||||
|
net of issuance
|
||||||||||||||||||||||||||||||||||||||||
|
costs of $45,584
|
- | - | - | - | 345,126 | - | - | 345,126 | - | 345,126 | ||||||||||||||||||||||||||||||
|
Issuance of warrants to placement
|
||||||||||||||||||||||||||||||||||||||||
|
agent in connection with
|
||||||||||||||||||||||||||||||||||||||||
|
Series A Private Placement
|
- | - | - | - | 349,681 | - | - | 349,681 | - | 349,681 | ||||||||||||||||||||||||||||||
|
Share-based compensation
|
- | - | - | - | 124,824 | - | - | 124,824 | - | 124,824 | ||||||||||||||||||||||||||||||
|
Capital contribution from stockholders
|
- | - | - | - | 220,000 | - | - | 220,000 | - | 220,000 | ||||||||||||||||||||||||||||||
|
Issuance of Series A
|
- | - | - | - | - | - | - | - | 21,018,143 | 21,018,143 | ||||||||||||||||||||||||||||||
|
convertible preferred stock
|
||||||||||||||||||||||||||||||||||||||||
|
Balance as of June 30, 2010
|
47,658 | $ | 48 | 3,181,504 | $ | 3,182 | $ | 22,465,537 | $ | 1,256,729 | $ | (1,699,495 | ) | $ | 22,314,498 | $ | 21,018,143 | $ | 43,044,144 | |||||||||||||||||||||
See accompanying notes to consolidated financial statements.
4
Consolidated Statements of Cash Flows
(Unaudited)
|
For the Six Months Ended June 30,
|
||||||||
|
2010
|
2009
|
|||||||
|
(Restated)
|
(Restated)
|
|||||||
|
Cash flows from operating activities:
|
||||||||
|
Net income (loss)
|
$
|
9,253,821
|
$
|
(1,223,008
|
)
|
|||
|
Adjustments to reconcile net income to net cash
|
||||||||
|
provided by (used in) operating activities:
|
||||||||
|
Depreciation and amortization
|
4,204,754
|
177,867
|
||||||
|
Deferred tax assets
|
3,191,577
|
(407,669
|
)
|
|||||
|
Share-based compensation expense
|
124,824
|
-
|
||||||
|
Changes in current assets and current liabilities:
|
||||||||
|
Trade notes receivable
|
(9,895,257
|
)
|
(14,657
|
)
|
||||
|
Inventories
|
(34,628,566
|
)
|
(10,531,710
|
)
|
||||
|
Advance payments for raw materials
|
(6,190,211
|
)
|
-
|
|||||
|
Prepaid taxes
|
(11,182,419
|
)
|
(4,121,387
|
)
|
||||
|
Other current assets
|
1,175,434
|
(557,250
|
)
|
|||||
|
Accounts payable – trade and accrued expenses
|
57,283,692
|
(44,988
|
)
|
|||||
|
Trade notes payable
|
-
|
7,328,500
|
||||||
|
Advances from customers
|
(3,078,476
|
)
|
-
|
|||||
|
Other current liabilities
|
19,826
|
3,978,757
|
||||||
|
Total adjustments
|
1,025,178
|
(4,192,535
|
)
|
|||||
|
Net cash provided by (used in) operating activities
|
10,278,999
|
(5,415,543
|
)
|
|||||
|
Cash flows from investing activities:
|
||||||||
|
Advance payments for construction in progress
|
-
|
(817,846
|
)
|
|||||
|
Due from unrelated parties
|
-
|
-
|
||||||
|
Additions to property and equipment
|
(17,084,658
|
(24,250,885
|
)
|
|||||
|
Additions to intangible assets
|
-
|
(51,300
|
)
|
|||||
|
Accounts payable – construction related
|
-
|
(650,608
|
)
|
|||||
|
Net cash used in investing activities
|
(17,084,658
|
)
|
(25,770,639
|
)
|
||||
|
Cash flows from financing activities:
|
||||||||
|
Restricted cash
|
(27,655,715
|
)
|
(2,543,491
|
)
|
||||
|
Proceeds from short-term bank loans
|
733,450
|
29,314,000
|
||||||
|
Proceeds from bills payable
|
18,923,010
|
-
|
||||||
|
Repayment of bills payable
|
(13,718,199
|
)
|
-
|
|||||
|
Repayments to Ningbo Litong
|
(733,450
|
)
|
4,236,529
|
|||||
|
Repayment to Ningbo Litong
|
(953,485
|
)
|
-
|
|||||
|
Repayment of long-term bank loans
|
(1,466,900
|
)
|
-
|
|||||
|
Process from warrant exercises
|
23,132,089
|
9,650,000
|
||||||
|
Net cash provided by (used in) financing activities
|
(1,739,200
|
)
|
40,657,038
|
|||||
|
Effect of foreign currency translation on cash
|
36,879
|
(4,090
|
)
|
|||||
|
Net increase (decrease) in cash and cash equivalents
|
(8,507,980
|
)
|
9,466,766
|
|||||
|
Cash and cash equivalents – beginning of period
|
14,030,655
|
9,094,537
|
||||||
|
Cash and cash equivalents – ending of period
|
$
|
5,522,675
|
$
|
18,561,303
|
||||
| Supplemental schedule of non cash activities: | ||||||||
|
Preferred stock dividends declared
|
$
|
288,497
|
$
|
-
|
||||
See accompanying notes to consolidated financial statements.
5
Notes to Consolidated Financial Statements
(Unaudited)
Note 1 – Organization and Description of Business
Keyuan Petrochemicals, Inc, formerly known as Silver Pearl Enterprises, Inc. (“Silver Pearl”), a public shell company as defined in Rule 12b-2 of the Exchange Act of 1934, as amended, was established under the laws of Texas on May 4, 2004. The accompanying consolidated financial statements include the financial statements of Keyuan Petrochemicals, Inc. and its subsidiaries (the “Company” or “We”). The Company’s primary business involves researching, manufacturing, and selling petrochemical products.
On April 22, 2010, Silver Pearl entered into a Share Exchange Agreement, by and among Keyuan International Group Limited (“Keyuan International”), a company organized under the laws of the British Virgin Islands on June 11, 2009, Delight Reward Limited, the sole shareholder of Keyuan International and a company organized under the laws of the British Virgin Islands (the “Keyuan International Shareholder”), and Denise D. Smith, the Company’s former principal stockholder (“Smith”). Pursuant to the terms of the Exchange Agreement, Keyuan International Shareholder transferred to Silver Pearl all of the issued and outstanding ordinary shares of Keyuan International (the “Keyuan International Shares”) in exchange for the issuance of 47,658 shares of Silver Pearl’s Series M preferred stock, par value $0.001 per share (the “Series M Preferred Stock”) (such transaction is sometimes referred to herein as the “Share Exchange”). The Series M shares vote with the common stock on an as converted basis and are convertible into 47,658,000 shares of common stock upon the Company’s shareholders approving an increase in authorized common stock to at least 100,000,000 shares. The acquisition was accounted for as a reverse acquisition under the purchase method for business combinations.
As a result of the Share Exchange, we are now the holding company of Ningbo Keyuan Plastics Co., Ltd. (“Ningbo Keyuan”), the operating subsidiary of Keyuan International organized in the People’s Republic of China (“China” or the “PRC”) and engaged in manufacturing and supplying various petrochemical products in China. Ningbo Keyuan was established on April 26, 2007 under the corporate laws of the People’s Republic of China (“PRC”). On November 16, 2009 Ningbo Keyuan was acquired by Keyuan Group Limited, a wholly owned subsidiary of Keyuan International. The business of Keyuan International is conducted through the operations at Ningbo Keyuan.
On May 12, 2010, we caused to be formed a corporation under the laws of the State of Nevada called Keyuan Petrochemicals, Inc. and on the same day, acquired 100% of this entity’s stock for cash. As such, this entity became our wholly-owned subsidiary (the “Merger Subsidiary”).
Effective as of May 17, 2010, the merger subsidiary was merged with and into us. As a result of the merger, our corporate name was changed to “Keyuan Petrochemicals, Inc.” Prior to the merger, the merger subsidiary had no liabilities and nominal assets and, as a result of the merger, the separate existence of the merger subsidiary ceased. We are the surviving corporation in the merger and, except for the name change provided for in the Agreement and Plan of Merger, there was no change in our directors, officers, capital structure or business.
Note 2– Summary of Significant Accounting Policies
Basis of Presentation
The Company’s unaudited consolidated financial statements include the accounts of its wholly-owned subsidiaries. All intercompany balances and transactions are eliminated in consolidation. The accompanying unaudited financial statements have been prepared in accordance with generally accepted accounting principles (GAAP) applicable to interim financial information and the requirements of Form 10-Q and Article 10 of Regulation S-X of the Securities and Exchange Commission. Accordingly, they do not include all of the information and disclosures required by accounting principles generally accepted in the United States of America for complete financial statements. Interim results are not necessarily indicative of results for a full year. In the opinion of management, all adjustments considered necessary for a fair presentation of the financial position and the results of operations and cash flows for the interim periods have been included.
6
In preparing the accompanying unaudited consolidated financial statements, the Company evaluated the period from June 30, 2010 through the date the financial statements were issued for material subsequent events requiring recognition or disclosure. Event identified for this period is described in Note 26.
Interim Financial Statements
These interim financial statements should be read in conjunction with the audited financial statements for the years ended December 31, 2009 and 2008, as not all disclosures required by generally accepted accounting principles (“GAAP”) for annual financial statements are presented. The interim financial statements follow the same accounting policies and methods of computations as the audited financial statements for the years ended December 31, 2009 and 2008.
Reclassification
Certain amounts as of December 31, 2009 were reclassified to conform to current period presentation.
Note 3– Restricted Cash
As of June 30, 2010 and December 31, 2009, the Company had restricted cash of $33,808,001 and $6,012,690, respectively. These restricted cash balances are reserved for settlement of trade notes payable and open letter of credit in connection with inventory purchases. The cash held in custody by bank issuing the trade notes payable and letter of credit is restricted as to withdrawal or use, and is currently earning interest.
Note 4 – Inventories
Inventories at June 30, 2010 and December 31, 2009 consist of the following:
|
June 30,
2010
|
December 31, 2009
|
|||||||
|
Raw materials
|
$
|
30,403,055
|
$
|
14,740,077
|
||||
|
Work in process
|
2,987,649
|
1,558,588
|
||||||
|
Finished goods
|
34,110,221
|
16,296,380
|
||||||
|
Total
|
$
|
67,500,925
|
$
|
32,595,045
|
||||
7
Note 5 – Advance Payments
The Company makes advances to certain vendors for purchase of raw materials. The advances for the purchase of raw materials amounted to $13,663,490 and $7,417,202 as of June 30, 2010 and December 31, 2009, respectively.
Note 6 – Prepaid Taxes
Prepaid taxes at June 30, 2010 and December 31, 2009 consist of the following:
|
June 30,
2010
|
December 31, 2009
|
|||||||
|
Value-added taxes (VAT)
|
$
|
16,946,090
|
$
|
15,263,949
|
||||
|
Customs duties
|
9,609,209
|
-
|
||||||
|
Total
|
$
|
26,555,299
|
$
|
15,263,949
|
||||
Note 7 – Deferred Tax Assets
Significant components of the Company’s deferred tax assets are as follows:
|
June 30,
2010
|
December 31, 2009
|
|||||||
|
(unaudited)
|
||||||||
|
Net operating loss carryforwards
|
$
|
296,335
|
$
|
3,486,922
|
||||
|
Total
|
$
|
296,335
|
$
|
3,486,922
|
||||
At June 30, 2010, the Company has available unused net operating losses carryforwards that may be applied against future taxable income and expire as follows:
|
Net operating losses
|
||||
|
Year of Expiration
|
carryforwards
|
|||
|
2014
|
$
|
296,335
|
||
|
Total
|
$
|
296,335
|
||
8
Note 8 – Property, Plant and Equipment
Property, plant and equipment at June 30, 2010 and December 31, 2009 consists of the following:
|
June 30,
2010
|
December 31, 2009
|
|||||||
|
Buildings
|
$
|
1,517,190
|
$
|
1,511,010
|
||||
|
Machinery and equipment
|
132,428,875
|
130,044,758
|
||||||
|
Vehicles
|
533,874
|
305,536
|
||||||
|
Office equipment and furniture
|
126,271
|
120,367
|
||||||
|
Subtotal
|
134,606,210
|
131,981,671
|
||||||
|
Less: accumulated depreciation
|
4,239,172
|
157,054
|
||||||
|
Total
|
$
|
130,367,038
|
$
|
131,824,617
|
||||
Depreciation expense for the three months ended June 30, 2010 and 2009 were $2,035,099 and $21,935, respectively. Depreciation expenses for the six months ended June 30, 2010 and 2009 were $4,064,573 and $41,199, respectively.
Note 9 – Intangible Assets
Intangible assets at June 30, 2010 (unaudited) and December 31, 2009 consist of the following:
|
June 30,
2010
|
December 31, 2009
|
|||||||
|
Land use rights
|
$
|
5,636,145
|
$
|
5,613,187
|
||||
|
Software
|
148,087
|
3,668
|
||||||
|
Technology
|
1,399,350
|
1,393,650
|
||||||
|
Subtotal
|
7,183,582
|
7,010,505
|
||||||
|
Less: accumulated amortization
|
775,538
|
632,189
|
||||||
|
Total
|
$
|
6,408,044
|
$
|
6,378,316
|
||||
Amortization expense for the three months ended June 30, 2010 and 2009 were $70,665 and $68,362, respectively. Amortization expense for the six months ended June 30, 2010 (unaudited) and 2009 were $140,181 and $136,668, respectively.
Note 10 – Accounts Payable – Trade and Accrued Expenses
Accounts payable and accrued expenses as at June 30, 2010 and December 31, 2009 consist of the following:
|
June 30,
2010
|
December 31, 2009
|
|||||||
|
Accounts payable
|
$
|
60,263,557
|
$
|
2,838,860
|
||||
|
Accrued expenses
|
158,568
|
50,000
|
||||||
|
Total
|
$
|
60,422,125
|
$
|
2,888,860
|
||||
The carrying value of accounts payable and accrued expenses approximates their fair value due to the short-term nature of these obligations.
9
Note 11 – Accounts Payable - Construction Related
As of June 30, 2010 and December 31, 2009, the Company had construction payables of $30,633,675 and $45,374,656, respectively. Construction related account payable represent the cost of additions of manufacturing facilities.
Note 12 – Short-Term Bank Loans
Short-term bank loans as at June 30, 2010 and December 31, 2009 consist of the following:
|
June 30,
|
December 31,
|
|||||||
|
2010
|
2009
|
|||||||
|
On January 12, 2009, the Company obtained a loan from Bank of China,
|
||||||||
|
of which the principal was repaid in full by January 11, 2010. The interest
|
||||||||
|
was calculated using an annual fixed interest rate of 5.31% and paid quarterly.
|
||||||||
|
The loan was guaranteed by a third party entity and an individual person.
|
$
|
-
|
$
|
5,868,000
|
||||
|
On April 28, 2009, the Company obtained a loan from Bank of China,
|
||||||||
|
of which the principal was repaid in full by April 27, 2010.The interest
|
||||||||
|
is calculated using an annual fixed interest rate of 5.31% and paid quarterly.
|
||||||||
|
The loan is guaranteed by a third party entity and an individual person.
|
-
|
5,868,000
|
||||||
|
On April 28, 2009, the Company obtained a loan from Agricultural Bank of
|
||||||||
|
China, of which the principal was repaid in full by April 27, 2010.The interest
|
||||||||
|
is calculated using an annual fixed interest rate of 5.31% and paid monthly.
|
||||||||
|
The loan is guaranteed by a third party entity and two individual persons.
|
-
|
5,868,000
|
||||||
|
On May 11, 2009, the Company obtained a loan from Agricultural Bank of
|
||||||||
|
China, of which the principal was repaid in full by May 10, 2010.The interest
|
||||||||
|
is calculated using an annual fixed interest rate of 5.31% and paid monthly.
|
||||||||
|
The loan is guaranteed by a third party entity and two individual persons.
|
-
|
8,802,000
|
||||||
|
On July 15, 2009, the Company obtained a loan from Industrial and
|
||||||||
|
Commercial Bank of China, of which the principal is to be repaid in full by
|
||||||||
|
July 14, 2010.The interest is calculated using an annual fixed interest rate of
|
||||||||
|
5.31% and paid monthly. The loan is guaranteed by a third party entity.
|
1,473,000
|
1,467,000
|
||||||
|
On July 21, 2009, the Company obtained a loan from Industrial Bank Co., Ltd.,
|
||||||||
|
of which the principal is to be repaid in full by July 20, 2010. The interest is
|
||||||||
|
calculated using an annual fixed interest rate of 5.31% and paid quarterly.
|
||||||||
|
The loan is guaranteed by a third party entity.
|
-
|
6,601,500
|
||||||
|
On August 12, 2009, the Company obtained a loan from Bank of China,
|
||||||||
|
of which the principal is to be repaid in full by August 11, 2010.The interest
|
||||||||
|
is calculated using an annual fixed interest rate of 4.779% and paid quarterly.
|
||||||||
|
The loan is guaranteed by a third party entity and an individual person.
|
8,838,000
|
8,802,000
|
||||||
|
On September 1, 2009, the Company obtained a loan from Industrial and
|
||||||||
|
Commercial Bank of China, of which the principal is to be repaid in full by
|
||||||||
|
August 20, 2010. The interest is calculated using an annual fixed interest rate
|
||||||||
|
of 5.31% and paid monthly. The loan is guaranteed by a third party entity.
|
1,473,000
|
1,467,000
|
||||||
|
On September 22, 2009, the Company obtained a loan from China
|
||||||||
|
Construction Bank, of which the principal is to be repaid in full by September 21,
|
||||||||
|
2010.The interest is calculated using an annual fixed interest rate of 4.779%
|
||||||||
|
and paid monthly. The loan is guaranteed by a third party entity.
|
11,784,000
|
11,736,000
|
||||||
10
Note 12 – Short-Term Bank Loans (continued)
|
June 30,
|
December 31,
|
|||||||
|
2010
|
2009
|
|||||||
|
On September 23, 2009, the Company obtained a loan from Huaxia Bank,
|
||||||||
|
of which the principal is to be repaid in full by September 22, 2010.The interest
|
||||||||
|
is calculated using an annual fixed interest rate of 4.779% and paid quarterly.
|
||||||||
|
The loan is guaranteed by a third party entity and an individual person.
|
7,365,000
|
7,335,000
|
||||||
|
On October 29, 2009, the Company obtained a loan from Shanghai Pudong
|
||||||||
|
Development Bank, of which the principal is to be repaid in full by April 28,
|
||||||||
|
2010.The interest is calculated using an annual fixed interest rate of 4.86%
|
||||||||
|
and paid quarterly. The loan is guaranteed by a third party entity.
|
-
|
3,667,500
|
||||||
|
On November 18, 2009, the Company obtained a loan from China Merchants
|
||||||||
|
Bank, of which the principal is to be repaid in full by November 2, 2010.The
|
||||||||
|
interest is calculated using an annual fixed interest rate of 5.31% and paid
|
||||||||
|
monthly. The loan is guaranteed by a third party entity and an individual
|
||||||||
|
person.
|
2,946,000
|
2,934,000
|
||||||
|
On December 1, 2009, the Company obtained a loan from Shanghai Pudong
|
||||||||
|
Development Bank, of which the principal is to be repaid in full by May 30,
|
||||||||
|
2010.The interest is calculated using an annual fixed interest rate of 4.86%
|
||||||||
|
and paid quarterly. The loan is secured by a lien on the Company’s rights to use
|
||||||||
|
sea areas.
|
-
|
3,667,500
|
||||||
|
On December 1, 2009, the Company obtained a loan from China Merchants
|
||||||||
|
Bank, of which the principal is to be repaid in full by November 2, 2010.The
|
||||||||
|
interest is calculated using an annual fixed interest rate of 5.31% and paid
|
||||||||
|
monthly. The loan is guaranteed by a third party entity and an individual
|
||||||||
|
person.
|
5,892,000
|
5,868,000
|
||||||
|
On December 31, 2009, the Company obtained a loan from Bank of China,
|
||||||||
|
of which the principal is to be repaid in full by December 30, 2010.The interest
|
||||||||
|
is calculated using an annual fixed interest rate of 5.0445% and paid quarterly.
|
||||||||
|
The loan is guaranteed by a third party entity.
|
2,946,000
|
2,934,000
|
||||||
|
On January 5, 2010, the Company obtained a loan from Bank of China,
|
||||||||
|
of which the principal is to be repaid in full by January 4, 2011.The interest
|
||||||||
|
is calculated using an annual fixed interest rate of 5.0445% and paid quarterly.
|
||||||||
|
The loan is guaranteed by a third party entity.
|
5,892,000
|
-
|
||||||
|
On January 12, 2010, the Company obtained a loan from Shenzhen
|
||||||||
|
Development bank, of which the principal is to be repaid in full by January 11,
|
||||||||
|
2011.The interest is calculated using an annual fixed interest rate of 5.31%
|
||||||||
|
and paid monthly. The loan is guaranteed by a third party entity and an
|
||||||||
|
individual person.
|
4,419,000
|
-
|
||||||
|
On February 3, 2010, the Company obtained a loan from Bank of China,
|
||||||||
|
of which the principal is to be repaid in full by February 2, 2011.The interest
|
||||||||
|
is calculated using an annual fixed interest rate of 5.0445% and paid quarterly.
|
||||||||
|
The loan is guaranteed by a third party entity.
|
736,500
|
-
|
||||||
11
Note 12 – Short-Term Bank Loans (continued)
|
June 30,
|
December 31,
|
|||||||
|
2010
|
2009
|
|||||||
|
On April 15, 2010, the Company obtained a loan from Bank of China,
|
||||||||
|
of which the principal is to be repaid in full by April 14, 2011.The interest
|
||||||||
|
is calculated using an annual fixed interest rate of 5.0445% and paid quarterly.
|
||||||||
|
The loan is guaranteed by a third party entity and an individual person.
|
5,155,500
|
-
|
||||||
|
On April 19, 2010, the Company obtained a loan from Shanghai Pudong
|
||||||||
|
Development Bank, of which the principal is to be repaid in full by October 18,
|
||||||||
|
2010.The interest is calculated using an annual fixed interest rate of 4.86%
|
||||||||
|
and paid quarterly. The loan is guaranteed by a third party entity
|
3,682,500
|
-
|
||||||
|
On April 21, 2010, the Company obtained a loan from Agricultural Bank of
|
||||||||
|
China, of which the principal is to be repaid in full by April 20, 2011.The interest
|
||||||||
|
is calculated using an annual fixed interest rate of 5.31% and paid monthly.
|
||||||||
|
The loan is guaranteed by a third party entity.
|
5,892,000
|
-
|
||||||
|
On May 5, 2010, the Company obtained a loan from Agricultural Bank of
|
||||||||
|
China, of which the principal is to be repaid in full by May 4, 2011.The interest
|
||||||||
|
is calculated using an annual fixed interest rate of 5.31% and paid monthly.
|
||||||||
|
The loan is guaranteed by a third party entity.
|
8,838,000
|
-
|
||||||
|
On May 27, 2010, the Company obtained a loan from Shanghai Pudong
|
||||||||
|
Development Bank, of which the principal is to be repaid in full by November 26,
|
||||||||
|
2010.The interest is calculated using an annual fixed interest rate of 4.86%
|
||||||||
|
and paid quarterly. The loan is secured by a lien on the Company’s rights to use
|
||||||||
|
sea areas.
|
3,682,500
|
-
|
||||||
|
On June 28, 2010, the Company obtained a loan from Bank of Hangzhou,
|
||||||||
|
of which the principal is to be repaid in full by December 28, 2010.
|
||||||||
|
The interest is calculated using an annual fixed interest rate of 4.455% and
|
||||||||
|
Paid quarterly. The loan is guaranteed by a third party entity and an
|
||||||||
|
individual person.
|
$
|
2,946,000
|
$
|
-
|
||||
|
Total short-term bank loans
|
$
|
83,961,000
|
$
|
82,885,500
|
||||
Note 13 – Trade Notes Payable
Trade notes payable consist of non-collateralized non-interest bearing promissory notes issued in connection with the acquisition of certain inventory and equipment. Balances outstanding under the notes as of June 30, 2010 and December 31, 2009 were $19,001,700 and $13,719,134, respectively.
Note 14 – Advances from Customers
At June 30, 2010 and December 31, 2009, the Company had advances from customers of $13,562,054 and $16,549,644, respectively. As a common business practice, the Company requires certain customers to make advance payments for sales. Such advances are interest-free and unsecured.
12
Note 15 – Long-Term Debt
The Company obtained long-term bank loans for plant construction. The balances as at June 30, 2010 (unaudited) and December 31, 2009 are as follows:
|
June 30,
|
December 31,
|
|||||||
|
2010
|
2009
|
|||||||
|
On February 5, 2008, the Company obtained a loan from Bank of China,
|
||||||||
|
of which the principal is to be repaid in full by February 4, 2011. The interest
|
||||||||
|
is calculated using floating interest rate and paid quarterly. For the quarter
|
||||||||
|
ended June 30, 2010, the current interest rate is 5.4%. The loan is
|
||||||||
|
guaranteed by a third party entity and an individual person.
|
$
|
7,365,000
|
$
|
7,335,000
|
||||
|
On April 18, 2008, the Company obtained a loan from Bank of China, of which
|
||||||||
|
the principal is to be repaid in full by January 18, 2011. The interest is calculated
|
||||||||
|
using floating interest rate and paid quarterly. For the quarter ended June 30,
|
||||||||
|
2010, the current interest rate is 5.4%. The loan is guaranteed by a third party
|
||||||||
|
entity and an individual person.
|
2,946,000
|
2,934,000
|
||||||
|
On May 20, 2008, the Company obtained a loan from Industrial and
|
||||||||
|
Commercial Bank of China, of which the principal is to be repaid in full by
|
||||||||
|
December 15, 2011. The interest is calculated using floating interest rate and
|
||||||||
|
paid quarterly. For the quarter ended June 30, 2010, the current interest rate
|
||||||||
|
is 6.048%. The loan is guaranteed by a third party entity.
|
4,419,000
|
4,401,000
|
||||||
|
On August 15, 2008, the Company obtained a loan from China Construction
|
||||||||
|
Bank, of which the principal is to be repaid in full by August 14, 2012. The
|
||||||||
|
interest is calculated using floating interest rate and paid monthly. For the
|
||||||||
|
quarter ended June 30, 2010, the current interest rate is 5.76%. The loan is
|
||||||||
|
guaranteed by a third party entity and an individual person.
|
4,419,000
|
4,401,000
|
||||||
|
On September 5, 2008, the Company obtained a loan from Bank of China, of
|
||||||||
|
which the principal is to be repaid in full by January 4, 2011. The interest is
|
||||||||
|
calculated using floating interest rate and paid quarterly. For the quarter ended
|
||||||||
|
June 30, 2010, the current interest rate is 5.4%. The loan is guaranteed by
|
||||||||
|
a third party entity and an individual person.
|
2,209,500
|
2,200,500
|
||||||
|
On October 14, 2008, the Company obtained a loan from China Construction
|
||||||||
|
Bank, of which the principal is to be repaid in full by October 12, 2012. The
|
||||||||
|
interest is calculated using floating interest rate and paid monthly. For the
|
||||||||
|
quarter ended June 30, 2010, the current interest rate is 5.76%. The loan is
|
||||||||
|
guaranteed by a third party entity.
|
10,752,900
|
10,709,100
|
||||||
13
Note 15 – Long-Term Debt (continued)
|
June 30,
|
December 31,
|
|||||||
|
2010
|
2009
|
|||||||
|
On October 14, 2008, the Company obtained a loan from China Construction
|
||||||||
|
Bank, of which the principal is to be repaid in full by October 12, 2012. The
|
||||||||
|
interest is calculated using floating interest rate and paid monthly. For the
|
||||||||
|
quarter ended June 30, 2010, the current interest rate is 5.76%. The loan is
|
||||||||
|
guaranteed by a third party entity.
|
883,800
|
880,200
|
||||||
|
On October 15, 2008, the Company obtained a loan from China Construction
|
||||||||
|
Bank, of which the principal is to be repaid in full by September 28, 2012. The
|
||||||||
|
interest is calculated using floating interest rate and paid monthly. For the
|
||||||||
|
quarter ended June 30, 2010, the current interest rate is 5.76%. The loan is
|
||||||||
|
secured by a lien on the Company’s property and equipment.
|
3,093,300
|
3,080,700
|
||||||
|
On October 15, 2008, the Company obtained a loan from Industrial and
|
||||||||
|
Commercial Bank of China in the amount of $6,894,900, $5,427,900 of which
|
||||||||
|
is to be repaid in full by October 15, 2010, and $1,467,000 of which is to be
repaid
|
||||||||
|
in full by November 15, 2011. The interest is calculated using floating interest
|
||||||||
|
rate and paid quarterly. For the quarter ended June 30, 2010, the current
|
||||||||
|
average interest rate is 5.76%. The loan is secured by a lien on the Company’s
|
||||||||
|
property and equipment and guaranteed by a third party entity.
|
5,450,100
|
6,894,900
|
||||||
|
On November 21, 2008, the Company obtained a loan from Bank of China,
|
||||||||
|
of which the principal is to be repaid in full by December 20, 2010. The interest
|
||||||||
|
is calculated using floating interest rate and paid quarterly. For the quarter
|
||||||||
|
ended June 30, 2010, the current interest rate is 5.4%. The loan is
|
||||||||
|
guaranteed by a third party entity and an individual person.
|
2,209,500
|
2,200,500
|
||||||
|
Total
|
$
|
43,748,100
|
$
|
45,036,900
|
||||
|
Less: Current portion
|
20,180,100
|
7,628,400
|
||||||
|
Total long-term bank loans
|
$
|
23,568,000
|
$
|
37,408,500
|
||||
Note 16 – Income Taxes
The Company is a Nevada corporation and conducts all of its business through its Chinese subsidiary and its affiliated Chinese operating companies. All business is conducted in PRC. As the U.S. holding company has not recorded any income for the six months ended June 30, 2010 and 2009, there was no provision or benefit for U.S. income tax purpose.
Keyuan International was incorporated in the British Virgin Islands. Under the laws of British Virgin Islands, the Company is not subject to tax on income or capital gain.
The Company’s Chinese subsidiary and affiliated operating companies based in China are governed by the Income Tax Law of the PRC concerning the privately-run enterprises, which are subject to a statutory tax rate of 25% and were, until December 2007, subject to a statutory tax rate of 33% (30% state income tax plus 3% local income tax) on income reported in the statutory statements after appropriate adjustments for tax purposes.
14
Note 16 – Income Taxes (continued)
On March 16, 2007, the National People’s Congress of China approved the Corporate Income Tax Law of the PRC (the New CIT Law), which became effective on January 1, 2008. Under the new law, the applicable corporate income tax rate to all Companies, both domestic and foreign-invested companies, is 25% replacing the previous applicable tax rate of 33%.
On February 22, 2008, the Ministry of Finance (“MOF”) and the State Administration of Taxation (“SAT”) jointly issued Cai Shui [2008] Circular 1 (“Circular 1”). According to Article 4 of Circular 1, distributions of accumulated profits earned by a Foreign Invested Enterprise (“FIE”) prior to January 1, 2008 to foreign investor(s) in 2008 or after will be exempt from withholding tax (“WHT”) while distribution of the profit earned by an FIE after January 1, 2008 to its foreign investor(s) shall be subject to WHT.
Note 17 – Risk Factors
The Company's operations are carried out in the PRC. Accordingly, the Company's business, financial condition and results of operations may be influenced by the political, economic and legal environment in the PRC. The Company's business may also be influenced by changes in governmental policies with respect to laws and regulations, anti-inflationary measures, currency conversion and remittance abroad, and rates and methods of taxation, among other things.
Note 18 – Concentrations of Credit Risk
For the six months ended June 30, 2010, five vendors accounted for approximately 78.55% of the Company’s raw materials purchase. Purchases from these vendors amounted to $184.25 million. The sales to the Company’s top five customers amounted to $116.94 million and accounted for approximately 46.89% of the Company's total sales.
Financial instruments which potentially subject the Company to credit risk consist principally of cash on deposit with financial institutions. Management believes that minimal credit risk exists with respect to these investments as management believes that the financial institutions that hold the Company’s cash and cash equivalents and restricted cash are financially sound.
15
Note 19 – Supplemental Cash Flow Disclosures
|
For the Six Months Ended June 30,
|
||||||||
|
2010
|
2009
|
|||||||
|
Cash paid for interest
|
$
|
2,725,817
|
$
|
286,665
|
||||
|
Cash paid for income taxes
|
$
|
-
|
$
|
-
|
||||
Note 20 – Earnings Per Share
The Company presents earnings per share (“EPS”) on a basic and diluted basis. Basic earnings per share have been computed by dividing income available to common shareholders by the weighted average number of common shares outstanding. Diluted earnings per share have been computed by dividing income available to common shareholders by the weighted average number of shares outstanding including the dilutive effect of equity securities. All share and per share data have been adjusted retroactively to reflect the recapitalization of the Company pursuant to the Securities Exchange Agreement with Silver Pearl.
|
For the Three Months
Ended June 30,
|
||||||||
|
2010
|
2009
|
|||||||
|
Basic earnings (loss) per share
|
||||||||
|
Net income (loss) attributable to stockholders
|
$ | 4,198,663 | $ | (841,408 | ) | |||
|
Fixed dividends to Series A convertible preferred stockholders
|
288,497 | - | ||||||
|
Net income (loss) attributable to common stockholders
|
$ | 3,910,166 | $ | (841,408 | ) | |||
|
Denominator (weighted-average):
|
||||||||
|
- Common stock
|
2,387,451 | |||||||
|
- Series M convertible preferred stocks
|
47,658 | |||||||
|
Allocation of undistributed income/ (loss):
|
||||||||
|
- Common stock
|
186,537 | |||||||
|
- Series M convertible preferred stocks
|
3,723,629 | |||||||
|
Basic net income/ (loss) per share:
|
||||||||
|
- Common stock
|
$ | 0.08 | ||||||
|
- Series M convertible preferred stocks
|
$ | 78.13 | ||||||
|
Diluted earnings (loss) per share
|
||||||||
|
Denominator (weighted-average):
|
||||||||
|
- Common stock (including 4,885,208 dilutive potential stocks
|
||||||||
|
for the three months ended June 30, 2010)
|
7,272,660 | |||||||
|
- Series M convertible preferred stocks
|
47,658 | |||||||
|
Allocation of undistributed income/ (loss):
|
||||||||
|
- Common stock
|
555,891 | |||||||
|
- Series M convertible preferred stocks
|
3,642,772 | |||||||
|
Diluted net income/ (loss) per share:
|
||||||||
|
- Common stock
|
$ | 0.08 | ||||||
|
- Series M convertible preferred stocks
|
$ | 76.44 | ||||||
16
| For the Six Months Ended June 30, | ||||||||
| 2010 | 2009 | |||||||
|
Basic earnings (loss) per share
|
||||||||
|
Net income (loss) attributable to stockholders
|
$ | 9,253,821 | $ | (1,223,008 | ) | |||
|
Fixed dividends to Series A convertible preferred stockholders
|
288,497 | - | ||||||
|
Net income (loss) attributable to common stockholders
|
$ | 8,965,324 | $ | (1,223,008 | ) | |||
|
Denominator (weighted-average):
|
||||||||
|
- Common stock
|
1,200,321 | |||||||
|
- Series M convertible preferred stocks
|
47,658 | |||||||
|
Allocation of undistributed income/ (loss):
|
||||||||
|
- Common stock
|
220,255 | |||||||
|
- Series M convertible preferred stocks
|
8,745,069 | |||||||
|
Basic net income/ (loss) per share:
|
||||||||
|
- Common stock
|
$ | 0.18 | ||||||
|
- Series M convertible preferred stocks
|
$ | 183.50 | ||||||
|
Diluted earnings (loss) per share
|
||||||||
|
Denominator (weighted-average):
|
||||||||
|
- Common stock (including 2,456,099 dilutive potential stocks
|
||||||||
|
for the six months ended June 30, 2010)
|
3,656,420 | |||||||
|
- Series M convertible preferred stocks
|
47,658 | |||||||
|
Allocation of undistributed income/ (loss):
|
||||||||
|
- Common stock
|
659,383 | |||||||
|
- Series M convertible preferred stocks
|
8,594,438 | |||||||
|
Diluted net income/ (loss) per share:
|
||||||||
|
- Common stock
|
$ | 0.18 | ||||||
|
- Series M convertible preferred stocks
|
$ | 180.34 | ||||||
17
Note 21 – Share Exchange and Private Financing
Share Exchange
On April 22, 2010, the Company (formerly known as “Silver Pearl”) entered into a Share Exchange Agreement (the “Exchange Agreement”) with Keyuan International ( a company organized under the laws of the British Virgin Islands) and shareholders of the Company and Keyuan International. Pursuant to the terms of the Exchange Agreement, the Keyuan International’s shareholders transferred to the Company all of the issued and outstanding shares of Keyuan International in exchange for the issuance of 47,658 shares of the Company’s Series M preferred stock (the “Series M Preferred Stock”), par value $0.001 per share (the “Share Exchange”).
Prior to the Share Exchange, Silver Pearl had 5,696,800 shares of common stock issued and outstanding. Immediately prior to the Share Exchange, 3,264,000 shares of Silver Pearl’s common stock then outstanding were cancelled and retired, so that immediately after the Share Exchange Silver Pearl had 2,432,800 common shares and 47,658 Series M shares issued and outstanding. The Series M shares vote with the common stock on an as converted basis and are convertible into 47,658,000 shares of common stock upon the Company’s shareholders approving an increase in authorized common stock to at least 100,000,000 shares. The Company also deposited $400,000 into an escrow account which amount was paid to an owner of the cancelled shares of Silver Pearl, as a result of the Share Exchange having been consummated.
The Share Exchange resulted in a change-in-control of Silver Pearl as the Company’s shareholders have acquired the majority ownership of the combined entity.
In accordance with the Accounting and Financial Reporting Interpretations and Guidance issued by the staff of the U.S. Securities and Exchange Commission (the “SEC”), the Share Exchange will be accounted for as a reverse acquisition whereby Silver Pearl (the legal acquirer) is considered the accounting acquiree and the Keyuan International (the legal acquiree) is considered the accounting acquirer. The consolidated financial statements of the combined entity will be in substance those of the Keyuan International’s, with the assets and liabilities, and revenues and expenses, of Silver Pearl being included effective from the date of consummation of the Share Exchange. Silver Pearl will be deemed to be a continuation of the Company’s business. The outstanding stock of Silver Pearl prior to the Share Exchange will be accounted for at their net book value with no goodwill being recognized.
April --May Private Placement
On April 22, 2010, immediately following the Share Exchange mentioned above, and on May 18, 2010, the Company completed a private placement transactions (the “Private Placement”) pursuant to a securities purchase agreement with certain investors (collectively, the “Investors”) and sold 748,704 units (the “Units”) at a purchase price of $35 per Unit, consisting of, in the aggregate, (a) 6,738,336 shares of Series A convertible preferred stock, par value $0.001 per share (the “Series A Preferred Stock”) convertible into the same number of shares of Common Stock, (b) 748,704 shares of Common Stock (the “Issued Common Shares”), (c) three-year Series A Warrants (the “Series A Warrants”) to purchase up to 748,704 shares of Common Stock, at an exercise price of $4.50 per share (the “Series A Warrant Shares”) for a three-year period, and (d) three-year Series B Warrants (the “Series B Warrants” and, together with the Series A Warrants, the “Warrants”) to purchase up to 748,704 shares of Common Stock, at an exercise price of $5.25 per share (the “Series B Warrant Shares” and, together with the Series A Warrant Shares, the “Warrant Shares”) for a three-year period. The Company received aggregate gross proceeds of approximately $26.2 million from the Private Placement (the “Private Placement”, or sometimes is referred herein as the “Offering”).
18
Note 21 – Share Exchange and Private Financing (continued)
The Company raised aggregate gross proceeds of approximately $26.2 million in the Offering.
In conjunction with the Private Placement, the Company also entered into the following agreements:
|
|
A registration rights agreement (the “Registration Rights Agreement”) with the investors, in which we agreed to file this registration statement (the “Registration Statement”) with the SEC to register for resale the Shares, the Common Stock issuable upon conversion of the Series A Preferred Stock, the Series A Warrant Shares and the Series B Warrant Shares, within 30 calendar days of the Closing Date, and to have this registration statement declared effective within 150 calendar days of the Closing Date or within 180 calendar days of the Closing Date in the event of a full review of the registration statement by the SEC.
|
|
·
|
A securities escrow agreement with the Investors (the “Securities Escrow Agreement”), pursuant to which, we delivered into an escrow account 5,000 shares of our Series M Preferred Stock convertible into 5,000,000 shares of Common Stock to be used as escrow shares (the “Escrow Shares”) after we amend our Articles of Incorporation to increase our authorized Common Stock to one hundred million (100,000,000) shares. With respect to the 2010 performance year, if we achieve less than 95% of the 2010 performance threshold, then the Escrow Shares for such year will be delivered to the investors in the amount of 500,000 shares of Common Stock.
|
|
·
|
Stock for each full percentage point by which such threshold was not achieved up to a maximum of 5,000,000 shares of Common Stock.
|
|
·
|
On the Closing Date, we and the Keyuan International Shareholder, entered into a lock-up agreement whereby Keyuan International is prohibited from selling our securities until six (6) months after the effective date of the registration statement required to be filed under the Registration Rights Agreement. For one (1) year thereafter, it will be permitted to sell up to 1/12 of its initial holdings every month.
|
Note 22 – Accounting for Series A Financing
Private Placement
Please refer to description of April-May Private Placement in Note 21 above.
Preferred Stock
The Board is authorized, without further action by the shareholders, to issue, from time to time, up to 20,000,000 shares of preferred stock in one or more classes or series. Similarly, the Board will be authorized to fix or alter the designations, powers, preferences, and the number of shares which constitute each such class or series of preferred stock. Such designations, powers or preferences may include, without limitation, dividend rights (and whether dividends are cumulative), conversion rights, if any, voting rights (including the number of votes, if any, per share), redemption rights (including sinking fund provisions, if any), and liquidation preferences of any unissued shares or wholly unissued series of preferred stock. As of the date hereof, the Board has designated two classes of Preferred Stock, consisting of Series M Preferred Stock and Series A Preferred Stock and does not have any current intention to designate any other class of preferred stock.
Series A Preferred Stock
As of the date hereof, we have 6,738,336 shares of Series A Preferred Stock issued and outstanding. The Series A Preferred Shares by its principal terms:
|
(a)
|
pay a cumulative dividend at an annual rate of 6%, payable quarterly, at our option, in cash or in shares of Common Stock;
|
|
(b)
|
have a preference over the Common Stock on liquidation, dissolution or winding up of the Company equal to the original purchase price per Series A Preferred Share;
|
|
(c)
|
be convertible at any time after issuance, at the option of the holder, into shares of Common Stock, without the payment of additional consideration, at an initial conversion ratio of one-to-one (subject to anti-dilution adjustment);
|
|
(d)
|
automatically convert into shares of Common Stock at $3.50 per share, at the earlier to occur of the following: (i) the twenty four (24) month anniversary of the Closing of the Private Placement, and (ii) at such time that the Volume Weighted Average Price (“VWAP”) of the Common Stock is no less than $5.00 for a period of ten (10) consecutive trading days with the daily volume of the Common Stock equal to at least 50,000 shares per day;
|
19
|
(e)
|
the conversion price and the number of common shares underlying the Series A Preferred Stock are subject to customary adjustments, including weighted average broad-based anti-dilution protection for a period of twelve (12) months after the effective date of this registration statement; and
|
|
(f)
|
requires that we, prior to taking certain corporate actions (including certain issuances or redemptions of its securities or changes in its organizational documents), obtain the approval of more than 50% of the Series A Preferred Shares then issued and outstanding, voting as a group.
|
The Series A Warrants
As of the date hereof, there are 808,600 Series A Warrants issued and outstanding, including 59,896 warrants issued to the placement agent in the Private Placement. The Series A Warrants will, by its principal terms,
|
(a)
|
entitle the holder to purchase one (1) share of Common Stock;
|
|
(b)
|
be exercisable at any time after the consummation of the Private Placement and shall expire on the date that is three (3) years following the original issuance date of the Series A Warrants;
|
|
(c)
|
be exercisable, in whole or in part, at an exercise price of $4.50 per share;
|
|
(d)
|
be exercised only for cash (except that there will be a cashless exercise option at any time during which a registration statement covering such shares is not effective); and
|
|
(e)
|
be callable at $0.01 by us following the date that the VWAP of the Common Stock equals or exceeds $9.00 for fifteen (15) consecutive trading days with the average daily trading volume of no less than 75,000 shares.
|
The Series B Warrants
As of the date hereof, there are 808,600 Series B Warrants issued and outstanding, including 59,896 warrants issued to the placement agent in the Private Placement. The Series B Warrants will, by its principal terms,
|
(a)
|
entitle the holder to purchase one (1) share of Common Stock;
|
|
(b)
|
be exercisable at any time after consummation of the Private Placement and shall expire on the date that is three (3) years following the original issuance date of the Series B Warrants;
|
|
(c)
|
be exercisable, in whole or in part, at an exercise price of $5.25 per share;
|
|
(d)
|
be exercised only for cash (except that there will be a cashless exercise option at any time during which registration statement covering such shares is not effective); and
|
|
(e)
|
be callable at $0.01 by us following the date that the VWAP of the Common Stock equals or exceeds $10.50 for fifteen (15) consecutive trading days with the average daily trading volume of no less than 75,000 shares.
|
Registration Rights Agreement
In connection with the Private Placement, we also entered into a registration rights agreement with the investors, in which we agreed to file this registration statement with the SEC to register for resale the Shares, the Common Stock issuable upon conversion of the Series A Preferred Stock, the Series A Warrant Shares and the Series B Warrant Shares, within 30 calendar days of April 22, 2010 and to have this registration statement declared effective within 150 calendar days of April 22, 2010 or within 180 calendar days of April 22, 2010 in the event of a full review of the registration statement by the SEC (the “PRA”). If we do not comply with the foregoing obligations under the Registration Rights Agreement, we will be required to pay cash liquidated damages to each investor, at the rate of 1% of the applicable subscription amount for each 30 day period in which we are not in compliance; provided, that such liquidated damages will be capped at 10% of the subscription amount of each investor and will not apply to any registrable securities that may be sold pursuant to Rule 144 under the Securities Act if all of the conditions in Rule 144(i)(2) are satisfied at the time of the proposed sale, or are subject to an SEC comment with respect to Rule 415 promulgated under the Securities Act.
The Company evaluated the contingent obligation related to the RRA liquidated damages in accordance to “ASC Topic 825 “Financial Instruments” subtopic 20” (formerly Financial Accounting Standards Board Staff Position No. EITF 00-19-2“Accounting for Registration Payment Arrangements”), which required the contingent obligation to make future payments or otherwise transfer consideration under a registration payment arrangement, whether issued as a separate agreement or included as a provision of a financial instrument or other agreement be separately recognized and measured in accordance with “ASC Topic 450” “Contingencies” (formerly SFAS No. 5, “Accounting for Contingencies”). The Company concluded that such obligation was not probable to incur based on the best information and facts available as of June 30, 2010. Therefore, no contingent obligation related to the RRA liquidated damages was recognized as of June 30, 2010.
20
Escrowed Shares Arrangement
In conjunction with the Private Placement, the Company also entered into a make good escrow agreement with the Investors (the “Securities Escrow Agreement”), pursuant to which Keyuan Plastics Co, Ltd, delivered into an escrow account 5,000 shares of Series M Perferred Stock that are convertible into 5,000,000 shares of Common Stock (the “Escrow Shares”) to be used as a share escrow for the achievement of a Fiscal Year 2010 net income performance threshold of $33.0 million. With respect to the 2010 performance year, if the Company achieves less than 95% of the 2010 performance threshold, then the Escrow Shares for such year will be delivered to the Investors in the amount of 500,000 common shares (rounded up to the nearest whole share and pro rata based on the number of shares of Series A Preferred Stock owned by such Investor at such date) for each full percentage point by which such threshold was not achieved up to a maximum of 5,000,000 common shares. Any Escrow Shares not delivered to any Investor because such Investor no longer holds shares of Series A Preferred Stock or Conversion Shares, or because the 2010 performance threshold was met, shall be returned to the Principal Stockholder.
For the purposes of the Securities Escrow Agreement, net income is defined in accordance with US GAAP and reported by the Company in the audited financial statements for fiscal year ended 2010; provided, however, that net income for fiscal year ended 2010 shall be increased by any non-cash charges incurred (i) as a result of the Private Placement, including without limitation, as a result of the issuance and/or conversion of the Series A Preferred Stock, and the issuance and/or exercise of the Warrants, (ii) as a result of the release of the Escrow Shares to the Principal Stockholder and/or the Investors, as applicable, pursuant to the terms of the Securities Escrow Agreement, (iii) as a result of the issuance of ordinary shares of the Principal Stockholder to its PRC shareholders, upon the exercise of options granted to such PRC shareholders by the Principal Stockholder, as of the date of the Securities Escrow Agreement, (iv) as a result of the issuance of Warrants to any placement agent and its designees in connection with the Private Placement, (v) the exercise of any Warrants to purchase Common Stock outstanding and (vi) the issuance under any performance based equity incentive plan that the Company adopt. Net income will also be increased to adjust for any cash or non-cash charges resulting from the payment of dividends on the Series A Preferred Stock in connection with the Private Placement.
The Company has evaluated the terms of the Securities Escrow Agreement based on the guidance provided in ASC 718-10-S99. The Company concluded that because the escrowed shares would be released to the Company’s principal stockholder or distributed to the investors without regard to the continued employment of any of the Company’s directors of officers, the Securities Escrow Agreement is in substance an inducement to facilitate the private placement, rather than as compensatory arrangement. As such, the Securities Escrow Agreement has accounted for the escrowed share arrangement according to its nature and reflected it as a reduction of the proceeds allocated to the newly issued securities in the Private Placement, based on the aggregate fair value of 5,000,000 shares of common stock at April 22, 2010.
Allocation of Proceeds in the Private Placement
In accordance with the guidance provided in ASC 470-20-30, the Company has first allocated the proceeds from the Private Placement between the Issued Common Shares, the Series A Preferred Stock and Series A and B Warrants proportionately based on their estimated fair values as of the closing date of the Private Placement. Then the guidance provided in ASC 470-20-30-5 has been applied to the amount allocated to the convertible Series A Preferred Stock, and the effective conversion price has been used, to measure the intrinsic value, if any, of the embedded conversion option.
The Company’s common stock was not publicly traded before and as of the closing date of the Private Placement and traded infrequently before the second closing on May 18, 2010. In general, fair value is based on independent sources such as quoted market prices or dealer price quotations. To the extent certain financial instruments trade infrequently or are non-marketable securities, they may not have readily determinable fair values. The Company estimated the fair value of the Warrants, Series A preferred stock and restricted common stock using various pricing models and available information that management deems most relevant. Among the factors considered in determining the fair value of financial instruments are discounted anticipated cash flows, the cost, terms and liquidity of the instrument, the financial condition, operating results and credit ratings of the issuer or underlying company, the quoted market price of similar traded securities, and other factors generally pertinent to the valuation of financial instruments.
The following table sets out the allocation of the proceeds from the April 22, 2010 Private Placement:
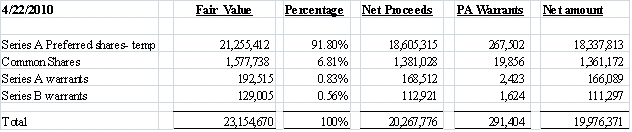
21
The following table sets out the allocation of the proceeds from the May 18, 2010 Private Placement:

Accounting for the Series A Preferred Stock
The Series A preferred stock has been classified as temporary equity as there was no redemption provision at the option of the holders that is not within the control the Company on or after an agreed upon date. The Company evaluated the embedded conversion feature in its Series A preferred stock to determine if there was an embedded derivative requiring bifurcation. The Company concluded that the embedded conversion feature of the Series A preferred stock does not required to be bifurcated because the conversion feature is clearly and closely related to the host instrument.
Equity instruments that contain a beneficial conversion feature are recorded as a deemed dividend to the holders of the convertible equity instruments. The deemed dividend associated with the beneficial conversion is calculated as the difference between the fair value of the underlying common stock less the proceeds that have been received for the equity instrument limited to the value received. The beneficial conversion amount is recorded as a reduction on the carrying value of the equity instrument and an increase to additional paid-in-capital.
The Series A convertible preferred stock is redeemable at the option of its holders simultaneously with the occurrence of the following events:
|
-
|
Merger or consolidation where the holders of the Company’s outstanding voting securities prior to such merger or consolidation do not own over 50%of the outstanding voting securities of the merged or consolidated entity immediately after such merger or consolidation; or the sale of all or substantially all of the Company’s properties or assets (collectively, an “Organic Change”).
|
Management considers the occurrence of the Organic Change is solely within the control of the Company.
Management evaluated the terms and conditions of the embedded conversion features based on the guidance of ASC 815-15-25-1 (formerly SFAS 133, paragraph 12) to determine if there was an embedded derivative requiring bifurcation. An embedded derivative instrument (such as a conversion option embedded in the Convertible Preferred Stock) must be bifurcated from its host instruments and accounted for separately as a derivative instrument only if the “risks and rewards” of the embedded derivative instrument are not “clearly and closely related” to the risks and rewards of the host instrument in which it is embedded. Management concluded that the embedded conversion feature of the preferred stock was not required to be bifurcated because the conversion feature is clearly and closely related to the host instrument, and because the Company’s limited trading volume that indicates the feature is not readily convertible to cash in accordance with ASC 815-10, “Derivatives and Hedging”.
Series A convertible preferred stock is convertible on the issuance dates. Management compared the effective conversion prices of the Series A convertible preferred stock and the estimated fair values of the Company’s common stock as of April 22, 2010 and May 18, 2010 as follows:
|
Effective initial conversion price of
|
||||||||||||
|
Series A convertible preferred stock
|
Fair value of the common stock #
|
Intrinsic value per each share of the Series A preferred stock
|
||||||||||
|
April 22, 2010
|
$ | 3.57 | $ | 2.38 | $ | - | ||||||
|
May 18, 2010
|
$ | 3.49 | $ | 2.79 | $ | - | ||||||
#: The fair value of the common stock on April 22, 2010 and May 18, 2010 was estimated based on independent source to a valuation form engaged by the Company.
Management determined that there was no beneficial conversion features for the Series A and Series B convertible preferred stocks because the effective conversion price is equal to or higher than the fair value at the date of issuance.
The significant terms of the Series A convertible preferred stock are as follows:
22
Conversion
At any time on or after the issuance date, the holders of Series A convertible preferred stock may convert any shares of Series A convertible preferred stock into a number of the Company’s common stock equal to the quotient of $3.50 per share of the Series A convertible preferred stock, plus any accrued but unpaid dividend, divided by the then conversion price.
The initial conversion price per share is $3.50 for the Series A convertible preferred stock, which is subject to certain anti-dilutive conversion price adjustments.
The Series A convertible preferred stock shall be automatically converted into common stock (in the same conversion equivalence as described above) at the earlier occurrence of 1) the 24 month anniversary of the issuance dates of the Series A convertible preferred stock; and 2) at such time that the volume weighted average price (“VWAP”) of the Company’s common stock is no less than $5.00 for a period of ten consecutive trading days with the daily volume of the Company’s common stock of at least 50,000 shares per day.
Voting Rights
The Series A convertible preferred stock shall have no voting rights with the common stock or other equity securities of the Company other than a couple of class voting rights on matters that will affect the rights of the stockholders of Series A convertible preferred stock.
Dividends
Fixed dividends, based on the following pre-determined formula, will be accrued and cumulative from and after the date of the initial issuance of the Series A convertible preferred stock, which are payable on a quarterly basis.
- Annual dividends are determined as 6% of $3.5 for each share of the Series A convertible preferred stock.
Accounting for the Series A and Series B Warrants
The Company has evaluated the terms of the Series A and B Warrants issued in the Private Placement with reference to the guidance provided in ASC 815-40-15. The Company has concluded that the Series A and B Warrants are indexed to the Company’s own stock, because the warrants have no contingent exercise provision and have fixed strike prices which are only subject to adjustments in the event of stock split, combinations, dividends, mergers or other customary corporate events. Therefore, the Series A and B Warrants have been classified as equity.
Accounting for Placement Agent Warrants
In accordance with ASC Topic 340 subtopic 10 section S99-1 (formerly Staff Accounting Bulletin Topic 5.A: “Miscellaneous Accounting-Expenses of Offering”), “specific incremental costs directly attributable to a proposed or actual offering of securities may properly be deferred and charged against the gross proceeds of the offering.” In accordance with the SEC accounting and reporting manual “cost of issuing equity securities are charged directly to equity as deduction of the fair value assigned to share issued.” Accordingly, the Company concluded that the warrants issued to the placement agents are directly attributable to the August 2009 financing. If the Company had not issued the warrants to the placement agent, the Company would have had to pay the same amount of cash as the fair value. Therefore, the Company deducted the total fair value of the Placement agent warrants as of the Commitment Date which was approximately US$291,000 and $58,000 for the April 22nd and May 18th private placements as a deduction of the fair value assigned to the Series A preferred stock for each respectively closing.
Note 23 – Share-based Compensations
On April 19, 2010, the Group issued 88,000 shares of common stock to Hayden Communications International, for the investor related services they will provide for a 12 months period. All the shares vested immediately after the signature of the agreement. The related expense was $41,314 for the six months ended June 30, 2010.
On April 19, 2010, the Group issued 48,000 shares of common stock to Chesapeake Group, Inc, for the investor related services they will provide in a period of 12 months. The related expense was $53,760 for the six months ended June 30, 2010.
On April 19, 2010, the Group issued 50,000 shares of common stock to Hampton Growth Resources, LLC, for the investor related services they will provide for a 12 months period. The related expense was $29,750 for the six months ended June 30, 2010.
23
On June 30, 2010, the Company granted 3,000,000 five-year options to its 56 CEO, CFO and various members of senior management and key employees to purchase in the aggregate 3,000,000 shares of the Company’s common stock at an exercise price of US$4.20 per share, in consideration of their services to the Company. 2,810,000 of these 3,000,000 options shall vest according to the following vesting schedule: 30% of the Options shall vest immediately after one year of the issuance, 40% of the Options shall vest immediately after two years of the issuance, 30% of the Options shall vest immediately after three years of the issuance. The remaining 190,000 options shall vest according to the following vesting schedule: 40% of the Options shall vest immediately after one year of the issuance and 60% of the Options shall vest immediately after two years of the issuance.
24
The grant date fair value of these options was US$3.347 million. The Company estimates the fair value of these options using the Black-Scholes option pricing model with the following assumptions: an expected life equal to the contractual term of the options (five), underlying stock price of $3.21 per share, no dividends, a risk free rate of 1.79%, which is a five-year yield on Treasury bonds at constant (or fixed) maturity and volatility of 47%. The expected volatility is calculated using historical data obtained from comparable public companies due to lack of liquidity of the Company’s underlying stock. Exercise price of the option is the contractual exercise price of the option.
Stock option activity during the period ending June 30, 2010 (unaudited), was as follows:
|
Number of options
|
Weighted Average Exercise Price
|
|||||||
|
Outstanding, December 31, 2010
|
-
|
-
|
||||||
|
Granted
|
3,000,000
|
$
|
4.20
|
|||||
|
Exercised
|
-
|
-
|
||||||
|
Forfeited
|
-
|
-
|
||||||
|
Expired
|
-
|
-
|
||||||
|
Outstanding, June 30, 2010
|
3,000,000
|
$
|
4.20
|
|||||
|
Exercisable, June 30, 2010
|
-
|
$
|
-
|
|||||
At June 30, 2010, none of the options were exercisable and all 3,000,000 shares will expire on June 29, 2015.
Warrant activity during the period ending June 30, 2010 was as follows:
|
Number of Warrants
|
Weighted Average Exercise Price
|
|||||||
|
Outstanding, December 31, 2010
|
--
|
--
|
||||||
|
Granted
|
2,216,163
|
4.50
|
||||||
|
Exercised
|
--
|
--
|
||||||
|
Forfeited
|
--
|
--
|
||||||
|
Expired
|
--
|
--
|
||||||
|
Outstanding, June 30, 2010
|
2,216,163
|
$
|
4.50
|
|||||
|
Exercisable, June 30, 2010
|
2,216,163
|
$
|
4.50
|
|||||
Note 24 – Restatement of Income Taxes, Earnings Per Share, and Reclassification of Series Preferred Shares
In order to support the growth of certain local enterprises, the local government granted Keyuan Plastics Co. tax benefits. In the first two profitable years, the local government will credit back to the Company the entire local portion of the income tax which equals to 40% of the whole Enterprise Income Tax the Company paid. Originally, management recognized this tax benefit as a tax credit at the period in which the enterprise income was generated. Thereby, resulting an effective tax rate of 15%. After additional review and consideration, management now believes it is more appropriate to recognize the tax benefit as other income when we receive from the government. Accordingly, our effective estimated tax rate is now 25% and this preferential tax treatment is no accounted for as other income when it is received.
47,658 Series M preferred shares can be converted into 47,658,000 common shares when elected. Originally, management did not include these shares in the calculation of basic earnings per share. Following additional review and analysis, management now considered these shares to be participating securities under the two-class accounting method. As such, we have revised our calculation of basic earnings per share to include the Series M preferred shares.
Management’s initial review of its Series A preferred stock concluded that stock was permanent equity since we believe that there was no redemption provision at the option of the holders that is not within the control on the Company on or after the agreed upon date. However, following addition consideration and review, management has not concluded that as a result of certain merger and acquisition activity there exists one potential situation where a redemption provision could occur that is outside the control of the Company. Accordingly, the Series A preferred stock has now been classified as temporary equity. Originally we accrued the 2nd quarter dividend for Series A shareholders in the 3rd quarter. We have revised to accrue the 2nd quarter dividend in the same quarter.
25
The effect of restatement is as follows:
Consolidated Balance Sheet
(Unaudited)
|
Before Restated
|
After Restated
|
Effect of Change | ||||||||||
|
Current assets:
|
||||||||||||
|
Cash and cash equivalents
|
$
|
5,522,675
|
$
|
5,522,675
|
||||||||
|
Restricted cash
|
33,808,001
|
33,808,001
|
||||||||||
|
Trade notes receivable
|
10,338,534
|
10,338,534
|
||||||||||
|
Inventories
|
67,500,925
|
67,500,925
|
||||||||||
|
Advance payments
|
13,663,490
|
13,663,490
|
||||||||||
|
Prepaid tax expense
|
26,555,299
|
26,555,299
|
||||||||||
|
Due from unrelated parties
|
-
|
-
|
||||||||||
|
Deferred tax assets
|
1,578,274
|
296,335
|
(1,281,939
|
) | ||||||||
|
Other current assets
|
476,672
|
476,672
|
||||||||||
|
Total current assets
|
159,443,870
|
158,161,931
|
(1,281,939
|
) | ||||||||
|
Property, plant and equipment, net
|
130,367,038
|
130,367,038
|
||||||||||
|
Other assets
|
||||||||||||
|
Intangible assets, net
|
6,408,044
|
6,408,044
|
||||||||||
|
Total assets
|
$
|
296,218,952
|
$
|
294,937,013
|
(1,281,939
|
) | ||||||
|
Liabilities
|
||||||||||||
|
Current liabilities:
|
||||||||||||
|
Accounts payable – trade and accrued expenses
|
$
|
60,422,125
|
$
|
60,422,125
|
||||||||
|
Accounts payable – construction related
|
30,633,675
|
30,633,675
|
||||||||||
|
Short-term bank loans
|
83,961,000
|
83,961,000
|
||||||||||
|
Current portion of long-term debt
|
20,180,100
|
20,180,100
|
||||||||||
|
Trade notes payable
|
19,001,700
|
19,001,700
|
||||||||||
|
Advance from customers
|
13,526,054
|
13,526,054
|
||||||||||
|
Due to former shareholder
|
-
|
-
|
||||||||||
|
Due to unrelated parties
|
-
|
-
|
||||||||||
|
Dividend payable
|
288,497
|
288,497
|
||||||||||
|
Other current liabilities
|
311,718
|
311,718
|
||||||||||
|
Total current liabilities
|
228,036,372
|
228,324,869
|
288,497
|
|||||||||
|
Long-term debt
|
23,568,000
|
23,568,000
|
||||||||||
|
Total liabilities
|
251,604,372
|
251,892,869
|
288,497
|
|||||||||
|
Equity
|
||||||||||||
|
Temporary Equity:
|
||||||||||||
|
Series A convertible preferred stock,
|
||||||||||||
|
$0.001 par value, 20,000,000 shares authorized,
|
||||||||||||
|
6,738,336 shares issued and outstanding at June 30, 2010
|
-
|
21,018,143
|
21,018,143
|
|||||||||
|
Stockholders’ equity:
|
||||||||||||
|
Series A preferred stock, $0.001 par value, 20,000,000 shares
|
||||||||||||
|
authorized, 6,738,336 shares issued and outstanding at
|
||||||||||||
|
June 30, 2010
|
6,738
|
-
|
(6,738
|
) | ||||||||
|
Series M preferred stock, $0.001 par value, 47,658 shares
|
||||||||||||
|
authorized, issued and outstanding at June 30, 2010
|
48
|
48
|
||||||||||
|
Common stock, $0.001 par value, 50,000,000 shares authorized,
|
||||||||||||
|
3,181,504 issued and outstanding at June 30,2010
|
3,182
|
3,182
|
||||||||||
|
Additional paid-in capital
|
43,352,118
|
22,465,537
|
(20,886,581
|
) | ||||||||
|
Accumulated deficit
|
(9,543)
|
(1,699,495
|
)
|
(1,689,952
|
) | |||||||
|
Accumulated other comprehensive income
|
1,262,037
|
1,256,729
|
(5,308
|
) | ||||||||
|
Total stockholders’ equity
|
44,614,580
|
22,026,011
|
(22,588,569
|
) | ||||||||
|
Total Equity
|
44,614,580
|
43,044,144
|
(1,570,436
|
) | ||||||||
|
Total liabilities and equity
|
$
|
296,218,952
|
$
|
294,937,013
|
(1,281,939
|
) | ||||||
26
Consolidated Statements of Operations and Comprehensive Income (Loss)
(Unaudited))
|
For the Three Months
|
For the Six Months
|
|||||||||||||||||||||||
|
Ended June 30, 2010
|
Ended June 30, 2010
|
|||||||||||||||||||||||
|
Before Restated
|
After Restated
|
Effect of Change |
Before Restated
|
After Restated
|
Effect of Change | |||||||||||||||||||
|
Sales
|
$
|
131,997,217
|
$
|
131,997,217
|
$
|
249,369,103
|
$
|
249,369,103
|
||||||||||||||||
|
Cost of sales
|
123,351,375
|
123,351,375
|
231,907,817
|
231,907,817
|
||||||||||||||||||||
|
Gross profit
|
8,645,842
|
8,645,842
|
17,461,286
|
17,461,286
|
||||||||||||||||||||
|
Operating expenses
|
||||||||||||||||||||||||
|
Selling expenses
|
258,901
|
258,901
|
343,413
|
343,413
|
||||||||||||||||||||
|
General and administrative expenses
|
1,088,256
|
1,213,080
|
124,824
|
1,893,788
|
2,018,612
|
124,824
|
||||||||||||||||||
|
Total operating expenses
|
1,347,157
|
1,471,981
|
124,824
|
2,237,201
|
2,362,025
|
124,824
|
||||||||||||||||||
|
Income (loss) from operations
|
7,298,685
|
7,173,861
|
(124,824
|
) |
15,224,085
|
15,099,261
|
(124,824
|
) | ||||||||||||||||
|
Other income (expenses):
|
||||||||||||||||||||||||
|
Interest expense, net
|
(1,589,937
|
)
|
(1,589,937
|
)
|
(2,663,462
|
)
|
(2,663,462
|
) |
|
|||||||||||||||
|
Non-operating income (expenses)
|
118,802
|
118,802
|
|
9,599
|
9,599
|
|||||||||||||||||||
|
Total other income (expenses)
|
(1,471,135
|
)
|
(1,471,135
|
)
|
(2,653,863
|
)
|
(2,653,863
|
) |
|
|||||||||||||||
|
Income (loss) before provision for income
|
||||||||||||||||||||||||
|
taxes
|
5,827,550
|
5,702,726
|
(124,824
|
) |
12,570,222
|
12,445,398
|
(124,824
|
) | ||||||||||||||||
|
Provision (benefit) for income taxes
|
||||||||||||||||||||||||
|
Current
|
903,546
|
(903,546
|
) |
1,914,946
|
-
|
(1,914,946
|
) | |||||||||||||||||
|
Deferred
|
-
|
1,504,063
|
1,504,063
|
-
|
3,191,577
|
3,191,577
|
||||||||||||||||||
|
Total
|
903,546
|
1,504,063
|
600,517
|
1,914,946
|
3,191,577
|
1,276,631
|
||||||||||||||||||
|
Net income (loss) to Keyuan Petrochemicals, Inc. stockholders
|
4,924,004
|
4,198,663
|
(725,341
|
)
|
10,655,276
|
9,253,821
|
(1,401,455
|
)
|
||||||||||||||||
|
Dividend to Series A convertible preferred stockholers
|
288,497
|
288,497
|
288,497
|
288,497
|
||||||||||||||||||||
|
Net income (loss) attributable to Keyuan Petrochemicals, Inc. common stockholders
|
$ |
4,924,004
|
3,910,166
|
(1,013,838
|
) |
10,655,276
|
8,965,324
|
(1,689,952
|
) | |||||||||||||||
|
Other comprehensive income
|
||||||||||||||||||||||||
|
Foreign currency translation adjustment
|
196,958
|
192,224
|
(4,734
|
) |
199,256
|
193,948
|
(5,308
|
) | ||||||||||||||||
|
Comprehensive Income (loss)
|
$
|
5,120,962
|
$
|
4,390,887
|
(730,075
|
) |
$
|
10,854,532
|
$
|
9,447,769
|
(1,406,763
|
) | ||||||||||||
|
Earnings (loss) per share
|
||||||||||||||||||||||||
|
Attributable to common stock
|
||||||||||||||||||||||||
|
-Basic
|
$ | 2.06 | $ | 0.08 | (1.98 | ) | $ | 8.88 | $ | 0.18 | (8.70 | ) | ||||||||||||
|
-Diluted
|
$ | 0.09 | $ | 0.08 | (0.01 | ) | $ | 0.21 | $ | 0.18 | (0.03 | ) | ||||||||||||
| Attributable to Series M preferred stocks | ||||||||||||||||||||||||
|
-Basic
|
$ | 0.00 | $ | 78.13 | 78.13 | $ | 0.00 | $ | 183.50 | 183.50 | ||||||||||||||
|
-Diluted
|
$ | 0.00 | $ | 76.44 | 76.44 | $ | 0.00 | $ | 180.34 | 180.34 |
|
Weighted average number of common
|
||||||||||||||||||||||||
|
share outstanding
|
||||||||||||||||||||||||
|
Basic
|
2,387,451 | 2,387,451 | 1,200,321 | 1,200,321 | ||||||||||||||||||||
|
Diluted
|
54,930,660 | 54,930,660 | 51,314,420 | 51,314,420 | ||||||||||||||||||||
27
Consolidated Statements of Cash Flows
(Unaudited)
|
For the Six Months Ended June 30, 2010
|
||||||||||||
|
Before Restated
|
After Restated
|
Effect of Change | ||||||||||
|
Cash flows from operating activities:
|
||||||||||||
|
Net income (loss)
|
$
|
10,655,276
|
$
|
9,253,821
|
(1,401,455)
|
|||||||
|
Adjustments to reconcile net income to net cash
|
||||||||||||
|
provided by (used in) operating activities:
|
||||||||||||
|
Depreciation and amortization
|
4,204,754
|
4,204,754
|
||||||||||
|
Deferred tax assets
|
1,914,946
|
3,191,577
|
1,276,631
|
|||||||||
|
Share-based compensation expense
|
-
|
124,824
|
124,824
|
|||||||||
|
Changes in current assets and current liabilities:
|
||||||||||||
|
Trade notes receivable
|
(9,895,257
|
)
|
(9,895,257
|
)
|
||||||||
|
Inventories
|
(34,628,566
|
)
|
(34,628,566
|
)
|
||||||||
|
Advance payments for raw materials
|
(6,190,211
|
)
|
(6,190,211
|
)
|
||||||||
|
Prepaid taxes
|
(11,182,419
|
)
|
(11,182,419
|
)
|
||||||||
|
Other current assets
|
106,766
|
1,175,434
|
1,068,668
|
|||||||||
|
Accounts payable – trade and accrued expenses
|
57,283,692
|
57,283,692
|
||||||||||
|
Trade notes payable
|
5,204,811
|
-
|
(5,204,811)
|
|||||||||
|
Advances from customers
|
(3,078,476
|
)
|
(3,078,476
|
)
|
||||||||
|
Other current liabilities
|
19,826
|
19,826
|
||||||||||
|
Total adjustments
|
3,759,866
|
1,025,178
|
(2,734,688)
|
|||||||||
|
Net cash provided by (used in) operating activities
|
14,415,142
|
10,278,999
|
(4,136,143)
|
|||||||||
|
Cash flows from investing activities:
|
||||||||||||
|
Advance payments for construction in progress
|
-
|
-
|
||||||||||
|
Due from unrelated parties
|
1,068,668
|
-
|
(1,068,668)
|
|||||||||
|
Additions to property and equipment
|
(2,076,103
|
)
|
(17,084,658
|
)
|
(15,008,555)
|
|||||||
|
Additions to intangible assets
|
(143,806
|
)
|
-
|
143,806
|
||||||||
|
Accounts payable – construction related
|
(14,864,749
|
)
|
-
|
14,864,749
|
||||||||
|
Net cash used in investing activities
|
(16,015,990
|
)
|
(17,084,658
|
)
|
(1,068,668)
|
|||||||
|
Cash flows from financing activities:
|
||||||||||||
|
Restricted cash
|
(27,655,715
|
)
|
(27,655,715
|
)
|
||||||||
|
Proceeds from short-term bank loans
|
733,450
|
733,450
|
||||||||||
|
Proceeds from bills payable
|
18,923,010
|
-
|
(18,923,010)
|
|||||||||
|
Repayment of bills payalbe
|
(13,178,199)
|
13,178,199
|
||||||||||
|
Repayments to Ningbo Litong
|
(733,450
|
)
|
(733,450
|
)
|
||||||||
|
Repayment to Ningbo Litong
|
(953,485
|
)
|
(953,485
|
)
|
||||||||
|
Repayment of long-term bank loans
|
(1,466,900
|
)
|
(1,466,900
|
)
|
||||||||
|
Process from warrant exercises
|
23,132,089
|
23,132,089
|
||||||||||
|
Net cash provided by (used in) financing activities
|
(6,944,011
|
)
|
(1,739,200
|
)
|
5,204,811
|
|||||||
|
Effect of foreign currency translation on cash
|
36,879
|
36,879
|
||||||||||
|
Net increase (decrease) in cash and cash equivalents
|
(8,507,980
|
)
|
(8,507,980
|
)
|
||||||||
|
Cash and cash equivalents – beginning of period
|
14,030,655
|
14,030,655
|
||||||||||
|
Cash and cash equivalents – ending of period
|
$
|
5,522,675
|
$
|
5,522,675
|
||||||||
| Supplemental schedule of non cash activities: | ||||||||||||
|
Preferred stock dividends declared
|
$
|
-
|
$
|
288,497
|
288,497
|
|||||||
28
Note 25 - Related Party Transactions and Relationships
The Company considers all transactions with the following parties to be the related party transactions.
|
Name of parties
|
Relationship
|
|
|
Mr. Chunfeng Tao
|
Majority stockholder
|
|
|
Mr. Jicun Wang
|
Principal stockholder
|
|
|
Mr. Peijun Chen
|
Principal stockholder
|
|
|
Ms. Sumei Chen
|
Member of the Company’s Board of Supervisors and spouse of Mr. Wang
|
|
|
Ms. Yushui Huang
|
Vice President of Administration, Ningbo Keyuan
|
|
|
Mr. Weifeng Xue
|
Vice President of Accounting, Ningbo Keyuan
|
|
|
Mr. Hengfeng Shou
|
Vice President of Sales, Ningbo Keyuan
|
|
|
Petrochemical
|
||
|
Ningbo Kewei Investment Co., Ltd.
|
A company controlled by Mr. Tao
|
|
|
(Ningbo Kewei)
|
||
|
Ningbo Pacific Ocean Shipping Co., Ltd
|
100% ownership by Mr. Wang
|
|
|
(Ningbo Pacific)
|
||
|
Ningbo Hengfa Metal Product Co., Ltd
|
100% ownership by Mr. Chen
|
|
|
(Ningbo Hengfa, former name "Ningbo Tenglong")
|
||
|
Shandong Tengda Stainless Steel Co., Ltd
|
100% ownership by Mr. Chen
|
|
|
(Shandong Tengda)
|
||
|
Ningbo Xinhe Logistic Co., Ltd
|
||
|
(Ningbo Xinhe)
|
10% ownership by Ms. Huang
|
|
|
Ningbo Kunde Petrochemical Co, Ltd.
|
Mr. Tao’s mother was a 65% nominee shareholder
|
|
|
(Ningbo Kunde)
|
for Mr. Hu, a third party
|
|
|
Ningbo Jiangdong Jihe Construction Materials
|
Controlled by Mr. Xue’s Brother-in-law
|
|
|
Store (Jiangdong Jihe)
|
||
|
Ningbo Wanze Chemical Co., Ltd
|
Mr. Tao’s sister-in-law is the legal representative
|
|
|
(Ningbo Wanze)
|
||
|
Ningbo Zhenhai Jinchi Petroleum Chemical
|
Controlled by Mr. Shou
|
|
|
Co., Ltd (Zhenhai Jinchi)
|
Related party transactions and amounts outstanding with the related parties as of and for the three months ended March 31, 2010 and 2009 are summarized as follows:
| Three months ended June 30, | ||||||||
|
2010
|
2009
|
|||||||
|
Sales of products (a)
|
$ | 26,369,453 | $ | - | ||||
|
Purchase of raw material (b)
|
$ | - | $ | - | ||||
|
Purchase of transportation services (c)
|
$ | 1,593,080 | $ | - | ||||
|
Credit line of guarantee provision for bank borrowings (d)
|
$ | 4,400,700 | $ | 43,238,150 | ||||
|
Short-term financing from related parties (e)
|
$ | 2,934,200 | $ | 5,247,767 | ||||
|
Short-term financing to related parties (e)
|
$ | 2,934,200 | $ | 5,247,767 | ||||
| Six months ended June 30, | ||||||||
|
2010
|
2009
|
|||||||
|
Sales of products (a)
|
$ | 47,186,862 | $ | - | ||||
|
Purchase of raw material (b)
|
$ | 5,734,319 | $ | - | ||||
|
Purchase of transportation services (c)
|
$ | 3,044,389 | $ | - | ||||
|
Credit line of guarantee provision for bank borrowings (d)
|
$ | 124,686,500 | $ | 52,032,350 | ||||
|
Short-term financing from related parties (e) $
|
4,400,700 | $ | 6,639,621 | |||||
|
Short-term financing to related parties (e)
|
$ | 4,400,700 | $ | 6,639,621 | ||||
|
(a)
|
The Group sold finished products of $22,424,477 and nil to Ningbo Kunde for the three months ended June 30, 2010 and 2009, respectively. The Group sold finished products of $43,228,614 and nil to Ningbo Kunde for the six months ended June 30, 2010 and 2009, respectively. The prices were based on market prices at the time of transactions. There were no outstanding amounts received in advance from Kunde as of June 30, 2010 and 2009, respectively. Sales to Zhenhai Jinchi for the three months ended June 30, 2010 and 2009 were $3,941,976 and nil, six months ended June 30, 2010 and 2009 were $3,958,248 and nil with no outstanding balance.
|
29
|
(b)
|
There are no raw materials purchased from Ningbo Kewei and Kunde during the three months ended June 30, 2010 with no outstanding amounts at the three month ended in respect of these purchase transactions. The Group purchased raw materials of $4,427,831 from Ningbo Kewei during the six months ended June 30, 2010 in respect of these purchase transactions. The Group purchased raw materials of $1,308,488 and nil from Ningbo Kunde during the six months ended June 30, 2010 and 2009, respectively.
|
|
(c)
|
The Group purchased transportation services of $1,593,080 and nil from Ningbo Xinhe during the three months ended June 30, 2010 and 2009, respectively. The Group purchased transportation services of $3,044,389 and nil from Ningbo Xinhe during the six months ended June 30, 2010 and 2009, respectively. Amounts owed to Ningbo Xinhe as of June 30, 2010 and 2009 in respect of these purchase transactions was $268,447 and nil, respectively.
|
|
(d)
|
Guarantees for Bank Loans
|
| Guarantee provided during | Guarantee provided during | |||||||||||||||
| The three months ended June 30 | The six months ended June 30 | |||||||||||||||
|
2010
|
2009
|
2010
|
2009
|
|||||||||||||
|
Mr. Tao
|
$ | - | $ | 14,657,000 | $ | 79,212,600 | $ | 14,657,000 | ||||||||
|
Jicun Wang and Chen
|
$ | - | $ | 28,581,150 | $ | - | $ | 28,581,150 | ||||||||
|
Ningbo Kewei
|
$ | - | $ | - | $ | 41,073,200 | $ | - | ||||||||
|
Ningbo Pacific
|
$ | 4,400,700 | $ | - | $ | 4,400,700 | $ | - | ||||||||
|
Ningbo Hengfa
|
$ | - | $ | - | $ | - | $ | 8,794,200 | ||||||||
|
Shandong Tengda
|
$ | 4,400,700 | $ | 43,238,150 | $ | 124,686,500 | $ | 52,032,350 | ||||||||
| Guarantee utilized as of | ||||||||
|
June 30,
|
December 31,
|
|||||||
|
2010
|
2009
|
|||||||
|
Mr. Tao
|
$ | 30,933,000 | $ | 30,807,000 | ||||
|
Jicun Wang and Chen
|
$ | - | $ | 14,670,000 | ||||
|
Ningbo Kewei
|
$ | 3,682,500 | $ | 3,667,500 | ||||
|
Ningbo Pacific
|
$ | 14,730,000 | $ | 24,498,900 | ||||
|
Ningbo Hengfa
|
$ | 38,739,900 | $ | 41,516,100 | ||||
|
Shandong Tengda
|
$ | 883,800 | $ | 880,200 | ||||
|
(e)
|
Short-term financing transactions with related parties
|
| Three Months Ended June 30 | ||||||||||||||||||||||||
| 2010 | 2009 | |||||||||||||||||||||||
|
From
|
To
|
Balance
|
From
|
To
|
Balance
|
|||||||||||||||||||
|
Ningbo Kewei
|
400 | -400 | - | 688,879 | -688,879 | - | ||||||||||||||||||
|
Ningbo Kunde
|
2,933,800 | -2,933,800 | - | 4,558,888 | -4,558,888 | - | ||||||||||||||||||
| 2,934,200 | -2,934,200 | - | 5,247,767 | -5,247,767 | - | |||||||||||||||||||
| Six Months Ended June 30 | ||||||||||||||||||||||||
| 2010 | 2009 | |||||||||||||||||||||||
|
From
|
To
|
Balance
|
From
|
To
|
Balance
|
|||||||||||||||||||
|
Ningbo Kewei
|
1,466,900 | -1,466,900 | - | 688,879 | -688,879 | - | ||||||||||||||||||
|
Ningbo Kunde
|
2,933,800 | -2,933,800 | - | 5,950,742 | -5,950,742 | - | ||||||||||||||||||
| 4,400,700 | -4,400,700 | - | 6,639,621 | -6,639,621 | - | |||||||||||||||||||
|
(f)
|
Amount due from related parties consist of the following:
|
|
June 30,
|
December 31,
|
|||||||
|
2010
|
2009
|
|||||||
|
Related Party
|
||||||||
|
Ningbo Kunde
|
$ | - | $ | - | ||||
|
Executive
|
$ | - | $ | 261,493 | ||||
|
Mr. Tao
|
$ | - | $ | - | ||||
| $ | - | $ | 261,493 | |||||
Amount due from executives represents advances made for business expenses for which reimbursement claims have not been received as of December 31, 2009.
30
|
(g)
|
Amount due to related parties consists of the following:
|
|
June 30,
|
December 31,
|
|||||||
|
2010
|
2009
|
|||||||
|
Related Party
|
||||||||
|
Former shareholders
|
$ | - | 733,500 | |||||
|
Ningbo Kunde
|
$ | - | 3,174,588 | |||||
|
Ninbo Xinhe
|
268,447 | 598,308 | ||||||
| $ | 268,447 | $ | 4,506,396 | |||||
Amount due to related parties represent balances due for freight.
Note 26 – Subsequent Events
|
(a)
|
On July 1, 2010, the Company granted 80,000 five-year options to two outside directors to purchase up to 80,000 shares of the Company’s common stock at an exercise price of US$4.20 per share, in consideration of their services to the Company. Of these options, 40,000 of the options shall vest immediately after one year of the issuance and the remaining 40,000 of the options shall vest immediately after two years of the issuance, provided that the optionee is re-elected for successive one year terms at the end of 12 months of the issuance. These options were valued at US$91,349 which represents the grant date fair value of these options.
The Company estimates the fair value of these options using the Black-Scholes option pricing model with the following assumptions: an expected life equal to the contractual term of the options (five years), underlying stock price of $3.25 per share, no dividends, a risk free rate of 1.80%, which is five-year yield on Treasury bonds at constant (or fixed) maturity and volatility of 47%. The expected volatility is calculated using historical data obtained from comparable public companies due to lack of liquidity of the Company’s underlying stock. Exercise price of the option is the contractual exercise price of the option.
|
|
(b)
|
On July 1, 2010, the Company granted 40,000 five-year options to a consultant to purchase an aggregate of 40,000 shares of the Company’s common stock at an exercise price of US$4.20 per share, in consideration of their services to the Company. Of these options, all 40,000 of the options shall vest immediately.
These options were valued at US$45,675 which represents the grant date fair value of these options.
The Company estimates the fair value of these options using the Black-Scholes option pricing model with the following assumptions: an expected life equal to the contractual term of the options (five years), underlying stock price of $3.25 per share, no dividends, a risk free rate of 1.80%, which is five-year yield on Treasury bonds at constant (or fixed) maturity and volatility of 47%. The expected volatility is calculated using historical data obtained from comparable public companies due to lack of liquidity of the Company’s underlying stock. Exercise price of the option is the contractual exercise price of the option.
|
|
(c)
|
On July 27, 2010, the Company granted 420,000 three-year options to a consultant to purchase an aggregate of 420,000 shares of the Company’s common stock at an exercise price of US$4.20 per share, in consideration of their services to the Company. Of these options, 70,000 of the options shall vest immediately, 31,818 shall vest monthly beginning on September 1, 2010 and the remaining balance of 95,456 shall vest on May 1, 2011.
These options were valued at US$520,441 which represents the grant date fair value of these options.
The Company estimates the fair value of these options using the Black-Scholes option pricing model with the following assumptions: an expected life equal to the contractual term of the options (three years), underlying stock price of $4.00 per share, no dividends, a risk free rate of 1.02%, which is three-year yield on Treasury bonds at constant (or fixed) maturity and volatility of 47%. The expected volatility is calculated using historical data obtained from comparable public companies due to lack of liquidity of the Company’s underlying stock. Exercise price of the option is the contractual exercise price of the option.
|
31
|
(d)
|
On August 4, 2010, the Company granted 700,000 five-year options to 79 managers and employees to purchase in the aggregate 700,000 shares of the Company’s common stock at an exercise price of US$4.50 per share, in consideration of their services to the Company. Of these options, 30% of the Options shall vest immediately after one year of the issuance, 40% of the options shall vest immediately after two years of the issuance and 30% of the options shall vest immediately after three years of the issuance.
These options were valued at approximately US$1,338,761 which represents the grant date fair value of these options.
The Company estimates the fair value of these options using the Black-Scholes option pricing model with the following assumptions: an expected life equal to the contractual term of the options (five), underlying stock price of $4.50 per share, no dividends, a risk free rate of 1.62%, which is five-year yield on Treasury bonds at constant (or fixed) maturity and volatility of 47%. The expected volatility is calculated using historical data obtained from comparable public companies due to lack of liquidity of the Company’s underlying stock. Exercise price of the option is the contractual exercise price of the option.
|
|
(e)
|
The Company’s former auditor, KPMG, LLP (“KPMG”), brought certain issues to the Company’s Audit Committee’s attention through a March 28, 2011 memorandum and an April 18, 2011 letter (collectively, the “KPMG Memoranda”). KPMG requested that the Company’s Audit Committee conduct an independent investigation (the “Investigation”) into those issues. On March 31, 2011, the Audit Committee elected to commence such independent Investigation and engaged the services of independent counsel, Pillsbury Winthrop Shaw Pittman LLP (“Pillsbury”), which in turn engaged the services of Deloitte Financial Advisory Services LLP (“Deloitte”), as independent forensic accountants, and King & Wood, as Audit Committee counsel in the People’s Republic of China (“PRC”). Pillsbury, Deloitte and King & Wood are collectively referred to herein as the “Investigation Team.” On September 28, 2011 the investigation was completed. The Investigation identified possible violations of PRC laws and U.S. Securities laws, including the maintenance of an off-balance sheet cash account that was used primarily to pay service providers and other Company related expenses. Total activity in the off-balance sheet cash account amounted to approximately $800,000 through December 31, 2010 with a net income statement effect of approximately $12,000, and $400,000 for the period from January 1, 2011 to March 31, 2011, with a net income statement effect of approximately $192,000, at which time the Company ceased its use. The Investigation identified certain other issues that could result in potential violations of PRC or U.S. laws. The Company is working with its legal counsel to evaluate the matters identified in the Investigation and to determine the extent to which the Company may be exposed to fines and penalties. In addition, the Company has retained a Foreign Corrupt Practices Act (“FCPA”) expert to review potentially relevant transactions and to assist the Company with the design and implementation of a detailed FCPA program. The Company has preliminarily concluded that the extent to which it may be exposed in the PRC is limited. However, management is currently unable to determine the final outcome of these matters and their possible effects on the consolidated financial statements.
|
On October 7, 2011, trading of the Company’s common stock was delisted by NASDAQ, and is currently quoted on the Pink Sheets (symbol: KEYP.PK).
The Company’ s management believes that the Company’s cash, working capital, and access to cash through its bank loans provide adequate capital resources to fund its operations and working capital needs through at least the end of 2011.
32
|
Item 2.
|
MANAGEMENT’S DISCUSSION AND ANALYSIS OF FINANCIAL CONDITION AND RESULTS OF OPERATIONS
|
The following discussion and analysis of our financial condition and result of operations contains forward-looking statements and involves numerous risks and uncertainties, including, but not limited to, those described in the "Risk Factors" section of the other reports we file with the Securities and Exchange Commission. Actual results may differ materially from those contained in any forward-looking statements.
The following discussion and analysis of financial condition and results of operations relates to the operations and financial condition reported in the financial statements of Keyuan for the three months and six months ended June 30, 2010 and 2009 and should be read in conjunction with such financial statements and related notes included in this report and the Company's Annual Report on Form 10-K for the year ended December 31, 2009.
Overview
Prior to the consummation of the share exchange transaction described below, we were a shell company with nominal operations and nominal assets. Currently, we are a holding company operating through our wholly-owned subsidiary, Keyuan Plastics, located in Ningbo, China. We are a manufacturer and supplier of numerous petrochemical products in China. Operating through our wholly-owned subsidiary, Keyuan Plastics, we have an annual design petrochemical manufacturing capacity of 550,000 MT. In addition, we continue to utilize manufacturing technologies that lower our raw material costs while enhancing our production output. We expect to increase our production output to 660,000 MT this year.
During the first six months of our 2010 fiscal year, we continued the expansion of our product sales. We have successfully transitioned from a long-term construction period that ended in September 2009 into full-scale sales and distribution of our petrochemical products. Current products include BTX aromatics, propylene, styrene, liquid petroleum gas (LPG), MTBE and other petrochemicals (each of which is described in greater detail below). To date, our customers' order requests for our 2010 fiscal year have already exceeded our current annual production capacity.
In order to increase our production capacity to meet the increasing market demands, our management team plans to expand our manufacturing capacity to include additional storage capacity, a raw material pre-treatment facility and an asphalt production facility.
Our Facility and Equipment
Facility
To date, we have invested a total of approximately $132 million in the construction and improvement of our production facility. Our current production facility is 1.2 million square feet in total including 594,000 square feet for production and 19,500 square feet for laboratories and offices.
We have a total of 100,000 MT of storage capacity, consisting of 50,000 MT of storage capacity for raw materials and 50,000 MT for finished products. As part of our expansion plan, we intend to add 100,000 MT of new storage capacity.
We have an on-site ocean shipping dock with 5,000 MT of shipping capacity and a 10-truck loading facility. Approximately 90% of our feedstock and finished products use this shipping dock. We also have adjacent access to another shipping dock with an additional 50,000 MT of shipping capacity.
Equipment
Our major processing equipment includes
|
●
|
heavy oil catalytic pyrolysis processing equipment- risers/generators/precipitators, fuel gas boilers, fractionating tower, absorbing re-absorbing and desorbing towers, heat exchangers, pumps, a stabilizing tower;
|
|
●
|
gas fractionation processing equipment- de-propanizing tower, refining propylene tower, de-ethanizination tower, heat exchangers, pumps;
|
|
●
|
ethylbenzene processing equipment- alkylation reactor, anti-alkylation reactor, dehydrogenation reactor, propylene absorbing tower, de-ethylene tower, ethylbenzene recovering tower, heating furnace for benzene, heating furnace for gas, steam overheating furnace, tail gas compressor, washing tower; and
|
|
●
|
liquefied petroleum gas (LPG) and sulfur recovery process- LPG desulfurization extraction tower, dry gas desulfurization tower, regenerating tower, LPG de-mecaptan extraction tower.
|
33
Our Products
We manufacture and supply a variety of petrochemical products, including BTX aromatics, propylene, styrene, LPG, MTBE and other petrochemicals.
|
●
|
BTX Aromatics: consisting of benzene, toluene, xylene and other chemical components for further processing into oil resin, gasoline and solvents materials widely used in paint, ink, construction coating and pesticide.
|
|
●
|
Propylene: a chemical intermediate as one of the building blocks for an array of chemical and plastic products that are commonly used to produce polypropylene, acrylonitrile, oxo chemicals, propylene oxide, cumene, isopropyl alcohol, acrylic acid and other chemicals for paints, household detergents, automotive brake fluids, indoor/outdoor carpeting, textile, insulating materials, auto parts and electrical appliances.
|
|
●
|
Styrene: a precursor to polystyrene and several copolymers widely used for packaging materials, construction materials, electronic parts, home appliances, household goods, home furnishings, toys, sporting goods and others.
|
|
●
|
LPG: a mixture of hydrocarbon gases used as fuel in heating appliances and vehicles. A replacement for chlorofluorocarbons as an aerosol propellant and a refrigerant which reduces damage to the ozone layer.
|
|
●
|
MTBE & Other Chemicals: MTBE, oil slurry, sulphur and others are used for a variety of applications including fuel components, refrigeration systems, fertilizers, insecticides and fungicides, etc.
|
Expansion Plan
In order to meet the increasing market demands, our management team has made plans to expand our manufacturing capacity to include additional storage capacity, a raw material pre-treatment facility and an asphalt production facility.
The increase storage capacity will allow the Company to take better advantage of price variations to our raw material costs thereby helping to further improve future gross margins. The pretreatment facility will allow us to handle lower grade raw materials thereby helping to further decrease raw material costs. The pretreatment facility will also improve efficiency in current production process as well as provide necessary feedstock for asphalt production, a production line that we plan to add with 300,000 MT annual capacities to our current facility. Management believes that this expansion will increase sales by as much as US $298 million per year and result in approximately $30 million of additional annual profits.
Our current estimated schedule of our expansion plan is as follows:
|
●
|
Complete land purchase by September 30, 2010;
|
|
●
|
Commence construction in the quarter ended December 31, 2010;
|
|
●
|
Complete equipment installation by March 31, 2012;
|
|
●
|
Begin trial production in the quarter ended June 30, 2012;
|
|
●
|
Start full production and sales in the quarter ended September 30, 2012.
|
In order to expand our facility, we need to acquire use rights of additional land. In China, the government is responsible for overall land planning and they will often select a target company to maximize the benefits of land use for a particular area. We have been in regular communications with the Ningbo Municipal Government about the land use rights for approximately 1.2 million square feet of land adjacent to our current production facility. We submitted our application to the local government for a land bidding process slated on July 13, 2010 which is a necessary legal proceeding to acquire the land use rights in China. And we are the only bidder in this process because the land is well integrated with our existing site and no other bidder can make better use of the land than us. The bidding process was completed on August 13, 2010 and we received a written confirmation from the local government stating the land use rights have been granted to us on the same day. And we expect to enter into land use right transfer agreement with the local government in the near future.
The estimated cost of the expansion plans and the addition of asphalt development is approximately $78 million including $8 million for purchasing land, $20 million for facility construction, $40 million for new equipment and $10 million for working capital for the whole business. Compared with our original estimated cost of $90 million, there is a decrease of $12 million. The reduction is a result of lower estimated cost for the land purchase. The original estimated cost of land purchase was made when the market price for land was higher and the actual size of the land is smaller than we originally estimated. However, the decrease in land size will not impact the construction of our expansion projects or the execution of our overall business strategy.
34
We received gross proceeds of $26.2 million from the Private Placement in April and May, 2010 with original plans to use $20 million of the net proceeds for the purchase of the land. Due to the decrease of the estimated cost of land purchase, we were able to allocate a greater percentage of the net proceeds received toward raw material purchases in the second quarter. We currently plan to use cash from operations and other sources to fund the purchase of the land use rights. We will also still need additional cash resources to fully execute our expansion plans. We plan to fund this proposed expansion through short-term borrowings, cash from operations and potential equity financing. However, we may not be able to obtain additional financing at acceptable terms, or at all, and, as a result, our ability to increase our production capacity and expand our business could be adversely affected.
SBS Project
In addition to our expansion plans, we are currently working on building new facility for producing Styrene-Butadience-Styrene (the “SBS”), one of the Styreneic Block Copolymers. SBS is a product with high product margin with major application for footwear, adhesive, polymer modification and modified asphalt industries. The SBS facility will be built on the 1.2 million square feet land that we just received written confirmation for reservation from local government on August 13, 2010. The construction may start in September, 2010 and will take approximately12 months to complete. The designed capacity of SBS will be 70,000 metric ton a year. China’s current domestic production capacity of SBS is approximately 600,000 tons a year with an estimated domestic demand of 750,000 tons (data source: http://www.cpi360.com/docpage/c419/200906/0603_419_546403.aspx which is set up by Eastern-China International P&C Net).
The total investment of the SBS facility is estimated to be $17.5 million. We expect to start the trial run in the fourth quarter of 2010 and commence the production in late 2010 or early 2011. The SBS facility will generate approximately $107 million in sales and $10million in profit annually at full capacity.
Manufacturing and Sales
Our total production was 169,386 MT for the second quarter of 2010 and the revenue for the quarter totaled $132.0 million, based on the sale of 155,955 MT of petrochemical products, up 12% versus the first quarter of 2010. Due to lower market pricing; we decided to hold 24,000 MT of production in inventory which we anticipated selling in the third quarter of 2010, at a higher price. We also held over 27,400 tons of production as a result of a 15-day production shutdown due to a power grid upgraded by a local utility agency.
However, due to our low-cost and flexible manufacturing process, we are able to change the mix of raw materials and quality of products we produce based on market conditions. We have recently started using a greater amount of lower grade light oil in three of our seven production lines. This will allow us to significantly increase the amount of higher margin light aromatic products we produce without spending any additional capital expenditures to expand our production capacity. Gross margin is expected to improve in the second half of the year due to improved production yields and favorable product mix and is expected to average 10% for the full year of 2010. First half gross margin was impacted by three factors:
|
·
|
Lower market prices due to a general economic slowdown: the European debt crisis that began in mid-May and extended to June drove down prices for all petrochemical products. The lower market prices together with higher historical inventory costs put the downward pressure on our margin. We have seen prices start to rebound in late July.
|
|
·
|
Startup cost carryover: we have been ramping our production lines since the fourth quarter of 2009. We had 2009 startup costs carried over, resulting in approximately $1.8 million higher cost of goods sold at beginning of 2010. In addition, because the equipment, processes and workers are new, we have not been operating at optimal efficiency levels. The company continues to optimize product mix and improve efficiency and yield.
|
|
·
|
Temporary mandatory factory shutdown: in the months of March, May and June, we were forced to shut down all production lines due to a mandatory shutdown ordered by the local utility agency for power grid upgrade. Because we were forced to power down and subsequently power up our manufacturing facilities over several days, we lost a combined 23 days of production (8 days in the first quarter, 15 days in the second quarter), equating to 42,000 MT of production, approximately $33.8 million of revenues, $2.4 million in gross profit and $1.5 million in net income.
|
As previously stated, we decided to sell less than 100% of our production in the second quarter because we received lower prices during certain periods in the quarter. Up to date, we have sold over half of the inventory from the second quarter at higher prices than would have received had we sold toward the end of last quarter. We expect to sell the remainder of the inventory by the end of the third quarter. With a low-cost, flexible manufacturing facility and 100,000 MT of storage capacity, we will continue to adjust our selling strategies to maximize returns to our shareholders.
35
Critical Accounting Policies and Estimates
The discussion and analysis of our financial condition and results of operations is based upon our financial statements which have been prepared in accordance with accounting principles generally accepted in the United States. The preparation of these financial statements requires us to make estimates and judgments that affect the reported amounts of assets and liabilities. On an on-going basis, we evaluate our estimates including the allowance for doubtful accounts, the salability and recoverability of inventory, income taxes and contingencies. We base our estimates on historical experience and on other assumptions that we believes to be reasonable under the circumstances, the results of which form our basis for making judgments about the carrying values of assets and liabilities that are not readily apparent from other sources. Actual results may differ from these estimates under different assumptions or conditions.
We cannot predict what future laws and regulations might be passed that can have a material effect on our results of operations. We assess the impact of significant changes in laws and regulations on a regular basis and update the assumptions and estimates used to prepare our financial statements when we deem it necessary.
36
Inventory
Inventory is stated at the lower of cost or market. Cost is determined using the weighted-average cost method. Provisions are made for excess, slow moving and obsolete inventory as well as inventory whose carrying value is in excess of net realizable value. Management continually evaluates the recoverability based on assumptions about customer demands and market conditions. If actual market conditions are less favorable than those projected by management, additional inventory reserves or write-downs may be required that could negatively impact our gross margin and operating results. The Company did not record any provision for slow-moving and obsolete inventory as of June 30, 2010 and December 31, 2009.
Property and Equipment
Property and equipment are stated at cost. Depreciation is calculated based on the straight-line method over the estimated useful lives of the assets as follows:
| Vehicles | 5 years |
| Furniture, machinery and equipment | 5 to 10 years |
|
Buildings and improvements
|
45 years
|
Construction in progress primarily represents the renovation costs of plant, machinery and equipment. Costs incurred are capitalized and transferred to property and equipment upon completion, at which time depreciation commences.
Cost of repairs and maintenance is recorded as incurred. Gain or loss on disposal of property and equipment, if any, is recognized in the statements of operations.
Long-Lived Assets
In accordance with SFAS No. 144, “Accounting for the Impairment or Disposal of Long-Lived Assets” codified in FASB ASC Topic 360-10, we review the recoverability of our long-lived assets on a periodic basis in order to identify business conditions, which may indicate a possible impairment. The assessment for potential impairment is based primarily on our ability to recover the carrying value of our long-lived assets from expected future discounted cash flows. If the total of the expected future discounted cash flows is less than the total carrying value of the assets, a loss is recognized for the difference between the fair value (computed based upon the expected future discounted cash flows) and the carrying value of the assets.
Intangible Assets
Intangible assets are stated at cost. Intangible assets with finite life are amortized over their estimated useful life using straight-line method. Impairment test is performed at least once a year to determine possible impairment loss. Estimated useful life of intangible assets is as follows:
|
Rights to use land
|
15-50 years
|
| Software | 10 years |
| Technology | 9-20 years |
Impairment of Intangible Assets
We apply the provisions of Financial Accounting Statement No. 142 “Goodwill and Other Intangible Assets”, codified in FASB ASC Topic 350, which addresses how goodwill and other acquired intangible assets should be accounted for in financial statements. In this regard, the Company tests these intangible assets for impairment annually or more frequently if indicators of potential impairment are present. Such circumstances could include, but are not limited to: (1) a significant decrease in the market value of an asset, (2) a significant adverse change in the extent or manner in which an asset is used, or (3) an accumulation of costs significantly in excess of the amount originally expected for the acquisition of an asset. The Company measures the carrying amount of the asset against the estimated discounted future cash flows associated with it at a risk-free rate of interest. In any case the present value of the expected future net cash flows is less than the carrying value of the asset being evaluated; an impairment loss would be recognized. The impairment loss would be calculated at the amount by which the carrying value of the asset exceeds its fair value.
The fair value is measured based on quoted market prices, if available. If quoted market prices are not available, the estimate of fair value is based on various valuation techniques including the discounted value of estimated future cash flows. The evaluation of asset impairment requires us to make assumptions about future cash flows over the life of the asset being evaluated. These assumptions require significant judgments and actual results may differ from assumed and estimated amounts. Based on our review, we believes that, as of December 31, 2009 and 2008, there were no significant impairments of our intangible assets.
37
Revenue Recognition
We derive our revenues primarily from sale of petrochemicals. In accordance with the provisions of Staff Accounting Bulletin No. 104, codified in FASB ASC Topic 480, revenue should not be recognized until it is realized or realizable and earned. Revenues are considered to have been earned when the entity has substantially accomplished what it must do to be entitled to the benefits represented by the revenues. In this regard, our revenue is recognized when merchandise is received by customers or shipped by us pursuant to contractual terms of sales so that title and risk of loss passes to the customers and the collectibility is reasonably assured.
Research and Development
Research and development costs are expensed as incurred. Research and development costs for the three and six months ended June 30, 2010 and the years ended December 31, 2009 and 2008 were insignificant.
Recently Issued Accounting Pronouncements
In October 2009, the Financial Accounting Standards Board (“FASB”) issued an amendment to the accounting and disclosure for revenue recognition. The amendment modifies the criteria for recognizing revenue in multiple element arrangements. Under the guidance, in absence of vendor-specific objective evidence (“VSOE”) or other third party evidence (“TPE”) of the selling price for the deliverables in a multiple-element arrangement, this amendment requires companies to use an estimated selling price (“ESP”) for the individual deliverables.
On July 1, 2009, the FASB officially launched the FASB Accounting Standards Codification (“ASC”), which has become the single official source of authoritative nongovernmental U.S. GAAP, in addition to guidance issued by the Securities and Exchange Commission. The ASC is designed to simplify U.S. GAAP into a single, topically ordered structure. All guidance contained in the ASC carries an equal level of authority. The ASC is effective for all interim and annual periods ending after September 15, 2009.
38
In May 2009, the FASB issued SFAS No. 165, “Subsequent Events” (“SFAS 165”), codified in FASB ASC Topic 855-10-05, which provides guidance to establish general standards of accounting for and disclosures of events that occur after the balance sheet date but before financial statements are issued or are available to be issued. SFAS 165 (ASC 855-10-05) also requires entities to disclose the date through which subsequent events were evaluated as well as the rationale for why that date was selected. SFAS 165 (ASC 855-10-05) is effective for interim and annual periods ending after June 15, 2009, and accordingly, the Company adopted this pronouncement during the year ended December 31, 2009. SFAS 165 (ASC 855-10-05) requires that public entities evaluate subsequent events through the date that the financial statements are issued. The Company has evaluated subsequent events through February 23, 2010.
Results of Operations
The following table shows the results of operations of our business.
Comparison of the three and six months ended June 30, 2010 and 2009
|
For the three months
Ended June 30,
|
For the six months
Ended June 30,
|
|||||||||||||||
|
2010
|
2009
|
2010
|
2009
|
|||||||||||||
| Sales | ||||||||||||||||
| External parties | $ | 105,627,764 | 202,182,241 | |||||||||||||
|
Related parties
|
26,369,453
|
47,186,862
|
||||||||||||||
|
Total Sales
|
$ |
131,997,217
|
$ |
249,369,103
|
||||||||||||
|
Cost of sales
|
||||||||||||||||
|
External parties
|
98,516,344
|
187,429,672
|
||||||||||||||
|
Related parties
|
24,835,031
|
44,478,145
|
||||||||||||||
|
Cost of sales
|
$ |
123,351,375
|
$ |
231,907,817
|
||||||||||||
|
Gross profit
|
8,645,842
|
-
|
17,461,286
|
-
|
||||||||||||
|
Operating expenses
|
||||||||||||||||
|
Selling expenses
|
258,901
|
-
|
343,413
|
-
|
||||||||||||
|
General and administrative expenses
|
1,213,080
|
709,161
|
2,018,612
|
1,236,593
|
||||||||||||
|
Total operating expenses
|
1,471,981
|
709,161
|
2,362,025
|
1,236,593
|
||||||||||||
|
Gain (loss) from operations
|
7,173,861
|
(709,161
|
)
|
15,099,261
|
(1,236,593
|
)
|
||||||||||
|
Other income (expenses):
|
||||||||||||||||
|
Interest expense, net
|
(1,589,937
|
)
|
(274,460
|
)
|
(2,663,462
|
)
|
(253,179
|
)
|
||||||||
|
Non-operating expenses
|
118,802
|
(138,257
|
)
|
9,599
|
(140,906
|
)
|
||||||||||
|
Total other expenses
|
(1,471,135
|
)
|
(412,717
|
)
|
(2,653,863)
|
(394,085
|
)
|
|||||||||
|
Income (loss) before provision for income tax
|
5,702,726
|
(1,121,878
|
)
|
12,445,398
|
1,630,678
|
)
|
||||||||||
|
Provision(benefit) for income tax
|
1,504,063
|
(280,470
|
)
|
3,191,577
|
(407,670
|
)
|
||||||||||
|
Income (net) loss
|
4,198,663
|
(841,408
|
)
|
9,253,821
|
(1,223,008
|
)
|
||||||||||
|
Other comprehensive income
|
||||||||||||||||
|
Foreign currency translation adjustment
|
192,224
|
9,160
|
193,948
|
(4,478
|
)
|
|||||||||||
|
Comprehensive income (loss)
|
$
|
4,390,887
|
$
|
(832,248
|
)
|
$
|
9,447,769
|
$
|
(1,227,486
|
)
|
||||||
Sales: Our sales for the three months ended June 30, 2010 were approximately $131,997,000 as compared to sales of $-0- for the three months ended June 30, 2009. Our sales for the six months ended June 30, 2010 were approximately $249,369,000 as compared to sales of $-0- for the six months ended June 30, 2009. The substantial increase in our sales was due to the start of trial production and distribution from September 2009 following completion of a long-term construction period that began in 2008. Our manufacturing plant is currently operating at full capacity and has sold approximately 300,700 MT of petrochemicals products in the first six months of our 2010 fiscal year. The breakdown of volume by products sold is listed below.
|
Product
|
Total Sale for Jan. 2010 to Jun 2010 (Unit: Metric Ton)
|
|
BTX Light Aromatics
|
137,304
|
|
BTX Heavy Aromatics
|
71,246
|
|
LPG
|
8,413
|
|
MTBE and Others
|
45,328
|
|
Styrene
|
18,131
|
|
Propylene
|
20,278
|
|
Total
|
300,700
|
39
Cost of Sales: For the three months ended June 30, 2010, our cost of sales was approximately $123,351,000 as compared to no cost of sales for the same period in 2009. Our cost of sales was approximately $231,908,000 for the six months ended June 30, 2010 and we had no cost of sales for the same period in 2009. Our cost of sales are primarily composed of the costs of raw materials (mainly heavy oil, benzene and carbinol), labor, depreciation and amortization of manufacturing equipment and facilities, and other overhead. The substantial increase in our cost of sales was due to the commencement of full scale production and distribution continuing from the fourth quarter of 2009.
Gross Profit: Gross profit for the three months ended June 30, 2010 was approximately $8,646,000 as compared to gross profit of $-0- for the comparable period in 2010. Our gross profit for the three months ended June 30, 2010 was due to the commencement of our production and sales activities. For the six months ended June 30, 2010, we generated gross profit of approximately $17,461,000. We had gross profit of nil for the comparable period in 2009. With the beginning of our normal production in the first quarter of year 2010, our cost of sales was lower than our revenue and we generated positive gross profit. We believe that we are beginning to capitalize on the investment in our infrastructure and this trend will continue during the remainder of our 2010 fiscal year and beyond. Management is looking to improve overall gross margin through higher production yield and favorable product mix. In the first six months of 2010, we experienced 23 days of loss of production due to power grid upgrade enforced by local utility agency. This has led to approximately $1.5 million loss in net profit.
Operating Expenses: Operating expenses including selling expenses, general and administrative expenses were approximately $1,472,000 for the three months ended June 30, 2010 as compared to roughly $709,000 for the same period in 2009, an increase of $763,000 or approximately 107%. Selling expenses were approximately $259,000 for the three months ended June 30, 2010 compared to selling expenses of $-0- for the comparable period in 2009. General and administrative expenses were approximately $1,213,000 for the three months ended June 30, 2010 compared to approximately $709,000 for the comparable period in 2009. The increase of these major expenses was mainly due to our commencement of production and distribution activities.
For the six months ended June 30, 2010, operating expenses including selling expenses, and general and administrative expenses, were approximately $2,362,000 as compared to roughly $1,237,000 for the comparable period in 2009. This was an increase of about $1,125,000 or almost 80%. Selling expenses were approximately $343,000 for the six months ended June 30, 2010, compared to selling expenses of $-0- for the comparable period in 2009. General and administrative expenses were roughly $2,018,000 and $1,237,000 for the six months ended March 31, 2010 and 2009, respectively. The increase of these major expenses was due to our commencement of production and distribution activities. Management expects that general and administrative expenses may continue to rise as we expand operations. Some of this expected increase will likely be due to various public company expenses including issuing stock options, stock compensations and legal expenses.
Interest Expense: Interest expense for the three months ended June 30, 2010 was roughly $1,590,000 compared to interest expense of $274,000 for the three months ended June 30, 2009. The increase in interest expense was primarily due to the significant increase of our short-term bank loans borrowed in 2009 and 2010 which were used to fund our working capital at the beginning of our production and distribution. For the six months ending June 30, 2010, interest expense was roughly $2,663,000 as compared to interest income of approximately $253,000 for the comparable period in 2009. The increase in interest expense was primarily due to the significant increase of our short-term bank loans borrowed in 2009 and 2010 which were used to fund our working capital at the beginning of our production and distribution. As we move forward with full operations and production, management believes that the interest expense will be less in remainder of 2010 fiscal year. However, interest expense could increase in future years if we are forced to fund most of our expansion plans via debt as opposed to additional equity and/or reinvestment of profits.
Net Income/loss: Net income for the three months ended June 30, 2010 was approximately $4,199,000 compared to net loss of $841,000 for the three months ended June 30, 2009, an increase of roughly $5,040,000. Net income for the six months ending June 30, 2010 was approximately $9,254,000 as compared to a net loss of approximately $1,223,000 in the same period in 2009. This increase was the result of the beginning of normal operations in 2010. Management believes that this trend will continue during our 2010 fiscal year and beyond.
Foreign Currency Translation Adjustment: Our reporting currency is U.S. dollar. Our local currency, Renminbi (RMB), is our functional currency. Results of operations and cash flow are translated at average exchange rates during the period while assets and liabilities are translated at the unified exchange rate as quoted by the People’s Bank of China at the end of the period. Translation adjustments resulting from this process are included in accumulated other comprehensive income in the statement of shareholders’ equity. Transaction gains and losses that arise from exchange rate fluctuations on transactions denominated in a currency other than the functional currency are included in the results of operations as incurred.
Currency translation adjustments resulting from this process are included in accumulated other comprehensive income in the consolidated statement of shareholders' equity and amounted to $192,000 for the three months ended June 30, 2010. The balance sheet amounts with the exception of equity at June 30, 2010 and December 31, 2009 were translated both at RMB 6.789 and RMB 6.817 to 1.00 U.S. dollar. The equity accounts were stated at their historical rate. The average translation rates applied to income statement accounts for the three months ended June 30, 2010 and 2009 were RMB 6.833 and RMB 6.840 to 1.00 U.S. dollar.
Currency translation adjustments resulting from this process are included in accumulated other comprehensive income in the consolidated statement of shareholders' equity and amounted to $194,000 for the six months end June 30, 2010. The balance sheet amounts with the exception of equity at June 30, 2010 were translated at RMB 6.789 to 1.00 U.S. dollar. The equity accounts were stated at their historical rate. The average translation rates applied to income statement accounts for the six months ended June 30, 2010 and 2009 were RMB 6.817 and RMB 6.823 to 1.00 U.S. dollar.
40
Financial Outlook for 2010: After a review of our business plan, sales and marketing efforts and expansion plans, we expect to generate sales of approximately US$550 million and net profit of approximately US$36 million in 2010. Gross margins are expected to improve in the second half of the year due to improved production yields and favorable product mix. This projection assumes average annual sales volume of 660,000 MT of petrochemical product sales in 2010.
Liquidity and Capital Resources
The following table sets forth a summary of our cash flows for the periods indicated:
|
For the Six Months Ending June 30,
|
||||||||
|
2010
|
2009
|
|||||||
|
Net cash provided by (used in) operating activities
|
10,278,999
|
(5,415,543
|
)
|
|||||
|
Net cash used in investing activities
|
(17,084,658
|
)
|
(25,770,639
|
)
|
||||
|
Net cash provided by (used in) financing activities
|
(1,739,200
|
)
|
40,657,038
|
|||||
Net cash provided by operating activities was roughly $10,279,000 for the six months ending June 30, 2010 as compared to net cash used in operations of approximately $5,416,000 for the same period in 2009. The increase in cash provided by operations was primarily due to the beginning of normal production and distribution. During 2009, we were in the final stages of completing our long-term construction period and had yet to begin normal operations.
Net cash used in investing activities was approximately $17,085,000 and $25,771,000 for the six months ending June 30, 2010 and 2009. During 2010, net cash used in investing activities was primarily focused on payments for the infrastructure construction. During 2009, we were still in the final part of our development stage in which large amounts of money were continuously invested in building construction and equipment installation. As we move forward with our Expansion Plans, it is expected net cash used in investing activities could increase in the second half of our 2010 fiscal year including $9 million payment for the initial construction cost of the expansion project, $8 million for land purchases and $15 million for payments of previous construction costs.
Net cash used in financing activities amounted to approximately $1,739,000 for the six month ended June 30, 2010. For the six months ended June 30, 2010, net cash provided by financing activities amounted to approximately $40,657,000 for the same period in 2009. The increase in net cash used was mainly the result of letter of credit deposit for purchase of imported raw materials. In 2009, the net cash provided by financing activities was primarily the result of short-term bank Loans.
.We have entered into loan agreements with our primary lenders including but not limited to Bank of China, China Construction Bank and Agricultural Bank of China under which we have term loans. As of June 30, 2010, we had an aggregate principal amount of approximately $83,961,000 outstanding under the loan agreements, with maturity dates from July 2010 to May 2011 and interest rates from 4.46% to 5.31% per annum. The loan agreements contain customary affirmative and negative covenants and are mainly guaranteed by third parties and individual persons or secured by a lien on our property and equipment. Historically, all debts due have been paid back by the Company in a timely manner. All Short-Term Bank Loans are revolving loans whose terms (at due date of payment) are extended by the lender. As of June 30, 2010, we were in material compliance with the terms of our loan agreements. As such, management expects all unpaid loan balances will be extended at due date.
At June 30, 2010, we had a cash balance of approximately $39,331,000. Prior to the completion of our initial preferred stock financing, working capital had been primarily financed with various forms of short and long bank loan as outlined above. As of June 30, 2010, we had retained deficit of roughly $1,411,000 as compared to a retained deficit of approximately $10,665,000 as of December 31, 2009.
In order to develop our business to meet the increasing customer purchase orders, our management team has made plans to expand our manufacturing capacity to include a raw material pre-treatment facility, additional storage capacity and an asphalt production facility. The estimated overall cost of Expansion Plans and the addition of asphalt development is approximately $78 million including $8 million for purchasing land, $20 million for facility construction, $40 million for new equipment and $10 million for working capital for the whole business. In addition, we plan to build a new facility to produce SBS, a high margin product with major application for footwear, adhesive, polymer modification and modified asphalt industries. The estimated overall cost of SBS project is around $17.5 million.
We plan to be funded the aforementioned expansion projects through short-term borrowings, cash from operations and potential equity financing. However, our ability to obtain additional capital on acceptable terms is subject to a variety of uncertainties, including but not limited to:
|
●
|
investors’ perception of, and demand for, securities of petrochemical manufacturing and supply companies;
|
|
●
|
conditions of the U.S. and other capital markets in which we may seek to raise funds;
|
|
●
|
our future results of operations, financial condition and cash flow;
|
|
●
|
PRC governmental regulation of foreign investment in petrochemical manufacturing companies in China;
|
|
●
|
economic, political and other conditions in China; and
|
|
●
|
PRC governmental policies relating to foreign currency borrowings.
|
If we are unable to obtain funding with acceptable terms, or at all, our ability to increase our production capacity and expand our business could be adversely affected.
41
|
ITEM 3.
|
QUANTITATIVE AND QUALITATIVE DISCLOSURES ABOUT MARKET RISK
|
Not applicable to smaller reporting companies.
|
ITEM 4.
|
CONTROLS AND PROCEDURES
|
Disclosure Controls and Procedures
We maintain disclosure controls and procedures designed to provide reasonable assurance that material information required to be disclosed by us in the reports we file or submit under the Securities Exchange Act of 1934 is recorded, processed, summarized and reported within the time periods specified in the SEC’s rules and forms, and that the information is accumulated and communicated to our management, including our Chief Executive Officer and Chief Financial Officer, as appropriate to allow timely decisions regarding required disclosure. We performed an evaluation, under the supervision and with the participation of our management, including our Chief Executive Officer and Chief Financial Officer, of the effectiveness of the design and operation of our disclosure controls and procedures as of the end of the period covered by this report. At the time we originally filed this report, based on their evaluation, our management, including our Chief Executive Officer and Chief Financial Officer, concluded that our disclosure controls and procedures were effective in giving us reasonable assurance that the information we are required to disclose in the reports we file or submit under the Exchange Act is recorded, processed, summarized and reported, within the time periods specified in the Commission's rules and forms and to ensure that such information is accumulated and communicated to our management, including our principal executive and principal financial officers, or persons performing similar functions, as appropriate to allow timely decisions regarding required disclosure. However, as a result of certain events discussed below, as of the date of this amended report, management currently believes that we have a material weakness.
We do not expect that our disclosure controls and procedures will prevent all errors and all instances of fraud. Disclosure controls and procedures, no matter how well conceived and operated, can provide only reasonable, not absolute, assurance that the objectives of the disclosure controls and procedures are met. Further, the design of disclosure controls and procedures must reflect the fact that there are resource constraints, and the benefits must be considered relative to their costs. Because of the inherent limitations in all disclosure controls and procedures, no evaluation of disclosure controls and procedures can provide absolute assurance that we have detected all our control deficiencies and instances of fraud, if any. The design of disclosure controls and procedures also is based partly on certain assumptions about the likelihood of future events, and there can be no assurance that any design will succeed in achieving its stated goals under all potential future conditions.
Changes in Internal Control Over Financial Reporting
In connection with the preparation of our Form 10-K for the period ended December 31, 2010, our former auditors, KPMG, raised certain issues, which were primarily related to issues regarding certain cash transactions and recorded sales. As a result, our Audit Committee elected to commence an independent investigation and engaged the services of independent counsel, Pillsbury Winthrop Shaw Pittman LLP, which in turn engaged the services of Deloitte Financial Advisory Services LLP, as independent forensic accountants, and King & Wood, as Audit Committee counsel in China. As a result of the investigation, the Audit Committee identified a number of issues that may have a material impact on our internal controls and procedures over financial reporting.
As a result of the findings of the Audit Committee and its review of our controls and procedures, management has concluded that the Company continues to have material weaknesses. A material weakness is a control deficiency, or combination of control deficiencies, that results in more than a remote likelihood that a material misstatement of the financial statements will not be prevented or detected. Management identified the following material weaknesses during its assessment of our internal control over financial reporting as of December 31, 2010:
1) Lack of sufficient knowledge of U.S. GAAP reporting by our existing accounting staff;
2) Lack of sufficient accounting staff which results in a lack of segregation of duties necessary for an efficient internal control system;
3) Lack of a sufficient number of personnel appropriately qualified to perform control monitoring activities;
4) Lack of internal control consciousness and awareness by individuals responsible for certain key control activities, including:
a) Lack of sufficient documentation of our existing financial processes, risk assessment and internal controls;
b) Inadequate procedures for identifying and disclosing related party transactions;
c) Inadequate controls with regard to certain banking and loan transactions; and
d) Inadequate disclosure and accounting for certain off balance sheet transactions.
5) Inadequate training and training programs;
6) A Chief Financial Officer (CFO) for Chinese operations that did not report to the Company’s CFO;
7) Lack of Audit Committee oversight prior to its formation in July 2010; and
7) Lack of necessary senior management oversight and monitoring of the accounting functions of the organization, and because the company completed a reverse merger in April 2010, senior management lacked the background, skills and experience to meet the reporting requirements of a US listed company.
42
As a result, the Company has taken and has begun to take the following measures to remediate the material weaknesses:
1) A review of the responsibilities of senior management and a restructuring of our organization chart in order to provide for proper segregation of duties, including but not limited to:
|
a)
|
Restructuring of our accounting department, and streamlining the department’s roles to ensure that the CFO maintains adequate oversight; and
|
|
b)
|
Termination of Mr. Xue in August 2011, our former Vice President of Accounting/ PRC CFO and hiring of Mr. Fan Zhang as Vice President of Accounting/PRC CFO.
|
2) Continued and careful evaluation of control processes and systems by the Audit Committee, the Board of Directors and Management, including but not limited to:
|
a)
|
Engagement of a compliance officer to monitor the Company’s corporate governance and compliance, reporting directly to the Audit Committee;
|
|
b)
|
Evaluation of the duties and responsibilities of the CEO and his role in day-to-day operations of the Company and the control environment;
|
|
c)
|
Engagement of an outside consultant to assist with SOX 404 compliance; and
|
|
d)
|
The addition of one or one or more additional independent, bilingual Chinese-speaking directors to facilitate the Board oversight and assist and augment the efforts of the current independent directors.
|
3) Implementation of additional controls and procedures to ensure the preparation and review of complete and transparent US GAAP financial statements in a timely and efficient manner, including but not limited to:
|
a)
|
Additional training in U.S. GAAP for our accounting staff; and
|
|
b)
|
Hiring of additional qualified accounting personnel, including an experienced controller.
|
4) Cessation of the use of an off-balance sheet cash account and the adoption of policies and procedures to prevent the future use of off balance sheet accounts;
5) Implementation of new procedures for the identification and approval of and appropriate disclosure of potential related party transactions;
6) Implementation of new policies and procedures to ensure that all transactions are supported by sufficient documentation;
7) Development and implementation of policies and procedures that provide continuous risk assessment of legal and regulatory considerations related to business activities;
8) Development of policies to ensure that all identified contingencies are evaluated completely and in a timely manner;
9) Development and implementation of policies and procedures to ensure that revenues are properly recorded and all invoices are appropriately reviewed by accounting personnel;
10) Implementation of policies and procedures to ensure inventory purchases are properly recorded;
11) Implementation of policies and procedures to ensure that all liabilities are recorded on the proper period;
12) Development and implementation of policies and procedures to ensure that financial information is appropriately shared during inter-departmental meetings; and
13) Planned adoption of a Corporate Best Practices Manual;
43
We believe that the remediation measures we are taking, if effectively implemented and maintained, will remediate the material weaknesses discussed above.
Except as described above, there have been no changes in our internal controls over financial reporting that occurred during our last fiscal quarter to which this Quarterly Report on Form 10-Q/A3 relates that have materially affected, or are reasonably likely to materially affect our internal controls over financial reporting.
44
PART II - OTHER INFORMATION
|
ITEM 1.
|
Legal Proceedings
|
None.
|
Item 1A.
|
Risk Factors
|
Not applicable to smaller reporting companies.
|
ITEM 2.
|
Unregistered Sales of Equity Securities and Use of Proceeds
|
(a) Not Applicable.
(b) Not Applicable.
(c ) Not Applicable
|
ITEM 3.
|
Defaults upon Senior Securities
|
(a) Not Applicable.
(b) Not Applicable.
|
ITEM 4.
|
(Removed and Reserved)
|
|
ITEM 5.
|
OTHER INFORMATION
|
(a) Not applicable.
(b) Not applicable.
|
ITEM 6.
|
EXHIBITS
|
(a) The following exhibits are filed as part of this report.
|
Exhibit No.
|
Document
|
|
3.1
|
Articles of Incorporation, as amended (Incorporated by reference to Exhibit 3.1 to the Company’s Amendment No.1 to Form S-1 filed on July 23, 2010).
|
|
3.2
|
Articles of Merger (incorporated by reference to Exhibit 3.1 of the Registrant’s Form 8-K filed on May 19, 2010)
|
|
3.3
|
Amended Bylaws of Keyuan Petrochemicals, Inc. dated June 29, 2010 (incorporated by reference to Exhibit 3.1 of the Registrant’s Form 8-K filed on July 7, 2010)
|
|
31.1
|
Certification of Chief Executive Officer required by Rule 13a-14/15d-14(a) under the Exchange Act
|
|
31.2
|
Certification of Chief Financial Officer required by Rule 13a-14/15d-14(a) under the Exchange Act
|
|
32.1
|
Certification of Chief Executive Officer pursuant to 18 U.S.C. Section 1350, as adopted pursuant to Section 906 of the Sarbanes-Oxley Act of 2002.
|
|
32.2
|
Certification of Chief Financial Officer pursuant to 18 U.S.C. Section 1350, as adopted pursuant to Section 906 of the Sarbanes-Oxley Act of 2002.
|
|
32.3
|
Certification pursuant to 18 U.S.C. Section 1350, as adopted pursuant to Section 906 of the Sarbanes-Oxley Act of 2002.
|
45
SIGNATURES
In accordance with the requirements of the Exchange Act, the registrant caused this report to be signed on its behalf by the undersigned, thereunto duly authorized.
|
Date: November 1, 2011
|
Keyuan Petrochemicals, Inc.
|
|
By: /s/ Chunfeng Tao
|
|
|
Chunfeng Tao
|
|
|
Chief Executive Officer & President
|
|
|
By: /s/ Fan Zhang
|
|
|
Fan Zhang
Acting Chief Financial Officer/Vice President of Accounting
|
|
46