Attached files
| file | filename |
|---|---|
| EX-32.1 - CERTIFICATION - Keyuan Petrochemicals, Inc. | f10q0316ex32i_keyuanpetro.htm |
| EX-31.1 - CERTIFICATION - Keyuan Petrochemicals, Inc. | f10q0316ex31i_keyuanpetro.htm |
U.S. SECURITIES AND EXCHANGE COMMISSION
WASHINGTON, D.C. 20549
FORM 10-Q
(Mark One)
☒ QUARTERLY REPORT PURSUANT TO SECTION 13 OR 15(d) OF THE SECURITIES EXCHANGE ACT OF 1934
For the quarterly period ended March 31, 2016
☐ TRANSITION REPORT PURSUANT TO SECTION 13 OR 15(d) OF THE SECURITIES EXCHANGE ACT OF 1934
For the transition period from _______________ to _______________
Commission File Number: 333-124837
Keyuan Petrochemicals, Inc.
(Exact name of registrant as specified in its charter)
| Nevada | 45-0538522 | |
(State
or other jurisdiction of |
(IRS
Employer |
Qingshi Industrial Park
Ningbo Economic & Technological Development Zone
Ningbo, Zhejiang Province
P.R. China 315803
(Address of principal executive office)
(86) 574-8623-2955
(Issuer's telephone number)
(Former name, former address and former fiscal year, if changed since last report)
Indicate by check mark whether the registrant (1) has filed all reports required to be filed by Section 13 or 15(d) of the Securities Exchange Act of 1934 during the past 12 months (or for such shorter period that the registrant was required to file such reports), and (2) has been subject to such filing requirements for the past 90 days. Yes☐ No ☒
Indicate by check mark whether the registrant has submitted electronically and posted on its corporate Web site, if any, every Interactive Data File required to be submitted and posted pursuant to Rule 405 of Regulation S-T (Sec. 232.405 of this chapter) during the preceding 12 months (or for such shorter period that the registrant was required to submit and post such files). Yes ☐ No ☒
Indicate by check mark whether the registrant is a large accelerated filer, an accelerated filer, a non-accelerated filer, or a smaller reporting company. See the definitions of “larger accelerated filer”, “accelerated filer” and “smaller reporting company” in Rule 12b-2 of the Exchange Act.
| Large Accelerated Filer | ☐ | Accelerated Filer | ☐ |
| Non-accelerated filer | ☐ | Smaller reporting company | ☒ |
Indicate by check mark whether the registrant is a shell company (as defined in Rule 12b-2 of the Securities Exchange Act of 1934) Yes ☐ No ☒
As of November 3, 2016, the Registrant has 63,132,726 shares of common stock outstanding.
TABLE OF CONTENTS
| PART I – FINANCIAL INFORMATION | ||
| Item 1. | Financial Statements. | 1 |
| Condensed Consolidated Balance Sheets | 1 | |
Condensed Consolidated Statements of Operations and Comprehensive Income (Loss) |
2 | |
| Condensed Consolidated Statements of Cash Flows | 3 | |
| Notes to Condensed Consolidated Financial Statements | 4 -14 | |
| Item 2. | Management’s Discussion and Analysis of Financial Condition and Results of Operations. | 15 |
| Item 3. | Quantitative and Qualitative Disclosures About Market Risk. | 25 |
| Item 4. | Controls and Procedures. | 25 |
| PART II – OTHER INFORMATION | 26 | |
| Item 1. | Legal Proceedings. | 26 |
| Item 1A. | Risk Factors. | 26 |
| Item 2. | Unregistered Sales of Equity Securities And Use Of Proceeds. | 27 |
| Item 3. | Defaults Upon Senior Securities. | 27 |
| Item 4. | Mine Safety Disclosures. | 27 |
| Item 5. | Other Information. | 27 |
| Item 6. | Exhibits. | 27 |
INTRODUCTORY NOTE
Except as otherwise indicated by the context, references in this quarterly report on Form 10-Q (this “Form 10-Q”) to “Keyuan”, “we”, “us” or “our” are references to the combined business of Keyuan Petrochemicals, Inc. and its consolidated subsidiaries. References to the “Company” are references to Keyuan Petrochemicals, Inc., a Nevada corporation; references to “Sinotech Group” are references to our wholly-owned subsidiary, Sinotech Group Limited, a British Virgin Islands company, previously known as Keyuan International Group Limited; references to “Keyuan HK” are references to our wholly-owned Hong Kong subsidiary, Keyuan Group Limited; references to “Ningbo Keyuan” are references to our wholly-owned subsidiary, Ningbo Keyuan Plastics Co., Ltd., a Chinese company; references to “Ningbo Keyuan Petrochemicals” are references to our wholly-owned subsidiary, Ningbo Keyuan Petrochemicals Co., Ltd., a Chinese company; references to “Keyuan Synthetic Rubbers” are references to our wholly-owned subsidiary, Ningbo Keyuan Synthetic Rubbers Co., Ltd., a Chinese company; references to “Guangxi Keyuan” are references to our partially-owned subsidiary, Guangxi Keyuan New Materials Co., Ltd. (we own 67.1% as if Hengyun Energy has already made full payment under the Investment Cooperation Agreement as described herein below), a Chinese company; and references to “Zhongkexuneng” are references to our wholly-owned subsidiary, Zhejiang Zhongkexuneng Trading Co., Ltd, a Chinese company. A structure chart is found in Item 2. References to “China” or “PRC” are references to the People’s Republic of China. References to “RMB” are to Renminbi, the legal currency of China, and all references to “$” and dollar are to the U.S. dollar, the legal currency of the United States of America.
Special Note Regarding Forward-Looking Statements
This report contains forward-looking statements and information that are based on the beliefs of our management as well as assumptions made by and information currently available to us. Such statements should not be unduly relied upon. Forward-looking statements include statements about our expectations, beliefs, plans, objectives, intentions, assumptions and other statements that are not historical facts or that are not present facts or conditions. Forward-looking statements and information can generally be identified by the use of forward-looking terminology or words, such as “anticipate,” “approximately,” “believe,” “continue,” “estimate,” “expect,” “forecast,” “intend,” “may,” “ongoing,” “pending,” “perceive,” “plan,” “potential,” “predict,” “project,” “seek,” “should,” “views” or similar words or phrases or variations thereon, or the negatives of those words or phrases, or statements that events, conditions or results “can,” “will,” “may,” “must,” “would,” “could” or “should” occur or be achieved and similar expressions in connection with any discussion, expectation or projection of future operating or financial performance, costs, regulations, events or trends. The absence of these words does not necessarily mean that a statement is not forward-looking.
Forward-looking statements and information are based on management’s current expectations and assumptions, which are inherently subject to uncertainties, risks and changes in circumstances that are difficult to predict. These statements reflect our current view concerning future events and are subject to risks, uncertainties and assumptions. There are important factors that could cause actual results to vary materially from those described in this report as anticipated, estimated or expected, including, but not limited to, those factors and conditions described under “Item 1A. Risk Factors” in our annual report on Form 10-K for the fiscal years ended December 31, 2015 and 2014 (the “Form 10-K”) as well as general conditions in the economy, petrochemicals industry and capital markets, Securities and Exchange Commission (the “SEC”) regulations that affect trading in the securities of “penny stocks,” and other risks and uncertainties. Except as required by law, we assume no obligation to update any forward-looking statements publicly, or to update the reasons actual results could differ materially from those anticipated in any forward-looking statements, even if new information becomes available in the future. Depending on the market for our stock and other conditional tests, a specific safe harbor under the Private Securities Litigation Reform Act of 1995 may be available. Notwithstanding the above, Section 27A of the Securities Act of 1933, as amended (the “Securities Act”), and Section 21E of the Securities Exchange Act of 1934, as amended (the “Exchange Act”), expressly state that the safe harbor for forward-looking statements does not apply to companies that issue penny stock. Because we may from time to time be considered to be an issuer of penny stock, the safe harbor for forward-looking statements may not apply to us at certain times.
PART I – FINANCIAL INFORMATION.
KEYUAN PETROCHEMICALS, INC. AND SUBSIDIAIRES
CONDENSED CONSOLIDATED BALANCE SHEETS
(Amounts in thousands, except share data)
| Note | March 31, 2016 | December 31, 2015 | ||||||||||
| (Unaudited) | ||||||||||||
| ASSETS | ||||||||||||
| Current assets: | ||||||||||||
| Cash | $ | 11,013 | $ | 4,764 | ||||||||
| Pledged bank deposits | 258,335 | 282,968 | ||||||||||
| Notes receivable | 694 | 735 | ||||||||||
| Accounts receivable, net | 19,375 | 23,398 | ||||||||||
| Inventories | 3 | 28,888 | 55,730 | |||||||||
| Prepayments to suppliers, net | 121,455 | 80,077 | ||||||||||
| Consumption tax recoverable | 4 | 54,122 | 44,377 | |||||||||
| Amounts due from related parties | 15 | 44 | 92 | |||||||||
| Amounts due from non-controlling interests | 12,088 | 19,376 | ||||||||||
| Other current assets | 5 | 20,119 | 19,049 | |||||||||
| Total current assets | 526,133 | 530,566 | ||||||||||
| Property, plant and equipment, net | 281,794 | 273,146 | ||||||||||
| Intangible assets, net | 976 | 1,021 | ||||||||||
| Land use rights | 23,690 | 23,757 | ||||||||||
Value added tax recoverable | 1,228 | 1,205 | ||||||||||
| Total assets | $ | 833,821 | $ | 829,695 | ||||||||
| LIABILITIES AND DEFICIT | ||||||||||||
| Current Liabilities: | ||||||||||||
| Short-term bank borrowings | 6 | $ | 318,447 | $ | 360,720 | |||||||
| Notes payable | 7 | 368,754 | 334,139 | |||||||||
| Accounts payable | 53,777 | 52,820 | ||||||||||
| Amounts due to related parties | 15 | 5,265 | 5,330 | |||||||||
| Amounts due to non-controlling interest | 34 | - | ||||||||||
| Advances from customers | 19,569 | 15,563 | ||||||||||
| Accrued expenses and other payables | 8 | 48,731 | 42,654 | |||||||||
| Income tax payable | 1,930 | 1,596 | ||||||||||
| Dividends payable | 2,382 | 2,382 | ||||||||||
Total current liabilities | 818,889 | 815,204 | ||||||||||
| Long-term debt | 15,477 | 15,400 | ||||||||||
| Total liabilities | 834,366 | 830,604 | ||||||||||
| Stockholders’ deficit: | ||||||||||||
| Common stock: | ||||||||||||
| Par value: $0.001; Authorized: 100,000,000 shares Issued 57,646,160; outstanding: 57,221,050 as at March 31, 2016 and December 31, 2015 | 58 | 58 | ||||||||||
| Additional paid-in capital | 70,917 | 70,917 | ||||||||||
| Statutory reserve | 6,114 | 6,109 | ||||||||||
| Accumulated other comprehensive income | 6,853 | 7,098 | ||||||||||
| Consideration receivable | (9,417 | ) | (9,417 | ) | ||||||||
| Accumulated deficit | (101,063 | ) | (101,594 | ) | ||||||||
| Treasury stock, at cost, 425,110 shares at March 31, 2016 and December 31, 2015 | (449 | ) | (449 | ) | ||||||||
| Total stockholders’ deficit | (26,987 | ) | (27,278 | ) | ||||||||
| Non-controlling interests | 26,442 | 26,369 | ||||||||||
| Total deficit | (545 | ) | (909 | ) | ||||||||
| Total liabilities and deficit | $ | 833,821 | $ | 829,695 | ||||||||
See accompanying notes to the condensed consolidated financial statements.
| 1 |
KEYUAN PETROCHEMICALS, INC. AND SUBSIDIARIES
CONDENSED CONSOLIDATED STATEMENTS OF OPERATIONS AND COMPREHENSIVE INCOME (LOSS) (UNAUDITED)
(Amounts in thousands, except share and per share data)
| Three Months Ended March 31, | ||||||||
| 2016 | 2015 | |||||||
| Sales | $ | 86,339 | $ | 58,282 | ||||
| Cost of sales | 74,084 | 78,843 | ||||||
| Gross profit (loss) | 12,255 | (20,561 | ) | |||||
| Selling expenses | 889 | 234 | ||||||
| General and administration expenses | 4,030 | 4,642 | ||||||
| Total operating expenses | 4,919 | 4,876 | ||||||
| Income (loss) from operations | 7,336 | (25,437 | ) | |||||
| Other income (expense): | ||||||||
| Interest income | 1,975 | 3,325 | ||||||
| Interest expense | (6,400 | ) | (8,348 | ) | ||||
| Foreign exchange loss, net | (1,334 | ) | (9,408 | ) | ||||
| Other expense, net | (152 | ) | (8,057 | ) | ||||
| Total other expense, net | (5,911 | ) | (22,488 | ) | ||||
| Income (loss) before income taxes | 1,425 | (47,925 | ) | |||||
| Income tax expense (benefit) | 996 | (68 | ) | |||||
| Net income (loss) | 429 | (47,857 | ) | |||||
| Net loss attributable to non-controlling interests | (107 | ) | - | |||||
| Net income (loss) attributable to Keyuan Petrochemicals Inc. common stockholders | $ | 536 | $ | (47,857 | ) | |||
Net income (loss) | $ | 429 | $ | (47,857 | ) | |||
| Other comprehensive income (loss): | ||||||||
| Foreign currency translation adjustment | (245 | ) | (479 | ) | ||||
| Comprehensive income (loss) | $ | 184 | $ | (48,336 | ) | |||
| Comprehensive loss attributable to non-controlling interest | (107 | ) | - | |||||
| Comprehensive income (loss) attributable to Keyuan Petrochemicals Inc. common stockholders | 291 | (48,336 | ) | |||||
| Earning (loss) per share: | ||||||||
| Attributable to common stock: | ||||||||
| -Basic | $ | 0.009 | $ | (0.84 | ) | |||
| -Diluted | $ | 0.009 | $ | (0.84 | ) | |||
| Weighted average number of shares of common stock used in calculation: | ||||||||
| -Basic | 57,221,050 | 57,221,050 | ||||||
| -Diluted | 57,221,050 | 57,221,050 | ||||||
See accompanying notes to the condensed consolidated financial statements.
| 2 |
KEYUAN PETROCHEMICALS, INC. AND SUBSIDIARIES
CONDENSED CONSOLIDATED STATEMENTS OF CASH FLOWS (UNAUDITED)
(Amounts in thousands, except share data)
| Three months ended March 31, | ||||||||
| 2016 | 2015 | |||||||
| Cash flows from operating activities: | ||||||||
Net income (loss) | $ | 429 | $ | (47,857 | ) | |||
| Adjustments to reconcile net income (loss) to net cash provided by (used in) operating activities: | ||||||||
| Depreciation | 3,779 | 3,788 | ||||||
| Amortization | 81 | 37 | ||||||
| Bad debt expense | 12 | 2,473 | ||||||
| Land use rights amortization | 184 | 194 | ||||||
| Deferred income tax benefit | - | (153 | ) | |||||
| Changes in operating assets and liabilities: | ||||||||
| Notes receivable | 44 | (146 | ) | |||||
| Accounts receivable | 4,090 | (23,958 | ) | |||||
| Inventories | 26,845 | 30,847 | ||||||
| Prepayments to suppliers | (42,375 | ) | (6,060 | ) | ||||
| Consumption tax refund receivable | (9,425 | ) | 3,826 | |||||
| Other current assets | 1,975 | 80,963 | ||||||
| Accounts payable | 2,183 | 18,382 | ||||||
| Amounts due from (to) related parties | 13,084 | (26,189 | ) | |||||
| Advances from customers | 3,945 | 9,766 | ||||||
| Income taxes payable | 322 | (53 | ) | |||||
| Accrued expenses and other payables | 1,135 | (83,651 | ) | |||||
| Pledged deposit for operating activities | (389 | ) | (22,922 | ) | ||||
| Net cash provided by (used in) operating activities | 5,919 | (60,713 | ) | |||||
| Cash flows from investing activities: | ||||||||
| Purchase of property, plant and equipment | (10,983 | ) | (938 | ) | ||||
| Net cash used in investing activities | (10,983 | ) | (938 | ) | ||||
| Cash flow from financing activities: | ||||||||
| Pledged bank deposits used for bank borrowings | 25,022 | 21,813 | ||||||
| Proceeds from short-term bank borrowings | 142,086 | 292,931 | ||||||
| Repayment of short-term bank borrowings | (185,718 | ) | (282,464 | ) | ||||
| Proceeds from bank notes | 141,536 | 108,674 | ||||||
| Repayments of bank notes | (108,932 | ) | (94,400 | ) | ||||
| Net cash provided by financing activities | 13,994 | 46,554 | ||||||
| Effect of foreign currency exchange rate changes on cash | (2,681 | ) | 15,366 | |||||
| Net increase in cash | 6,249 | 269 | ||||||
| Cash at beginning of period | 4,764 | 870 | ||||||
| Cash at end of period | $ | 11,013 | $ | 1,139 | ||||
| Supplemental disclosure of cash flow information: | ||||||||
| Income tax paid | $ | 681 | $ | 53 | ||||
| Interest paid, net of capitalized interest | $ | 7,859 | $ | 7,092 | ||||
| Non cash investing and financing activities: | ||||||||
| Amount not yet paid for purchase of property, plant and equipment (net of VAT) | $ | 147 | $ | (691 | ) | |||
See accompanying notes to the condensed consolidated financial statements.
| 3 |
| 1. | ORGANIZATION AND NATURE OF BUSINESS, RECENT EVENTS, AND GOING CONCERN AND MANAGEMENT’S PLANS |
(a) Organization and Nature of business
Keyuan Petrochemicals, Inc. (the “Company”) was incorporated in the State of Texas on May 4, 2004 in the former name of Silver Pearl Enterprises, Inc. The Company, through its wholly-owned subsidiary, Sinotech Group Limited (“Sinotech Group”) and its indirect subsidiaries, Keyuan Group Limited (“Keyuan HK”), Ningbo Keyuan Plastics Co., Ltd. (“Ningbo Keyuan”), Ningbo Keyuan Petrochemicals Co., Ltd. (“Ningbo Keyuan Petrochemicals”), Ningbo Keyuan Synthetic Rubbers Co., Ltd. (“Keyuan Synthetic Rubbers”), Zhejiang Zhongkexuneng Trading Co. (“Zhongkexuneng”) and Guangxi Keyuan New Materials Co., Ltd. (“Guangxi Keyuan”) (collectively referred herein below as “the Group”) are engaged in the manufacture and sale of petrochemical and rubber products in the People’s Republic of China (“PRC”).
(b) Financial condition, liquidity and capital resources
Despite of the Company’s continuous efforts in realignment of product profiles and the fact that the petrochemical industry in China has been stabilized since 2015, the Company reported a net income of approximately $0.4 million and a net loss of approximately $60.5 million for the three months ended March 31, 2016 and for the year ended December 31, 2015, respectively. In addition, cash flows provided by operations were approximately $5.9 million for the three months ended March 31, 2016 and cash flows used in operations were approximately $112.5 million for the year ended December 31, 2015, respectively. At March 31, 2016 and December 31, 2015, the Company had a working capital deficit of approximately $292.8 million and $284.6 million, respectively.
Consequently, there is substantial doubt about the company’s ability to continue as a going concern.
The Company continues to finance and support its operations primarily through short-term bank borrowings. Short-term bank borrowings and notes payable amounted to approximately $687 and $695 million at March 31, 2016 and December 31, 2015, respectively. In addition, the Group continues to benefit from favorable PRC tax policies related to consumption tax. As of March 31, 2016, the Group had consumption tax refund receivables of approximately $54.1 million which have been fully refunded to the Group as of the date of this Form 10-Q.
The Company is exploring sources of additional financing, including short-term financing from its vendors and other parties and equity financing. In addition, the Company is closely monitoring its cash balances, cash needs and expense levels.
The ability of the Company to continue as a going concern is dependent upon management’s ability to implement its expansion plan - particularly the Guangxi project - to increase production capacity, obtain additional capital and generate net income and positive cash flows from operations. There can be no assurance that these plans will be sufficient or that additional financing will be available in amounts or terms acceptable to the Company, if at all.
| 4 |
| 2 | BASIS OF PRESENTATION |
The accompanying unaudited condensed consolidated financial statements have been prepared in accordance with U.S. generally accepted accounting principles (“U.S. GAAP”) and include the consolidated financial statements of the Company and its subsidiaries. All intercompany balances and transactions are eliminated in consolidation. The consolidated financial statements have been prepared in accordance with U.S. GAAP applicable to interim financial information and the requirements of Form 10-Q and Article 10 of Regulation S-X of the Securities and Exchange Commission. Accordingly, they do not include all of the information and disclosures required by accounting principles generally accepted in the United States of America for complete financial statements. These interim financial statements should be read in conjunction with the audited consolidated financial statements for the years ended December 31, 2015 and 2014, as not all disclosures required by generally accepted accounting principles for annual financial statements are presented. The interim financial statements follow the same accounting policies and methods of computation as the audited consolidated financial statements for the years ended December 31, 2015 and 2014. Interim results are not necessarily indicative of results for a full year. In the opinion of management, all adjustments, consisting of normal recurring adjustments, considered necessary for a fair presentation of the financial position and the results of operations and cash flows for the interim periods have been included.
| 3 | INVENTORIES |
Inventories consist of the following:
| March 31, | December 31, | |||||||
| 2016 | 2015 | |||||||
| ($’000) | ($’000) | |||||||
| (Unaudited) | ||||||||
| Raw materials | $ | 7,665 | $ | 34,116 | ||||
| Finished goods | 17,215 | 18,003 | ||||||
| Work-in-process | 4,008 | 3,611 | ||||||
| Total | $ | 28,888 | $ | 55,730 | ||||
| 4 | CONSUMPTION TAX REFUND RECEIVABLE |
The PRC government enacted a regulation pursuant to which domestically purchased heavy oil to be used for producing ethylene and aromatics products was exempted from consumption tax. In addition, the consumption tax paid for imported heavy oil is to be refunded if it is used for producing ethylene and aromatics products. Because all the Group’s purchased heavy oils are, or are to be, used for producing ethylene and aromatics products, the Group recognizes a consumption tax recoverable when a consumption tax for heavy oils has been paid and the relevant heavy oils have been used for producing ethylene and aromatics products. At March 31, 2016 and December 31, 2015, the Group recorded an estimated consumption tax refund receivables amounting to approximately $54.1 million and $44.4 million, respectively. The balances as of March 31, 2016 have been fully refunded to the Group as of the date of this Form 10-Q.
| 5 |
| 5 | OTHER CURRENT ASSETS |
Other current assets consist of the following:
| March 31, | December 31, | |||||||
| 2016 | 2015 | |||||||
| ($’000) | ($’000) | |||||||
| (Unaudited) | ||||||||
| VAT recoverable | $ | 11,740 | $ | 10,397 | ||||
| Deposit paid to suppliers | 2,773 | 3,907 | ||||||
| Others | 5,606 | 4,745 | ||||||
| $ | 20,119 | $ | 19,049 | |||||
Management estimates the deductible input value added tax (“VAT”) using vendor contracts, engineering and other estimates, as well as historical experience.
Customs deposits for imported inventories represent amounts paid to the local customs office in connection with the import of raw materials inventories. Upon approval by the customs authorities, these amounts become refundable by the local tax authority and are reclassified as consumption tax refund receivable (Note 4).
| 6 | SHORT-TERM BANK BORROWINGS AND LONG TERM DEBT |
As of March 31, 2016 and December 31, 2015 short-term bank borrowings outstanding carried a weighted average interest rate of 4.7% and 5.3%, respectively, for bank loans in RMB; a weighted average interest rate of 2.5% and 2.4%, respectively, for bank loans in USD, maturity terms ranging from two to twelve months, and interest rates ranging from 2.7% to 6.0% and 1.9% to 6.9%, respectively.
Short-term bank borrowings consist of the following:
| March 31, | December 31, | |||||||||||||||
| 2016 | 2015 | |||||||||||||||
| SHORT-TERM BANK BORROWINGS | PLEDGED BANK DEPOSITS | SHORT-TERM BANK BORROWINGS | PLEDGED BANK DEPOSITS | |||||||||||||
| ($’000) | ($’000) | ($’000) | ($’000) | |||||||||||||
| (Unaudited) | ||||||||||||||||
| China Construction Bank | $ | 181,133 | $ | 111,410 | $ | 181,799 | $ | 104,500 | ||||||||
| Shanghai Pudong Development Bank | 5,959 | - | 5,929 | - | ||||||||||||
| Agricultural Bank of China | 11,453 | - | 23,100 | - | ||||||||||||
| Pingan Bank | - | - | 2,800 | 2,867 | ||||||||||||
| Bank of Communication | 10,989 | - | 10,934 | - | ||||||||||||
| Bank of China | 98,135 | - | 122,168 | 19,450 | ||||||||||||
| China Merchant Bank | 7,739 | - | 7,700 | 283 | ||||||||||||
| Ningbo Commerce Bank | 3,039 | 3,293 | 3,000 | 3,090 | ||||||||||||
| China Minsheng Bank | 1 | - | 3,290 | - | ||||||||||||
| Total | $ | 318,447 | $ | 114,702 | $ | 360,720 | $ | 130,190 | ||||||||
The only long term debt of the Company is a loan to Ningbo Keyuan from Zhouji (Group) Co., Ltd (“Zhouji Group”) made on April 9, 2015 in the initial amount of RMB 100 million (approximately $15.4 million). The debt matures on the second anniversary of being made and carries an interest of 7.0%, which is approximately 40% higher than average interest rate of long-term bank loans made at that time of similar tenor. The long-term loan is secured by 15% of Mr. Chunfeng Tao’s ownership of Ningbo Keyuan. Upon the maturity of the loan, Zhouji Group has an option to elect a payment of the principal and the accrued interest or the transfer of 15% of Mr. Tao’s ownership of Ningbo Keyuan.
| 7 | NOTES PAYABLE |
Notes payable represent bills issued by an accepting bank in favor of the Group’s suppliers. The Group’s suppliers receive payments from such accepting bank directly upon maturity of the bills, and the Group is obliged to repay the face value of the bills to such accepting bank. Bills that are not remitted directly by the Group to its suppliers may be sold by the Group to other accepting banks for cash prior to their maturity. Discounts paid are recorded as a component of interest expense. Notes payable with financing nature amounted $325 million and $312 million as of March 31, 2016 and December 31, 2015, respectively.
| 6 |
| 8 | ACCRUED EXPENSES AND OTHER PAYABLES |
Accrued expenses and other payables consist of the following:
| March 31, | December 31, | |||||||
| 2016 | 2015 | |||||||
| ($’000) | ($’000) | |||||||
| (Unaudited) | ||||||||
| Purchase of property, plant and equipment | $ | 12,766 | $ | 12,555 | ||||
| Accrued payroll and welfare | 725 | 677 | ||||||
| Liquidated damages | 2,493 | 2,493 | ||||||
| Deposit from customers | 2,499 | 2,499 | ||||||
| Loan from unrelated parties | 1,548 | 1,540 | ||||||
| Other tax payable | 2,702 | 2,765 | ||||||
| Accrued interest expense | 7,771 | 7,476 | ||||||
| Accrued expenses according to ongoing lawsuit | 15,079 | 10,200 | ||||||
| Other accruals and payables | 3,148 | 2,449 | ||||||
| $ | 48,731 | $ | 42,654 | |||||
| 9 | COMMITMENTS AND CONTINGENCIES |
(a) Operating commitments
The Group had outstanding Letters of Credit as of March 31, 2016 of approximately $37 million.
(b) Capital commitments
As of March 31, 2016, the Group had contractual capital commitments of approximately $12.8 million for purchases of equipment. The capital commitments relate primarily to manufacturing equipment enhancements.
(c) Litigation
On October 28, 2014, Dragon State Limited (“Dragon State”), an investor in a private placement that the Company closed in September 2010, filed a complaint against, among others, Keyuan Petrochemicals, Inc. and Mr. Chunfeng Tao, seeking rescission of the securities purchase agreement in the private placement and the return of $20 million, and in the alternative, seeking monetary damages to be determined at a trial but not less than $20 million (the “Complaint”). Pursuant to the September 2010 private placement, Dragon State had purchased from the Company for an aggregate price of $20 million, 5,333,340 shares of Series B preferred stock, 800,001 series C warrants to purchase 800,001 common shares, at a price of $4.50 per share (subject to adjustments), and 800,001 series D warrants to purchase 800,001 common shares at a price of $5.25 per share (subject to adjustments).
On July 11, 2016, the Company entered into a share purchase and settlement agreement (the “Settlement Agreement”) among Dragon State, Delight Reward Limited (“Delight Reward”), Keyuan HK, Ningbo Keyuan Petrochemicals, Ningbo Keyuan, and Keyuan Synthetic Rubbers (the Company, Keyuan HK, Ningbo Keyuan Petrochemicals, Ningbo Keyuan and Keyuan Synthetic Rubbers are collectively referred as the “Keyuan Group”), Mr. Chunfeng Tao, and Prax Capital Equity Management Co., Ltd., an affiliated party to Dragon State. Pursuant to the Settlement Agreement, Dragon State agreed to transfer the securities purchased in the September 2010 Private Placement to Delight Reward for a consideration of RMB 12,000,000 or approximately $1,800,000. In addition, Delight Reward and Keyuan Group agreed to pay, and Dragon State agreed to accept, a settlement of RMB 6,000,000 or approximately $900,000 to waive all claims and liabilities that Dragon State or its affiliated companies or individuals had brought or would bring against Delight Reward, Keyuan Group, Mr. Tao and their affiliates including the Complaint. These amounts were paid on July 15, 2016. On July 19, 2016, the United States District Court Southern District of New York entered an order granting final approval of the settlement. The Complaint was dismissed.
On August 4, 2016, Delight Reward entered into a side agreement with the Company (the “Side Agreement”). Under the Side Agreement, Delight Reward agreed not to claim that the warrants transferred pursuant to the Settlement Agreement were exercisable, and agreed pay to the Company for each convertible share underlying the Series B preferred stock transferred pursuant to the Settlement Agreement, the highest sale price of the Company’s Common Stock per share as reported on the OTC Pink during a period commencing on the date of the Settlement Agreement and ending on August 4, 2016, which was $0.005 per share of Common Stock. The aggregate purchase price for the shares of Common Stock underlying the series B preferred stock was therefore $27,465.01. On August 8, 2016, these funds were paid in cash on hand by Delight Reward. On August 10, 2016, the shares of Series B preferred stock were converted into 5,493,001 shares of Common Stock pursuant to the terms of the certificate of designations of series B preferred stock and the Side Agreement.
| 7 |
| 10 | INCOME TAXES |
The provision for income taxes is recorded at the end of each interim period based on the Group’s best estimate of its effective income tax rate expected to be applicable for the full fiscal year. The Group’s effective tax rate for the three months ended March 31, 2016 is approximately 70%. The increased effective rate for the three months ended March 31, 2016 compared to year 2015 is primarily due to losses in non-PRC jurisdictions, the benefit of which is not expected to be realized. The Group paid income taxes of approximately $0.7 million and $0.05 million, respectively during the three months ended March 31, 2016 and 2015.
| 11 | EARNING (LOSS) PER SHARE |
The following table sets forth the computation of basic and diluted net earnings (loss) per share:
| Three months ended March 31 | ||||||||
| 2016 | 2015 | |||||||
| ($’000) | ($’000) | |||||||
| (Unaudited) | (Unaudited) | |||||||
| Basic earning (loss) per share: | ||||||||
Net income (loss) | $ | 429 | $ | (47,857 | ) | |||
| Net loss attributable to non-controlling interests | (107 | ) | - | |||||
Net income (loss) attributable to Keyuan | ||||||||
| Petrochemicals Inc. common stockholders | $ | 536 | $ | (47,857 | ) | |||
| Weighted average common share | ||||||||
| (Denominator for basic and diluted earning (loss) per share) | 57,221,050 | 57,221,050 | ||||||
| Basic net earning (loss) per share: | $ | 0.009 | $ | (0.84 | ) | |||
| Diluted net earning (loss) per share: | $ | 0.009 | $ | (0.84 | ) | |||
Diluted earnings (loss) per share is calculated by dividing net income (loss) attributable to the Company’s stockholders as adjusted for the effect of dilutive common stock equivalents, if any, by the weighted average number of common stock and dilutive common stock equivalents outstanding during the year. Common stock equivalents consist of the common stock issuable upon the exercise of outstanding stock options and stock purchase warrants (using the treasury stock method). Potential dilutive securities are not included in the calculation of dilutive earnings (loss) per share if the effect is anti-dilutive. No warrants and options were included in diluted earnings (loss) per share for the three month ended March 31, 2016 and 2015, respectively, as their effect was anti-dilutive.
| 8 |
| 12 | STOCK REPURCHASE PROGRAM |
On September 22, 2014, the Board of Directors authorized the termination of a repurchase program that was commenced on December 31, 2012 to repurchase of up to $2 million of its common stock at a price of up to $1.50 per share. The Company purchased 425,110 shares of common stock through the stock repurchase program.
Shares of common stock repurchased by the Company are recorded at cost as treasury stock and result in a reduction of equity in the consolidated balance sheets. Treasury shares may be reissued as part of the Company’s stock-based compensation programs. There were no reissuances during the three months ended March 31, 2016 and 2015.
| 13 | FAIR VALUE MEASUREMENTS |
The Company did not have any assets or liabilities that were measured at fair value on a recurring basis as of March 31, 2016 and December 31, 2015, respectively.
The fair values of cash, pledged bank deposits, notes receivable, accounts receivable, short-term bank borrowings, notes payable, and accounts payable approximate their respective carrying amounts due to their short-term nature. The fair value of pledged bank deposits and short-term bank borrowings approximate their carrying amount because of their varying interest rates and/or their short maturities.
| 14 | SIGNIFICANT CONCENTRATIONS AND RISKS |
As of March 31, 2016 and December 31, 2015, the Group held cash and pledged bank deposits in financial institutions of approximately $269 million and $288 million, respectively. These were primarily held in major financial institutions located in mainland China and the Hong Kong Special Administrative Region, which management believes have high credit quality.
During the three months ended March 31, 2016, no sales to individual customer exceeded 10% of the Group’s total net revenue. As of March 31, 2016, two customers accounted for 51% and 33% of accounts receivables.
The Group currently buys a majority of its heavy oil and styrene, important components of its products, from three suppliers. Management believes that other suppliers could be found to provide similar products on comparable terms if it were to become necessary. A change in suppliers, however, could cause a delay in manufacturing and a possible loss of sales, which would affect operating results adversely.
During the three months ended March 31, 2016 and 2015, three and two suppliers to the Group each accounted for more than 10% of total group purchase. These three suppliers accounted for approximately 17%, 10% and 10% of the total purchase for three months ended March 31, 2016. During the three months ended March 31, 2015, the two individual suppliers from whom the Group purchased more than 10% of its total purchases, accounted for approximately 58%, 23% of the total purchase. As at March 31, 2016, one customer accounted for 92% of total accounts payable.
The Group commenced trading of heavy oil in April 2013, with the Group acting as an agent on behalf of a Hong Kong-based customer. For the three months ended March 31, 2016 and 2015, the trading of heavy oil consists of purchases of approximately nil and $3.0 million, respectively, and sales of approximately nil and $3.0 million, respectively, resulting in no profit or loss.
The Group’s operations are carried out in the PRC. Accordingly, the Group’s business, financial condition and results of operations may be influenced by the political, economic and legal environments in the PRC, as well as by the general state of the PRC’s economy. The business may be influenced by changes in governmental policies with respect to laws and regulations, anti-inflationary measures, currency conversion and remittances abroad, and rates and methods of taxation, among other things.
| 9 |
| 15 | RELATED PARTY TRANSACTIONS AND RELATIONSHIPS AND TRANSACTIONS WITH CERTAIN OTHER PARTIES |
(A) Related Party Transactions
The Company considers all transactions with the following parties to be related party transactions.
| Name of parties | Relationship | |
| Mr. Chunfeng Tao (“Mr. Tao”) | Majority stockholder | |
| Mr. Jicun Wang (“Mr. Wang”) | Principal stockholder | |
| Mr. Peijun Chen (“Mr. Chen”) | Principal stockholder | |
| Ms. Sumei Chen | Member
of the Company’s Board of Supervisors and spouse of Mr. Wang | |
| Ms. Yushui Huang (“Ms. Huang”) | Vice
President of Administration, Ningbo Keyuan | |
| Mr. Dingan Zhang | Chief Financial Officer of Ningbo Keyuan from October 2015 to April 2016 | |
| Ningbo
Pacific Ocean Shipping Co., Ltd (“Ningbo Pacific”) |
100% ownership by Mr. Wang | |
| Ningbo Hengfa Metal Product Co., Ltd (“Ningbo Hengfa”, former name “Ningbo Tenglong”) | 100% ownership by Mr. Chen | |
| Ningbo
Xinhe Logistic Co., Ltd (“Ningbo Xinhe”) |
10% ownership by Ms. Huang |
Related party transactions and amounts outstanding with the related parties as of March 31, 2016 and December 31, 2015, and for the three months ended March 31, 2016 and 2015, are summarized as follows:
| Three months ended March 31 | ||||||||
| 2016 | 2015 | |||||||
| ($’000) | ($’000) | |||||||
| (Unaudited) | (Unaudited) | |||||||
| Purchase of transportation services (a) | $ | 879 | $ | 158 | ||||
| As of March 31, 2016 | As of December 31, 2015 | |||||||
| ($’000) | ($’000) | |||||||
| (Unaudited) | ||||||||
| Amounts due from related parties (c) | $ | 44 | $ | 92 | ||||
| Amounts due to related parties (c) | $ | 5,113 | $ | 4,592 | ||||
| Accounts payables to related parties | $ | 152 | $ | 739 | ||||
(a) The Group purchased transportation services of approximately $0.8 million and $0.2 million from Ningbo Xinhe during the three months ended March 31, 2016 and 2015, respectively.
(b) Guarantees for Bank Loans
Guarantee provided by Mr. Tao amounted $139.3 million and $138.6 million as of March 31, 2016 and December 31, 2015.
Bank loans guarantee provided by Mr. Tao amounted $91.8 million and $95.9 million as of March 31, 2016 and December 31, 2015.
| 10 |
(c) Amount due from these parties consist of the following.
| As of March 31, 2016 | As of December 31, 2015 | |||||||
| ($’000) | ($’000) | |||||||
| (Unaudited) | ||||||||
| Mr. Tao | $ | 44 | $ | 46 | ||||
| Others | - | 46 | ||||||
Amount due to these parties consist of the following.
| As of March 31, 2016 | As of December 31, 2015 | |||||||
| ($’000) | ($’000) | |||||||
| (Unaudited) | ||||||||
| Mr. Tao | $ | 4,592 | $ | 4,592 | ||||
| Ningbo Xinhe | 521 | - | ||||||
| Total | $ | 5,113 | $ | 4,592 | ||||
(B) Relationships and transactions with certain other parties
The Group has the following relationships and transactions with certain other parties:
| Name of parties | Relationship | |
| Ningbo
Litong Petrochemical Co., Ltd (“Ningbo Litong”) |
Former
12.75% nominee shareholder of Ningbo Keyuan | |
| Huaning International Trading Co., Ltd (“Huaning”) | The director of Huaning is the shareholder and director of Ningbo Xinghe, one of the Group’s related parties | |
| Mercuria Energy Trading Pte Ltd. (“Mercuria”) | Major supplier | |
| Ningbo
Anqi Petrochemical Co., Ltd |
A
related party until September 2011 when control transferred | |
| Ningbo
Lide Investment Co., Ltd. (“Ningbo Lide”, f/k/a Ningbo Kewei) |
A
related party until September 2011 when control transferred | |
| Ningbo
Kunde Petrochemical Co, Ltd. |
A
related party until September 2011 when control transferred |
Transactions and amounts outstanding with these parties for the three months ended March 31, 2016 and 2015 and as of March 31, 2016 and December 31, 2015 are summarized as follows:
| Three months ended March 31 | ||||||||
| 2016 | 2015 | |||||||
| ($’000) | ($’000) | |||||||
| (Unaudited) | (Unaudited) | |||||||
| Sales of products (d) | $ | - | $ | 1,936 | ||||
| Purchase of raw materials (e) | $ | 56,551 | $ | 29,157 | ||||
| 11 |
| As at March 31, 2016 | As at December 31, 2015 | |||||||
| ($’000) | ($’000) | |||||||
| (Unaudited) | ||||||||
| Guarantee for bank borrowings (f) | $ | 311,681 | $ | 310,276 | ||||
| Amounts due from these parties (g) | $ | 2,773 | $ | 3,907 | ||||
| Advance payments to these parties (h) | $ | 30,460 | $ | 4,552 | ||||
| Advance payments from these parties (i) | $ | 1,193 | $ | 4 | ||||
| Accounts receivables (j) | $ | 763 | $ | - | ||||
| Accounts payables (k) | $ | 41,771 | $ | 41,269 | ||||
| Notes payable (l) | $ | 155,871 | $ | 140,715 | ||||
| Notes receivable (m) | $ | - | $ | 514 | ||||
(d) The Group sold finished products of approximately nil and $1.5 million to Ningbo Litong during the three months ended March 31, 2016 and March 31, 2015, respectively. The Group sold finished products of approximately nil and $0.4 million to Ningbo Lide during the three months ended March 31, 2016 and March 31, 2015, respectively.
(e) The Group purchased raw materials of approximately $21.8 million and $9.7 million from Ningbo Litong during the three months ended March 31, 2016 and March 31, 2015, respectively. The Group purchased raw materials of approximately $29.2 million and $0.02 million from Ningbo Lide during the three months ended March 31, 2016 and March 31, 2015, respectively. The Group purchased raw materials of approximately $5.5 million and $16.6 million from Mercuria during the three months ended March 31, 2016 and March 31, 2015, respectively. The Group purchased raw materials of approximately nil and $2.8 million from Huaning during the three months ended March 31, 2016 and March 31, 2015, respectively.
(f) Guarantees for Bank Loans
| Guarantee provided as of | ||||||||
| March 31, 2016 | December 31, 2015 | |||||||
| ($’000) | ($’000) | |||||||
| (Unaudited) | ||||||||
| Ningbo Litong | $ | 102,742 | $ | 102,379 | ||||
| Ningbo Lide | 208,940 | 207,897 | ||||||
| Total | $ | 311,682 | $ | 310,276 | ||||
| Bank loans Guaranteed as of | ||||||||
| March
31, 2016 |
December 31, 2015 |
|||||||
| ($’000) | ($’000) | |||||||
| (Unaudited) | ||||||||
| Ningbo Litong | $ | 18,727 | $ | 18,634 | ||||
| Ningbo Lide | 97,737 | 101,783 | ||||||
| Total | $ | 116,464 | $ | 120,417 | ||||
Between in January 2011 and January 1, 2014, these Company paid loan guarantee fees of approximately 0.3% per quarter of the loan principal guaranteed for these guarantees. In January 1, 2014, Ningbo Litong, Ningbo Lide and Mr. Chunfeng Tao agreed to stop charging loan guarantee fees to the Group.
No guarantee fees were paid for the three months ended March 31, 2016 and 2015.
| 12 |
(g) At March 31, 2016 and December 31, 2015, the amounts due from these parties consist of amounts due from Huaning of $1.2 million and $3.9 million, respectively, and amounts due from Mercuria of $1.6 million and nil, respectively.
(h) At March 31, 2016 and December 31, 2015, advances payments to these parties consist of payments to Ningbo Litong of $18.8 million and nil, respectively, and Ningbo Lide of $11.7 million and $4.6 million, respectively.
(i) At March 31, 2016 and December 31, 2015, advances received from Huaning of $4,000 and $4,000, respectively, and amounts received from Ningbo Lide of $1.2 million and nil, respectively.
(j) At March 31, 2016 and December 31, 2015, account receivables from these parties consist of account receivables from Ningbo Litong of $0.1 million and nil, respectively, and account receivables from Ningbo Lide of $0.6 million and nil, respectively.
(k) At March 31, 2016 and December 31, 2015 accounts payables to these parties consist of payables to Ningbo Litong of nil and $1.4 million, respectively, and payables to Mecuria of $41.8 million and $39.9 million, respectively.
(l) At March 31, 2016 and December 31, 2015, notes payables to these parties consist of notes payables to Ningbo Litong of $76.8 million and $68.6 million, respectively, and payables to Ningbo Lide of $79.1 million and $72.2 million, respectively.
(m) At December 31, 2015 and 2014 notes receivable from these parties consist of notes receivable from Ningbo Litong of nil and $0.5 million, respectively, and notes receivable from Ningbo Lide of nil and $0.02 million, respectively.
(C) Relationships and transactions with the entity that has non-controlling interests in Company’s subsidiaries:
The Group has the following relationships and transactions with the entity who has non-controlling interests in the Company or its subsidiaries:
| Name of party | Relationship | |
| Ningbo Hengyun Energy Technology Co., Ltd (Ningbo Hengyun) | Non-controlling shareholder of Guangxi Keyuan since 2015 |
The transactions and amounts outstanding with this party as of March 31, 2016 and December 31, 2015, and for the three months ended March 31, 2016 and 2015 are summarized as follows:
| Three Months
ended March 31, | ||||||||
| 2016 | 2015 | |||||||
| ($’000) | ($’000) | |||||||
| (unaudited) | (unaudited) | |||||||
| Sales of products | $ | 273 | $ | 557 | ||||
| Purchase of raw materials | $ | 42,920 | $ | 22,789 | ||||
| As
at March 31, 2016 | As at December 31, 2015 | |||||||
| ($’000) | ($’000) | |||||||
| (unaudited) | ||||||||
| Advance received from non-controlling interest shareholder | $ | 34 | $ | - | ||||
| Advance payments to non-controlling interest shareholder | $ | 11,766 | $ | 2,222 | ||||
| Accounts receivables | $ | 323 | $ | 17,153 | ||||
| Notes receivables | $ | 87,876 | $ | 90,601 | ||||
| 13 |
| 16 | Consolidated Segment Data |
Segment information is based on how management reviews the business, makes investing and resource allocation decisions and assesses operating performance. The segment data presented reflects management’s segment structure. The Company reports financial and operating information in the following two segments:
(a) Petrochemicals Segment: Manufacturing and sales of mixed light aromatics, mixed heavy aromatics, fine propylene, propane, butane, liquefied petroleum gas (LPG), methyltert butyl ether, styrene, etc.
(b) Rubber Segment: Manufacturing and sales of various rubber products.
Segment information is as follows:
| Three Months Ended March 31 | ||||||||||||||||||||||||
| 2016 | 2015 | |||||||||||||||||||||||
| Petrochemical | Rubber | Total | Petrochemical | Rubber | Total | |||||||||||||||||||
| ($'000) | ($'000) | ($'000) | ($'000) | ($'000) | ($'000) | |||||||||||||||||||
| (Unaudited) | (Unaudited) | (Unaudited) | (Unaudited) | (Unaudited) | (Unaudited) | |||||||||||||||||||
| Sales | $ | 64,959 | $ | 21,380 | $ | 86,339 | $ | 44,307 | $ | 13,975 | $ | 58,282 | ||||||||||||
| Income (loss) from operations | $ | 10,434 | $ | (3,098 | ) | $ | 7,336 | $ | (27,950 | ) | $ | 2,513 | $ | (25,437 | ) | |||||||||
| As of March 31, 2016 | As of December 31, 2015 | |||||||||||||||||||||||
| Petrochemical | Rubber | Total | Petrochemical | Rubber | Total | |||||||||||||||||||
| ($'000) | ($'000) | ($'000) | ($'000) | ($'000) | ($'000) | |||||||||||||||||||
| (Unaudited) | (Unaudited) | (Unaudited) | ||||||||||||||||||||||
| Total assets | $ | 724,623 | $ | 109,198 | $ | 833,821 | $ | 724,008 | $ | 105,687 | $ | 829,695 | ||||||||||||
| 17 | SUBSEQUENT EVENTS |
On July 11, 2016, the Company and certain affiliates of the Company entered into the Settlement Agreement with Dragon State and others described in Note 9(c) above, pursuant to which Dragon State agreed to transfer the securities of the Company it owned to Delight Reward and waive all claims and liabilities that Dragon State or its affiliated companies or individuals had brought or would bring against the Company, Delight Reward and certain affiliates of the Company for an aggregate consideration of RMB 18 million or approximately $2.7 million.
On August 4, 2016, the Company entered into the Side Agreement with Delight Reward described in Note 9(c) above in connection with the execution of the Settlement Agreement and the payment subsequently made thereunder by the Company to Dragon State.
For more details of the Settlement Agreement and the Side Agreement, please refer to Note 9(c) above.
| 14 |
ITEM 2. MANAGEMENT’S DISCUSSION AND ANALYSIS OF FINANCIAL CONDITION AND RESULTS OF OPERATIONS.
The following discussion and analysis of our financial condition and result of operations should be read in conjunction with our unaudited consolidated financial statements and the notes to those financial statements appearing elsewhere in this Form 10-Q. This discussion contains forward-looking statements and involves numerous risks and uncertainties, including, but not limited to, those described in the "Risk Factors" section of the Form 10-K for the fiscal years ended December 31, 2015 and 2014, and the other reports we file with the Securities and Exchange Commission. Our actual results may differ materially from those contained in any forward-looking statements.
General Overview
Nature of Business
We are engaged in the manufacture and sale of petrochemical products and rubber in the PRC through our PRC operating subsidiaries, Ningbo Keyuan, Ningbo Keyuan Petrochemicals, Keyuan Synthetic Rubbers, Guangxi Keyuan and Zhongkexuneng. Our operations include:
| (1) | A production facility with an annual petrochemical production capacity of 720,000 metric tons (“MT”) of a variety of petrochemical products; | |
| (2) | A Styrene-Butadiene-Styrene (“SBS”) production facility with a designed annual production capacity of 70,000 MT; | |
| (3) | A Styrene-Ethylene-Butylene-Styrene (“SEBS”) production facility with a designed annual production capacity of 10,000 MT; | |
| (4) | Facilities for the storage and loading of raw materials and finished petrochemical and rubber goods; and | |
| (5) | Manufacturing technologies that can support our manufacturing process with relatively low raw material costs and high utilization and yields. |
In January 2012, we signed a cooperation agreement with Fangchenggang City to build a new petrochemicals production facility in Guangxi Keyuan New Materials Industrial Park, Guangxi Province (the “Guangxi Project”). The estimated cost for the Guangxi Project is approximately $300 million. According to the cooperation agreement, the local government of Fangchenggang City agreed to grant to us land use rights for the facility.
On August 9, 2013, the Guangxi Project was approved by the local government of Fangchengang City. We were granted a land use right for 40 years for approximately 4,668,437 square feet of land, effective in 2014. In August 2013, we commenced engineering and facility construction. The preliminary investigation for foundation piling was completed in late October 2013. We completed the land leveling and finished the installation of water pipes, electricity wires and basic pipelines at the end of 2014. We completed the technical design of the facility and the equipment at the end of 2015. We are currently arranging the tendering on the construction of the facility and major equipment. We expect to finish construction of the facility and installation of main equipment and pipelines by the end of 2017 and commence production by the end of 2018.
We believe that the Guangxi Project once it goes into operation, will improve our competitive positions by extending and expanding our supply chain and manufacturing base. The facility is expected to have an annual production capacity of 50,000 MT of Acrylonitrile Butadiene Styrene (“ABS”). We plan to fund the construction and operation of the Guangxi Project through outside financing. If such financing is not available on terms acceptable to us, the project will be delayed until appropriate financing is available. As a result, the timelines for the Guangxi Project described above are subject to adjustment pending the status of outside financing.
| 15 |
Organization
Keyuan Petrochemicals, Inc. (formerly known as “Silver Pearl Enterprises, Inc.”) was incorporated in the State of Texas on May 4, 2004 and redomiciled to Nevada on February 28, 2007.
On April 22, 2010, we entered into a share exchange agreement (the “Exchange Agreement”) with Sinotech Group, Delight Reward Limited (“Delight Reward”), a British Virgin Islands company and sole stockholder of Sinotech Group, and Denise D. Smith, our former principal stockholder. Pursuant to the terms of the Exchange Agreement, Delight Reward transferred to us all of its shares of Sinotech Group in exchange for 47,658 shares of our Series M convertible preferred stock (the “Share Exchange”). On an “as converted” basis, the Series M convertible preferred stock represented approximately 95% of our outstanding common stock immediately after the Share Exchange. The Series M convertible preferred stock voted with the common stock on an “as converted basis” and was converted into 47,658,000 shares of our common stock on December 28, 2010.
As a result of the Share Exchange, Sinotech Group became a wholly-owned subsidiary of us and Delight Reward became our controlling stockholder. The Share Exchange was accounted for as a reverse acquisition and recapitalization whereby Sinotech Group was deemed to be the accounting acquirer (and the legal acquiree).
On May 12, 2010, we formed a corporation under the laws of the State of Nevada called Keyuan Petrochemicals, Inc. as our wholly-owned subsidiary (the “Merger Subsidiary”). Effective as of May 17, 2010, the Merger Subsidiary was merged with and into us. As a result of the merger, our name was changed to “Keyuan Petrochemicals, Inc.” Prior to the merger, the Merger Subsidiary had no liabilities and nominal assets and, as a result of the merger, the separate existence of the merger subsidiary ceased. We are the surviving corporation in the merger except for the name change, and there was no change in our directors, officers, capital structure or business.
On August 8, 2010, we established a wholly owned subsidiary in China, Ningbo Keyuan Petrochemicals, through our subsidiary Keyuan HK. Ningbo Keyuan Petrochemicals was initially set up to engage in the sales and marketing for products produced by Ningbo Keyuan and, later, by Keyuan Synthetic Rubbers. However, in fact, Ningbo Keyuan and Keyuan Synthetic Rubbers have been selling their products directly and Ningbo Keyuan Petrochemicals has mostly assisted each subsidiary in training and recruiting sale persons as well as organizing marketing events.
On April 4, 2012, a wholly-owned, indirect subsidiary, Guangxi Keyuan, was formed for the purpose of developing the Guangxi Project.
On June 15, 2012, Keyuan Synthetic Rubbers was established as a wholly-owned PRC subsidiary of Ningbo Keyuan to engage in the production and sales of SBS and SEBS.
On May 13, 2014, Zhongkexuneng was incorporated by Sinotech Group owning 75% of Zhongkexuneng and Ningbo Keyuan owning the remaining 25% of Zhongkexuneng. Zhongkexuneng is located in Zhejiang province, China. Zhongkexuneng was formed for the purpose of trading petrochemical products.
On September 16, 2015, Ningbo Keyuan and Sinotech Group entered into an investment cooperation agreement with Ningbo Hengyun Energy Technology Co., Ltd (“Hengyun Energy”) (the “Investment Cooperation Agreement”), pursuant to which Sinotech Group agreed to transfer 32.88% of its equity interest in Guangxi Keyuan to Hengyun Energy subject to a payment of consideration of RMB 198,284,300 by Hengyun Energy (approximately $30.5 million) to be made by December 31, 2016. As the date of this report, Hengyun Energy has paid RMB 138,284,300 (approximately $21.7 million).
| 16 |
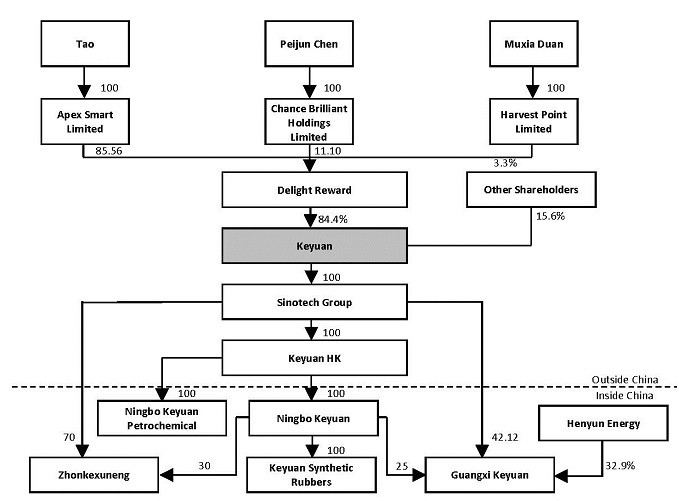
The current shareholding structure of the Company is illustrated in the following diagram. The diagram is presented as if Hengyun Energy has already made full payment under the Investment Cooperation Agreement:
| 17 |
Our Facility and Equipment
Facilities
During the three months ended March 31, 2016, we have invested a total of approximately $6.7 million in the construction and improvement of our production facility. Our current production facility encompasses approximately 7.2 million square feet, which includes 2.5 million square feet facility in Zhejiang Province and 4.7 million square feet facility in Guangxi Province.
Facilities for Petrochemical Products
| Product | Amount of Production Lines | Location of Facility | 2015 Designed Annual Manufacturing Capacity (MT) | 2015 Actual Annual Production (MT) | Utilization Rate | |||||||||||||
| BTX Aromatics | 1 | Ningbo, Zhejiang | 300,000 | 235,347 | 78 | % | ||||||||||||
| Propylene | 1 | Ningbo, Zhejiang | 50,000 | 21,713 | 43 | % | ||||||||||||
| Styrene | 1 | Ningbo, Zhejiang | 80,000 | 65,695 | 82 | % | ||||||||||||
| LPG | 1 | Ningbo, Zhejiang | 100,000 | 61,366 | 61 | % | ||||||||||||
| MTBE and other chemicals | 1 | Ningbo, Zhejiang | 190,000 | 118,293 | 62 | % | ||||||||||||
| Total | 5 | N/A | 720,000 | 502,414 | N/A | |||||||||||||
Facilities for Rubber Products
| Product | Amount of Production Lines | Location of Facility | 2015 Designed Annual Manufacturing Capacity (MT) | 2015 Actual Annual Production (MT) | Utilization Rate | |||||||||||||
| SBS | 2 | Ningbo, Zhejiang | 70,000 | 29,828 | 43 | % | ||||||||||||
| SEBS | 1 | Ningbo, Zhejiang | 10,000 | 2,355 | 24 | % | ||||||||||||
| Total | 3 | N/A | 80,000 | 32,183 | N/A | |||||||||||||
We have a total of 134,000 MT of storage capacity, consisting of 84,000 MT of storage capacity for raw materials and 50,000 MT for finished products. As a part of our expansion plan, we intend to add additional 16,000 MT of new storage capacity which is now under construction and expected to be completed in the fourth quarter of 2016.
We own an on-site ocean shipping dock with 50,000 MT of shipping capacity and a 10-truck loading capacity next to our production facility in Ningbo, China. Approximately 90% of our feedstock and finished products use this shipping dock. We are currently upgrading the classification of our own dock so that we can unload foreign cargo vessels under the 50,000 MT cargo capacity to our dock directly. We expect that the upgrade will be completed by the end of 2017 and we will be able to unload certain cargoes directly rather paying a third party to do so.
Our Guangxi Project is located in Fangchengang city, an important port for Guangxi province, and other than Beihai, the only major Chinese port on the Tonkin Gulf. The storage and logistics costs are generally lower in Fanchengang city compared to other ports in China.
Equipment
Our major processing equipment includes the following:
| ● | Heavy oil catalytic pyrolysis processing equipment: risers/generators/precipitators, fuel gas boilers, fractionating tower, absorbing, re-absorbing, and desorbing towers, heat exchangers, pumps, and a stabilizing tower; |
| 18 |
| ● | Gas fractionation processing equipment: de-propanizing tower, refining propylene tower, de-ethanizination tower, heat exchangers, and pumps; |
| ● | Ethylbenzene processing equipment: alkylation reactor, anti-alkylation reactor, dehydrogenation reactor, propylene absorbing tower, de-ethylene tower, ethylbenzene recovering tower, heating furnace for benzene, heating furnace for gas, steam overheating furnace, tail gas compressor, and washing tower; and |
| ● | Liquefied petroleum gas (LPG) and sulfur recovery processing equipment: LPG desulfurization extraction tower, dry gas desulfurization tower, regenerating tower, and LPG de-mecaptan extraction tower. |
Our Products
We manufacture and supply a variety of petrochemical and rubber products, including petrochemical products such as Benzene Toluene-Xylene Aromatics (“BTX Aromatics”), propylene, styrene, liquid petroleum gas (“LPG”), Methyl Tertiary Butyl Ether (“MTBE”) and rubber products such as SBS and SEBS, each of which is described below, and other products.
Petrochemical Products:
| ● | BTX Aromatics: consisting of benzene, toluene, xylene and other chemical components for further processing into plastics, gasoline and solvents materials widely used in paint, ink, construction coating and pesticide. |
| ● | Propylene: a chemical intermediate as one of the building blocks for an array of chemical and plastic products that are commonly used to produce polypropylene, acrylonitrile, oxo alcohols, propylene oxide, cumene, isopropyl alcohol, acrylic acid and other chemicals for paints, household detergents, automotive brake fluids, indoor/outdoor carpeting, textile, insulating materials, auto parts and electrical appliances. |
| ● | Styrene: a precursor to polystyrene and several copolymers widely used for packaging materials, construction materials, electronic parts, home appliances, household goods, home furnishings, toys, sporting goods and others. |
| ● | LPG: a mixture of hydrocarbon gases used as fuel in heating appliances and vehicles. It is also a replacement for chlorofluorocarbons as an aerosol propellant and a refrigerant, which we believe reduces damage to the ozone layer. |
| ● | MTBE & Other Chemicals: MTBE, oil slurry, sulphur and others are used for a variety of applications including fuel components, refrigeration systems, fertilizers, insecticides and fungicides. |
Rubber Products:
| ● | SBS: consisting of styrene and butadiene, widely used for waterproofing building material, asphalt modification, furniture, shoe sole material, tubes, tape, auto parts and electrical appliances. |
| ● | SEBS: Styrene-Ethylene-Butylene-Styrene, a product similar to SBS but we believe with a more durable product feature. |
In addition, we will start producing ABS once we complete the construction of the facility in Guangxi and the trail production.
| 19 |
Production Capacity and Expansion
Our annual designed manufacturing capacity is 720,000 MT in the aggregate of these products. Our designed capacity for SBS production facility is to 70,000 MT annually and for SEBS production facility is to 10,000 MT annually. Additionally, we have a total of 134,000 MT of storage capacity, consisting of 84,000 MT of storage capacity for raw materials and 50,000 MT for finished products. We also own a dock in Ningbo, China which can directly unload foreign cargo vessels under the 50,000 MT cargo capacity to our dock.
All of our facilities, except for the SBS and SEBS facility, have been operating since 2009. Therefore, those older facilities generally provide us with a stable output. While we are continuously working on existing equipment upgrades to increase production, we realize that optimizing the utilization rates for our current facilities is currently not sufficient to meet increasing customer demands. More specifically, increasing market demand for tire and auto parts has resulted in increasing market demand for styrene and ABS; and higher requirements related to environmental protection imposed by the PRC government have led to greater demand for transformer oil and catalytic cracking oil.
Based on these market trends, we completed the construction of an oil catalytic cracking processing facility by the end of 2014. It is used as an extension of our catalytic pyrolysis processing equipment. This facility can reduce production costs and the market risk in the purchase of raw materials, and improve the stability and efficiency of project production of heavy oil to 200,000 MT of heavy oil per year.
We are currently focused on the following improvements to our infrastructure to expand our manufacturing capacity:
| ● | Constructing an ABS production facility in Guangxi Province. We completed the technical design of the facility and the equipment at the end of 2015. We are currently arranging the tendering on the construction of the facility and major equipment. We expect to finish construction of the facility and installation of main equipment and pipelines by the end of 2017 and commence production by the end of 2018 with an annual production capacity of 50,000 MT of ABS; | |
| ● | Upgrading our facility for styrene to increase annual design capacity of ethylene-styrene from 80,000 MT to 200,000 MT, of which 120,000 MT can be used for producing synthetic materials and 80,000 MT can be sold to downstream petrochemical companies; | |
| ● | Constructing a transformer oil facility using hydrogen from the ethylene-styrene facility so that we can complete a double hydrogenation process on original products (such as BTX Aromatic) for refining transformer oil and producing high value transformer oil with a design capability of 100,000 MT per year. Construction of the main facility column was completed at the end of October 2013. We are currently performing the assembly and installation and expect to start production by the end of March 2017; and | |
| ● | Adding additional 16,000 MT of new storage capacity which is under construction. We expect to complete the construction at the end of 2016 and start operation in early 2017. |
The total estimated cost of our expansion plan is approximately $372.5 million, including $300 million for Guangxi Project, $30 million for the transformer oil facility, $40 million for the increased annual design capacity of ethylene-styrene, and $2.5 million for additional storage capacity. Upon completion of our expansion described above, our total production capacity is expected to reach 1,270,000 MT per year comprised of our current petrochemical production of 720,000 MT, SBS of 70,000 MT, SEBS of 10,000 MT, additional styrene of 120,000 MT, catalytic cracking oil of 200,000 MT, ABS of 50,000 MT, and transformer oil of 100,000 MT.
Our current estimate of our expansion schedule is as follows. However, we are continuing our evaluation of timelines for our expansion projects based on our financial situation and market conditions.
| Expansion Project | Expected Completion Date | |
| Ethylene-Styrene Facility | End of Q1, 2017 | |
| Transformer Oil Facility | End of Q1, 2017 | |
| ABS Production Facility | End of Q4, 2017(1) | |
| New storage capacity of 16,000 MT | End of Q4, 2016 |
| (1) | The construction of the ABS facility and installation of main equipment and pipelines is expected to be completed by the end of 2017 and production is expected to be started by the end of 2018. |
| 20 |
Manufacturing and Sales
Our total production of finished products was 162,699 MT for the three months ended March 31, 2016, and we generated $86.3 million in revenue based on the sale of 246,387 MT of petrochemical and rubber products. Our total production of finished products was 53,559 MT for the three months ended March 31, 2015 and we generated $58.3 million in revenue based on the sale of 89,268 MT of petrochemical and rubber products.
The increase in total production of finished products and revenues during the first quarter of 2016 was mainly due to a 74-day production suspension during the first quarter of 2015 while there was no production suspension during the first quarter of 2016.
During the first quarter of 2015, operation of Ningbo Keyuan and Keyuan Synthetic Rubbers was suspended for 74 days in connection with continuing depressed oil price in international markets occurring in June 2014 which materially negatively impacted us and our downstream distributors. As a result, we did not have enough capital to satisfy the unsustainable cash demand to maintain operations. We resumed operations in April 2015 when we observed the recovery and stabilization of oil market. During the suspension, we conducted routine maintenance of our facility, which is required every two years and requires a temporary suspension of production. There was no production suspension during the three months ended March 31, 2016. As a result, our total production of finished products for the three months ended March 31, 2016 was increased by 109.140MT compared to the comparative period in 2015 and revenue for the three months fiscal year 2015 was increased by approximately $28.0 million compared to the comparative period in 2015.
Going Concern and Management’s Plans
Despite of our continuous efforts in realignment of product profiles and the fact that the petrochemical industry in China has been stabilized since 2015, we reported a net income of approximately $0.4 million and a net loss of approximately $60.5 million for the three months ended March 31, 2016 and for the year ended December 31, 2015, respectively. In addition, cash flows provided by operations were approximately $5.9 million for the three months ended March 31, 2016 and cash flows used in operations were approximately $112.5 million for the year ended December 31, 2015, respectively. At March 31, 2016 and December 31, 2015, we had a working capital deficit of approximately $292.8 million and $284.6 million, respectively.
Consequently, there is substantial doubt about our ability to continue as a going concern.
We continue to finance and support our its operations primarily through short-term bank borrowings. Short-term bank borrowings and notes payable amounted to approximately $687 and $695 million at March 31, 2016 and December 31, 2015, respectively. In addition, as reported in our financial statements for the three months ended March 31, 2016 and 2015, we continue to benefit from favorable PRC tax policies related to consumption tax. As of March 31, 2016, we had consumption tax refund receivables of approximately $54.1 million which have been fully refunded to us as of the date of this Form 10-Q.
We are exploring sources of additional financing, including short-term financing from our vendors and other parties and equity financing. In addition, we are closely monitoring its cash balances, cash needs and expense levels. In addition, we are currently contemplating our options to reduce our costs, including one option to "go dark." If we decide to undertake this, and if it is successful, we expect that our legal, accounting and certain other expenses that we currently incur as a result of being a public company may be reduced.
Our ability to continue as a going concern is dependent upon management’s ability to implement our expansion plan particularly Guangxi project - to increase our production capacity, obtain additional capital and generate net income and positive cash flows from operations. There can be no assurance that these plans will be sufficient or that additional financing will be available in amounts or terms acceptable to us, if at all.
| 21 |
Results of Operations
The following table sets forth information from our statements of operations and comprehensive income (loss) for the three months ended March 31, 2016 and 2015.
Comparison of the three months ended March 31, 2016 and 2015 (in thousands)
| For the three months | Year to Year Comparison | |||||||||||||||
| ended March 31, | Increase | Percentage | ||||||||||||||
| 2016 | 2015 | /(Decrease) | change | |||||||||||||
| (unaudited) | (unaudited) | |||||||||||||||
| Sales | $ | 86,339 | 58,282 | 28,057 | 48.14 | % | ||||||||||
| Cost of sales | 74,084 | 78,843 | (4,759 | ) | (6.04 | %) | ||||||||||
| Gross profit (loss) | 12,255 | (20,561 | ) | 32,816 | 159.60 | % | ||||||||||
| Operating expenses | ||||||||||||||||
| Selling expenses | 889 | 234 | 655 | 279.91 | % | |||||||||||
| General and administrative expenses | 4,030 | 4,642 | (612 | ) | (13.18 | %) | ||||||||||
| Total operating expenses | 4,919 | 4,876 | 43 | 0.88 | % | |||||||||||
| Income (loss) from operations | 7,336 | (25,437 | ) | 32,773 | 128.84 | % | ||||||||||
| Other income (expenses): | ||||||||||||||||
| Interest income | 1,975 | 3,325 | (1,350 | ) | (40.60 | %) | ||||||||||
| Interest expense | (6,400 | ) | (8,348 | ) | 1,948 | 23.33 | % | |||||||||
| Foreign exchange loss, net | (1,334 | ) | (9,408 | ) | 8,074 | 85.82 | % | |||||||||
Other expense, net | (152 | ) | (8,057 | ) | 7,905 | 98.11 | % | |||||||||
Total other expense, net | (5,911 | ) | (22,488 | ) | 16,577 | 73.71 | % | |||||||||
| Income (loss) before income taxes | 1,425 | (47,925 | ) | 49,350 | 102.97 | % | ||||||||||
| Income tax expense (benefit) | 996 | (68 | ) | 1,064 | 1564.71 | % | ||||||||||
Net income (loss) | 429 | (47,857 | ) | 48,286 | 100.90 | % | ||||||||||
Other comprehensive income (loss) | ||||||||||||||||
| Foreign currency translation adjustment | (245 | ) | (479 | ) | 234 | 48.85 | % | |||||||||
| Comprehensive income (loss) | $ | 184 | $ | (48,336 | ) | $ | 48,520 | 100.38 | % | |||||||
Sales: Our sales for the three months ended March 31, 2016 were approximately $86.3 million, compared to $58.3 million for the three months ended March 31, 2015, an increase of $28.1 million, or 48.14%. The increase was mainly due to the production suspension in the first quarter of 2015 to adjust for the changes in demand in a declining market condition.
Cost of Sales: Our overall cost of sales was approximately $74.1 million for the three months ended March 31, 2016, or 86% of sales, as compared to approximately $78.8 million, or 135% of sales for the three months ended March 31, 2015. Our cost of sales is primarily composed of the costs of direct raw materials (mainly heavy oil, benzene, butadiene and carbinol), labor, depreciation and amortization of manufacturing equipment and facilities, and other overhead. The decrease in the cost of sales was mainly because the decrease in average price of raw materials due to the continuingly depressed oil price in international markets starting from late 2014.
| 22 |
Energy required for our production consists of water, electricity and steam, the costs of which are attributed to cost of sales rather than operating expense. The supply prices of these energy sources in China have historically been very stable as a result of PRC government policy. Accordingly, the potential impact of changing energy costs to our production is minimal. The following are the costs for water, electricity and stream for the three months ended March 31, 2016 and 2015 (amounts in thousands):
| For the Three Months Ended March 31, | ||||||||
| 2016 (Unaudited) | 2015 (Unaudited) | |||||||
| Water | 387 | 177 | ||||||
| Electricity | 3,187 | 2,460 | ||||||
| Steam | 1,421 | 1,265 | ||||||
Gross Profit (loss): Gross profit for the three months ended March 31, 2016 was approximately $12.3 million compared to gross loss of $20.6 million for the comparative period in 2015, a total increase of approximately $32.8 million, or 159.6%. The increase was due to the stabilization of the international crude oil price in early 2016 compared to early 2015. The decrease in oil price during the first quarter of 2015 led to much lower average sale price of our products, together with a 74- day production suspension, resulting in a gross loss.
Operating Expenses: Operating expenses, including selling expenses, and general and administrative expenses, were approximately $4.92 million, or 5.70% of sales for the three months ended March 31, 2016 compared to $4.88 million, or 8.37% of sales for the comparable period in 2015, an increase of $0.04 million or 0.88%, which was not significant. The increase in the operating expenses during the first quarter of 2016 was mainly caused by the increase of our sales.
Interest Income/Expense: For the three months ended March 31, 2016, interest income and interest expense were approximately $2.0 million and $6.4 million, respectively, compared to interest income and interest expense of approximately $3.3 million and $8.3 million, respectively, for the comparative period in 2015. The decrease in interest income was mainly due to decreased deposits as collateral for bank loans and the decrease in interest expense was mainly due to decreased borrowings during the three months ended March 31, 2016.
Net income (loss): Net income was approximately $0.4 million for the three months ended March 31, 2016 compared to a net loss of approximately $47.9 million in the comparative period in 2015, an increase of $48.3 million, or 100.90%. This decrease in net loss was mainly due to the increase of $32.8 million in gross profit and a decrease of $8.1 million in foreign exchange loss during the three months ended March 31, 2016.
Foreign Currency Translation Adjustment: Our reporting currency is the U.S. dollar. Our local currency, RMB, is our functional currency. Results of operations and cash flow are translated at average exchange rates during the period, and assets and liabilities are translated at the unified exchange rate as quoted by the People’s Bank of China at the end of the period. Translation adjustments resulting from this process are included in accumulated other comprehensive income in the statement of shareholders’ equity. Transaction gains and losses that arise from exchange rate fluctuations on transactions denominated in a currency other than the functional currency are included in the results of operations as incurred.
Currency translation adjustments resulting from this process are included in accumulated other comprehensive loss and amounted to $0.2 million for the three months ended March 31, 2016. The balance sheet amounts at March 31, 2016 and December 31, 2015, with the exception of equity, were translated at RMB 6.4612 and RMB 6.1422 to 1.00 U.S. dollar respectively. The equity accounts were translated at their historical rates. The average translation rates applied to income statement accounts for the three months ended March 31, 2016 and 2015 were RMB 6.5279 and RMB 6.1368, respectively, to 1.00 U.S. dollar.
| 23 |
Liquidity and Capital Resources
The following table sets forth a summary of our cash flows for the periods indicated:
| For the Three Months Ended March 31, | ||||||||
| 2016 (Unaudited) | 2015 (Unaudited) | |||||||
| Net cash provided by (used in) operating activities | 5,919 | (60,713 | ) | |||||
| Net cash used in investing activities | (10,983 | ) | (938 | ) | ||||
| Net cash provided by financing activities | 13,994 | 46,554 | ||||||
Net cash provided by operating activities was approximately $5.9 million for the three months ended March 31, 2016 compared to net cash used of approximately $60.7 million for the comparative period in 2015, an increase of $66.6 million or 109.7%. The increase was primarily due to net income and amounts due to related parties and the increase in other payables and accrual liabilities.
Net cash used in investing activities was approximately $11.0 million for the three months ended March 31, 2016 compared to $0.9 million for the comparative period in 2015 representing an increase of $10.0 million or 1070%. The increase was primarily due to an increase of $6.7 million in investments for construction of infrastructures and facilities in accordance with our expansion plan.
Net cash provided by financing activities amounted to approximately $14.0 million for the three months ended March 31, 2016 compared to approximately $46.6 million for the same period in 2015 representing a decrease of $32.6 million or 69.9%. The decrease resulted primarily from the decrease in short-term bank borrowings in the first quarter of 2016.
There is substantial doubt about the Group’s ability to continue as a going concern. The Group continued to finance and support its operations primarily through short-term bank borrowings. Short-term bank borrowings and notes payable amounted to approximately $687 and $695 million at March 31, 2016 and December 31, 2015, respectively. In addition, the Group continued to benefit from favorable PRC tax policies related to consumption tax. As of March 31, 2016, we had consumption tax refund receivables of approximately $54.1 million, which have been fully refunded to us as of the date of this Form 10-Q.
The Group is exploring sources of additional financing, including short-term financing from its vendors and other parties and equity financing. In addition, the Group closely monitored its cash balances, cash needs and expense levels.
Consumption Tax Refund
The PRC government enacted a regulation pursuant to which domestically purchased heavy oil to be used for producing ethylene and aromatics products was exempted from consumption tax. In addition, the consumption tax paid for imported heavy oil is to be refunded if it is used for producing ethylene and aromatics products. Given all the Group’s purchased heavy oils are, or are to be, used for producing ethylene and aromatics products, the Group recognizes a consumption tax recoverable when a consumption tax for heavy oils has been paid and the relevant heavy oils have been used for production of ethylene and aromatics products. At March 31, 2016 and December 31, 2015, the Group recorded an estimated consumption tax recoverable amounting to approximately $54.1 million and $44.4 million, respectively. As of the date of this Form 10-Q, all consumption tax refund receivable as of March 31, 2016 was refunded.
Bank Loans
Before we enter into loan agreements with a lender, the lender will generally approve a comprehensive credit line which is the maximum amount of the loans we can obtain from the lender within a certain time period. The comprehensive credit line is usually secured by one or more third party guaranties or liens on our property and equipment, or a security deposit. Once the comprehensive credit line is approved, we will enter into an individual loan agreement with the lender each time we obtain a loan from the lender under the credit line. Therefore, we typically have multiple loan agreements under one comprehensive credit line with one lender as long as the credit limit has not been reached.
We have entered into short-term loan agreements with our primary lenders such as Bank of China, China Construction Bank and Agricultural Bank of China. As of March 31, 2016, we had an aggregate principal amount of approximately $318 million outstanding under the loan agreements with maturity dates from April 2016 to March 2017 and the annual interest rates from 4.4% to 4.8% per annum. The loan agreements were mainly guaranteed by third parties and individual persons or secured by a lien on our property and equipment. Historically, all debts due have been paid back by us in a timely manner. All short-term bank loans are revolving loans, and the lenders generally agree to extend the loans upon maturity if we request. As the date of this Form 10-Q, we have timely repaid or renewed all short-term bank loans. As such, we expect that outstanding bank loans will be extended if not paid back upon maturity. Depending on our capital needs, we evaluate whether to apply for additional long-term bank loans. We currently have sufficient lines of credit with our primary lenders for both short-term and long-term borrowings for our operations. However, we estimate the total cost of the expansion will be $372.5 million. We plan to fund the expansion through debt financing, cash from operations, and potential equity financing. However, we may not be able to obtain additional financing at acceptable terms, or at all, and, as a result, our ability to increase our production capacity and to expand our business could be adversely affected.
| 24 |
Related Party Transactions
During the three months ended March 31, 2016, we purchased transportation services from Ningbo Xinhe Logistic Co., Ltd (“Ningbo Xinhe”) in a total amount of $879,000. Ningbo Xinhe is a related party to us because Ms. Yushui Huang, our former Vice President of Administration of Ningbo Keyuan, owns 10% interest of Ningbo Xinhe.
During the three months ended March 31, 2016, Mr. Chunfeng Tao, our Chairman and controlling shareholder, provided personal guarantees to our bank loans in a total amount of $91.8 million. In addition, Mr. Tao provided personal guarantees in a total amount of $139.3 million.
During the three months ended March 31, 2016, we purchased raw materials of approximately $21.8 million from Ningbo Litong and $29.2 million from Ningbo Lide. Ningbo Litong is considered as certain other party to us because it previously held 12.75% ownership of Ningbo Keyuan on behalf of Mr. Chunfeng Tao and was controlled and owned by Mr. Tao until September 2011. Ningbo Lide is considered as certain other party to us because it previously held 28.5% ownership of Ningbo Keyuan on behalf of Mr. Chunfeng Tao and was controlled and owned by Mr. Tao until September 2011. The purchase prices of raw materials from Ningbo Litong and Ningbo Lide were determined on the same basis as the purchase prices from other suppliers.
ITEM 3. QUANTITATIVE AND QUALITATIVE DISCLOSURES ABOUT MARKET RISK.
Not applicable to smaller reporting companies.
ITEM 4. CONTROLS AND PROCEDURES.
| (a) Disclosure Controls and Procedures |
Disclosure controls are procedures that are designed with the objective of ensuring that information required to be disclosed in our reports filed under the Exchange Act, such as this Form 10-Q, is recorded, processed, summarized, and reported within the time periods specified in the SEC’s rules and forms. Disclosure controls are also designed with the objective of ensuring that such information is accumulated and communicated to our management, including the Chief Executive Officer and Chief Financial Officer, as appropriate to allow timely decisions regarding required disclosure. We performed an evaluation, under the supervision and with the participation of our management, including our Chief Executive Officer and Chief Financial Officer, of the effectiveness of the design and operation of our disclosure controls and procedures as of the end of the period covered by this Form 10-Q. Based on this evaluation, our Chief Executive Officer and our Chief Financial Officer has concluded that, as of March 31, 2016, our disclosure controls and procedures were not effective to ensure that information required to be disclosed in reports filed under the Exchange Act is recorded, processed, summarized and reported properly within the time periods specified by the SEC, and did not provide reasonable assurance that information required to be disclosed by us in such reports would be accumulated and communicated to our management, including its Chief Executive Officer and Chief Financial Officer, as appropriate, to allow timely decisions regarding required disclosure.
| (b) Changes in Internal Control over Financial Reporting |
In connection with the preparation of our financial statements for the fiscal year ended December 31, 2015 and 2014, the management
determined that our internal control environment is not properly designed due to the existence of certain material weaknesses
and that it did not operate effectively to ensure that our financial statements (and related financial statement disclosures)
were prepared in accordance with US generally accepted accounting principles. We have established a number of remediation measures,
which we believe will remediate the material weaknesses identified, if such measures are effectively implemented and maintained,
however, we cannot assure when or if we will be able to successfully implement these remedial measures. For more information regarding
our controls and procedures, please refer to Item 9A. Controls and Procedures in the Form 10-K.
There were no changes in our internal control over financial reporting (as such term is defined in Rules 13a-15(f) and 15d-15(f) under the Exchange Act) during the fiscal quarter covered by this report that has materially affected, or are reasonably likely to materially affect, our internal control over financial reporting.
| 25 |
PART II - OTHER INFORMATION
ITEM 1. LEGAL PROCEEDINGS.
We may from time to time become a party to various legal or administrative proceedings arising in the ordinary course of our business.
In 2014, Jiujiang Jianan Petrochemicals Engineering Co., Ltd. (“Jiujiang Jianan”) filed a suit against Ningbo Keyuan in the Beilun District People’s Court. Jiujiang Jianan and Ningbo Keyuan are parties to certain service contract pursuant to which Jiujiang Jianan performed maintenance to Ningbo Keyuan’s production equipment. Jiujiang Jianan claimed it had provided additional services and thus was entitled to additional service fee from Ningbo Keyuan. On July 27, 2016, the Beilun District People’s Court issued a judgment that Ningbo Keyuan should pay construction fee of RMB 9.0 million (approximately $1.4 million) plus an interest of RMB 0.8 million (approximately $0.1 million) to Jiujiang Jianan. Ningbo Keyuan appealed to the Ningbo City Intermediate People’s Court on August 8, 2016. The case is currently under the review by the Ningbo Intermediate People’s Court.
In May 2015, Taihua Plastic (Ningbo) Co., Ltd (“Taihua”) filed a complaint against Ningbo Keyuan and Zhongkexuneng in the Ningbo Intermediate People’s Court. Pursuant to a sale agreement between Taihua and Zhongkexuneng, Taihua made a payment of approximately RMB 29.7 million (approximately $4.8 million) to Zhongkexuneng for styrene. Taihua claimed damages in the amount of RMB 29.7 million, along with interest of RMB 0.8 million (approximately $0.1 million) and deductible value added tax of RMB 4.7 million (approximately US$0.7 million). On June 24, 2016, the Ningbo Intermediate People’s Court ruled that Zhongkexuneng should return the payment of RMB 29.7 million (approximately $4.8 million) to Taihua, plus the interest; and Ningbo Keyuan should be jointly liable to such payment as a shareholder of Taihua. Ningbo Keyuan appealed to the Zhejiang Higher People’s Court on July 11, 2016 claiming of its limited liability as a shareholder of a corporation. The case is currently under the trial.
On March 25, 2016, the Sixth Chemical Engineering Construction Co., Ltd (the “Sixth”) brought a suit against Ningbo Keyuan in the Beilun District People’s Court. The Sixth was a contractor who was supposed to build one of Ningbo Keyuan facilities. Completion of the construction was delayed for several months by the Sixth resulting in our loss of approximately RMB 30.4 million (approximately $4.7 million). The Sixth claimed that Ningo Keyuan owed a remaining contractual payment of RMB 24.8 million (approximately $3.8 million) plus the penalties of breach of the contract. In July 2016, Ningbo Keyuan filed a counter claim alleging that the Sixth had breached the contract by delaying the completion of the construction and requesting a total compensation of RMB 30.4 million (approximately $4.7 million) from the Sixth. A hearing is to be scheduled by the Beilun District People’s Court.
In July 2016, Mr. Zongdong Hu filed a labor dispute in Beilun District Ningbo City Labor Arbitration Department claiming a compensation of RMB 0.5 million (approximately $0.08 million). Mr. Hu was a former vice general engineer at Ningbo Keyuan. Ningbo Keyuan decided not to grant Mr. Hu certain amount of cash reward based on the evaluation of his performance in accordance with his employment agreement. Mr. Hu disagrees with our decision. The arbitration is currently pending.
Other than as set forth herein, we are currently not a party to any material legal or administrative proceedings and are not aware of any pending or threatened legal or administrative proceedings against us.
ITEM 1A. RISK FACTORS.
Not applicable to smaller reporting companies.
| 26 |
ITEM 2. UNREGISTERED SALES OF EQUITY SECURITIES AND USE OF PROCEEDS.
(a) As reported in our current report on Form 8-K filed on August 8, 2016, we entered into a side agreement with Delight Reward on August 4, 2016, pursuant to which, Delight Reward agreed to pay us for each convertible share of Common Stock underlying 5,333,340 Series B preferred shares $0.005 per share of Common Stock, for an aggregate purchase price of $27,465.01. We intend to use the proceeds as general capital for the Company.
(b) Not Applicable.
(c) None.
ITEM 3. DEFAULTS UPON SENIOR SECURITIES.
(a) Not Applicable.
(b) Not Applicable.
ITEM 4. MINE SAFETY DISCLOSURES.
Not applicable.
ITEM 5. OTHER INFORMATION.
(a) Not applicable.
(b) Not applicable.
ITEM 6. EXHIBITS.
(a) The following exhibits are filed as part of this report.
| 31.1 * | Certification of Chief Executive Officer and Chief Financial Officer required by Rule 13a-14/15d-14(a) under the Exchange Act | |
| 32.1 * | Certification of Chief Executive Officer and Chief Financial Officer pursuant to 18 U.S.C. Section 1350, as adopted pursuant to Section 906 of the Sarbanes-Oxley Act of 2002. |
| 101.INS * | XBRL Instance Document | |
| 101.SCH* | XBRL Taxonomy Extension Schema Document | |
| 101.CAL* | XBRL Taxonomy Extension Calculation Linkbase Document | |
| 101.DEF* | XBRL Taxonomy Extension Definition Linkbase Document | |
| 101.LAB* | XBRL Taxonomy Extension Label Linkbase Document | |
| 101.PRE* | XBRL Taxonomy Extension Presentation Linkbase Document |
* Filed herewith.
| 27 |
SIGNATURES
In accordance with the requirements of the Exchange Act, the registrant caused this report to be signed on its behalf by the undersigned, thereunto duly authorized.
| Date: November 7, 2016 | Keyuan Petrochemicals, Inc. | |
| By: | /s/ Feng Chen | |
| Feng Chen | ||
| Chief
Executive Officer, Chief Financial Officer and Vice President of Accounting | ||
28