Attached files
| file | filename |
|---|---|
| 8-K - FORM 8-K - SITE Centers Corp. | d247232d8k.htm |
| EX-99.1 - EX-99.1 - SITE Centers Corp. | d247232dex991.htm |
Exhibit 99.2
DDR
Quarterly Financial Supplement
For the nine months ended September 30, 2011
Table of Contents
| Section |
Page | |||
| Earnings Release & Financial Statements |
||||
| Press Release |
1-14 | |||
| Financial Summary |
||||
| Financial Highlights |
15 | |||
| Financial Ratios and Ratings |
16 | |||
| Total Market Capitalization Summary |
17 | |||
| Debt to EBITDA Calculation |
18 | |||
| Significant Accounting Policies |
|
19-20 |
| |
| Other Real Estate Information |
21 | |||
| Reconciliation of Non-GAAP Financial Measures |
|
22-25 |
| |
| Joint Venture Financial Summary |
||||
| Joint Venture Investment Summary |
26 | |||
| Joint Venture Combining Financial Statements |
|
27-28 |
| |
| Investment Summary |
||||
| Acquisitions and Dispositions |
29 | |||
| Developments and Redevelopments |
30-31 | |||
| Projects Primarily on Hold |
32 | |||
| Portfolio Summary |
||||
| Portfolio Characteristics |
33-34 | |||
| Lease Expirations |
35 | |||
| Leased Rate |
36 | |||
| Leasing Summary |
37 | |||
| Net Effective Rents |
38 | |||
| Largest Tenants by Square Footage |
39 | |||
| Largest Tenants by Base Rental Revenues |
40 | |||
| Debt Summary |
||||
| Summary of Consolidated Debt |
41 | |||
| Summary of Joint Venture Debt |
42 | |||
| Consolidated Debt Detail |
43-45 | |||
| Joint Venture Debt Detail |
|
46-48 |
| |
| Analyst Coverage |
||||
| Contact Information |
49 | |||
Property list available online at http://www.ddr.com
DDR considers portions of this information to be forward-looking statements within the meaning of Section 27A of the Securities Act of 1933 and Section 21E of the Securities Exchange Act of 1934, both as amended, with respect to the Company’s expectations for future periods. Although the Company believes that the expectations reflected in such forward-looking statements are based upon reasonable assumptions, it can give no assurance that its expectations will be achieved. For this purpose, any statements contained herein that are not historical fact may be deemed to be forward-looking statements. There are a number of important factors that could cause the results of the Company to differ materially from those indicated by such forward-looking statements, including among other factors, local conditions such as oversupply of space or a reduction in demand for real estate in the area, competition from other available space, dependence on rental income from real property; the loss of, significant downsizing of or bankruptcy of a major tenant; constructing properties or expansions that produce a desired yield on investment; ability to sell assets on commercially reasonable terms; ability to secure equity or debt financing on commercially acceptable terms or at all; or ability to enter into definitive agreements with regard to our financing and joint venture arrangements or our failure to satisfy conditions to the completion of these arrangements; and the finalization of the financial statements for the three and nine months ended September 30, 2011. For additional factors that could cause the results of the Company to differ materially from these indicated in the forward-looking statements, please refer to the Company’s Form 10-K as of December 31, 2010. The Company undertakes no obligation to publicly revise these forward-looking statements to reflect events or circumstances that arise after the date hereof.
For Immediate Release:
| Media Contact: | Investor Contact: | |
| Marty Richmond | Samir Khanal | |
| Vice President Marketing and Corporate Communications |
Senior Director of Investor Relations | |
| 216.755.5500 | 216.755.5500 | |
| mrichmond@ddr.com | skhanal@ddr.com |
DDR REPORTS OPERATING FFO PER DILUTED SHARE
OF $0.24 FOR THE QUARTER ENDED SEPTEMBER 30, 2011
BEACHWOOD, OHIO, October 27, 2011 – DDR Corp. (NYSE: DDR) today announced operating results for the quarter ended September 30, 2011.
SIGNIFICANT THIRD QUARTER ACTIVITY
| • | Reported operating FFO of $0.24 per diluted share, which excludes certain non-operating items |
| • | Continued strong leasing performance with the execution of a total of 516 new leases and renewals for over 2.5 million square feet |
| • | Increased the portfolio leased rate to 93.4% at September 30, 2011 from 93.0% at June 30, 2011 and 92.2% at September 30, 2010 |
| • | Generated positive leasing spreads, with new leases up 15.8% and renewals up 5.7%, for a blended overall spread of 7.3%, which represents a continued improvement from the blended spread of 6.0% for the second quarter of 2011 and the blended spread of 5.0% for the third quarter of 2010 |
| • | Reported same store net operating income growth of 3.7% as compared to an increase of 2.0% for the third quarter of 2010 |
| • | Completed $59 million of sales of non-prime assets |
| • | Completed $110 million of acquisitions of prime assets |
| • | Invested $10 million in a loan collateralized by a prime shopping center |
“We are pleased to report another strong quarter of operating metrics highlighted by continued momentum in leasing transactions generated from growing retailers seeking high-quality real estate in a supply constrained market,” commented DDR’s president and chief executive officer, Daniel B. Hurwitz. “In addition, our ability to source attractive investment opportunities that support the continuation of our capital recycling strategy will provide compelling returns to our shareholders and continue to improve our overall asset quality.”
FINANCIAL HIGHLIGHTS
The Company’s third quarter operating Funds From Operations (“FFO”) was $67.4 million, or $0.24 per diluted share, before $59.3 million of net adjustments. The net adjustments do not include approximately $6.6 million of gains recognized on asset sales already excluded from FFO.
1
The charges and gains, primarily non-cash, for the periods ended September 30, 2011, are summarized as follows (in millions):
| Three Months | Nine Months | |||||||
| Non-cash impairment charges – consolidated assets |
$ | 51.2 | $ | 68.5 | ||||
| Executive separation charge |
0.3 | 11.0 | ||||||
| Loss on debt retirement, net |
0.1 | 0.1 | ||||||
| Non-cash gain on equity derivative instruments (Otto Family warrants) |
— | (21.9 | ) | |||||
| Other (income) expense, net (1) |
(0.2 | ) | 4.8 | |||||
| Equity in net income of joint ventures – loss on asset sales net of gain on debt extinguishment |
6.3 | 7.5 | ||||||
| Impairment of joint venture investments |
— | 1.6 | ||||||
| Non-cash gain on change in control of interests |
— | (22.7 | ) | |||||
| Discontinued operations – non-cash consolidated impairment charges, loss on sales and gain on debt extinguishment |
10.5 | 27.4 | ||||||
| Discontinued operations – non-cash gain on deconsolidation of interests |
(4.7 | ) | (4.7 | ) | ||||
| Gain on disposition of real estate (land), net |
(0.4 | ) | (0.4 | ) | ||||
| Non-controlling interest – portion of impairment charges allocated to outside partners |
(3.8 | ) | (3.8 | ) | ||||
| Write-off of original preferred share issuance costs |
— | 6.4 | ||||||
|
|
|
|
|
|||||
| Total adjustments from FFO to operating FFO |
$ | 59.3 | $ | 73.8 | ||||
|
|
|
|
|
|||||
| (1) | Amounts included in Other (income) expense are detailed as follows: |
| Three Months | Nine Months | |||||||
| Loss on sale of mezzanine note receivable |
$ | — | $ | 5.0 | ||||
| Litigation expenditures |
— | 2.0 | ||||||
| Settlement gain of lease liability obligation |
— | (2.6 | ) | |||||
| Debt extinguishment gain, net |
(0.5 | ) | (0.3 | ) | ||||
| Other |
0.3 | 0.7 | ||||||
|
|
|
|
|
|||||
| $ | (0.2 | ) | $ | 4.8 | ||||
|
|
|
|
|
|||||
FFO applicable to common shareholders for the three-month period ended September 30, 2011, including the above net adjustments, was $8.1 million, or $0.03 per diluted share, which compares to FFO of $37.1 million, or $0.14 per diluted share, for the prior-year comparable period. The decrease in FFO for the three-month period ended September 30, 2011, is primarily the result of an increase in the aggregate impairment charges recorded in 2011 offset by the effect of the non-cash valuation adjustments associated with the warrants issued to the Otto family that were exercised in full for cash in the first quarter of 2011.
FFO applicable to common shareholders for the nine-month period ended September 30, 2011, including the above net adjustments, was $121.3 million, or $0.36 per diluted share, which compares to FFO of $32.7 million, or $0.13 per diluted share, for the prior-year comparable period. The increase in FFO for the nine-month period ended September 30, 2011, is primarily the result of a reduction in the aggregate impairment charges recorded in 2011, the gain on change in control of interests related to the Company’s acquisition of two assets from unconsolidated joint ventures and the effect of the non-cash valuation adjustments associated with the warrants partially offset by an executive separation charge and the write-off of the original issuance costs from the redemption of the Company’s Class G cumulative redeemable preferred shares.
Net loss applicable to common shareholders for the three-month period ended September 30, 2011, was $50.0 million, or $0.18 per diluted share, which compares to a net loss of $24.9 million, or $0.10 per diluted share, for the prior-year comparable period. Net loss applicable to common shareholders for the nine-month period ended September 30, 2011, was $52.1 million, or $0.20 per diluted share, which
2
compares to a net loss of $156.8 million, or $0.65 per diluted share, for the prior-year comparable period. The changes in net loss applicable to common shareholders for the three- and nine-month periods ended September 30, 2011, is primarily due to the same factors impacting FFO as explained above.
LEASING & PORTFOLIO OPERATIONS
The following results for the three-month period ended September 30, 2011, highlight continued strong leasing activity throughout the portfolio:
| • | Executed 220 new leases aggregating approximately 1.0 million square feet and 296 renewals aggregating approximately 1.5 million square feet. |
| • | Total portfolio average annualized base rent per occupied square foot as of September 30, 2011 was $13.76, as compared to $13.21 at September 30, 2010. |
| • | The portfolio leased rate was 93.4% at September 30, 2011, as compared to 93.0% at June 30, 2011 and 92.2% at September 30, 2010. |
| • | On a cash basis, rental rates for new leases increased by 15.8% over prior rents and renewals increased by 5.7%, resulting in an overall blended spread of 7.3%. |
| • | Same store net operating income (“NOI”) increased 3.7% for the three-month period ended September 30, 2011 over the prior-year comparable period. |
ACQUISITIONS & INVESTMENTS
In the third quarter of 2011, the Company acquired three prime assets aggregating 463,677 square feet for a total purchase price of approximately $110.0 million. The Company assumed an aggregate of $67.0 million of mortgage debt in connection with these acquisitions. Two of the prime assets are in Charlotte, North Carolina (Cotswold Village and The Terraces at SouthPark) and one prime asset is in Colorado Springs, Colorado (Chapel Hills East). The assets range between 96% and 100% leased and are occupied by many high-quality retailers typically found in DDR shopping centers including Whole Foods, Marshalls, PetSmart, Best Buy, Harris Teeter, ULTA, Old Navy, and DSW.
As previously announced in the third quarter, the Company has an agreement to acquire Polaris Towne Center in Columbus, Ohio, for $80 million, including the assumption of $45 million in mortgage debt currently encumbering the property. Polaris is a 720,779 square-foot prime asset anchored by Target, Lowe’s, Kroger, Best Buy, T.J.Maxx, Old Navy and ULTA. In connection with this transaction, the Company anticipates selling Town Center Plaza in Leawood, Kansas for $139 million. The Company currently anticipates recognizing a gain, estimated to be approximately $60 million, in connection with the sale of Town Center Plaza, which amount is subject to change based on actual closing and other costs associated with the sale. It is anticipated that this transaction will close in the fourth quarter of 2011, subject to the satisfaction or waiver of customary closing conditions.
In September 2011, the Company invested $10 million in a loan collateralized by a prime shopping center in Miami, Florida.
3
DISPOSITIONS
The Company sold nine consolidated non-prime assets, aggregating approximately 0.9 million square feet, in the third quarter of 2011, generating gross proceeds of approximately $42.0 million. In addition, the Company sold $17.1 million of consolidated non-income producing assets. The Company recorded an aggregate net loss of approximately $1.4 million related to asset sales in the third quarter of 2011.
2011 GUIDANCE
The Company is tightening its guidance for operating FFO for 2011 to a range between $0.95—$1.00 per diluted share.
NON-GAAP DISCLOSURES
FFO is a supplemental non-GAAP financial measurement used as a standard in the real estate industry and a widely accepted measure of real estate investment trust (“REIT”) performance. Management believes that FFO and operating FFO provide additional indicators of the financial performance of a REIT. The Company also believes that FFO and operating FFO more appropriately measure the core operations of the Company and provide benchmarks to its peer group. Neither FFO nor operating FFO represents cash generated from operating activities in accordance with generally accepted accounting principles (“GAAP”), is necessarily indicative of cash available to fund cash needs and should be considered as an alternative to net income computed in accordance with GAAP as an indicator of the Company’s operating performance or as an alternative to cash flow as a measure of liquidity. FFO is defined and calculated by the Company as net income, adjusted to exclude: (i) preferred share dividends, (ii) gains from disposition of depreciable real estate property, except for gains generated from merchant build asset sales, which are presented net of taxes, and those gains that represent the recapture of a previously recognized impairment charge, (iii) extraordinary items and (iv) certain non-cash items. These non-cash items principally include real property depreciation and amortization of intangibles, equity income from joint ventures and equity income from non-controlling interests and adding the Company’s proportionate share of FFO from its unconsolidated joint ventures and non-controlling interests, determined on a consistent basis. The Company calculates operating FFO by excluding the non-operating charges and gains described above. Other real estate companies may calculate FFO and operating FFO in a different manner. FFO excluding the net non-operating items detailed above is useful to investors as the Company removes these charges and gains to analyze the results of its operations and assess performance of the core operating real estate portfolio. A reconciliation of net income (loss) to FFO and operating FFO is presented in the financial highlights section of the Company’s quarterly supplement.
SAFE HARBOR
DDR considers portions of the information in this press release to be forward-looking statements within the meaning of Section 27A of the Securities Act of 1933 and Section 21E of the Securities Exchange Act of 1934, both as amended, with respect to the Company’s expectation for future periods. Although the Company believes that the expectations reflected in such forward-looking statements are based upon reasonable assumptions, it can give no assurance that its expectations will be achieved. For this purpose, any statements contained herein that are not historical fact may be deemed to be forward-looking statements. There are a number of important factors that could cause our results to differ materially from those indicated by such forward-looking statements, including, among other factors, local conditions such as oversupply of space or a reduction in demand for real estate in the area; competition from other available space; dependence on rental income from real property; the loss of, significant downsizing of or bankruptcy of a major tenant; constructing properties or expansions that produce a desired yield on investment; our ability to sell assets on commercially reasonable terms; our ability to secure equity or debt financing on commercially acceptable terms or at all; our ability to enter into definitive agreements with regard to our financing and joint venture arrangements or our failure to satisfy conditions to the completion of these arrangements; and the finalization of the financial statements for the three-month period ended September 30, 2011. For additional factors that could cause the results of the Company to
4
differ materially from those indicated in the forward-looking statements, please refer to the Company’s Form 10-K for the year ended December 31, 2010. The Company undertakes no obligation to publicly revise these forward-looking statements to reflect events or circumstances that arise after the date hereof.
ABOUT DDR
DDR is an owner and manager of 538 value-oriented shopping centers representing 140 million square feet in 41 states, Puerto Rico and Brazil. The Company’s assets are concentrated in high barrier-to-entry markets with stable populations and high growth potential and its portfolio is actively managed to create long-term shareholder value. DDR is a self-administered and self-managed REIT operating as a fully integrated real estate company, and is publicly traded on the New York Stock Exchange under the ticker symbol DDR. Additional information about the company is available at www.ddr.com.
CONFERENCE CALL INFORMATION & SUPPLEMENTAL MATERIALS
A copy of the Company’s Supplemental Financial/Operational package is available to all interested parties upon request to Samir Khanal, at the Company’s corporate office, 3300 Enterprise Parkway, Beachwood, Ohio 44122 or at www.ddr.com.
The Company will hold its quarterly conference call tomorrow, October 28, 2011, at 10:00 a.m. Eastern Daylight Time. To participate, please dial 800.638.4930 (domestic), or 617.614.3944 (international) at least ten minutes prior to the scheduled start of the call. When prompted, provide the passcode: 52381365. Access to the live call and replay will also be available through the Company’s website. The replay will be available through November 4, 2011.
5
DDR Corp.
Financial Highlights
(In thousands)
| Three-Month Periods Ended September 30, |
Nine-Month Periods Ended September 30, |
|||||||||||||||
| 2011 | 2010 | 2011 | 2010 | |||||||||||||
| Revenues: |
||||||||||||||||
| Minimum rents (A) |
$ | 131,457 | $ | 129,120 | $ | 393,146 | $ | 388,393 | ||||||||
| Percentage and overage rents (A) |
1,110 | 895 | 3,812 | 3,319 | ||||||||||||
| Recoveries from tenants |
42,586 | 43,331 | 131,898 | 130,038 | ||||||||||||
| Ancillary and other property income |
7,535 | 5,692 | 21,658 | 14,844 | ||||||||||||
| Management, development and other fee income |
11,210 | 12,961 | 34,852 | 40,122 | ||||||||||||
| Other (B) |
2,550 | 993 | 4,726 | 6,798 | ||||||||||||
|
|
|
|
|
|
|
|
|
|||||||||
| 196,448 | 192,992 | 590,092 | 583,514 | |||||||||||||
|
|
|
|
|
|
|
|
|
|||||||||
| Expenses: |
||||||||||||||||
| Operating and maintenance (C) |
34,027 | 32,473 | 106,937 | 100,277 | ||||||||||||
| Real estate taxes |
26,465 | 28,747 | 79,217 | 79,956 | ||||||||||||
| Impairment charges (D) |
51,245 | — | 68,457 | 59,277 | ||||||||||||
| General and administrative (E) |
17,954 | 20,180 | 65,310 | 62,546 | ||||||||||||
| Depreciation and amortization |
56,249 | 53,052 | 166,496 | 159,705 | ||||||||||||
|
|
|
|
|
|
|
|
|
|||||||||
| 185,940 | 134,452 | 486,417 | 461,761 | |||||||||||||
|
|
|
|
|
|
|
|
|
|||||||||
| Other income (expense): |
||||||||||||||||
| Interest income |
2,459 | 1,614 | 7,675 | 4,425 | ||||||||||||
| Interest expense (F) |
(58,169 | ) | (52,014 | ) | (175,218 | ) | (161,488 | ) | ||||||||
| (Loss) gain on debt retirement, net (F) |
(134 | ) | 333 | (134 | ) | 333 | ||||||||||
| (Loss) gain on equity derivative instruments (G) |
— | (11,278 | ) | 21,926 | (14,618 | ) | ||||||||||
| Other income (expense), net (H) |
182 | (3,874 | ) | (4,825 | ) | (18,357 | ) | |||||||||
|
|
|
|
|
|
|
|
|
|||||||||
| (55,662 | ) | (65,219 | ) | (150,576 | ) | (189,705 | ) | |||||||||
|
|
|
|
|
|
|
|
|
|||||||||
| Loss before earnings from equity method investments and other items |
(45,154 | ) | (6,679 | ) | (46,901 | ) | (67,952 | ) | ||||||||
| Equity in net (loss) income of joint ventures (I) |
(2,590 | ) | (4,801 | ) | 15,951 | (3,777 | ) | |||||||||
| Impairment of joint venture investments (D) |
— | — | (1,671 | ) | — | |||||||||||
| Gain on change in control of interests (J) |
— | — | 22,710 | — | ||||||||||||
| Tax (expense) benefit of taxable REIT subsidiaries and state franchise and income taxes |
(299 | ) | (1,118 | ) | (1,041 | ) | 1,527 | |||||||||
|
|
|
|
|
|
|
|
|
|||||||||
| Loss from continuing operations |
(48,043 | ) | (12,598 | ) | (10,952 | ) | (70,202 | ) | ||||||||
| Loss from discontinued operations (K) |
(5,226 | ) | (3,307 | ) | (21,656 | ) | (93,371 | ) | ||||||||
|
|
|
|
|
|
|
|
|
|||||||||
| Loss before gain on disposition of real estate |
(53,269 | ) | (15,905 | ) | (32,608 | ) | (163,573 | ) | ||||||||
| Gain on disposition of real estate, net of tax |
6,587 | 145 | 8,036 | 61 | ||||||||||||
|
|
|
|
|
|
|
|
|
|||||||||
| Net loss |
(46,682 | ) | (15,760 | ) | (24,572 | ) | (163,512 | ) | ||||||||
| Non-controlling interests |
3,693 | 1,450 | 3,512 | 38,380 | ||||||||||||
|
|
|
|
|
|
|
|
|
|||||||||
| Net loss attributable to DDR |
$ | (42,989 | ) | $ | (14,310 | ) | $ | (21,060 | ) | $ | (125,132 | ) | ||||
|
|
|
|
|
|
|
|
|
|||||||||
| Net loss applicable to common shareholders |
$ | (49,956 | ) | $ | (24,877 | ) | $ | (52,082 | ) | $ | (156,834 | ) | ||||
|
|
|
|
|
|
|
|
|
|||||||||
| Funds From Operations (“FFO”): |
||||||||||||||||
| Net loss applicable to common shareholders |
$ | (49,956 | ) | $ | (24,877 | ) | $ | (52,082 | ) | $ | (156,834 | ) | ||||
| Depreciation and amortization of real estate investments |
54,474 | 53,026 | 163,197 | 161,769 | ||||||||||||
| Equity in net loss (income) of joint ventures (I) |
2,590 | 4,801 | (15,951 | ) | 3,777 | |||||||||||
| Joint ventures’ FFO (I) |
7,569 | 10,457 | 35,158 | 32,319 | ||||||||||||
| Non-controlling interests (OP Units) |
24 | 8 | 56 | 24 | ||||||||||||
| Gain on disposition of depreciable real estate |
(6,602 | ) | (6,339 | ) | (9,120 | ) | (8,394 | ) | ||||||||
|
|
|
|
|
|
|
|
|
|||||||||
| FFO applicable to common shareholders |
8,099 | 37,076 | 121,258 | 32,661 | ||||||||||||
| Write-off of original preferred share issuance costs (L) |
— | — | 6,402 | — | ||||||||||||
| Preferred dividends |
6,967 | 10,567 | 24,620 | 31,702 | ||||||||||||
|
|
|
|
|
|
|
|
|
|||||||||
| FFO |
$ | 15,066 | $ | 47,643 | $ | 152,280 | $ | 64,363 | ||||||||
|
|
|
|
|
|
|
|
|
|||||||||
| Per share data: |
||||||||||||||||
| Earnings per common share |
||||||||||||||||
| Basic |
$ | (0.18 | ) | $ | (0.10 | ) | $ | (0.20 | ) | $ | (0.65 | ) | ||||
|
|
|
|
|
|
|
|
|
|||||||||
| Diluted |
$ | (0.18 | ) | $ | (0.10 | ) | $ | (0.20 | ) | $ | (0.65 | ) | ||||
|
|
|
|
|
|
|
|
|
|||||||||
| Basic – average shares outstanding |
274,639 | 249,139 | 268,270 | 241,679 | ||||||||||||
|
|
|
|
|
|
|
|
|
|||||||||
| Diluted – average shares outstanding |
274,639 | 249,139 | 268,270 | 241,679 | ||||||||||||
|
|
|
|
|
|
|
|
|
|||||||||
| Dividends Declared |
$ | 0.06 | $ | 0.02 | $ | 0.14 | $ | 0.06 | ||||||||
|
|
|
|
|
|
|
|
|
|||||||||
| Funds From Operations – Basic (M) |
$ | 0.03 | $ | 0.15 | $ | 0.45 | $ | 0.13 | ||||||||
|
|
|
|
|
|
|
|
|
|||||||||
| Funds From Operations – Diluted (M) |
$ | 0.03 | $ | 0.14 | $ | 0.36 | $ | 0.13 | ||||||||
|
|
|
|
|
|
|
|
|
|||||||||
6
DDR Corp.
Financial Highlights
(In thousands)
| Selected Balance Sheet Data |
||||||||
| September 30, 2011 | December 31, 2010 | |||||||
| Assets: |
||||||||
| Real estate and rental property: |
||||||||
| Land |
$ | 1,852,940 | $ | 1,837,403 | ||||
| Buildings |
5,494,699 | 5,491,489 | ||||||
| Fixtures and tenant improvements |
372,670 | 339,129 | ||||||
|
|
|
|
|
|||||
| 7,720,309 | 7,668,021 | |||||||
| Less: Accumulated depreciation |
(1,537,709 | ) | (1,452,112 | ) | ||||
|
|
|
|
|
|||||
| 6,182,600 | 6,215,909 | |||||||
| Land held for development and construction in progress |
644,028 | 743,218 | ||||||
| Real estate held for sale, net |
6,284 | — | ||||||
|
|
|
|
|
|||||
| Real estate, net |
6,832,912 | 6,959,127 | ||||||
| Investments in and advances to joint ventures |
376,613 | 417,223 | ||||||
| Cash |
20,681 | 19,416 | ||||||
| Restricted cash |
4,006 | 4,285 | ||||||
| Notes receivable, net |
112,458 | 120,330 | ||||||
| Receivables, including straight-line rent, net |
118,331 | 123,259 | ||||||
| Other assets, net |
138,180 | 124,450 | ||||||
|
|
|
|
|
|||||
| $ | 7,603,181 | $ | 7,768,090 | |||||
|
|
|
|
|
|||||
| Liabilities & Equity: |
||||||||
| Indebtedness: |
||||||||
| Revolving credit facilities |
$ | 226,433 | $ | 279,865 | ||||
| Unsecured debt |
2,158,931 | 2,043,582 | ||||||
| Mortgage and other secured debt |
1,840,357 | 1,978,553 | ||||||
|
|
|
|
|
|||||
| 4,225,721 | 4,302,000 | |||||||
| Dividends payable |
23,585 | 12,092 | ||||||
| Equity derivative liability (G) |
— | 96,237 | ||||||
| Other liabilities |
249,557 | 223,074 | ||||||
|
|
|
|
|
|||||
| Total liabilities |
4,498,863 | 4,633,403 | ||||||
| Preferred shares (L) |
375,000 | 555,000 | ||||||
| Common shares (M) |
27,708 | 25,627 | ||||||
| Paid-in-capital (G) |
4,136,752 | 3,868,990 | ||||||
| Accumulated distributions in excess of net income |
(1,469,432 | ) | (1,378,341 | ) | ||||
| Deferred compensation obligation |
12,781 | 14,318 | ||||||
| Accumulated other comprehensive income |
1,885 | 25,646 | ||||||
| Less: Common shares in treasury at cost |
(13,347 | ) | (14,638 | ) | ||||
| Non-controlling interests |
32,971 | 38,085 | ||||||
|
|
|
|
|
|||||
| Total equity |
3,104,318 | 3,134,687 | ||||||
|
|
|
|
|
|||||
| $ | 7,603,181 | $ | 7,768,090 | |||||
|
|
|
|
|
|||||
7
DDR Corp.
Financial Highlights
| (A) | Base and percentage rental revenues for the nine-month period ended September 30, 2011, as compared to the prior-year comparable period, increased $6.5 million. This increase consisted of increased leasing activity at comparable portfolio properties, contributing $4.0 million and the acquisition of interests in five shopping centers, generating an additional $3.7 million in revenues offset by a net decrease in revenues from development and redevelopment assets of $1.2 million. Included in rental revenues for the nine-month periods ended September 30, 2011 and 2010, is approximately $0.2 million and $1.7 million, respectively, of revenue resulting from the recognition of straight-line rents, including discontinued operations. |
| (B) | Other revenues were comprised of the following (in millions): |
| Three-Month Periods Ended September 30, |
Nine-Month Periods Ended September 30, |
|||||||||||||||
| 2011 | 2010 | 2011 | 2010 | |||||||||||||
| Lease termination fees |
$ | 2.6 | $ | 0.5 | $ | 3.9 | $ | 4.1 | ||||||||
| Financing fees |
— | 0.3 | 0.3 | 0.7 | ||||||||||||
| Other miscellaneous |
— | 0.2 | 0.5 | 2.0 | ||||||||||||
|
|
|
|
|
|
|
|
|
|||||||||
| $ | 2.6 | $ | 1.0 | $ | 4.7 | $ | 6.8 | |||||||||
|
|
|
|
|
|
|
|
|
|||||||||
| (C) | Operating and maintenance expense, including discontinued operations, includes the following expenses (in millions): |
| Three-Month Periods Ended September 30, |
Nine-Month Periods Ended September 30, |
|||||||||||||||
| 2011 | 2010 | 2011 | 2010 | |||||||||||||
| Bad debt expense |
$ | 2.3 | $ | 2.9 | $ | 7.1 | $ | 10.2 | ||||||||
| Ground rent expense (1) |
1.1 | 1.2 | 3.2 | 3.7 | ||||||||||||
| (1) | Includes non-cash expense of approximately $0.5 million for both of the three-month periods ended September 30, 2011 and 2010, and approximately $1.5 million for both of the nine-month periods ended September 30, 2011 and 2010, related to straight-line ground rent expense. |
| (D) | The Company recorded impairment charges during the three- and nine-month periods ended September 30, 2011 and 2010, on the following (in millions): |
| Three-Month Periods Ended September 30, |
Nine-Month Periods Ended September 30, |
|||||||||||||||
| 2011 | 2010 | 2011 | 2010 | |||||||||||||
| Land held for development (1) |
$ | 40.2 | $ | — | $ | 40.2 | $ | 54.3 | ||||||||
| Undeveloped land |
2.0 | — | 5.9 | 5.0 | ||||||||||||
| Assets marketed for sale |
9.0 | — | 22.4 | — | ||||||||||||
|
|
|
|
|
|
|
|
|
|||||||||
| Total continuing operations |
51.2 | — | 68.5 | 59.3 | ||||||||||||
| Sold assets or assets held for sale (2) |
2.4 | 7.1 | 11.3 | 48.4 | ||||||||||||
| Assets formerly occupied by Mervyns (3) |
— | — | — | 35.3 | ||||||||||||
|
|
|
|
|
|
|
|
|
|||||||||
| Total discontinued operations |
2.4 | 7.1 | 11.3 | 83.7 | ||||||||||||
|
|
|
|
|
|
|
|
|
|||||||||
| Joint venture investments |
— | — | 1.6 | — | ||||||||||||
|
|
|
|
|
|
|
|
|
|||||||||
| Total impairment charges |
$ | 53.6 | $ | 7.1 | $ | 81.4 | $ | 143.0 | ||||||||
|
|
|
|
|
|
|
|
|
|||||||||
8
DDR Corp.
Financial Highlights
| (1) | The 2011 impairment charges primarily related to land held for development in Yaroslavl, Russia and Brampton, Canada. The asset impairments were triggered by the execution of agreements during the third quarter for the sale of the Company’s interest in these projects. The 2010 impairment charges related to land held for development in Togliatti and Yaroslavl, Russia. The Company’s proportionate share of the impairment charges was $36.4 million and $41.9 million after adjusting for the allocation of loss to the non-controlling interest in the consolidated joint venture that owns the Yaroslavl project for the nine months ended September 30, 2011 and 2010, respectively. |
| (2) | See summary of discontinued operations activity in note (K). |
| (3) | The Company’s proportionate share of these impairments was $16.5 million after adjusting for the allocation of loss to the non-controlling interest in this previously consolidated joint venture for the nine-month period ended September 30, 2010. These assets were deconsolidated in the third quarter of 2010 and all operating results, including the impairment charges, have been reclassified as discontinued operations. See note (K). |
| (E) | General and administrative expenses include internal leasing salaries, legal salaries and related expenses associated with the re-leasing of space, which are charged to operations as incurred. For the nine-month periods ended September 30, 2011 and 2010, general and administrative expenses were approximately 5.3% and 5.0% of total revenues, respectively, including joint venture and managed property revenues. |
During the nine-month period ended September 30, 2011, the Company recorded a charge of $11.0 million as a result of the termination without cause of its Executive Chairman, the terms of which were pursuant to his amended and restated employment agreement. During the nine-month period ended September 30, 2010, the Company incurred a $2.1 million separation charge related to the departure of an executive officer. Excluding these separation charges, general and administrative expenses were 4.4% and 4.9% of total revenues for the nine-month periods ended September 30, 2011 and 2010, respectively.
| (F) | The Company recorded the following in connection with its outstanding convertible debt (in millions): |
| Three-Month Periods Ended September 30, |
Nine-Month Periods Ended September 30, |
|||||||||||||||
| 2011 | 2010 | 2011 | 2010 | |||||||||||||
| Non-cash interest expense related to amortization of the debt discount |
$ | 3.8 | $ | 1.4 | $ | 11.5 | $ | 5.2 | ||||||||
| Non-cash adjustment to (loss) gain on repurchase |
0.1 | — | 0.1 | 4.8 | ||||||||||||
| (G) | Represents the non-cash impact of the valuation adjustments for the equity derivative instruments (warrants) issued as part of the share purchase transaction with the Otto Family completed in 2009. The warrants were exercised in full for cash in March 2011 and the related equity derivative liability was reclassified into paid-in-capital at the date of exercise. |
9
DDR Corp.
Financial Highlights
| (H) | Other income (expenses) were comprised of the following (in millions): |
| Three-Month Periods Ended September 30, |
Nine-Month Periods Ended September 30, |
|||||||||||||||
| 2011 | 2010 | 2011 | 2010 | |||||||||||||
| Litigation-related expenses |
$ | — | $ | (3.5 | ) | $ | (2.0 | ) | $ | (13.5 | ) | |||||
| Loss on sale of mezzanine note receivable |
— | — | (5.0 | ) | — | |||||||||||
| Debt extinguishment gain (costs) |
0.5 | 0.3 | 0.3 | (3.3 | ) | |||||||||||
| Settlement of lease liability obligation |
— | — | 2.6 | — | ||||||||||||
| Abandoned projects and other expenses |
(0.3 | ) | (0.7 | ) | (0.7 | ) | (1.6 | ) | ||||||||
|
|
|
|
|
|
|
|
|
|||||||||
| $ | 0.2 | $ | (3.9 | ) | $ | (4.8 | ) | $ | (18.4 | ) | ||||||
|
|
|
|
|
|
|
|
|
|||||||||
| (I) | At September 30, 2011 and 2010, the Company had an investment in joint ventures, excluding consolidated joint ventures, in 184 and 198 shopping center properties, respectively. See pages 12-14 of this release for a summary of the combined condensed operating results and select balance sheet data of the Company’s unconsolidated joint ventures. |
| (J) | During the nine-month period ended September 30, 2011, the Company acquired its partners’ 50% interest in two shopping centers. The Company accounted for both of these transactions as step acquisitions. Due to the change in control that occurred, the Company recorded an aggregate gain associated with the acquisitions related to the difference between the Company’s carrying value and fair value of the previously held equity interest. |
| (K) | The operating results relating to assets classified as discontinued operations are summarized as follows (in thousands): |
| Three-Month Periods Ended September 30, |
Nine-Month Periods Ended September 30, |
|||||||||||||||
| 2011 | 2010 | 2011 | 2010 | |||||||||||||
| Revenues from operations |
$ | 1,563 | $ | 7,890 | $ | 10,782 | $ | 27,201 | ||||||||
|
|
|
|
|
|
|
|
|
|||||||||
| Operating expenses |
109 | 3,571 | 3,640 | 14,638 | ||||||||||||
| Impairment charges |
2,389 | 7,062 | 11,272 | 83,745 | ||||||||||||
| Interest, net |
500 | 4,234 | 3,695 | 14,909 | ||||||||||||
| Depreciation and amortization |
474 | 2,440 | 3,495 | 9,899 | ||||||||||||
|
|
|
|
|
|
|
|
|
|||||||||
| Total expenses |
3,472 | 17,307 | 22,102 | 123,191 | ||||||||||||
|
|
|
|
|
|
|
|
|
|||||||||
| Loss before disposition of real estate |
(1,909 | ) | (9,417 | ) | (11,320 | ) | (95,990 | ) | ||||||||
| Gain on deconsolidation of interests |
4,716 | 5,221 | 4,716 | 5,221 | ||||||||||||
| (Loss) gain on disposition of real estate, net |
(8,033 | ) | 889 | (15,052 | ) | (2,602 | ) | |||||||||
|
|
|
|
|
|
|
|
|
|||||||||
| Net loss |
$ | (5,226 | ) | $ | (3,307 | ) | $ | (21,656 | ) | $ | (93,371 | ) | ||||
|
|
|
|
|
|
|
|
|
|||||||||
| (L) | In April 2011, the Company redeemed all of its 8.0% Class G cumulative redeemable preferred shares. The Company recorded a non-cash charge of approximately $6.4 million to net loss available to common shareholders in the second quarter of 2011 related to the write-off of the original issuance costs. |
10
DDR Corp.
Financial Highlights
| (M) | For purposes of computing FFO and operating FFO per share, the following share information was used (in millions): |
| At September 30, | ||||||||||||||||
| 2011 | 2010 | |||||||||||||||
| Common shares outstanding |
277.0 | 256.2 | ||||||||||||||
| OP Units outstanding (“OP Units”) |
0.4 | 0.4 | ||||||||||||||
| Three-Month Periods Ended September 30, |
Nine-Month Periods Ended September 30, |
|||||||||||||||
| 2011 | 2010 | 2011 | 2010 | |||||||||||||
| Weighted average common shares outstanding |
276.8 | 251.2 | 270.4 | 243.3 | ||||||||||||
|
|
|
|
|
|
|
|
|
|||||||||
| Assumed conversion of OP Units |
0.4 | 0.4 | 0.4 | 0.4 | ||||||||||||
|
|
|
|
|
|
|
|
|
|||||||||
| FFO Weighted average common shares and OP Units – Basic |
277.2 | 251.6 | 270.8 | 243.7 | ||||||||||||
|
|
|
|
|
|
|
|
|
|||||||||
| Assumed conversion of dilutive securities |
0.5 | 6.3 | 2.2 | 6.5 | ||||||||||||
|
|
|
|
|
|
|
|
|
|||||||||
| FFO and Operating FFO Weighted average common shares and OP Units – Diluted |
277.7 | 257.9 | 273.0 | 250.2 | ||||||||||||
|
|
|
|
|
|
|
|
|
|||||||||
11
DDR Corp.
Summary Results of Combined Unconsolidated Joint Ventures
(In thousands)
Combined condensed income statements
| Three-Month Periods Ended September 30, |
Nine-Month Periods Ended September 30, |
|||||||||||||||
| 2011 | 2010 | 2011 | 2010 | |||||||||||||
| Revenues from operations (A) |
$ | 174,735 | $ | 160,440 | $ | 518,279 | $ | 479,095 | ||||||||
|
|
|
|
|
|
|
|
|
|||||||||
| Operating expenses |
57,988 | 57,847 | 172,669 | 181,256 | ||||||||||||
| Impairment charges (B) |
63,041 | 65 | 63,041 | 65 | ||||||||||||
| Depreciation and amortization of real estate investments |
45,211 | 46,247 | 140,501 | 138,789 | ||||||||||||
| Interest expense |
56,574 | 52,532 | 170,580 | 169,330 | ||||||||||||
|
|
|
|
|
|
|
|
|
|||||||||
| 222,814 | 156,691 | 546,791 | 489,440 | |||||||||||||
|
|
|
|
|
|
|
|
|
|||||||||
| (Loss) income from operations before tax expense and discontinued operations |
(48,079 | ) | 3,749 | (28,512 | ) | (10,345 | ) | |||||||||
| Income tax expense |
(9,434 | ) | (4,114 | ) | (26,963 | ) | (13,947 | ) | ||||||||
|
|
|
|
|
|
|
|
|
|||||||||
| Loss from continuing operations |
(57,513 | ) | (365 | ) | (55,475 | ) | (24,292 | ) | ||||||||
| Discontinued operations: |
||||||||||||||||
| Income (loss) from operations (C) |
228 | (7,583 | ) | (244 | ) | (19,742 | ) | |||||||||
| Gain on debt forgiveness (D) |
— | — | 2,976 | — | ||||||||||||
| (Loss) gain on disposition (E) |
(593 | ) | (13,340 | ) | 21,300 | (25,303 | ) | |||||||||
|
|
|
|
|
|
|
|
|
|||||||||
| Loss before gain on disposition of assets |
(57,878 | ) | (21,288 | ) | (31,443 | ) | (69,337 | ) | ||||||||
| Gain on disposition of assets |
— | — | — | 17 | ||||||||||||
|
|
|
|
|
|
|
|
|
|||||||||
| Net loss |
$ | (57,878 | ) | $ | (21,288 | ) | $ | (31,443 | ) | $ | (69,320 | ) | ||||
|
|
|
|
|
|
|
|
|
|||||||||
| Non-controlling interests |
(6,570 | ) | 10 | (11,564 | ) | (253 | ) | |||||||||
|
|
|
|
|
|
|
|
|
|||||||||
| Net loss attributable to unconsolidated joint ventures |
(64,448 | ) | (21,278 | ) | (43,007 | ) | (69,573 | ) | ||||||||
|
|
|
|
|
|
|
|
|
|||||||||
| Net (loss) income at DDR’s ownership interests (F) |
$ | (6,199 | ) | $ | (4,193 | ) | $ | 14,240 | $ | (4,362 | ) | |||||
|
|
|
|
|
|
|
|
|
|||||||||
| FFO at DDR’s ownership interests (G) |
$ | 7,569 | $ | 10,457 | $ | 35,158 | $ | 32,319 | ||||||||
|
|
|
|
|
|
|
|
|
|||||||||
Combined condensed balance sheets
| September 30, 2011 | December 31, 2010 | |||||||
| Land |
$ | 1,519,924 | $ | 1,566,682 | ||||
| Buildings |
4,646,659 | 4,783,841 | ||||||
| Fixtures and tenant improvements |
162,398 | 154,292 | ||||||
|
|
|
|
|
|||||
| 6,328,981 | 6,504,815 | |||||||
| Less: Accumulated depreciation |
(805,568 | ) | (726,291 | ) | ||||
|
|
|
|
|
|||||
| 5,523,413 | 5,778,524 | |||||||
| Land held for development and construction in progress (H) |
258,986 | 174,237 | ||||||
|
|
|
|
|
|||||
| Real estate, net |
5,782,399 | 5,952,761 | ||||||
| Cash and restricted cash |
342,013 | 122,439 | ||||||
| Receivables, including straight-line rent, net |
108,486 | 111,569 | ||||||
| Leasehold interests |
9,426 | 10,296 | ||||||
| Other assets, net |
177,188 | 181,387 | ||||||
|
|
|
|
|
|||||
| $ | 6,419,512 | $ | 6,378,452 | |||||
|
|
|
|
|
|||||
| Mortgage debt (I) |
$ | 3,891,045 | $ | 3,940,597 | ||||
| Notes and accrued interest payable to DDR |
98,512 | 87,282 | ||||||
| Other liabilities |
227,569 | 186,333 | ||||||
|
|
|
|
|
|||||
| 4,217,126 | 4,214,212 | |||||||
| Accumulated equity |
2,202,386 | 2,164,240 | ||||||
|
|
|
|
|
|||||
| $ | 6,419,512 | $ | 6,378,452 | |||||
|
|
|
|
|
|||||
12
DDR Corp.
Summary Results of Combined Unconsolidated Joint Ventures
| (A) | Revenues for the three- and nine-month periods include the following (in millions): |
| Three-Month Periods Ended September 30, |
Nine-Month Periods Ended September 30, |
|||||||||||||||
| 2011 | 2010 | 2011 | 2010 | |||||||||||||
| Straight-line rents |
$ | 1.0 | $ | 0.9 | $ | 3.6 | $ | 3.0 | ||||||||
| DDR’s proportionate share |
0.2 | 0.1 | 0.9 | 0.4 | ||||||||||||
| (B) | For the three- and nine-month periods ended September 30, 2011, impairment charges were recorded on four assets being marketed for sale, of which the Company’s proportionate share of the impairment charges was approximately $6.2 million. |
| (C) | For the three- and nine-month periods ended September 30, 2010, impairment charges aggregating $8.8 million and $19.7 million, respectively, were reclassified to discontinued operations of which the Company’s proportionate share was approximately $0.3 million and $0.7 million, respectively. |
| (D) | Gain on debt forgiveness is related to one property owned by an unconsolidated joint venture that was transferred to the lender pursuant to a consensual foreclosure proceeding. The operations of the asset have been reclassified as discontinued operations in the combined condensed income statements for all periods presented. |
| (E) | Gain on disposition includes the sale of three properties by three separate unconsolidated joint ventures in 2011. The Company’s proportionate share of the aggregate gain for the assets sold for the nine-month period ended September 30, 2011 was approximately $10.5 million. |
| (F) | Adjustments to the Company’s share of joint venture equity in net income or loss primarily is related to basis differences impacting amortization and depreciation, impairment charges and (loss) gain on dispositions as follows (in millions): |
| Three-Month Periods Ended September 30, |
Nine-Month Periods Ended September 30, |
|||||||||||||||
| 2011 | 2010 | 2011 | 2010 | |||||||||||||
| Income (loss) |
$ | 3.6 | $ | (0.6 | ) | $ | 1.7 | $ | 0.6 | |||||||
| (G) | FFO from unconsolidated joint ventures are summarized as follows (in millions): |
| Three-Month Periods Ended September 30, |
Nine-Month Periods Ended September 30, |
|||||||||||||||
| 2011 | 2010 | 2011 | 2010 | |||||||||||||
| Net loss attributable to unconsolidated joint ventures |
$ | (64.5 | ) | $ | (21.3 | ) | $ | (43.0 | ) | $ | (69.6 | ) | ||||
| Gain on sale of real estate |
— | — | (22.7 | ) | — | |||||||||||
| Depreciation and amortization of real estate investments |
45.4 | 47.8 | 138.5 | 149.8 | ||||||||||||
|
|
|
|
|
|
|
|
|
|||||||||
| FFO |
$ | (19.1 | ) | $ | 26.5 | $ | 72.8 | $ | 80.2 | |||||||
|
|
|
|
|
|
|
|
|
|||||||||
| FFO at DDR ownership interests |
$ | 7.6 | $ | 10.5 | $ | 35.2 | $ | 32.3 | ||||||||
|
|
|
|
|
|
|
|
|
|||||||||
| Operating FFO at DDR’s ownership interests (1) |
$ | 13.9 | $ | 13.6 | $ | 42.7 | $ | 38.7 | ||||||||
|
|
|
|
|
|
|
|
|
|||||||||
| DDR joint venture distributions received, net (2) |
$ | 11.3 | $ | 7.3 | $ | 57.0 | $ | 29.3 | ||||||||
|
|
|
|
|
|
|
|
|
|||||||||
13
DDR Corp.
Summary Results of Combined Unconsolidated Joint Ventures
| (1) | Excluded from operating FFO is the Company’s pro rata share of net charges included in equity in net income of joint ventures primarily related to impairment charges, gain on debt forgiveness and losses on the disposition of assets as disclosed on page 2 of this press release. |
| (2) | Includes loan repayments in 2011 of $23.0 million from the Company’s unconsolidated joint venture, which has assets located in Brazil. |
| (H) | The Company’s proportionate share of joint venture land held for development and construction in progress aggregated approximately $86.7 million and $71.7 million at September 30, 2011 and December 31, 2010, respectively. |
| (I) | The Company’s proportionate share of joint venture debt aggregated approximately $789.1 million and $833.8 million at September 30, 2011 and December 31, 2010, respectively. The $789.1 million includes approximately $48.2 million of non-recourse debt associated with joint ventures for which the Company has written its investment down to zero and is receiving no allocation of income, loss or FFO. |
14
DDR
Quarterly Financial Supplement
For the nine months ended September 30, 2011
FINANCIAL HIGHLIGHTS
(In Millions Except Per Share Information)
| Nine Months Ended September 30, |
Year Ended December 31, | |||||||||||
| 2011 | 2010 | 2009 | ||||||||||
| FUNDS FROM OPERATIONS: |
||||||||||||
| Net Loss Applicable to Common Shareholders |
$ | (52.1 | ) | $ | (251.6 | ) | $ | (398.9 | ) | |||
| Depreciation and Amortization of Real Estate Investments |
163.2 | 217.2 | 224.2 | |||||||||
| Equity in Net Loss (Income) of Joint Ventures |
(16.0 | ) | (5.6 | ) | 9.3 | |||||||
| Joint Venture Funds From Operations |
35.1 | 47.5 | 43.7 | |||||||||
| Non-Controlling Interests (OP Units) |
0.1 | — | 0.2 | |||||||||
| Gain on Disposition of Depreciable Real Estate |
(9.1 | ) | (18.8 | ) | (23.1 | ) | ||||||
|
|
|
|
|
|
|
|||||||
| FUNDS FROM OPERATIONS AVAILABLE TO COMMON SHAREHOLDERS |
121.2 | (11.3 | ) | (144.6 | ) | |||||||
| Write-off of Original Preferred Share Issuance Costs |
6.4 | — | — | |||||||||
| Preferred Dividends |
24.6 | 42.3 | 42.3 | |||||||||
|
|
|
|
|
|
|
|||||||
| FUNDS FROM OPERATIONS |
$ | 152.2 | $ | 31.0 | $ | (102.3 | ) | |||||
|
|
|
|
|
|
|
|||||||
| Net non-operating items excluded from FFO (1) |
73.8 | 275.6 | 442.8 | |||||||||
|
|
|
|
|
|
|
|||||||
| OPERATING FFO AVAILABLE TO COMMON SHAREHOLDERS |
$ | 195.0 | $ | 264.3 | $ | 298.2 | ||||||
|
|
|
|
|
|
|
|||||||
| PER SHARE INFORMATION: |
||||||||||||
| Funds From Operations - Diluted |
$ | 0.36 | $ | (0.05 | ) | $ | (0.90 | ) | ||||
| Operating FFO - Diluted |
$ | 0.71 | $ | 1.04 | $ | 1.83 | ||||||
| Net Loss - Diluted |
$ | (0.20 | ) | $ | (1.03 | ) | $ | (2.51 | ) | |||
| Dividends |
$ | 0.14 | $ | 0.08 | $ | 0.44 | ||||||
| COMMON SHARES & OP UNITS: |
||||||||||||
| Outstanding |
277.4 | 256.6 | 202.0 | |||||||||
| Weighted average - Diluted (FFO) |
273.0 | 247.0 | 160.1 | |||||||||
| Weighted average - Diluted (Operating FFO) |
273.0 | 254.4 | 163.2 | |||||||||
| GEN. & ADMIN. EXPENSES (2) |
$ | 65.3 | $ | 85.6 | $ | 94.4 | ||||||
| REVENUES: |
||||||||||||
| DDR Revenues |
$ | 600.9 | $ | 815.1 | $ | 843.3 | ||||||
| Joint Venture & Managed Revenues |
638.3 | 840.6 | 902.0 | |||||||||
|
|
|
|
|
|
|
|||||||
| TOTAL REVENUES (3) |
$ | 1,239.2 | $ | 1,655.7 | $ | 1,745.3 | ||||||
|
|
|
|
|
|
|
|||||||
| GEN. & ADMIN. EXPENSES AS A PERCENTAGE OF TOTAL REVENUES (2) |
5.3 | % | 5.2 | % | 5.4 | % | ||||||
| NET OPERATING INCOME: |
||||||||||||
| DDR Net Operating Income |
$ | 410.6 | $ | 560.9 | $ | 581.6 | ||||||
| Joint Venture Net Operating Income (at 100%) |
347.1 | 428.1 | 532.3 | |||||||||
|
|
|
|
|
|
|
|||||||
| TOTAL NET OPERATING INCOME (3) |
$ | 757.7 | $ | 989.0 | $ | 1,113.9 | ||||||
|
|
|
|
|
|
|
|||||||
| REAL ESTATE AT COST: |
||||||||||||
| DDR Real Estate at Cost |
$ | 8,379.7 | $ | 8,411.2 | $ | 8,823.7 | ||||||
| Joint Venture Real Estate at Cost (at 100%) |
6,588.0 | 6,679.1 | 7,266.8 | |||||||||
|
|
|
|
|
|
|
|||||||
| TOTAL REAL ESTATE AT COST |
$ | 14,967.7 | $ | 15,090.3 | $ | 16,090.5 | ||||||
|
|
|
|
|
|
|
|||||||
| (1) | See Reconciliation of Non-GAAP Financial Measures for detail of net non-operating items. |
| (2) | The 2011 results include an executive separation charge of $11.0 million. Excluding this charge, general and administrative expenses were approximately 4.4% of total revenues for the nine months ended September 30, 2011. The 2010 results also include an employee separation charge of $5.3 million. Excluding this charge, general and administrative expenses were approximately 4.9% of total revenues for the year ended December 31, 2010. The 2009 results include $15.4 million related to a non-cash change in control charge. Excluding this charge, general and administrative expenses were approximately 4.5% of total revenues. |
| (3) | Includes activities from discontinued operations. |
15
DDR
Quarterly Financial Supplement
For the nine months ended September 30, 2011
Financial Ratios and Ratings
(In Millions, Except Ratios)
| Covenant Threshold |
Actual Covenants Twelve Months Ended September 30, 2011 |
|||||
| PUBLIC DEBT COVENANTS: |
||||||
| Total Debt to Real Estate Assets Ratio |
not to exceed 65% | 49 | % | |||
| Secured Debt to Assets Ratio |
not to exceed 40% | 21 | % | |||
| Value of Unencumbered Assets to Unsecured Debt |
at least 135% | 221 | % | |||
| Fixed Charge Coverage Ratio |
at least 1.5x | 1.8x | ||||
| Nine Months Ended September 30, |
Year Ended December 31, | |||||||||||
| 2011 | 2010 | 2009 | ||||||||||
| DIVIDEND PAYOUT RATIO: |
||||||||||||
| Common Share Dividends and Operating Partnership Interests |
$ | 38.4 | $ | 20.2 | $ | 64.7 | (1) | |||||
| Operating FFO Available to Common Shareholders |
$ | 195.0 | $ | 264.3 | $ | 298.2 | ||||||
|
|
|
|
|
|
|
|||||||
| 19.7 | % | 7.7 | % | 21.7 | %(1) | |||||||
| Debt Rating | Outlook | |||
| CREDIT RATINGS: |
||||
| Moody’s |
Baa3 | Stable | ||
| Fitch |
BB | Positive | ||
| S&P |
BB+ | Stable | ||
| (1) | Includes the issuance of common shares with an aggregate value of $50.8 million resulting in a cash payout ratio of 3.1% in 2009. |
16
DDR
Quarterly Financial Supplement
For the nine months ended September 30, 2011
Total Market Capitalization as of September 30, 2011
(In Millions)
| September 30, 2011 | December 31, 2010 | |||||||||||||||
| Amount | Percentage of Total |
Amount | Percentage of Total |
|||||||||||||
| Common Shares Equity |
$ | 3,023.2 | 39 | % | $ | 3,614.9 | 42 | % | ||||||||
| Perpetual Preferred Stock |
375.0 | 5 | % | 555.0 | 7 | % | ||||||||||
| Fixed-Rate Senior Convertible Notes |
535.8 | 7 | % | 637.6 | 7 | % | ||||||||||
| Fixed-Rate Unsecured Debt |
1,669.6 | 22 | % | 1,464.0 | 17 | % | ||||||||||
| Fixed-Rate Mortgage Debt |
1,244.8 | 16 | % | 1,234.5 | 14 | % | ||||||||||
| Variable-Rate Mortgage Debt |
95.6 | 1 | % | 144.0 | 2 | % | ||||||||||
| Variable-Rate Revolving Credit and Term Debt |
526.4 | 7 | % | 729.9 | 9 | % | ||||||||||
| Fixed-Rate Revolving Credit and Term Debt |
200.0 | 3 | % | 150.0 | 2 | % | ||||||||||
|
|
|
|
|
|
|
|
|
|||||||||
| Total |
$ | 7,670.4 | 100 | % | $ | 8,529.9 | 100 | % | ||||||||
|
|
|
|
|
|
|
|
|
|||||||||
| Debt to Market Capitalization |
55.7% | 51.1% | ||||||||||||||
| • | Market value ($10.90 per share as of September 30, 2011 and $14.09 per share as of December 31, 2010) includes common shares outstanding (277.0 million as of September 30, 2011 and 256.2 million as of December 31, 2010) and operating partnership units equivalent to approximately 0.4 million of the Company’s common shares in each year. |
| • | Debt outstanding excludes accretion adjustment of $46.4 million and $58.0 million recorded at September 30, 2011 and December 31, 2010, respectively, for the outstanding convertible notes as required by accounting standards due to the initial value of the equity conversion feature. |
| • | Consolidated debt includes 100% of consolidated joint venture debt of which the joint venture partners’ share is $21.7 million and $22.1 million at September 30, 2011 and December 31, 2010, respectively. |
| • | Does not include proportionate share of unconsolidated joint venture debt aggregating $789.1 million and $833.8 million at September 30, 2011 and December 31, 2010, respectively. |
17
DDR
Quarterly Financial Supplement
For the nine months ended September 30, 2011
| (In Millions) | Quarter ended | Quarter ended | ||||||
| September 30, 2011 | December 31, 2010 | |||||||
| Debt to EBITDA - consolidated |
||||||||
| EBITDA: |
||||||||
| Net loss attributable to DDR |
$ | (43.0 | ) | $ | (84.2 | ) | ||
| Adjustments: |
||||||||
| Impairment charges |
51.2 | 28.9 | ||||||
| Executive separation charges |
0.3 | 3.2 | ||||||
| Depreciation and amortization |
56.2 | 57.5 | ||||||
| Depreciation attributable to non-controlling interests |
— | (0.1 | ) | |||||
| Interest expense |
58.2 | 59.8 | ||||||
| Interest expense attributable to non-controlling interests |
— | (0.1 | ) | |||||
| Loss on equity derivative instruments |
— | 25.5 | ||||||
| Other (income) expenses, net |
(0.2 | ) | 6.0 | |||||
| Equity in net loss (income) of joint ventures |
2.6 | (9.4 | ) | |||||
| Impairment of joint venture investments |
— | 0.2 | ||||||
| Loss (gain) on debt retirement, net |
0.1 | (0.2 | ) | |||||
| Income tax expense |
0.3 | 49.5 | ||||||
| EBITDA adjustments from discontinued operations (1) |
6.1 | (8.0 | ) | |||||
| Gain on disposition of real estate, net |
(6.6 | ) | (1.3 | ) | ||||
| Impairment charges applicable to non-controlling interests |
(3.8 | ) | — | |||||
|
|
|
|
|
|||||
| EBITDA before JVs |
$ | 121.4 | $ | 127.3 | ||||
| Pro rata share of JV FFO |
7.6 | 15.2 | ||||||
| Pro rata share of JV impairments and (gain) loss on disposition of assets |
6.3 | 0.5 | ||||||
|
|
|
|
|
|||||
| EBITDA Consolidated |
$ | 135.3 | $ | 143.0 | ||||
| EBITDA Consolidated - annualized |
$ | 541.2 | $ | 572.0 | ||||
| Consolidated indebtedness |
$ | 4,225.7 | $ | 4,302.0 | ||||
| Non-controlling interests’ share of consolidated debt |
(21.7 | ) | (22.1 | ) | ||||
| Adjustment to reflect convertible debt at face value |
46.4 | 58.0 | ||||||
|
|
|
|
|
|||||
| Total consolidated indebtedness |
$ | 4,250.4 | $ | 4,337.9 | ||||
| Cash and restricted cash |
(24.7 | ) | (23.7 | ) | ||||
|
|
|
|
|
|||||
| Total consolidated indebtedness, net of cash |
$ | 4,225.7 | $ | 4,314.2 | ||||
|
|
|
|
|
|||||
| Debt/EBITDA - consolidated |
7.81 | 7.54 | ||||||
|
|
|
|
|
|||||
| Ratio reflects Company’s consolidated EBITDA and pro rata share of JV FFO. The JV FFO, which is net of interest expense, reflects the earnings available to the Company to service consolidated debt as the JV debt is generally non-recourse to the Company. | ||||||||
| Debt to EBITDA - pro rata |
||||||||
| EBITDA before JVs |
$ | 121.4 | $ | 127.3 | ||||
| Pro rata share of JV EBITDA |
27.2 | 30.4 | ||||||
|
|
|
|
|
|||||
| EBITDA including pro rata share of JVs |
$ | 148.6 | $ | 157.7 | ||||
| EBITDA including pro rata share of JVs - annualized |
$ | 594.4 | $ | 630.8 | ||||
| Total consolidated indebtedness, net of cash |
$ | 4,225.7 | $ | 4,314.2 | ||||
| Pro rata share of JV debt (2) |
789.1 | 833.8 | ||||||
|
|
|
|
|
|||||
| Total pro rata indebtedness |
$ | 5,014.8 | $ | 5,148.0 | ||||
| Pro rata share of JV cash and restricted cash |
(96.9 | ) | (32.6 | ) | ||||
|
|
|
|
|
|||||
| Pro rata indebtedness, net of cash |
$ | 4,917.9 | $ | 5,115.4 | ||||
|
|
|
|
|
|||||
| Debt/EBITDA - pro rata |
8.27 | 8.11 | ||||||
|
|
|
|
|
|||||
| Ratio includes Company’s pro rata share of JV EBITDA and the Company’s pro rata share of JV debt outstanding. |
| |||||||
| Notes: |
||||||||
| (1) Discontinued operations includes the following EBITDA adjustments: |
||||||||
| Impairment charges |
$ | 2.4 | $ | — | ||||
| Gain on change in control of interests |
(4.7 | ) | — | |||||
| Interest expense, net |
0.5 | 0.2 | ||||||
| Depreciation and amortization |
0.5 | 0.2 | ||||||
| Loss (gain) on disposition of real estate, net |
8.0 | (8.4 | ) | |||||
| Debt extinguishment gains |
(0.5 | ) | — | |||||
| Other |
(0.1 | ) | — | |||||
|
|
|
|
|
|||||
| $ | 6.1 | $ | (8.0 | ) | ||||
|
|
|
|
|
| (2) | Includes $48.2 million and $47.7 million at September 30, 2011 and December 31, 2010, respectively, of debt representing the Company’s proportionate share of non-recourse debt associated with equity method joint ventures for which the Company has written its investment down to zero and is receiving no allocation of income. |
18
DDR
Quarterly Financial Supplement
For the nine months ended September 30, 2011
Significant Accounting Policies
Revenues
| • | Percentage and overage rents are recognized after the tenants’ reported sales have exceeded the applicable sales breakpoint. |
| • | Revenues associated with tenant reimbursements are recognized in the period in which the expenses are incurred based upon the provisions of tenants’ leases. |
| • | Lease termination fees are included in other revenue and recognized upon termination of a tenant’s lease, which generally coincides with the receipt of cash. |
| • | Base rental revenue includes income from ground leases of $15.9 million for the nine months ended September 30, 2011. |
General and Administrative Expenses
| • | General and administrative expenses include internal leasing salaries, legal salaries and related expenses associated with the leasing of space which are charged to operations as incurred. For the nine months ended September 30, 2011, the Company expensed $6.3 million in internal leasing costs. All internal and external costs associated with acquisitions are expensed as incurred. The Company does not capitalize any executive officer compensation. |
Deferred Financing Costs
| • | Costs incurred in obtaining long-term financing are included in deferred charges and are amortized over the terms of the related debt agreements; such amortization is reflected as interest expense in the consolidated statements of operations. |
Real Estate
| • | Real estate assets are stated at cost less accumulated depreciation, which, in the opinion of management, is not in excess of the individual property’s estimated undiscounted future cash flows, including estimated proceeds from disposition. |
| • | Depreciation and amortization are provided on a straight-line basis over the estimated useful lives of the assets as follows: |
| Buildings | 15 to 31 years | |
| Furniture/Fixtures |
Useful lives, which approximate lease |
19
DDR
Quarterly Financial Supplement
For the nine months ended September 30, 2011
Significant Accounting Policies (Continued)
| • | Expenditures for maintenance and repairs are charged to operations as incurred. Renovations that improve or extend the life of the asset are capitalized. |
| • | Construction in progress includes shopping center developments and significant expansions and redevelopments. |
| • | The Company accounts for the acquisition of a partner’s interest in an unconsolidated joint venture in which a change in control of the asset has occurred at fair value. |
Capitalization
| • | The Company capitalizes interest on funds used for the construction or expansion of shopping centers and certain construction administration costs. Capitalization of interest and administration costs ceases when construction activities are completed and the property is available for occupancy by tenants or when activities are suspended. |
| Nine Months | ||||||||||||
| Ended | ||||||||||||
| September 30, | Year Ended December 31, | |||||||||||
| Capitalized Costs (In Millions) |
2011 | 2010 | 2009 | |||||||||
| Interest expense |
$ | 9.4 | $ | 12.2 | $ | 21.8 | ||||||
| Construction administration costs |
$ | 6.7 | $ | 8.8 | $ | 10.9 | ||||||
| • | Interest and real estate taxes incurred during the construction period are capitalized and depreciated over the building life. |
| • | During the nine months ended September 30, 2011, the Company expensed $3.2 million in operating costs related to development projects that have been suspended. |
Gains on Sales of Real Estate
| • | Gains on sales of real estate generally related to the sale of outlots and land adjacent to existing shopping centers are recognized at closing when the earnings process is deemed to be complete. |
| • | Gains or losses on the sales of operating shopping centers are reflected as discontinued operations. |
20
DDR
Quarterly Financial Supplement
For the nine months ended September 30, 2011
Other Real Estate Information
Total Capital Expenditures
| • | The Company incurred the following estimated leasing and maintenance capital expenditures including costs associated with anchor store re-tenanting related to major tenant bankruptcies. |
| Unconsolidated | ||||||||
| Consolidated | at Prorata | |||||||
| Nine Months | Nine Months | |||||||
| Ended | Ended | |||||||
| Capital Expenditures (In Millions) |
September 30, 2011 | September 30, 2011 | ||||||
| Leasing |
$ | 27.5 | $ | 4.4 | ||||
| Maintenance |
5.6 | 0.7 | ||||||
|
|
|
|
|
|||||
| Total Capital Expenditures |
$ | 33.1 | $ | 5.1 | ||||
|
|
|
|
|
|||||
| Per Square Foot of Owned GLA |
||||||||
| Leasing |
$ | 0.59 | $ | 0.64 | ||||
| Maintenance |
0.12 | 0.09 | ||||||
|
|
|
|
|
|||||
| Total Capital Expenditures |
$ | 0.71 | $ | 0.73 | ||||
|
|
|
|
|
|||||
Undeveloped Land
| • | Included in Land is undeveloped real estate, comprised primarily of outlots or expansion pads adjacent to the shopping centers owned by the Company. |
| • | At December 31, 2010, the Company estimated the value of its consolidated and proportionate share of joint venture undeveloped land adjacent to existing shopping centers to be approximately $35 million. This value has not been adjusted to reflect changes in market activity subsequent to December 31, 2010. |
Non-Income Producing Assets
| • | There are ten consolidated shopping centers and the Company’s corporate headquarters, which total 0.8 million square feet with a land and building cost basis of approximately $100 million, considered non-incoming producing at September 30, 2011. |
21
DDR
Quarterly Financial Supplement
For the nine months ended September 30, 2011
Reconciliation of Supplemental Non-GAAP Financial Measures
Same Store NOI
(In Millions)
Same Store Net Operating Income (NOI) represents shopping center assets owned for comparable periods (15 months for quarter comparison). Same Store NOI excludes the following:
| • | Assets under development or redevelopment |
| • | Straight-line rental income and expense |
| • | Income related to lease terminations |
| • | Provisions for uncollectible amounts and/or recoveries thereof |
| Three Months Ended | Nine Months Ended | |||||||||||||||||||||||
| September 30, | September 30, | |||||||||||||||||||||||
| 2011 | 2010 | 2011 | 2010 | |||||||||||||||||||||
| Total Same Store NOI |
$ | 210.4 | $ | 202.9 | 3.7 | % | $ | 630.4 | $ | 607.7 | 3.7 | % | ||||||||||||
| Property NOI from other operating segments |
39.6 | 31.5 | 116.5 | 93.3 | ||||||||||||||||||||
|
|
|
|
|
|
|
|
|
|||||||||||||||||
| Combined NOI - DDR & Joint Ventures |
$ | 250.0 | $ | 234.4 | $ | 746.9 | $ | 701.0 | ||||||||||||||||
|
|
|
|
|
|
|
|
|
|||||||||||||||||
Reconciliation to Income Statement
| Three Months Ended | Nine Months Ended | |||||||||||||||
| September 30, | September 30, | |||||||||||||||
| 2011 | 2010 | 2011 | 2010 | |||||||||||||
| Total Revenues - DDR |
$ | 196.4 | $ | 193.0 | $ | 590.1 | $ | 583.5 | ||||||||
| Total Revenues - Combined Joint Ventures |
172.1 | 160.4 | 515.6 | 479.1 | ||||||||||||
| Operating and Maintenance - DDR |
(34.0 | ) | (32.5 | ) | (106.9 | ) | (100.3 | ) | ||||||||
| Real Estate Taxes - DDR |
(26.5 | ) | (28.7 | ) | (79.2 | ) | (80.0 | ) | ||||||||
| Operating and Maintenance and Real Estate Taxes - Combined Joint Ventures |
(58.0 | ) | (57.8 | ) | (172.7 | ) | (181.3 | ) | ||||||||
|
|
|
|
|
|
|
|
|
|||||||||
| Combined NOI - DDR & Joint Ventures |
$ | 250.0 | $ | 234.4 | $ | 746.9 | $ | 701.0 | ||||||||
|
|
|
|
|
|
|
|
|
|||||||||
22
DDR
Quarterly Financial Supplement
For the nine months ended September 30, 2011
Reconciliation of Supplemental Non-GAAP Financial Measures
(In Millions)
| Three Months Ended | Nine Months Ended | |||||||||||||||
| September 30, | September 30, | |||||||||||||||
| 2011 | 2010 | 2011 | 2010 | |||||||||||||
| FUNDS FROM OPERATIONS: |
||||||||||||||||
| Net Loss Applicable to Common Shareholders |
$ | (50.0 | ) | $ | (24.9 | ) | $ | (52.1 | ) | $ | (156.8 | ) | ||||
| Depreciation and Amortization of Real Estate Investments |
54.5 | 53.0 | 163.2 | 161.8 | ||||||||||||
| Equity in Net Loss (Income) of Joint Ventures |
2.6 | 4.8 | (16.0 | ) | 3.8 | |||||||||||
| Joint Venture Funds From Operations |
7.6 | 10.5 | 35.1 | 32.3 | ||||||||||||
| Non-Controlling Interests (OP Units) |
— | 0.0 | 0.1 | 0.0 | ||||||||||||
| Gain on Disposition of Depreciable Real Estate |
(6.6 | ) | (6.3 | ) | (9.1 | ) | (8.4 | ) | ||||||||
|
|
|
|
|
|
|
|
|
|||||||||
| FUNDS FROM OPERATIONS AVAILABLE TO COMMON SHAREHOLDERS |
$ | 8.1 | $ | 37.1 | $ | 121.2 | $ | 32.7 | ||||||||
|
|
|
|
|
|
|
|
|
|||||||||
| Write-off of original preferred share issuance costs |
— | — | 6.4 | — | ||||||||||||
| Preferred Dividends |
7.0 | 10.6 | 24.6 | 31.7 | ||||||||||||
|
|
|
|
|
|
|
|
|
|||||||||
| FUNDS FROM OPERATIONS |
$ | 15.1 | $ | 47.7 | $ | 152.2 | $ | 64.4 | ||||||||
|
|
|
|
|
|
|
|
|
|||||||||
| OPERATING FFO: |
||||||||||||||||
| Non-cash impairment charges - consolidated assets |
$ | 51.2 | $ | — | $ | 68.5 | $ | 59.3 | ||||||||
| Executive separation charges |
0.3 | — | 11.0 | 2.1 | ||||||||||||
| Loss (gain) on debt retirement, net |
0.1 | (0.3 | ) | 0.1 | (0.3 | ) | ||||||||||
| Non-cash (gain) loss on equity derivative instruments |
— | 11.3 | (21.9 | ) | 14.6 | |||||||||||
| Other (income) expense, net - litigation, net of tax, debt extinguishment (gain) costs, lease liability settlement, note receivable reserve and other expenses |
(0.2 | ) | 3.9 | 4.8 | 16.0 | |||||||||||
| Equity in net income of joint ventures - loss on asset sales net of gain on debt forgiveness loss on asset sales and impairment charges |
6.3 | 3.0 | 7.5 | 6.4 | ||||||||||||
| Impairment of joint venture investments |
— | — | 1.6 | — | ||||||||||||
| Gain on change in control of interests |
— | — | (22.7 | ) | — | |||||||||||
| Discontinued operations - non-cash consolidated impairment charges, loss on sales and gain on debt extinguishment |
10.5 | 12.4 | 27.4 | 94.2 | ||||||||||||
| Discontinued operations - FFO associated with Mervyns Joint Venture, net of non-controlling interest |
— | 1.0 | — | 4.8 | ||||||||||||
| Discontinued operations - gain on deconsolidation of interests |
(4.7 | ) | (5.2 | ) | (4.7 | ) | (5.2 | ) | ||||||||
| Gain on disposition of real estate (land), net |
(0.4 | ) | — | (0.4 | ) | — | ||||||||||
| Non-controlling interest - portion of impairment charges allocated to outside partners |
(3.8 | ) | — | (3.8 | ) | (31.2 | ) | |||||||||
| Write-off of original preferred share issuance costs |
— | — | 6.4 | — | ||||||||||||
|
|
|
|
|
|
|
|
|
|||||||||
| TOTAL NON-OPERATING ITEMS |
$ | 59.3 | $ | 26.1 | $ | 73.8 | $ | 160.7 | ||||||||
| FUNDS FROM OPERATIONS AVAILABLE TO COMMON SHAREHOLDERS |
8.1 | 37.1 | 121.2 | 32.7 | ||||||||||||
|
|
|
|
|
|
|
|
|
|||||||||
| OPERATING FFO AVAILABLE TO COMMON SHAREHOLDERS |
$ | 67.4 | $ | 63.2 | $ | 195.0 | $ | 193.4 | ||||||||
|
|
|
|
|
|
|
|
|
|||||||||
| Three Months Ended | Nine Months Ended | |||||||||||||||
| September 30, | September 30, | |||||||||||||||
| 2011 | 2010 | 2011 | 2010 | |||||||||||||
| ADDITIONAL NON-CASH DISCLOSURES (Income)/Expense: |
||||||||||||||||
| Below Market Rent Revenue* |
$ | (1.1 | ) | $ | (0.1 | ) | $ | (2.8 | ) | $ | (0.3 | ) | ||||
| Debt Premium Amortization Revenue* |
(0.4 | ) | (0.7 | ) | (1.5 | ) | (2.3 | ) | ||||||||
| Convertible Debt Accretion Expense |
3.8 | 1.4 | 11.5 | 5.2 | ||||||||||||
| Straight-Line Rent Revenue |
(0.1 | ) | (0.4 | ) | (0.2 | ) | (1.7 | ) | ||||||||
| Straight-Line Ground Rent Expense* |
0.5 | 0.5 | 1.5 | 1.5 | ||||||||||||
| Joint Venture Straight-Line Rent Revenue |
(1.0 | ) | (0.9 | ) | (3.6 | ) | (3.0 | ) | ||||||||
| DDR’s Prorata Share of Straight-Line Rent Revenue |
(0.2 | ) | (0.1 | ) | (0.9 | ) | (0.4 | ) | ||||||||
| * | Prorata share of joint venture is deminis |
23
DDR
Quarterly Financial Supplement
For the nine months ended September 30, 2011
Reconciliation of Supplemental Non-GAAP Financial Measures
Consolidated Transactional Income
(In Millions)
| Three Months Ended | Nine Months Ended | |||||||||||||||||
| September 30, | September 30, | |||||||||||||||||
| 2011 | 2010 | 2011 | 2010 | |||||||||||||||
| Included in FFO: |
||||||||||||||||||
| Gain (Loss) on Dispositions, Net of Tax |
$ | (0.4 | ) | $ | 0.1 | $ | (0.5 | ) | $ | (0.6 | ) | |||||||
| Loss on Dispositions from Discontinued Operations |
(8.4 | ) | (5.4 | ) | (16.6 | ) | (10.7 | ) | ||||||||||
| Land Sale Gain (Loss) |
0.8 | — | 1.0 | 0.4 | ||||||||||||||
|
|
|
|
|
|
|
|
|
|||||||||||
| $ | (8.0 | ) | $ | (5.3 | ) | $ | (16.1 | ) | $ | (10.9 | ) | |||||||
|
|
|
|
|
|
|
|
|
|||||||||||
| NOT Included in FFO: |
||||||||||||||||||
| Gain on Dispositions, Net of Tax |
$ | 6.2 | $ | — | $ | 7.5 | $ | 0.3 | ||||||||||
| Gain on Sales from Discontinued Operations |
0.4 | 6.3 | 1.6 | 8.1 | ||||||||||||||
|
|
|
|
|
|
|
|
|
|||||||||||
| $ | 6.6 | $ | 6.3 | $ | 9.1 | $ | 8.4 | FFO Reconciliation | ||||||||||
|
|
|
|
|
|
|
|
|
|||||||||||
| Reconciliation to Income Statement | ||||||||||||||||||
| Gain on Disposition of Real Estate, Net of Tax |
||||||||||||||||||
| Gain (Loss) on Dispositions, Net of Tax |
$ | (0.4 | ) | $ | 0.1 | $ | (0.5 | ) | $ | (0.6 | ) | |||||||
| Land Sale Gain (Loss) |
0.8 | — | 1.0 | 0.4 | ||||||||||||||
| Gain on Dispositions, Net of Tax |
6.2 | — | 7.5 | 0.3 | ||||||||||||||
|
|
|
|
|
|
|
|
|
|||||||||||
| $ | 6.6 | $ | 0.1 | $ | 8.0 | $ | 0.1 | Consolidated Income Statement | ||||||||||
|
|
|
|
|
|
|
|
|
|||||||||||
| Gain (Loss) on Disposition of Real Estate From Discontinued Operations, Net of Tax |
||||||||||||||||||
| Gain (Loss) on Dispositions from Discontinued Operations |
$ | (8.0 | ) | $ | 0.9 | $ | (15.0 | ) | $ | (2.6 | ) | Footnote K to the Press Release | ||||||
|
|
|
|
|
|
|
|
|
|||||||||||
24
DDR
Quarterly Financial Supplement
For the nine months ended September 30, 2011
Reconciliation of Supplemental Non-GAAP Financial Measures
Joint Venture Transactional Income
(In Millions)
| Three Months Ended September 30, |
Nine Months Ended September 30, |
|||||||||||||||||
| 2011 | 2010 | 2011 | 2010 | |||||||||||||||
| Included in FFO: |
||||||||||||||||||
| Loss on Sales from Discontinued Operations |
$ | (0.6 | ) | $ | (13.3 | ) | $ | (1.5 | ) | $ | (25.3 | ) | ||||||
| Land Sale Gains and Loss on Disposition of Real Estate |
— | — | — | — | ||||||||||||||
|
|
|
|
|
|
|
|
|
|||||||||||
| $ | (0.6 | ) | $ | (13.3 | ) | $ | (1.5 | ) | $ | (25.3 | ) | |||||||
|
|
|
|
|
|
|
|
|
|||||||||||
| DDR’s Proportionate Share |
$ | (0.1 | ) | $ | (2.8 | ) | $ | (2.0 | ) | $ | (4.1 | ) | ||||||
|
|
|
|
|
|
|
|
|
|||||||||||
| NOT Included in FFO: |
||||||||||||||||||
| Gain (Loss) on Dispositions |
$ | — | $ | — | $ | — | $ | — | ||||||||||
| Gain on Sales from Discontinued Operations |
— | 22.8 | — | |||||||||||||||
|
|
|
|
|
|
|
|
|
|||||||||||
| $ | — | $ | — | $ | 22.8 | $ | — | |||||||||||
|
|
|
|
|
|
|
|
|
|||||||||||
| DDR’s Proportionate Share |
$ | — | $ | — | $ | 12.5 | $ | — | ||||||||||
|
|
|
|
|
|
|
|
|
|||||||||||
Reconciliation to Income Statement
| Gain on Sales of Real Estate |
||||||||||||||||||
| Land Sale Gains and Loss on Disposition of Real Estate |
$ | — | $ | — | $ | — | $ | — | ||||||||||
| Gain (Loss) on Dispositions |
— | — | — | — | ||||||||||||||
|
|
|
|
|
|
|
|
|
|||||||||||
| $ | — | $ | — | $ | — | $ | — | Gain on Disposition of Assets | ||||||||||
|
|
|
|
|
|
|
|
|
|||||||||||
| Gain (Loss) on Disposition of Real Estate From Discontinued Operations |
||||||||||||||||||
| Gain (Loss) on Sales from Discontinued Operations |
$ | (0.6 | ) | $ | (13.3 | ) | $ | 21.3 | $ | (25.3 | ) | Loss on Disposition of Discontinued Operations | ||||||
|
|
|
|
|
|
|
|
|
25
DDR
Quarterly Financial Supplement
For the nine months ended September 30, 2011
Joint Venture Investment Summary (1)
| All Values at 100% (In Millions) |
||||||||||||||||||||||||
| Legal Name |
Partner(s) |
DDR Ownership % |
Number of Operating Properties |
Gross Leasable Area |
Total Annualized Rent |
Gross Asset Book Value |
Debt | |||||||||||||||||
| Unconsolidated Joint Ventures |
||||||||||||||||||||||||
| DDRTC Core Retail Fund, LLC |
An Affiliate of TIAA-CREF | 15% | 42 | 11.6 | $ | 134.9 | $ | 2,231.6 | $ | 1,212.0 | ||||||||||||||
| DDR Domestic Retail Fund I |
Various Institutional Investors | 20% | 63 | 8.2 | 91.0 | 1,480.5 | 951.5 | |||||||||||||||||
| Sonae Sierra Brasil BV Sarl |
Sonae Sierra, SGPS, SA | 33.3% | 10 | 3.7 | 132.7 | 738.8 | 175.9 | |||||||||||||||||
| DDRA Community Centers Five, L.P. |
DRA Advisors | 50% | 3 | 1.3 | 18.8 | 183.4 | 211.0 | |||||||||||||||||
| Coventry II Joint Ventures |
Coventry II Fund | 20% | 5 | 2.1 | 26.6 | 442.8 | 297.8 | |||||||||||||||||
| RVIP Structures/ DPG Realty Holdings LLC |
Prudential RE Advisors/ Prudential Insurance | 10% -25.75% | 3 | 0.5 | 10.7 | 109.3 | 75.0 | |||||||||||||||||
| DDR-SAU Retail Fund, LLC |
State of Utah | 20% | 27 | 2.3 | 23.1 | 305.6 | 183.1 | |||||||||||||||||
| DDR Markaz II LLC |
Kuwait Financial Centre | 20% | 13 | 1.6 | 15.7 | 206.2 | 150.5 | |||||||||||||||||
| TRT DDR Venture I General Partnership |
Dividend Capital Total Realty Trust | 10% | 3 | 0.5 | 9.2 | 160.3 | 110.0 | |||||||||||||||||
| Other Unconsolidated JV Interests |
Various | Various | 15 | 2.0 | 16.3 | 192.0 | 110.0 | |||||||||||||||||
|
|
|
|
|
|
|
|
|
|
|
|||||||||||||||
| 184 | 33.8 | $ | 479.0 | $ | 6,050.5 | $ | 3,476.8 | |||||||||||||||||
|
|
|
|
|
|
|
|
|
|
|
|||||||||||||||
| Unconsolidated Joint Ventures - No Economic Interests |
||||||||||||||||||||||||
| Coventry II Joint Ventures |
Coventry II Fund | 10% -20% | 41 | (2) | 3.2 | $ | 28.4 | 415.3 | 328.2 | |||||||||||||||
| Other Unconsolidated Interests |
Various | 0% | 6 | 0.6 | 8.4 | 122.2 | 86.0 | |||||||||||||||||
|
|
|
|
|
|
|
|
|
|
|
|||||||||||||||
| Total Unconsolidated Joint Ventures |
231 | 37.6 | $ | 515.8 | $ | 6,588.0 | $ | 3,891.0 | ||||||||||||||||
|
|
|
|
|
|
|
|
|
|
|
|||||||||||||||
| (1) | DDR’s investment in joint ventures may be recorded at different amounts than the proportionate equity on the joint ventures’ balance sheet. |
| (2) | Includes one asset in which development was suspended. |
26
DDR
Quarterly Financial Supplement
For the nine months ended September 30, 2011
Joint Venture Combining Financial Statements
(In Millions)
Combining Balance Sheets
| Total Unconsolidated JVs (1) | ||||||||
| September 30, 2011 | December 31, 2010 | |||||||
| Land |
$ | 1,519.9 | $ | 1,566.7 | ||||
| Buildings |
4,646.7 | 4,783.8 | ||||||
| Fixtures and tenant improvements |
162.4 | 154.3 | ||||||
|
|
|
|
|
|||||
| 6,329.0 | 6,504.8 | |||||||
| Less: Accumulated depreciation |
(805.6 | ) | (726.3 | ) | ||||
|
|
|
|
|
|||||
| 5,523.4 | 5,778.5 | |||||||
| Land held for development and construction in progress |
259.0 | 174.3 | ||||||
|
|
|
|
|
|||||
| Real estate, net |
5,782.4 | 5,952.8 | ||||||
| Cash and restricted cash |
342.0 | 122.4 | ||||||
| Receivables, including straight-line rent, net |
108.5 | 111.6 | ||||||
| Leasehold interests |
9.4 | 10.3 | ||||||
| Other assets, net |
177.2 | 181.3 | ||||||
|
|
|
|
|
|||||
| $ | 6,419.5 | $ | 6,378.4 | |||||
|
|
|
|
|
|||||
| Mortgage debt |
$ | 3,891.0 | (3) | $ | 3,940.6 | (3) | ||
| Notes and accrued interest payable to DDR |
98.5 | 87.3 | ||||||
| Other liabilities |
227.6 | 186.3 | ||||||
|
|
|
|
|
|||||
| 4,217.1 | 4,214.2 | |||||||
| Accumulated equity |
2,202.4 | 2,164.2 | ||||||
|
|
|
|
|
|||||
| $ | 6,419.5 | $ | 6,378.4 | |||||
|
|
|
|
|
|||||
| DDR’s Proportionate Share (1) | ||||||||
| September 30, 2011 | December 31, 2010 | |||||||
| Land |
$ | 291.7 | $ | 320.0 | ||||
| Buildings |
934.5 | 1,047.0 | ||||||
| Fixtures and tenant improvements |
39.0 | 44.8 | ||||||
|
|
|
|
|
|||||
| 1,265.2 | 1,411.8 | |||||||
| Less: Accumulated depreciation |
(179.3 | ) | (184.3 | ) | ||||
|
|
|
|
|
|||||
| 1,085.9 | 1,227.5 | |||||||
| Land held for development and construction in progress |
86.7 | 71.7 | ||||||
|
|
|
|
|
|||||
| Real estate, net |
1,172.6 | 1,299.2 | ||||||
|
|
|
|
|
|||||
| Cash and restricted cash |
104.3 | 39.0 | ||||||
| Receivables, including straight-line rent, net |
26.8 | 33.1 | ||||||
| Leasehold interests |
1.9 | 2.1 | ||||||
| Other assets, net |
42.6 | 48.3 | ||||||
| Disproportionate share of equity |
(21.5 | )(2) | (32.8 | )(2) | ||||
|
|
|
|
|
|||||
| $ | 1,326.7 | $ | 1,388.9 | |||||
|
|
|
|
|
|||||
| Mortgage debt |
$ | 789.1 | (3) | $ | 833.8 | (3) | ||
| Notes and accrued interest payable to DDR |
11.8 | 10.6 | ||||||
| Other liabilities |
51.9 | 51.6 | ||||||
|
|
|
|
|
|||||
| 852.8 | 896.0 | |||||||
| Accumulated equity |
490.6 | 525.7 | ||||||
| Disproportionate share of equity |
(16.7 | )(2) | (32.8 | )(2) | ||||
|
|
|
|
|
|||||
| $ | 1,326.7 | $ | 1,388.9 | |||||
|
|
|
|
|
|||||
| (1) | The financial statements of Sonae Sierra Brasil are translated into U.S. dollars using the exchange rate at each balance sheet date for assets and liabilities. |
| (2) | Adjustments represent the effect of promoted equity structures and minority interests. |
| (3) | Includes approximately $300.8 million and $298.4 million of mortgage debt at September 30, 2011 and December 31, 2010, respectively, of which the Company’s prorata share of non-recourse mortgage debt is $48.2 million and $47.7 million, respectively, associated with joint ventures for which the Company has written its investment down to zero and is receiving no allocation of income. |
27
DDR
Quarterly Financial Supplement
For the nine months ended September 30, 2011
Joint Venture Combining Financial Statements
(In Millions)
Combining Statements of Operations
| Total Unconsolidated JVs (1) | DDR’s Proportionate Share (1) | |||||||||||
| Nine-Month Period Ended September 30, 2011 |
Three-Month Period Ended September 30, 2011 |
Three-Month Period Ended September 30, 2011 |
||||||||||
| Revenues from operations |
$ | 518.3 | $ | 174.7 | $ | 39.5 | ||||||
| Rental operation expenses |
(172.7 | ) | (58.0 | ) | (11.7 | ) | ||||||
| Impairment charges |
(63.0 | ) | (63.0 | ) | (9.8 | ) | ||||||
|
|
|
|
|
|
|
|||||||
| Net operating income |
282.6 | 53.7 | 18.0 | (3) | ||||||||
| Depreciation and amortization expense |
(140.5 | ) | (45.2 | ) | (8.3 | ) | ||||||
| Interest expense |
(170.6 | ) | (56.6 | ) | (10.7 | ) | ||||||
|
|
|
|
|
|
|
|||||||
| Loss before gain on sale of real estate |
(28.5 | ) | (48.1 | ) | (1.0 | ) | ||||||
| Income tax expense |
(27.0 | ) | (9.4 | ) | (3.1 | ) | ||||||
| Discontinued operations |
(0.2 | ) | 0.2 | — | ||||||||
| Gain on debt foregiveness |
3.0 | — | — | |||||||||
| Gain (loss) on disposition of discontinued operations |
21.3 | (0.6 | ) | (0.1 | ) | |||||||
| Disproportionate share of income (loss) |
— | — | (2.0 | )(2)(3) | ||||||||
|
|
|
|
|
|
|
|||||||
| Net loss |
$ | (31.4 | ) | $ | (57.9 | ) | $ | (6.2 | ) | |||
| Non-controlling interests |
$ | (11.6 | ) | $ | (6.6 | ) | $ | (2.2 | ) | |||
|
|
|
|
|
|
|
|||||||
| Net loss attributable to unconsolidated joint ventures |
$ | (43.0 | ) | $ | (64.5 | ) | $ | (8.4 | ) | |||
| DDR ownership interests |
$ | 14.2 | $ | (6.2 | ) | $ | (8.4 | ) | ||||
| Amortization of basis differential |
1.7 | 3.6 | — | |||||||||
|
|
|
|
|
|
|
|||||||
| $ | 15.9 | $ | (2.6 | ) | $ | (8.4 | ) | |||||
|
|
|
|
|
|
|
|||||||
| Funds From Operations |
||||||||||||
| Net loss attributable to unconsolidated joint ventures |
$ | (43.0 | ) | $ | (64.5 | ) | $ | (8.4 | ) | |||
| Depreciation of real property |
138.5 | 45.4 | 8.4 | |||||||||
| Gain on sale of real estate |
(22.7 | ) | — | — | ||||||||
| Disproportionate share of income |
— | — | 7.6 | (2) | ||||||||
|
|
|
|
|
|
|
|||||||
| $ | 72.8 | $ | (19.1 | ) | $ | 7.6 | ||||||
|
|
|
|
|
|
|
|||||||
| DDR ownership interests |
$ | 35.2 | $ | 7.6 | ||||||||
|
|
|
|
|
|||||||||
| (1) | The financial statements of Sonae Sierra Brasil are translated into U.S. dollars using an average exchange rate for each period for revenues, expenses, gains and losses. |
| (2) | Adjustments represent the effect of promoted equity structures and minority interests. |
| (3) | DDR’s prorata share of NOI including discontinued operations and promoted equity structures and minority interests is $27.2 million for the three-month period ended September 30, 2011. |
28
DDR
Quarterly Financial Supplement
For the nine months ended September 30, 2011
Summary of Property Acquisitions and Dispositions
($ In Millions, GLA in Thousands of SF)
Property Acquisitions
| Acquisition Date |
Location | Ownership Interest Acquired |
Aggregate Proportionate Purchase Price |
Total GLA |
||||||||||
| Q1 2011 |
OH and MN | 50 | % | $ | 39.9 | 520.5 | (1) | |||||||
| Q3 2011 |
CO and NC | 100 | % | 110.0 | 463.7 | (2) | ||||||||
|
|
|
|
|
|||||||||||
| Total Acquisitions |
$ | 149.9 | 984.2 | |||||||||||
|
|
|
|
|
|||||||||||
| (1) | In conjunction with the acquisition of our partner’s ownership interest in one of the assets, the Company entered into a new $21 million, 11-year mortgage loan. |
| (2) | In conjunction with the acquisition of three properties (two located in North Carolina and one located in Colorado), the Company assumed three mortgage loans with a face value aggregating $67 million and a fair value aggregating $71.4 million. |
Property Dispositions
| Disposition Date |
Location |
DDR’s Effective Ownership |
Joint Venture | Total GLA |
Gross Sales Price |
Relinquished Debt |
||||||||||||||
| 01/11 | Augusta, GA | 15 | % | DDRTC Core | 22.6 | $ | 0.7 | $ | 0.8 | |||||||||||
| 02/11 | Austin, TX | 26 | % | Prudential | 282.8 | 29.0 | 21.0 | |||||||||||||
| 02/11 | Wilmington, NC | 100 | % | - | 51.9 | 3.5 | — | |||||||||||||
| 02/11 | Twinsburg, OH | 100 | % | - | 35.9 | 1.8 | — | |||||||||||||
| 04/11 | Chili, NY | 100 | % | - | 120.0 | 6.6 | — | |||||||||||||
| 05/11 | Two Bi Lo Locations | 100 | % | - | 105.9 | 13.1 | — | |||||||||||||
| 05/11 | Orangeburg, SC | 100 | % | - | 50.8 | 4.3 | — | |||||||||||||
| 05/11 | Eagan, MN | 50 | % | DRA | 277.0 | 50.3 | 35.6 | |||||||||||||
| 05/11 | Cary, NC | 100 | % | - | 88.4 | 10.1 | — | |||||||||||||
| 05/11 | Two Rite Aid Locations | 100 | % | - | 21.8 | 5.1 | — | |||||||||||||
| 06/11 | Gaylord, MI | 100 | % | - | 188.2 | 4.0 | — | |||||||||||||
| 06/11 | East Hanover, NJ | 100 | % | - | 70.8 | 15.8 | — | |||||||||||||
| 06/11 | Garland, TX | 100 | % | - | 70.6 | 0.6 | — | |||||||||||||
| 07/11 | San Antonio, TX | 100 | % | - | 88.9 | 7.1 | — | |||||||||||||
| 07/11 | Richmond, KY | 100 | % | - | 134.7 | 5.5 | — | |||||||||||||
| 07/11 | Griffin, GA | 100 | % | - | 64.8 | 0.2 | — | |||||||||||||
| 07/11 | Columbus, OH | 100 | % | - | 356.5 | 13.3 | 10.5 | |||||||||||||
| 07/11 | Spartanburg, SC | 100 | % | - | 10.9 | 2.5 | — | |||||||||||||
| 08/11 | Daytona Beach, FL | 100 | % | - | 76.1 | 7.8 | — | |||||||||||||
| 08/11 | Jacksonville, FL | 100 | % | - | 182.1 | 0.8 | — | |||||||||||||
| 08/11 | Xenia, OH | 100 | % | - | 112.4 | 4.0 | — | |||||||||||||
| 08/11 | Elyria, OH | 100 | % | - | 142.8 | 0.8 | — | |||||||||||||
| 09/11 | Raleigh, NC | 100 | % | - | 75.9 | 7.7 | — | |||||||||||||
| 09/11 | Tarpon Springs, FL | 100 | % | - | 84.2 | 6.5 | — | |||||||||||||
| Various | Various | 100 | % | - | — | 13.2 | — | |||||||||||||
|
|
|
|
|
|
|
|||||||||||||||
| Total Dispositions |
2,716.0 | $ | 214.3 | $ | 67.9 | |||||||||||||||
|
|
|
|
|
|
|
|||||||||||||||
| Total Dispositions - Q3 2011 |
1,329.3 | $ | 59.1 | $ | 10.5 | |||||||||||||||
|
|
|
|
|
|
|
|||||||||||||||
29
DDR
Quarterly Financial Supplement
For the nine months ended September 30, 2011
Summary of Wholly-Owned and Consolidated Land Held for Development and Construction in Progress
($ In Millions, GLA in Thousands of SF)
| As of September 30, 2011 | 2011 Activity | |||||||||||||||||||||||||||
| Land | CIP | Total | Net Expenditures Year to Date (1) |
Net Projected Expenditures 4Q 2011 (1) |
Placed In Service Year to Date |
To Be Placed In Service 4Q 2011 |
||||||||||||||||||||||
| Ground up Development Projects in Progress |
$ | 34.4 | $ | 38.7 | $ | 73.1 | $ | 1.0 | $ | (0.4 | ) | $ | 32.7 | $ | 5.8 | |||||||||||||
| Ground up Development Projects Primarily on Hold |
326.0 | 157.7 | 483.7 | (5.8 | ) | (22.5 | ) | — | — | |||||||||||||||||||
| Substantially Completed Projects Pending Lease up |
25.5 | 17.3 | 42.8 | 4.7 | 2.6 | 20.9 | 22.2 | |||||||||||||||||||||
| Redevelopment Projects |
— | 36.6 | 36.6 | 15.3 | 22.8 | 17.9 | 19.2 | |||||||||||||||||||||
| Leasing Capital Expenditures |
— | 7.8 | 7.8 | 27.5 | 16.0 | 33.3 | 16.4 | |||||||||||||||||||||
|
|
|
|
|
|
|
|
|
|
|
|
|
|
|
|||||||||||||||
| Total |
$ | 385.9 | $ | 258.1 | $ | 644.0 | $ | 42.7 | $ | 18.5 | $ | 104.8 | $ | 63.6 | ||||||||||||||
|
|
|
|
|
|
|
|
|
|
|
|
|
|
|
|||||||||||||||
Summary of Significant Wholly-Owned and Consolidated Development Projects in Progress
| Location |
Project Name |
Total GLA |
Owned GLA |
Estimated Net Cost (1) |
Cost Incurred To Date |
Assets Placed in Service |
Major Anchors | |||||||||||||||||
| Boise (Nampa), ID |
Nampa Gateway Center | 830.9 | 419.3 | $ | 126.7 | $ | 127.5 | $ | 95.4 | JC Penney, Macy’s, The Sports Authority, Idaho Athletic Club, Regal Cinemas | ||||||||||||||
| Austin (Kyle), TX (2) |
Kyle Marketplace | 805.6 | 443.1 | 77.3 | 62.0 | 21.0 | Target, Kohl’s | |||||||||||||||||
|
|
|
|
|
|
|
|
|
|
|
|||||||||||||||
| 1,636.5 | 862.4 | $204.0 | $189.5 | $116.4 | ||||||||||||||||||||
|
|
|
|
|
|
|
|
|
|
|
|||||||||||||||
| Total Land Held for Development and CIP for Ground up Development Projects in Progress at September 30, 2011: |
$ | 73.1 | ||||||||||||||||||||||
|
|
|
|||||||||||||||||||||||
Summary of Significant Wholly-Owned and Consolidated Redevelopment Projects
| Location |
Project Name | Total GLA |
Owned GLA |
Estimated Net Cost (1) |
Cost Incurred To Date |
Assets Placed in Service |
Major Anchors | |||||||||||||||||
| Denver, CO |
Tamarac Square | 151.3 | 12.0 | $ | 1.7 | $ | 2.6 | $ | — | Target | ||||||||||||||
| Miami (Plantation), FL |
The Fountains | 273.4 | 273.4 | 51.7 | 47.6 | 38.7 | Kohl’s, Dick’s Sporting Goods, Marshalls/HomeGoods | |||||||||||||||||
| Bayamon, PR |
Rexville Plaza | 43.8 | 43.8 | 6.1 | 0.3 | — | CVS | |||||||||||||||||
| Carolina, PR |
Plaza Escorial | 17.0 | 17.0 | 2.4 | 1.4 | — | PetSmart | |||||||||||||||||
| Hatillo, PR |
Plaza Del Norte | 88.7 | 88.7 | 8.2 | 2.4 | 1.2 | JC Penney, Walmart, Sears | |||||||||||||||||
| Charleston, SC |
Ashley Crossings | 95.0 | 95.0 | 5.0 | 4.0 | 2.7 | Kohl’s, Marshalls | |||||||||||||||||
| San Antonio, TX (2) |
Terrell Plaza | 225.7 | 90.8 | 4.7 | 3.3 | — | Target | |||||||||||||||||
|
|
|
|
|
|
|
|
|
|
|
|||||||||||||||
| 894.9 | 620.7 | $ | 79.8 | $ | 61.6 | $ | 42.6 | |||||||||||||||||
|
|
|
|
|
|
|
|
|
|
|
|||||||||||||||
| CIP for projects listed above: |
$ | 19.0 | ||||||||||||||||||||||
| CIP for other Redevelopment Projects: |
17.6 | |||||||||||||||||||||||
|
|
|
|||||||||||||||||||||||
| Total amount included in CIP at September 30, 2011 for Redevelopment Projects: |
$ | 36.6 | ||||||||||||||||||||||
|
|
|
|||||||||||||||||||||||
| (1) | Includes receipts and expected future reductions from land sales and reimbursements. |
| (2) | Consolidated 50% Joint Venture |
30
DDR
Quarterly Financial Supplement
For the nine months ended September 30, 2011
Summary of Joint Venture Land Held for Development and Construction in Progress
($ In Millions, GLA in Thousands of SF)
| As of September 30, 2011 | 2011 Activity | |||||||||||||||||||||||||||
| Land | CIP | Total | Net Expenditures Year to Date (1) |
Net Projected Expenditures 4Q 2011(1) |
Placed In Service Year to Date |
To Be Placed In Service 4Q 2011 |
||||||||||||||||||||||
| Ground up Development Projects in Progress |
$ | 44.6 | $ | 129.5 | $ | 174.1 | $ | 81.3 | $ | 52.3 | $ | — | $ | — | ||||||||||||||
| Ground up Development Projects Primarily on Hold |
23.3 | 2.7 | 26.0 | 0.7 | 0.1 | — | — | |||||||||||||||||||||
| Substantially Completed Projects Pending Lease up |
2.1 | 17.0 | 19.1 | 2.8 | 2.2 | 18.4 | 2.6 | |||||||||||||||||||||
| Redevelopment Projects |
— | 33.1 | 33.1 | 24.0 | 11.0 | 3.8 | 37.6 | |||||||||||||||||||||
| Leasing Capital Expenditures |
— | 6.7 | 6.7 | 23.7 | 14.0 | 23.3 | 18.6 | |||||||||||||||||||||
|
|
|
|
|
|
|
|
|
|
|
|
|
|
|
|||||||||||||||
| Total |
$ | 70.0 | $ | 189.0 | $ | 259.0 | $ | 132.5 | $ | 79.6 | $ | 45.5 | $ | 58.8 | ||||||||||||||
|
|
|
|
|
|
|
|
|
|
|
|
|
|
|
|||||||||||||||
Summary of Significant Joint Venture Development Projects in Progress
| Location |
Project Name | DDR’s Effective Ownership |
Total GLA |
Owned GLA |
Estimated Net Cost (1) |
Cost Incurred To Date |
Assets Placed in Service |
Major Anchors | ||||||||||||||||||||
| Goiania, Brazil |
Passeio Das Aguas | 33.3 | % | 806.4 | 806.4 | $ | 212.8 | $ | 28.7 | $ | — | Bretas, Cinemark, Magic Games | ||||||||||||||||
| Londrina, Brazil |
Boulevard Londrina | 28.2 | % | 518.2 | 518.2 | 123.6 | 64.1 | — | Walmart, Cinemark, Centuaro, Magazine Luiza, Kalunga, Luiggi Bertolli, Renner, Saraiva, Memove | |||||||||||||||||||
| Uberlandia, Brazil |
Patio Uberlandia | 33.3 | % | 487.7 | 487.7 | 104.3 | 81.3 | — | Walmart, Cinemark, Centuaro, Leroy Merlin, Renner, Fast Shop, Kalunga, Livraria Leitura, Memove, B-Mart | |||||||||||||||||||
|
|
|
|
|
|
|
|
|
|
|
|||||||||||||||||||
| 1,812.3 | 1,812.3 | $ | 440.7 | $ | 174.1 | $ | — | |||||||||||||||||||||
|
|
|
|
|
|
|
|
|
|
|
|||||||||||||||||||
| Total Land Held for Development and CIP for Ground up Development Projects in Progress at September 30, 2011: |
$ | 174.1 | ||||||||||||||||||||||||||
|
|
|
|||||||||||||||||||||||||||
Summary of Significant Joint Venture Redevelopment Projects
| Location |
Project Name | DDR’s Effective Ownership |
Total GLA |
Owned GLA |
Estimated Net Cost (1) |
Cost Incurred To Date |
Assets Placed in Service |
Major Anchors | ||||||||||||||||||||
| Sao Paulo, Brazil |
Campo Limpo Shopping Center | 6.7 | % | 28.1 | 28.1 | $ | 3.6 | $ | 3.1 | $ | — | B-Mart, Parking & Games, Extra, MovieCom, Casas Bahia, C&A | ||||||||||||||||
| Sao Paulo, Brazil |
Metropole Shopping Center | 33.3 | % | 94.0 | 94.0 | 31.5 | 28.0 | — | Fast Shop, PlayArte, Outback, Lojas Americanas, Renner, C&A | |||||||||||||||||||
|
|
|
|
|
|
|
|
|
|
|
|||||||||||||||||||
| 94.0 | 94.0 | $ | 35.1 | $ | 31.1 | $ | — | |||||||||||||||||||||
|
|
|
|
|
|
|
|
|
|
|
|||||||||||||||||||
| CIP for projects listed above: |
|
$ | 28.0 | |||||||||||||||||||||||||
| CIP for other Redevelopment Projects: |
5.1 | |||||||||||||||||||||||||||
|
|
|
|||||||||||||||||||||||||||
| Total amount included in CIP at September 30, 2011 for Redevelopment Projects: |
$ | 33.1 | ||||||||||||||||||||||||||
|
|
|
|||||||||||||||||||||||||||
| (1) | Includes receipts and expected future reductions from land sales and reimbursements. |
31
DDR
Quarterly Financial Supplement
For the nine months ended September 30, 2011
Ground up Development Projects Primarily on Hold
(In Millions)
| MSA (Location) |
DDR’s Effective Ownership |
Total Acreage |
||||||
| Ukiah (Mendocino), CA |
50 | % | 75.7 | |||||
| New Haven (Guilford), CT |
100 | % | 26.0 | |||||
| Orlando (Lee Vista), FL |
100 | % | 74.3 | |||||
| Tampa (Brandon), FL |
100 | % | 46.3 | |||||
| Tampa (Wesley Chapel), FL |
100 | % | 10.0 | |||||
| Atlanta (Douglasville), GA |
100 | % | 28.5 | |||||
| Chicago (Grayslake), IL |
50 | % | 106.0 | |||||
| Kansas City (Merriam), KS |
100 | % | 35.1 | |||||
| Boston, MA (Seabrook, NH) |
100 | % | 50.9 | |||||
| Gulfport, MS |
100 | % | 86.2 | |||||
| Raleigh (Apex), NC |
100 | % | 52.6 | |||||
| Oconomowoc, WI |
50 | % | 121.6 | |||||
| Isabela, Puerto Rico |
80 | % | 11.1 | |||||
| Toronto (Brampton), CAN |
50 | % | 43.0 | |||||
| Toronto (East Gwillimbury - Bayview/Greenlane), CAN |
50 | % | 39.0 | |||||
| Toronto (East Gwillimbury - Hwy 404/Greenlane East), CAN |
50 | % | 44.0 | |||||
| Toronto (East Gwillimbury - Hwy 404/Greenlane West), CAN |
50 | % | 29.0 | |||||
| Toronto (Richmond Hill), CAN |
50 | % | 52.0 | |||||
| Togliatti, Russia |
75 | % | 61.2 | |||||
| Yaroslavl, Russia |
75 | % | 8.0 | |||||
| Other Misc. Land (8 sites) |
100 | % | Various | |||||
|
|
|
|||||||
| 1,007.6 | ||||||||
|
|
|
|||||||
| Wholly-owned and consolidated projects included in Land Held for Development and CIP: |
|
$ | 483.7 | (1) | ||||
| Unconsolidated joint venture projects included in Land Held for Development and CIP: |
|
26.0 | (2) | |||||
|
|
|
|||||||
| Total Ground up Development Projects Primarily on Hold at September 30, 2011: |
|
$ | 509.7 | |||||
|
|
|
|||||||
| (1) | Includes partners’ ownership interest of $107.7 million. |
| (2) | DDR’s prorata share is $13 million. |
32
DDR
Quarterly Financial Supplement
For the nine months ended September 30, 2011
Total Portfolio Characteristics
| MSF at | MSF at | |||||||||||
| 100% | Prorata | |||||||||||
| Operating Shopping Centers with Economic Interest |
450 | 80.6 | 53.6 | |||||||||
| Additional Ground Lease GLA |
4.9 | 3.5 | ||||||||||
| Additional Unowned GLA |
30.3 | 0.0 | ||||||||||
| Operating Shopping Centers with No Economic Interest |
88 | 18.4 | 0.0 | |||||||||
| Additional Ground Lease GLA |
1.2 | 0.0 | ||||||||||
| Additional Unowned GLA |
4.8 | 0.0 | ||||||||||
| Business Centers |
6 | 0.7 | 0.7 | |||||||||
| Portfolio % Leased |
93.4 | % | ||||||||||
| Portfolio % Commenced |
90.8 | % | ||||||||||
Prime Portfolio Characteristics
Our Prime portfolio is comprised of market dominant shopping centers with high quality tenants located in attractive markets with strong demographic profiles. It is a subset of the total portfolio.
| MSF at | MSF at | |||||||||||
| 100% | Prorata | |||||||||||
| Operating Shopping Centers |
267 | 60.5 | 43.4 | |||||||||
| Additional Ground Lease GLA |
3.8 | 2.7 | ||||||||||
| Additional Unowned GLA |
23.5 | 0.0 | ||||||||||
| Prime Portfolio % Leased |
94.7 | % | ||||||||||
| % of Total Portfolio NOI |
88.3 | % | ||||||||||
Total Portfolio Concentration
| % of | % of | |||||||||||
| ABR | MSF | GLA | ||||||||||
| Rk Location |
at 100% | at 100% | at 100% | |||||||||
| 1 Brazil |
13.3 | % | 3.7 | 4.8 | % | |||||||
| 2 Georgia |
9.4 | % | 9.2 | 11.4 | % | |||||||
| 3 Florida |
8.5 | % | 8.8 | 10.9 | % | |||||||
| 4 Puerto Rico |
7.8 | % | 4.0 | 5.0 | % | |||||||
| 5 New York |
6.2 | % | 6.4 | 7.9 | % | |||||||
| 6 North Carolina |
6.2 | % | 5.3 | 6.6 | % | |||||||
| 7 New Jersey |
5.4 | % | 3.2 | 4.0 | % | |||||||
| 8 Ohio |
5.1 | % | 5.2 | 6.4 | % | |||||||
| 9 Pennsylvania |
3.4 | % | 2.8 | 3.5 | % | |||||||
| 10 California |
3.1 | % | 2.2 | 2.7 | % | |||||||
33
DDR
Quarterly Financial Supplement
For the nine months ended September 30, 2011
Sonae Sierra Brasil (SSB) Portfolio Characteristics
Sonae Sierra Brasil is a fully integrated owner, manager, and developer of shopping centers throughout Brazil. The joint venture was established between SSB and DDR in 2007 and the joint venture completed an IPO in 2011. DDR’s ownership of SSB as of 9/30/11 was 33.3%. All information was translated using average exchange rates for the respective periods.
| MSF at 100% |
MSF at Prorata |
|||||||||||
| Operating Shopping Centers |
10 | 3.7 | 0.9 | |||||||||
| Additional Ground Lease GLA |
0.2 | 0.1 | ||||||||||
| Development Sites |
3 | 1.8 | 0.6 | |||||||||
| Total Annualized Rent (in millions) |
$ | 132.7 | ||||||||||
| Average Rent Per Occupied Square Foot |
$ | 36.06 | ||||||||||
| Portfolio % Leased |
98.8 | % | ||||||||||
Puerto Rico Portfolio Characteristics
| MSF at 100% |
MSF at Prorata |
|||||||||||
| Operating Shopping Centers |
15 | 4.0 | 4.0 | |||||||||
| Additional Ground Lease GLA |
0.7 | 0.7 | ||||||||||
| Additional Unowned GLA |
1.0 | 0.0 | ||||||||||
| Total Annualized Rent (in millions) |
$ | 77.7 | ||||||||||
| Average Rent Per Occupied Square Foot |
$ | 18.88 | ||||||||||
| Portfolio % Leased |
96.8 | % | ||||||||||
Trailing 12 Month NOI (DDR Share)
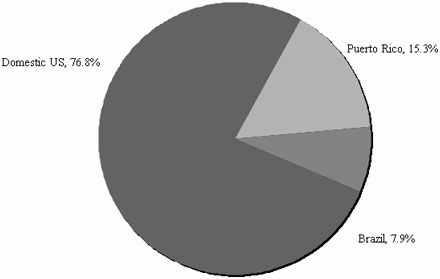
34
DDR
Quarterly Financial Supplement
For the nine months ended September 30, 2011
Lease Expirations By Year
($ in millions, except per square foot)
Greater than 10,000 SF
| Year |
Leases | ABR at 100% |
Avg PSF |
% of ABR at 100% |
||||||||||||
| 2011 |
33 | $ | 8.9 | $ | 9.49 | 0.9 | % | |||||||||
| 2012 |
134 | 41.5 | 9.16 | 4.3 | % | |||||||||||
| 2013 |
175 | 46.4 | 9.34 | 4.9 | % | |||||||||||
| 2014 |
202 | 61.4 | 9.34 | 6.4 | % | |||||||||||
| 2015 |
184 | 57.1 | 9.72 | 6.0 | % | |||||||||||
| 2016 |
210 | 67.1 | 10.64 | 7.0 | % | |||||||||||
| 2017 |
127 | 51.5 | 10.48 | 5.4 | % | |||||||||||
| 2018 |
79 | 29.2 | 10.34 | 3.1 | % | |||||||||||
| 2019 |
96 | 40.7 | 11.74 | 4.3 | % | |||||||||||
| 2020 |
75 | 25.6 | 10.40 | 2.7 | % | |||||||||||
|
|
|
|
|
|
|
|
|
|||||||||
| 2011-2020 |
||||||||||||||||
| Subtotal |
1,315 | $ | 429.4 | $ | 10.02 | 44.9 | % | |||||||||
| Total |
||||||||||||||||
| Rent Roll |
1,541 | $ | 529.4 | $ | 9.96 | 55.4 | % | |||||||||
Less than 10,000 SF
| % of | ||||||||||||||||
| ABR | Avg | ABR | ||||||||||||||
| Year |
Leases | at 100% | PSF | at 100% | ||||||||||||
| 2011 |
464 | $ | 23.0 | $ | 28.19 | 2.4 | % | |||||||||
| 2012 |
1,444 | 81.6 | 26.70 | 8.5 | % | |||||||||||
| 2013 |
1,280 | 68.6 | 23.45 | 7.2 | % | |||||||||||
| 2014 |
1,225 | 66.0 | 27.50 | 6.9 | % | |||||||||||
| 2015 |
949 | 56.0 | 25.44 | 5.9 | % | |||||||||||
| 2016 |
791 | 50.2 | 24.50 | 5.3 | % | |||||||||||
| 2017 |
185 | 14.5 | 22.66 | 1.5 | % | |||||||||||
| 2018 |
170 | 16.0 | 26.33 | 1.7 | % | |||||||||||
| 2019 |
119 | 10.1 | 24.04 | 1.1 | % | |||||||||||
| 2020 |
121 | 9.6 | 21.98 | 1.0 | % | |||||||||||
|
|
|
|
|
|
|
|
|
|||||||||
| 2011-2020 |
||||||||||||||||
| Subtotal |
6,748 | $ | 395.6 | $ | 25.44 | 41.4 | % | |||||||||
| Total |
||||||||||||||||
| Rent Roll |
7,488 | $ | 426.1 | $ | 23.43 | 44.6 | % | |||||||||
35
DDR
Quarterly Financial Supplement
For the nine months ended September 30, 2011
Leased Rates and Average Annualized Base Rental Rates PSF
| Period Ending |
Properties | Leased Rate |
ABR PSF |
|||||||||
| Q3 2011 |
450 | 93.4 | % | $ | 13.76 | |||||||
| YE 2010 |
487 | 92.6 | % | 13.36 | ||||||||
| YE 2009 |
544 | 91.4 | % | 13.01 | ||||||||
| YE 2008 |
621 | 92.7 | % | 12.60 | ||||||||
| YE 2007 |
628 | 96.0 | % | 12.54 | ||||||||
| YE 2006 |
379 | 96.1 | % | 11.90 | ||||||||
| YE 2005 |
379 | 96.3 | % | 11.30 | ||||||||
| YE 2004 |
373 | 95.4 | % | 11.13 | ||||||||
| YE 2003 |
274 | 95.1 | % | 10.82 | ||||||||
| YE 2002 |
189 | 95.9 | % | 10.58 | ||||||||
| YE 2001 |
192 | 95.4 | % | 10.03 | ||||||||
| YE 2000 |
190 | 96.9 | % | 9.66 | ||||||||
| YE 1999 |
186 | 95.7 | % | 9.20 | ||||||||
| YE 1998 |
159 | 96.5 | % | 8.99 | ||||||||
| YE 1997 |
123 | 96.1 | % | 8.49 | ||||||||
| YE 1996 |
112 | 94.8 | % | 7.85 | ||||||||
| YE 1995 |
106 | 96.3 | % | 7.60 | ||||||||
| YE 1994 |
84 | 97.1 | % | 5.89 | ||||||||
| YE 1993 |
69 | 96.2 | % | 5.60 | ||||||||
| YE 1992 |
53 | 95.4 | % | 5.37 | ||||||||
Leased Rate by Tenant Size
| Leased Rate |
% of GLA |
% of Vacancy |
||||||||||
| < 2,499 SF |
82.5 | % | 8.8 | % | 23.2 | % | ||||||
| 2,500 - 4,999 SF |
83.4 | % | 8.4 | % | 21.0 | % | ||||||
| 5,000 - 9,999 SF |
87.3 | % | 9.2 | % | 17.7 | % | ||||||
| 10,000 - 20,000 SF |
95.4 | % | 9.9 | % | 6.8 | % | ||||||
| > 20,000 SF |
96.7 | % | 63.6 | % | 31.3 | % | ||||||
|
|
|
|
|
|
|
|||||||
| Total |
93.4 | % | 100 | % | 100 | % | ||||||
|
|
|
|
|
|
|
|||||||
36
DDR
Quarterly Financial Supplement
For the nine months ended September 30, 2011
($, GLA in thousands, except per square foot)
Leasing spreads are calculated by comparing the prior tenant’s annual base rent in the final year of the lease to the new tenant’s annual base rent in the first year of the new lease. The calculation only includes deals that were executed within one year of the date that the prior tenant vacated.
Leasing Summary: Third Quarter 2011
| New Rent | Prior Rent | |||||||||||||||||||||||||||||||||||
| Final | Final | Wtd | ||||||||||||||||||||||||||||||||||
| Year 1 | Year 1 | Year | Year | Comp | Avg | |||||||||||||||||||||||||||||||
| # of | Rent | Total | Rent | Total | Space | Term | TI | |||||||||||||||||||||||||||||
| Leases | GLA | PSF | Rent | PSF | Rent | Spread | (Yrs) | PSF | ||||||||||||||||||||||||||||
| New Leases |
||||||||||||||||||||||||||||||||||||
| Vacant < 1 Year |
81 | 266 | $ | 18.87 | $ | 5,026 | $ | 16.29 | $ | 4,340 | 15.8 | % | 8.3 | $ | 15.89 | |||||||||||||||||||||
| Vacant > 1 Year |
139 | 707 | 13.79 | 9,746 | N/A | N/A | N/A | 8.2 | 12.57 | |||||||||||||||||||||||||||
|
|
|
|
|
|
|
|
|
|
|
|
|
|
|
|
|
|
|
|||||||||||||||||||
| New Leases - Total |
220 | 973 | 15.18 | 14,772 | N/A | N/A | 15.8 | % | 8.3 | 13.47 | ||||||||||||||||||||||||||
| Renewals |
296 | 1,572 | 15.63 | 24,570 | 14.79 | 23,240 | 5.7 | % | 4.5 | 0.00 | ||||||||||||||||||||||||||
|
|
|
|
|
|
|
|
|
|
|
|
|
|
|
|
|
|
|
|||||||||||||||||||
| Total |
516 | 2,545 | $ | 15.46 | $ | 39,342 | $ | 15.01 | $ | 27,580 | 7.3 | % | 5.9 | $ | 5.18 | |||||||||||||||||||||
|
|
|
|
|
|
|
|
|
|
|
|
|
|
|
|
|
|
|
|||||||||||||||||||
Leasing Summary: Year-to-Date 2011
| New Rent | Prior Rent | |||||||||||||||||||||||||||||||||||
| Final | Final | Wtd | ||||||||||||||||||||||||||||||||||
| Year 1 | Year 1 | Year | Year | Comp | Avg | |||||||||||||||||||||||||||||||
| # of | Rent | Total | Rent | Total | Space | Term | TI | |||||||||||||||||||||||||||||
| Leases | GLA | PSF | Rent | PSF | Rent | Spread | (Yrs) | PSF | ||||||||||||||||||||||||||||
| New Leases |
||||||||||||||||||||||||||||||||||||
| Vacant < 1 Year |
229 | 625 | $ | 22.89 | $ | 14,311 | $ | 20.43 | $ | 12,774 | 12.0 | % | 7.4 | $ | 14.45 | |||||||||||||||||||||
| Vacant > 1 Year |
367 | 2,108 | 13.24 | 27,912 | N/A | N/A | N/A | 8.1 | 13.57 | |||||||||||||||||||||||||||
|
|
|
|
|
|
|
|
|
|
|
|
|
|
|
|
|
|
|
|||||||||||||||||||
| New Leases - Total |
596 | 2,733 | 15.45 | 42,223 | N/A | N/A | 12.0 | % | 7.9 | 13.77 | ||||||||||||||||||||||||||
| Renewals |
831 | 5,026 | 14.61 | 73,417 | 13.89 | 69,815 | 5.2 | % | 4.6 | 0.00 | ||||||||||||||||||||||||||
|
|
|
|
|
|
|
|
|
|
|
|
|
|
|
|
|
|
|
|||||||||||||||||||
| Total |
1,427 | 7,759 | $ | 14.90 | $ | 115,640 | $ | 14.61 | $ | 82,589 | 6.2 | % | 5.8 | $ | 4.92 | |||||||||||||||||||||
|
|
|
|
|
|
|
|
|
|
|
|
|
|
|
|
|
|
|
|||||||||||||||||||
37
DDR
Quarterly Financial Supplement
For the nine months ended September 30, 2011
Net effective rents are calculated with full consideration for all costs associated with leasing the space rather than prorata costs. Landlord work represents property level improvements associated with the lease transactions; however, those improvements are attributed to the landlord’s property value and typically extend the life of the asset in excess of the lease term.
Net Effective Rents Related to Leased Space (Owned Properties)
| Three Months Ended 9/30/2011 |
2011 YTD Average |
|||||||
| Number of lease transactions executed |
516 | 1,427 | ||||||
| Rentable square footage leased (in thousands) |
2,545 | 7,760 | ||||||
| Square footage of renewal deals (in thousands) |
1,572 | 5,026 | ||||||
| Square footage of new deals (in thousands) |
973 | 2,733 | ||||||
| Renewed square footage (% of total) |
61.8 | % | 64.8 | % | ||||
| New leases square footage (% of total) |
38.2 | % | 35.2 | % | ||||
| New Deals: |
||||||||
| Weighted average per rentable square foot over the lease term: |
||||||||
| Base rent |
$ | 15.85 | $ | 16.11 | ||||
| Tenant allowance |
(1.58 | ) | (1.65 | ) | ||||
| Landlord work |
(0.71 | ) | (0.61 | ) | ||||
| Third party leasing commissions |
(0.28 | ) | (0.29 | ) | ||||
| Rent concessions |
— | — | ||||||
|
|
|
|
|
|||||
| Equivalent net effective rent |
$ | 13.28 | $ | 13.56 | ||||
|
|
|
|
|
|||||
| Weighted average term in years |
8.3 | 7.9 | ||||||
| Renewal Deals: |
||||||||
| Weighted average per rentable square foot over the lease term: |
||||||||
| Base rent |
$ | 15.72 | $ | 14.81 | ||||
| Tenant allowance |
— | — | ||||||
| Landlord work |
— | — | ||||||
| Third party leasing commissions |
— | — | ||||||
| Rent concessions |
— | — | ||||||
|
|
|
|
|
|||||
| Equivalent net effective rent |
$ | 15.72 | $ | 14.81 | ||||
|
|
|
|
|
|||||
| Weighted average term in years |
4.5 | 4.6 | ||||||
38
DDR
Quarterly Financial Supplement
For the nine months ended September 30, 2011
Largest Tenants by GLA
($ in millions)
| Rk | Tenant (Concept) |
Owned Units |
Owned GLA at 100% |
% of GLA at 100% |
Owned GLA at Prorata |
Unowned Units |
Total Units |
Credit Ratings (S&P/Mdy’s/Fitch) | ||||||||||||||||||||
| 1 | Walmart (26) / Sam’s Club (5) | 31 | 4.8 | 5.6 | % | 4.1 | 52 | 83 | AA / Aa2/ AA | |||||||||||||||||||
| 2 | Kohl’s | 26 | 2.3 | 2.7 | % | 1.4 | 17 | 43 | BBB+ / Baa1 / BBB+ | |||||||||||||||||||
| 3 | Sears (6) / Kmart (19) / Others (2) | 27 | 2.1 | 2.5 | % | 1.5 | 5 | 32 | B+ / Ba3 / B | |||||||||||||||||||
| 4 | Publix | 44 | 2.1 | 2.5 | % | 0.6 | 3 | 47 | NR | |||||||||||||||||||
| 5 | TJ Maxx (32) / Marshalls (23) / Homegoods (11) | 66 | 2.1 | 2.5 | % | 1.4 | 22 | 88 | A / A3 / NR | |||||||||||||||||||
| 6 | Kroger | 29 | 1.6 | 1.9 | % | 0.7 | 2 | 31 | BBB / Baa2 / BBB | |||||||||||||||||||
| 7 | Lowe’s | 12 | 1.6 | 1.9 | % | 1.5 | 24 | 36 | A / A1 / A | |||||||||||||||||||
| 8 | PetSmart | 65 | 1.4 | 1.6 | % | 0.9 | 24 | 89 | BB / NR / NR | |||||||||||||||||||
| 9 | Bed Bath & Beyond (39) / Others (4) | 43 | 1.4 | 1.6 | % | 0.9 | 16 | 59 | BBB+ / NR / NR | |||||||||||||||||||
| 10 | Ross Stores | 41 | 1.3 | 1.5 | % | 0.7 | 4 | 45 | BBB+ / NR / NR | |||||||||||||||||||
| 11 | Michael’s | 53 | 1.2 | 1.4 | % | 0.8 | 12 | 65 | B- / B3 / NR | |||||||||||||||||||
| 12 | Dick’s Sporting Goods | 24 | 1.1 | 1.3 | % | 0.7 | 9 | 33 | NR | |||||||||||||||||||
| 13 | Tops Markets1 | 16 | 1.0 | 1.2 | % | 0.5 | 1 | 17 | NR | |||||||||||||||||||
| 14 | OfficeMax | 40 | 0.9 | 1.1 | % | 0.7 | 10 | 50 | B- / B1 / NR | |||||||||||||||||||
| 15 | Toys R Us (8) / Babies R Us (16) | 24 | 0.9 | 1.1 | % | 0.7 | 12 | 36 | B / B1 / B | |||||||||||||||||||
| 16 | Home Depot | 8 | 0.9 | 1.1 | % | 0.8 | 33 | 41 | BBB+ / A3 / BBB+ | |||||||||||||||||||
| 17 | J.C. Penney | 16 | 0.8 | 0.9 | % | 0.8 | 2 | 18 | BB+ / NR / BBB- | |||||||||||||||||||
| 18 | Best Buy | 20 | 0.8 | 0.9 | % | 0.5 | 12 | 32 | BBB- / Baa2 / BBB- | |||||||||||||||||||
| 19 | Target | 6 | 0.8 | 0.9 | % | 0.8 | 53 | 59 | A+ / A2 / A- | |||||||||||||||||||
| 20 | Dollar Tree Stores | 83 | 0.8 | 0.9 | % | 0.5 | 11 | 94 | NR | |||||||||||||||||||
|
|
|
|
|
|
|
|
|
|
|
|
|
|||||||||||||||||
| Top 20 Tenants | 674 | 29.9 | 35.0 | % | 20.5 | 324 | 998 | |||||||||||||||||||||
| 21 | Gap (5) / Old Navy (38) / Banana Republic (4) | 47 | 0.8 | 0.9 | % | 0.5 | 8 | 55 | BB+ /Baa3 / BBB- | |||||||||||||||||||
| 22 | Burlington Coat Factory | 9 | 0.8 | 0.9 | % | 0.6 | 1 | 10 | B- / B3 / B- | |||||||||||||||||||
| 23 | Hobby Lobby | 14 | 0.8 | 0.9 | % | 0.6 | 3 | 17 | NR | |||||||||||||||||||
| 24 | Staples | 34 | 0.7 | 0.8 | % | 0.5 | 1 | 35 | BBB / Baa2 / BBB | |||||||||||||||||||
| 25 | JoAnn Fabric | 24 | 0.7 | 0.8 | % | 0.6 | 8 | 32 | NR | |||||||||||||||||||
| 26 | Beall’s | 18 | 0.7 | 0.8 | % | 0.4 | 3 | 21 | NR | |||||||||||||||||||
| 27 | Barnes & Noble | 25 | 0.6 | 0.7 | % | 0.4 | 2 | 27 | NR | |||||||||||||||||||
| 28 | Cinemark | 12 | 0.6 | 0.7 | % | 0.5 | 2 | 14 | BB- / NR / NR | |||||||||||||||||||
| 29 | AMC Theaters | 7 | 0.6 | 0.7 | % | 0.2 | 2 | 9 | NR / Caa1 / B | |||||||||||||||||||
| 30 | Regal Cinemas | 11 | 0.6 | 0.7 | % | 0.4 | 2 | 13 | B+ / B1 / B+ | |||||||||||||||||||
| 31 | Sports Authority | 13 | 0.5 | 0.6 | % | 0.4 | 3 | 16 | B- / NR / NR | |||||||||||||||||||
| 32 | Stein Mart | 13 | 0.5 | 0.6 | % | 0.3 | 1 | 14 | NR | |||||||||||||||||||
| 33 | Giant Eagle | 6 | 0.5 | 0.6 | % | 0.3 | 0 | 6 | NR | |||||||||||||||||||
| 34 | Office Depot | 18 | 0.5 | 0.6 | % | 0.3 | 6 | 24 | B- / B2 / NR | |||||||||||||||||||
| 35 | Petco | 30 | 0.4 | 0.5 | % | 0.3 | 0 | 30 | B / B2 / NR | |||||||||||||||||||
| 36 | H.H. Gregg | 13 | 0.4 | 0.5 | % | 0.3 | 6 | 19 | NR | |||||||||||||||||||
| 37 | BJ’s Wholesale Club | 4 | 0.4 | 0.5 | % | 0.4 | 2 | 6 | B+ / B1 / NR | |||||||||||||||||||
| 38 | DSW | 16 | 0.4 | 0.5 | % | 0.2 | 6 | 22 | NR | |||||||||||||||||||
| 39 | Party City (23) / Others (7) | 30 | 0.4 | 0.5 | % | 0.2 | 8 | 38 | NR | |||||||||||||||||||
| 40 | Rite Aid | 32 | 0.4 | 0.5 | % | 0.3 | 0 | 32 | B- / Caa2 / B- | |||||||||||||||||||
|
|
|
|
|
|
|
|
|
|
|
|
|
|||||||||||||||||
| Tenants 21-40 | 376 | 11.3 | 13.2 | % | 7.7 | 64 | 440 | |||||||||||||||||||||
|
|
|
|
|
|
|
|
|
|
|
|
|
|||||||||||||||||
| Top 40 Tenants | 1,050 | 41.2 | 48.2 | % | 28.2 | 388 | 1,438 | |||||||||||||||||||||
|
|
|
|
|
|
|
|
|
|
|
|
|
|||||||||||||||||
| Total Portfolio | 85.5 | 100.0 | % | 57.1 | ||||||||||||||||||||||||
| (1) | 15 leases are guaranteed by Koninklijke Ahold NV, rated BBB / Baa3 / BBB |
39
DDR
Quarterly Financial Supplement
For the nine months ended September 30, 2011
Largest Tenants by Base Rental Revenues
($ in millions)
| Rk | Tenant |
Owned Units |
ABR at 100% |
% of ABR at 100% |
ABR at Prorata |
Unowned Units |
Total Units |
Credit Ratings | ||||||||||||||||||||
| 1 |
Walmart (26) / Sam’s Club (5) | 31 | $ | 31.4 | 3.2 | % | $ | 26.0 | 52 | 83 | AA / Aa2 / AA | |||||||||||||||||
| 2 |
TJ Maxx (32) / Marshalls (23) / Homegoods (11) | 66 | 20.7 | 2.1 | % | 14.2 | 22 | 88 | A / A3 / NR | |||||||||||||||||||
| 3 |
PetSmart | 65 | 19.0 | 1.9 | % | 12.4 | 24 | 89 | BB / NR / NR | |||||||||||||||||||
| 4 |
Publix | 44 | 18.5 | 1.9 | % | 5.0 | 3 | 47 | NR | |||||||||||||||||||
| 5 |
Kohl’s | 26 | 17.3 | 1.8 | % | 10.6 | 17 | 43 | BBB+ / Baa1 / BBB+ | |||||||||||||||||||
| 6 |
Bed Bath & Beyond (39) / Others (4) | 43 | 15.9 | 1.6 | % | 11.6 | 16 | 59 | BBB+ / NR / NR | |||||||||||||||||||
| 7 |
Michael’s | 53 | 14.7 | 1.5 | % | 10.0 | 12 | 65 | B- / B3 / NR | |||||||||||||||||||
| 8 |
Ross Stores | 41 | 13.6 | 1.4 | % | 7.3 | 4 | 45 | BBB+ / NR / NR | |||||||||||||||||||
| 9 |
AMC Theaters | 7 | 12.7 | 1.3 | % | 5.4 | 2 | 9 | NR / Caa1 / B | |||||||||||||||||||
| 10 |
Dick’s Sporting Goods | 24 | 12.5 | 1.3 | % | 7.4 | 9 | 33 | NR | |||||||||||||||||||
| 11 |
Best Buy | 20 | 11.8 | 1.2 | % | 7.2 | 12 | 32 | BBB- / Baa2 / BBB- | |||||||||||||||||||
| 12 |
Tops Markets1 | 16 | 11.7 | 1.2 | % | 6.7 | 1 | 17 | NR | |||||||||||||||||||
| 13 |
Kroger | 29 | 11.7 | 1.2 | % | 5.3 | 2 | 31 | BBB / Baa2 / BBB | |||||||||||||||||||
| 14 |
Gap (5) / Old Navy (38) / Banana Republic (4) | 47 | 11.1 | 1.1 | % | 7.9 | 8 | 55 | BB+ / Baa3 / BBB- | |||||||||||||||||||
| 15 |
OfficeMax | 40 | 11.0 | 1.1 | % | 7.9 | 10 | 50 | B- / B1 / NR | |||||||||||||||||||
| 16 |
Lowe’s | 12 | 9.8 | 1.0 | % | 9.1 | 24 | 36 | A / A1 / A | |||||||||||||||||||
| 17 |
Barnes & Noble | 25 | 9.8 | 1.0 | % | 6.5 | 2 | 27 | NR | |||||||||||||||||||
| 18 |
Staples | 34 | 9.4 | 1.0 | % | 6.5 | 1 | 35 | BBB / Baa2 / BBB | |||||||||||||||||||
| 19 |
Regal Cinemas | 11 | 9.0 | 0.9 | % | 6.5 | 2 | 13 | B+ / B1 / B+ | |||||||||||||||||||
| 20 |
Cinemark | 12 | 8.3 | 0.8 | % | 6.4 | 2 | 14 | BB- / NR / NR | |||||||||||||||||||
|
|
|
|
|
|
|
|
|
|
|
|
|
|||||||||||||||||
| Top 20 Tenants | 646 | $ | 279.9 | 28.3 | % | $ | 179.9 | 225 | 871 | |||||||||||||||||||
| 21 |
Dollar Tree Stores | 84 | $ | 8.1 | 0.8 | % | $ | 5.3 | 11 | 95 | NR | |||||||||||||||||
| 22 |
Sears (6) / Kmart (19) / Others (2) | 27 | 8.1 | 0.8 | % | 5.5 | 5 | 32 | B+ / Ba3 / B | |||||||||||||||||||
| 23 |
Rite Aid | 32 | 7.8 | 0.8 | % | 7.4 | 0 | 32 | B- / Caa2 / B- | |||||||||||||||||||
| 24 |
JoAnn Fabric | 24 | 7.5 | 0.8 | % | 5.4 | 8 | 32 | NR | |||||||||||||||||||
| 25 |
Toys R Us (8) / Babies R Us (16) | 24 | 7.4 | 0.7 | % | 5.8 | 12 | 36 | B / B1 / B | |||||||||||||||||||
| 26 |
Petco | 30 | 7.1 | 0.7 | % | 4.7 | 0 | 30 | B / B2 / NR | |||||||||||||||||||
| 27 |
DSW | 16 | 6.8 | 0.7 | % | 3.7 | 6 | 22 | NR | |||||||||||||||||||
| 28 |
Home Depot | 8 | 6.5 | 0.7 | % | 6.3 | 33 | 41 | BBB+ / A3 / BBB+ | |||||||||||||||||||
| 29 |
Sports Authority | 13 | 6.4 | 0.6 | % | 6.2 | 3 | 16 | B- / NR / NR | |||||||||||||||||||
| 30 |
Party City (23) / Others (7) | 30 | 5.7 | 0.6 | % | 3.8 | 8 | 38 | NR | |||||||||||||||||||
| 31 |
Royal Ahold - Stop N Shop (4) / Martin’s (1) | 5 | 5.2 | 0.5 | % | 1.9 | 0 | 5 | BBB / Baa3 / BBB | |||||||||||||||||||
| 32 |
Hobby Lobby | 14 | 5.2 | 0.5 | % | 3.3 | 3 | 17 | NR | |||||||||||||||||||
| 33 |
Pier 1 Imports | 27 | 5.0 | 0.5 | % | 3.4 | 11 | 38 | NR | |||||||||||||||||||
| 34 |
Office Depot | 18 | 4.9 | 0.5 | % | 3.0 | 6 | 24 | B- / B2 / NR | |||||||||||||||||||
| 35 |
Gamestop | 105 | 4.8 | 0.5 | % | 3.5 | 12 | 117 | BB+ / Ba1 / NR | |||||||||||||||||||
| 36 |
Famous Footwear (29) / Others (2) | 31 | 4.7 | 0.5 | % | 3.2 | 10 | 41 | B+ / B2 / BB+ | |||||||||||||||||||
| 37 |
Beall’s | 18 | 4.6 | 0.5 | % | 2.3 | 3 | 21 | NR | |||||||||||||||||||
| 38 |
Ulta | 20 | 4.5 | 0.5 | % | 2.9 | 3 | 23 | NR | |||||||||||||||||||
| 39 |
Giant Eagle | 6 | 4.3 | 0.4 | % | 2.7 | 0 | 6 | NR | |||||||||||||||||||
| 40 |
Payless (60) / Stride Rite (2) | 62 | 4.3 | 0.4 | % | 3.2 | 8 | 70 | B+ / B1 / NR | |||||||||||||||||||
|
|
|
|
|
|
|
|
|
|
|
|
|
|||||||||||||||||
| Tenants 21-40 | 594 | $ | 118.9 | 12.0 | % | $ | 83.5 | 142 | 736 | |||||||||||||||||||
|
|
|
|
|
|
|
|
|
|
|
|
|
|||||||||||||||||
| Top 40 Tenants | 1,240 | $ | 398.8 | 40.4 | % | $ | 263.4 | 367 | 1,607 | |||||||||||||||||||
|
|
|
|
|
|
|
|
|
|
|
|
|
|||||||||||||||||
| Total Portfolio | $ | 988.1 | 100.0 | % | $ | 655.7 | ||||||||||||||||||||||
| (1) | 15 leases are guaranteed by Koninklijke Ahold NV, rated BBB / Baa3 / BBB |
40
DDR
Quarterly Financial Supplement
For the nine months ended September 30, 2011
Summary of Consolidated Debt
(In Millions)
| Total Debt Outstanding |
September 30, 2011 Aggregate |
September 30, 2011 DDR Pro Rata Share |
September 30, 2011 DDR Pro Rata Wtd. Avg. Interest |
December 31, 2010 Aggregate |
December 31, 2010 DDR Pro Rata Share |
|||||||||||||||
| Mortgage Loans Payable: |
||||||||||||||||||||
| Fixed rate secured loans |
$ | 1,244.8 | $ | 1,234.9 | 5.60 | % | $ | 1,234.5 | $ | 1,224.6 | ||||||||||
| Variable rate secured loans |
95.6 | 83.8 | 2.04 | % | 144.0 | 131.8 | ||||||||||||||
| Secured Term Loan |
500.0 | 500.0 | 3.01 | % | 600.0 | 600.0 | ||||||||||||||
| Unsecured Public Debt |
2,158.9 | 2,158.9 | 5.89 | % | 2,043.6 | 2,043.6 | ||||||||||||||
| Unsecured Credit Facilities |
226.4 | 226.4 | 2.24 | % | 279.9 | 279.9 | ||||||||||||||
|
|
|
|
|
|
|
|
|
|
|
|||||||||||
| Total |
$ | 4,225.7 | $ | 4,204.0 | 5.09 | % | $ | 4,302.0 | $ | 4,279.9 | ||||||||||
|
|
|
|
|
|
|
|
|
|
|
|||||||||||
| Schedule of Maturities by Year (1) |
Scheduled Principal Payments |
Secured Debt Maturities |
Unsecured Debt Maturities |
Aggregate Total |
DDR Pro Rata Share |
|||||||||||||||
| 2011 |
$ | 6.9 | $ | — | $ | — | $ | 6.9 | $ | 6.9 | ||||||||||
| 2012 |
28.0 | 109.2 | 409.2 | 546.4 | 524.7 | |||||||||||||||
| 2013 |
27.1 | 392.8 | — | 419.9 | 419.9 | |||||||||||||||
| 2014 |
25.2 | 364.4 | — | 389.6 | 389.6 | |||||||||||||||
| 2015 |
19.6 | 517.7 | 519.7 | 1,057.0 | 1,057.0 | |||||||||||||||
| 2016 |
16.9 | 48.8 | 526.4 | 592.1 | 592.1 | |||||||||||||||
| 2017 |
16.7 | 0.3 | 300.0 | 317.0 | 317.0 | |||||||||||||||
| 2018 |
11.3 | 75.5 | 382.2 | 469.0 | 469.0 | |||||||||||||||
| 2019 |
6.7 | 74.6 | — | 81.3 | 81.3 | |||||||||||||||
| 2020 |
4.8 | 0.3 | 300.0 | 305.1 | 305.1 | |||||||||||||||
| 2021 and beyond |
3.6 | 90.0 | — | 93.6 | 93.6 | |||||||||||||||
| Unsecured debt discount |
— | — | (52.2 | ) | (52.2 | ) | (52.2 | ) | ||||||||||||
|
|
|
|
|
|
|
|
|
|
|
|||||||||||
| $ | 166.8 | $ | 1,673.6 | $ | 2,385.3 | $ | 4,225.7 | $ | 4,204.0 | |||||||||||
|
|
|
|
|
|
|
|
|
|
|
|||||||||||
| Percentage of Total Debt |
September 30, 2011 | December 31, 2010 | ||||||
| Fixed |
85.3 | % | 79.7 | % | ||||
| Variable |
14.7 | % | 20.3 | % | ||||
| Recourse to DDR |
69.7 | % | 69.2 | % | ||||
| Non-recourse to DDR |
30.3 | % | 30.8 | % | ||||
| (1) | Assumes borrower extension options are exercised. |
41
DDR
Quarterly Financial Supplement
For the nine months ended September 30, 2011
Summary of Joint Venture Debt
(In Millions)
| Total Debt Outstanding |
September 30, 2011 Aggregate |
September 30, 2011 DDR Pro Rata Share |
September 30, 2011 DDR Pro Rata Wtd. Avg. Interest |
December 31, 2010 Aggregate |
December 31, 2010 DDR Pro Rata Share |
|||||||||||||||
| Mortgage Loans Payable: |
||||||||||||||||||||
| Fixed rate secured loans |
$ | 3,218.3 | $ | 662.3 | 5.64 | % | $ | 3,279.1 | $ | 705.3 | ||||||||||
| Variable rate secured loans |
672.7 | 126.8 | 5.42 | % | 661.5 | 128.5 | ||||||||||||||
|
|
|
|
|
|
|
|
|
|
|
|||||||||||
| Total |
$ | 3,891.0 | (1) | $ | 789.1 | (1) | 5.60 | % | $ | 3,940.6 | $ | 833.8 | ||||||||
|
|
|
|
|
|
|
|
|
|
|
|||||||||||
| Schedule of Maturities by Year (2) |
Scheduled Principal Payments |
Mortgage Loan Maturities |
Aggregate Total |
DDR Pro Rata Share |
||||||||||||||||
| 2011 |
$ | 2.1 | $ | 74.8 | $ | 76.9 | $ | 7.6 | ||||||||||||
| 2012 |
6.6 | 1,327.9 | 1,334.5 | 287.7 | ||||||||||||||||
| 2013 |
4.6 | 412.2 | 416.8 | 61.6 | ||||||||||||||||
| 2014 |
4.4 | 170.9 | 175.3 | 36.4 | ||||||||||||||||
| 2015 |
3.8 | 188.7 | 192.5 | 40.2 | ||||||||||||||||
| 2016 |
3.8 | 40.8 | 44.6 | 16.1 | ||||||||||||||||
| 2017 |
3.8 | 1,372.2 | 1,376.0 | 255.1 | ||||||||||||||||
| 2018 |
3.0 | 29.4 | 32.4 | 5.8 | ||||||||||||||||
| 2019 |
2.1 | 34.1 | 36.2 | 5.8 | ||||||||||||||||
| 2020 |
2.2 | 71.0 | 73.2 | 24.5 | ||||||||||||||||
| 2021 and beyond |
1.3 | 131.3 | 132.6 | 48.3 | ||||||||||||||||
|
|
|
|
|
|
|
|
|
|||||||||||||
| $ | 37.7 | $ | 3,853.3 | $ | 3,891.0 | $ | 789.1 | |||||||||||||
|
|
|
|
|
|
|
|
|
|||||||||||||
| Percentage of Total Debt |
September 30, 2011 | December 31, 2010 | ||||||
| Fixed |
82.7 | % | 83.2 | % | ||||
| Variable |
17.3 | % | 16.8 | % | ||||
| Recourse to DDR |
4.5 | % | 5.0 | % | ||||
| Non-recourse to DDR |
95.5 | % | 95.0 | % | ||||
| (1) | Includes approximately $300.8 million of mortgage debt of which the Company’s prorata share of non-recourse mortgage debt is $48.2 million associated with joint ventures for which the Company has written its investment down to zero and is receiving no allocation of income. |
| (2) | Assumes borrower extension options are exercised. |
42
DDR
Quarterly Financial Supplement
For the nine months ended September 30, 2011
Consolidated Debt Detail
(In Millions)
| Loan Balance |
DDR Proportionate Share |
Final Maturity Date (1) |
Interest Rate (2) |
|||||||||||
| SENIOR DEBT |
||||||||||||||
| Unsecured Credit Facilities: |
||||||||||||||
| $750 Million Revolving Credit Facility |
$ | 214.9 | $ | 214.9 | 02/16 | LIBOR + 165 | ||||||||
| $65 Million Revolving Credit Facility |
11.5 | 11.5 | 02/16 | LIBOR + 165 | ||||||||||
| Secured Credit Facility: |
||||||||||||||
| $500 Million Term Loan |
500.0 | 500.0 | 09/15 | LIBOR + 170 | ||||||||||
|
|
|
|
|
|||||||||||
| Total Term and Credit Facility Debt |
$ | 726.4 | $ | 726.4 | ||||||||||
| PUBLIC DEBT |
||||||||||||||
| Convertible Notes |
184.1 | (3) | 184.1 | 03/12 | 3.00 | |||||||||
| Unsecured Notes |
223.3 | 223.3 | 10/12 | 5.38 | ||||||||||
| Unsecured Notes |
169.5 | 169.5 | 05/15 | 5.50 | ||||||||||
| Convertible Notes |
305.2 | (4) | 305.2 | 11/15 | 1.75 | |||||||||
| Unsecured Notes |
298.8 | 298.8 | 03/16 | 9.63 | ||||||||||
| Unsecured Notes |
300.0 | 300.0 | 04/17 | 7.50 | ||||||||||
| Unsecured Notes |
298.1 | 298.1 | 04/18 | 4.75 | ||||||||||
| Medium Term Notes |
82.2 | 82.2 | 07/18 | 7.50 | ||||||||||
| Unsecured Notes |
297.7 | 297.7 | 09/20 | 7.88 | ||||||||||
|
|
|
|
|
|||||||||||
| Total Public Debt |
$ | 2,158.9 | $ | 2,158.9 | ||||||||||
| MORTGAGE DEBT |
||||||||||||||
| Kyle Crossing, Kyle, TX |
23.5 | (5) | 11.7 | 01/12 | LIBOR + 350 | |||||||||
| Paradise Village Gateway, Phoenix, AZ |
30.0 | 20.1 | 03/12 | 5.39 | ||||||||||
| University Hills, Denver, CO |
24.5 | 24.5 | 07/12 | 7.30 | ||||||||||
| N. Charleston Center, N. Charleston, SC |
9.3 | 9.3 | 07/12 | 7.37 | ||||||||||
| Cortez Plaza, Bradenton, FL |
10.7 | 10.7 | 07/12 | 7.15 | ||||||||||
| Walgreen’s, Dearborn Hts, MI |
3.5 | 3.5 | 11/12 | 4.86 | ||||||||||
| Walgreen’s, Livonia, MI |
2.5 | 2.5 | 11/12 | 4.86 | ||||||||||
| Terraces at Southpark, Charlotte, NC |
6.6 | 6.6 | 12/12 | 5.72 | ||||||||||
| Walgreen’s, Westland, MI |
2.6 | 2.6 | 03/13 | 4.86 | ||||||||||
| Plaza Escorial, Carolina, PR |
57.5 | 57.5 | 04/13 | 5.00 | ||||||||||
| Plaza Rio Hondo, Bayamon, PR |
109.5 | 109.5 | 04/13 | 5.00 | ||||||||||
| Paseo Colorado, Pasadena, CA |
79.1 | 79.1 | 04/13 | 5.00 | ||||||||||
| Meridian Crossroads & Family Center, Meridian, ID |
37.2 | 37.2 | 04/13 | 5.00 | ||||||||||
| University Center, Wilmington, NC |
24.5 | 24.5 | 04/13 | 5.00 | ||||||||||
| Aspen Grove, Littleton, CO |
42.2 | 42.2 | 04/13 | 5.00 | ||||||||||
| Victor Square, Victor, NY |
5.9 | 5.9 | 04/13 | 5.80 | ||||||||||
| DDRC Headquarters, Beachwood, OH |
34.1 | 34.1 | 04/13 | LIBOR + 110 | ||||||||||
| Monmouth Consumer Sq., W. Long Branch, NJ |
4.3 | 4.3 | 07/13 | 8.57 | ||||||||||
| Rotonda Plaza, Englewood, FL |
0.6 | 0.6 | 07/13 | 5.80 | ||||||||||
| Crossroads Center, Gulfport, MS |
25.5 | 25.5 | 10/14 | 4.23 | ||||||||||
| The Commons, Salisbury, MD |
9.1 | 9.1 | 10/14 | 4.23 | ||||||||||
| Chillicothe Place, Chillicothe, OH |
4.5 | 4.5 | 10/14 | 4.23 | ||||||||||
| Deer Valley Towne Center, Phoenix, AZ |
18.3 | 18.3 | 10/14 | 4.23 | ||||||||||
| Plaza at Sunset Hills, Sunset Hills, MO |
29.0 | 29.0 | 10/14 | 4.23 | ||||||||||
| North Pointe Plaza, North Charleston, SC |
11.4 | 11.4 | 10/14 | 4.23 | ||||||||||
| Wando Crossing, Mount Pleasant, SC |
12.4 | 12.4 | 10/14 | 4.23 | ||||||||||
| Brook Highland Plaza, Birmingham, AL |
25.6 | 25.6 | 10/14 | 4.23 | ||||||||||
| Mooresville Consumer Sq., Mooresville, NC |
18.9 | 18.9 | 10/14 | 4.23 | ||||||||||
| Town Center Plaza, Leawood, KS |
52.5 | 52.5 | 10/14 | 4.23 | ||||||||||
| Warner Robins Place, Warner Robins, GA |
7.1 | 7.1 | 10/14 | 4.23 | ||||||||||
43
DDR
Quarterly Financial Supplement
For the nine months ended September 30, 2011
| Consolidated Debt Detail (In Millions)
|
||||||||||||||
| Loan Balance |
DDR Proportionate Share |
Final Maturity Date (1) |
Interest Rate (2) |
|||||||||||
| Cross Pointe Center, Fayetteville, NC |
10.3 | 10.3 | 10/14 | 4.23 | ||||||||||
| Overlook at Hamilton Place, Chattanooga, TN |
10.3 | 10.3 | 10/14 | 4.23 | ||||||||||
| Bermuda Square, Chester, VA |
7.8 | 7.8 | 10/14 | 4.23 | ||||||||||
| Home Depot Center, Orland Park, IL |
7.0 | 7.0 | 10/14 | 4.23 | ||||||||||
| Delaware Consumer Square, Buffalo, NY |
10.6 | 10.6 | 10/14 | 4.23 | ||||||||||
| Hamilton Marketplace, Hamilton, NJ |
43.0 | 43.0 | 10/14 | 4.23 | ||||||||||
| Marketplace at Delta Twp, Lansing, MI |
6.9 | 6.9 | 10/14 | 4.23 | ||||||||||
| Clearwater Collection, Clearwater, FL |
7.4 | 7.4 | 10/14 | 4.23 | ||||||||||
| Wendover Village, Greensboro, NC |
5.0 | 5.0 | 10/14 | 4.23 | ||||||||||
| Lexington Place, Lexington, SC |
4.5 | 4.5 | 10/14 | 4.23 | ||||||||||
| Downtown Short Pump, Richmond, VA |
13.0 | 13.0 | 10/14 | 4.23 | ||||||||||
| Loisdale Center, Springfield, VA |
11.5 | 11.5 | 10/14 | 4.23 | ||||||||||
| Windsor Court, Windsor, CT |
7.6 | 7.6 | 10/14 | 4.23 | ||||||||||
| Abernathy Square, Atlanta, GA |
12.6 | 12.6 | 10/14 | 4.23 | ||||||||||
| Sam’s Club, Worcester, MA |
5.6 | 5.6 | 10/14 | 4.23 | ||||||||||
| Walmart Supercenter, Alliance, OH |
7.4 | 7.4 | 10/14 | 4.23 | ||||||||||
| Kroger, Cincinnati, OH |
2.7 | 2.7 | 10/14 | 4.23 | ||||||||||
| Reno Riverside, Reno, NV |
2.9 | (5) | 2.9 | 02/15 | Prime + 170 | |||||||||
| Merriam Village, Merriam, KS |
15.0 | 15.0 | 03/15 | LIBOR + 250 | ||||||||||
| Hamilton Commons, Mays Landing, NJ |
7.2 | 7.2 | 09/15 | 4.70 | ||||||||||
| Tops Plaza, Lockport, NY |
6.9 | 6.9 | 01/16 | 8.00 | ||||||||||
| Merriam Town Center, Merriam, KS (TIF) |
1.0 | 1.0 | 02/16 | 6.90 | ||||||||||
| Cotswold Village, Charlotte, NC |
50.8 | 50.8 | 05/16 | 5.83 | ||||||||||
| Freedom Plaza, Rome, NY |
2.5 | 2.5 | 09/16 | 7.85 | ||||||||||
| Walmart Supercenter, Winston-Salem, NC |
6.9 | 6.9 | 08/17 | 6.00 | ||||||||||
| Thruway Plaza (Walmart), Cheektowaga, NY |
3.0 | 3.0 | 10/17 | 6.78 | ||||||||||
| Tops Plaza, Ithaca, NY |
12.1 | 12.1 | 01/18 | 7.05 | ||||||||||
| Walmart Supercenter, Greenville, SC |
6.6 | 6.6 | 01/18 | 6.00 | ||||||||||
| Southland Crossings, Boardman, OH |
25.8 | 25.8 | 03/18 | 5.06 | ||||||||||
| The Promenade at Brentwood, St. Louis, MO |
32.8 | 32.8 | 03/18 | 5.06 | ||||||||||
| Johns Creek Town Center, Suwanee, GA |
25.8 | 25.8 | 03/18 | 5.06 | ||||||||||
| Mohawk Commons, Niskayuna, NY |
16.2 | 16.2 | 12/18 | 5.75 | ||||||||||
| Lowes, Hendersonville, TN |
6.2 | 6.2 | 01/19 | 7.66 | ||||||||||
| Plaza Isabela, Isabela, PR |
23.0 | 23.0 | 06/19 | 7.59 | ||||||||||
| Plaza Cayey, Cayey, PR |
21.8 | 21.8 | 06/19 | 7.59 | ||||||||||
| Plaza Walmart, Guayama, PR |
12.2 | 12.2 | 06/19 | 7.59 | ||||||||||
| Plaza Fajardo, Fajardo, PR |
26.2 | 26.2 | 06/19 | 7.59 | ||||||||||
| Mariner Square, Spring Hill, FL |
3.8 | 3.8 | 09/19 | 9.75 | ||||||||||
| Northland Square, Cedar Rapids, IA |
7.2 | 7.2 | 01/20 | 9.38 | ||||||||||
| West Valley Marketplace, Allentown, PA |
13.5 | 13.5 | 07/21 | 6.95 | ||||||||||
| Wrangleboro Consumer Sq. I & II, Mays Landing, NJ |
65.0 | 65.0 | 10/21 | 5.41 | ||||||||||
| Chapel Hills East, Colorado Springs, CO |
9.6 | 9.6 | 12/21 | 5.24 | ||||||||||
| Macedonia Commons, Macedonia, OH |
20.8 | 20.8 | 02/22 | 5.71 | ||||||||||
| Gulfport Promenade, Gulfport, MS |
20.0 | 20.0 | 12/37 | SIFMA + 5bp | ||||||||||
|
|
|
|
|
|||||||||||
| Total Mortgage Debt |
$ | 1,340.4 | $ | 1,318.7 | ||||||||||
| Total Consolidated Debt |
$ | 4,225.7 | $ | 4,204.0 | ||||||||||
|
|
|
|
|
|||||||||||
44
DDR
Quarterly Financial Supplement
For the nine months ended September 30, 2011
| Consolidated Debt Detail (In Millions)
|
||||||||||||||
| Loan Balance |
DDR Proportionate Share |
Final Maturity Date (1) |
Interest Rate (2) |
|||||||||||
| Wtd. Avg. Maturity |
Wtd. Avg. Interest Rate |
|||||||||||||
| Fixed Rate |
$ | 3,603.7 | $ | 3,593.8 | 4.4 years | 5.60 | % | |||||||
| Variable Rate |
622.0 | 610.2 | 4.7 years | 2.04 | % | |||||||||
|
|
|
|
|
|
|
|
||||||||
| $ | 4,225.7 | $ | 4,204.0 | 4.5 years | 5.09 | % | ||||||||
|
|
|
|
|
|
|
|
||||||||
CUMULATIVE REDEEMABLE PREFERRED SHARES
| Outstanding Amount | ||||
| Class H - 7.375% |
$ | 205.0 | ||
| Class I - 7.5% |
170.0 | |||
|
|
|
|||
| $ | 375.0 | |||
DERIVATIVE INSTRUMENTS
| Notional Amount | Underlying Debt Hedged |
Rate Hedged |
Fixed Rate | Termination Date | ||||||||||
| Interest Rate Swap |
$ | 100.0 | Secured Term Loan | 1 mo. LIBOR | 4.82 | % | February 21, 2012 | |||||||
| Interest Rate Swap |
$ | 100.0 | Secured Term Loan | 1 mo. LIBOR | 1.01 | % | June 28, 2014 | |||||||
| Interest Rate Swap |
$ | 84.4 | Mortgage Portfolio | 1 mo. LIBOR | 2.81 | % | September 1, 2017 | |||||||
Notes:
| (1) | Assumes borrower extension options are exercised. |
| (2) | Interest rate figures reflect coupon rates of interest and do not include discounts or premiums. Annualized deferred finance cost amortization of approximately $14.7 million is partially offset by approximately $2.1 million of fair market value adjustments. |
| (3) | The convertible notes may be net settled with DDR’s common stock once the stock price rises above $74.56 per share. The principal balance on these notes is to be settled in cash. Included in this amount is a $1.6 million reduction as compared to the face value of the convertible notes as required by accounting standards due to the initial value of the equity conversion feature. |
| (4) | The convertible notes may be net settled with DDR’s common stock once the stock price rises above $16.27 per share at September 30, 2011 and is subject to adjustments resulting from changes in the quarterly dividend per share. The principal balance on these notes is to be settled in cash. Included in this amount is a $44.8 million reduction as compared to the face value of the convertible notes as required by accounting standards due to the initial value of the equity conversion feature. |
| (5) | The following loans have floor interest rates: |
| Loan |
Floor | |||
| Kyle Crossing, Kyle, TX |
4.00 | % | ||
| Reno Riverside, Reno, NV |
5.95 | % | ||
45
DDR
Quarterly Financial Supplement
For the nine months ended September 30, 2011
Joint Venture Debt Detail
(In Millions)
| Loan Balance |
DDR Proportionate Share |
Final Maturity Date (1) |
Interest Rate |
|||||||||||
| DDRTC Core Retail Fund, LLC |
||||||||||||||
| DDRTC Holdings Pool 5, LLC (13 assets) |
$ | 178.0 | $ | 26.7 | 02/12 | LIBOR + 65 | ||||||||
| DDRTC Holdings Pool 3, LLC (17 assets) |
555.0 | 83.3 | 03/12 | 5.48 | ||||||||||
| DDRTC Holdings Pool 1, LLC (9 assets) |
350.2 | 52.5 | 03/17 | 5.45 | ||||||||||
| DDRTC Holdings Pool 6, LLC |
||||||||||||||
| Cox Creek Shopping Center, Florence, AL |
13.6 | 2.0 | 03/12 | 7.09 | ||||||||||
| Cypress Trace, Fort Myers, FL |
16.0 | 2.4 | 04/12 | 5.00 | ||||||||||
| Waterfront Marketplace, Homestead, PA |
27.5 | 4.1 | 08/12 | 6.35 | ||||||||||
| Waterfront Town Center, Homestead, PA |
36.3 | 5.4 | 08/12 | 6.35 | ||||||||||
| Creeks at Virginia Center, Glen Allen, VA |
24.5 | 3.7 | 08/12 | 6.37 | ||||||||||
| Willoughby Hills Shop Ctr, Willoughby Hills, OH |
10.9 | 1.6 | 07/18 | 6.98 | ||||||||||
|
|
|
|
|
|||||||||||
| Total DDRTC Core Retail Fund LLC |
$ | 1,212.0 | $ | 181.7 | ||||||||||
| DDR Domestic Retail Fund I |
||||||||||||||
| Shoppes on the Ridge, Lake Wales, FL |
9.6 | 1.9 | 12/11 | 4.74 | ||||||||||
| Publix Brooker Creek, Palm Harbor, FL |
5.0 | 1.0 | 12/11 | 4.61 | ||||||||||
| Watercolor Crossing, Santa Rosa, FL |
4.4 | 0.9 | 01/12 | 4.76 | ||||||||||
| Heather Island Plaza, Ocala, FL |
6.2 | 1.2 | 12/12 | 5.00 | ||||||||||
| Hilliard Rome, Columbus, OH |
10.4 | 2.1 | 01/13 | 5.87 | ||||||||||
| Meadows Square, Boynton Beach, FL |
1.3 | 0.3 | 07/13 | 6.72 | ||||||||||
| Village Center, Racine, WI |
11.9 | 2.4 | 04/15 | 4.21 | ||||||||||
| Paradise Promenade, Davie, FL |
6.1 | 1.2 | 04/15 | 4.21 | ||||||||||
| West Falls Plaza, West Patterson, NJ |
11.6 | 2.3 | 04/15 | 4.21 | ||||||||||
| DDR Domestic Retail Fund I (52 assets) |
885.0 | 177.0 | 07/17 | 5.60 | ||||||||||
|
|
|
|
|
|||||||||||
| Total DDR Domestic Retail Fund I |
$ | 951.5 | $ | 190.3 | ||||||||||
| Coventry II |
||||||||||||||
| Bloomfield Park, Bloomfield Hills, MI |
$ | 39.8 | (2) | $ | — | 12/08 | Prime + 300 | |||||||
| Westover Marketplace, San Antonio, TX |
20.4 | (3) | 4.1 | 11/11 | LIBOR + 350 | |||||||||
| Coventry II DDR SM (31 assets) |
71.8 | (2) | 14.3 | 09/12 | LIBOR + 225 | |||||||||
| Buena Park, Buena Park, CA |
61.0 | 12.2 | 11/12 | 7.25 | ||||||||||
| Marley Creek Square, Orland Park, IL |
10.6 | (2) | 1.1 | 12/12 | 5.49 | |||||||||
| Watters Creek, Allen, TX |
136.3 | (3) | 22.5 | 01/13 | LIBOR + 300 | |||||||||
| Fairplain Plaza, Benton Harbor, MI |
15.1 | 3.0 | 05/13 | LIBOR + 350 | ||||||||||
| Totem Lake Mall, Kirkland, WA |
27.4 | 5.5 | 05/13 | LIBOR + 350 | ||||||||||
| Christown Spectrum Mall, Phoenix, AZ |
46.0 | (3) | 9.2 | 11/13 | LIBOR + 343 | |||||||||
| Christown Spectrum Mall, Phoenix, AZ |
19.0 | (3) | 3.8 | 11/13 | LIBOR + 1000 | |||||||||
| Tri-County Mall, Cincinnati, OH |
150.6 | (2) | 30.1 | 02/15 | 5.66 | |||||||||
| Coventry II DDR SM (7 assets) |
28.0 | (2) | 5.6 | 08/16 | 6.75 | |||||||||
|
|
|
|
|
|||||||||||
| Total Coventry II |
$ | 626.0 | $ | 111.4 | ||||||||||
46
DDR
Quarterly Financial Supplement
For the nine months ended September 30, 2011
Joint Venture Debt Detail
(In Millions)
| Loan Balance |
DDR Proportionate Share |
Final Maturity Date (1) |
Interest Rate |
|||||||||||
| DDR SAU Retail Fund, LLC |
||||||||||||||
| Lewandowski Commons, Lyndhurst, NJ |
$ | 12.5 | $ | 2.5 | 03/12 | 5.77 | ||||||||
| South Square, Durham, NC |
12.6 | 2.5 | 10/12 | 5.06 | ||||||||||
| Shoppes at Wendover II, Greensboro, NC |
14.4 | 2.9 | 10/12 | 5.06 | ||||||||||
| North Hampton Market (Phase I & II), Taylors, SC |
10.5 | 2.1 | 10/12 | 5.08 | ||||||||||
| Oakland Market Place, Oakland, TN |
3.6 | 0.7 | 10/12 | 5.04 | ||||||||||
| Crossroads Square, Morristown, TN |
4.9 | 1.0 | 12/12 | 5.31 | ||||||||||
| Cascade Corners, Atlanta, GA |
4.0 | 0.8 | 12/12 | 5.42 | ||||||||||
| Hilander Village, Roscoe, IL |
9.4 | 1.9 | 12/12 | 5.41 | ||||||||||
| Glenlake Plaza, Indianapolis, IN |
8.2 | 1.6 | 12/12 | 5.44 | ||||||||||
| Broadmoor Plaza, South Bend, IN |
11.0 | 2.2 | 12/12 | 5.44 | ||||||||||
| Milan Plaza, Milan, MI |
2.2 | 0.4 | 12/12 | 5.49 | ||||||||||
| West Towne Commons, Jackson, TN |
4.8 | 1.0 | 12/12 | 5.44 | ||||||||||
| American Way, Memphis, TN |
6.7 | 1.3 | 12/12 | 5.44 | ||||||||||
| Kroger Junction, Pasadena, TX |
3.8 | 0.8 | 12/12 | 5.44 | ||||||||||
| Kroger Plaza, Virginia Beach, VA |
1.8 | 0.4 | 12/12 | 5.44 | ||||||||||
| Willowbrook Commons, Nashville, TN |
7.0 | 1.4 | 03/13 | 5.41 | ||||||||||
| Harper Hill Commons, Winston Salem, NC |
10.3 | 2.0 | 04/13 | 5.79 | ||||||||||
| The Point, Greenville, SC |
15.8 | 3.2 | 04/13 | 5.64 | ||||||||||
| Plaza at Carolina Forest, Myrtle Beach, SC |
14.2 | 2.8 | 05/13 | 5.97 | ||||||||||
| Alexander Pointe, Salisbury, NC |
5.1 | 1.0 | 08/13 | 5.92 | ||||||||||
| Patterson Place, Durham, NC |
20.3 | 4.1 | 12/13 | 5.67 | ||||||||||
|
|
|
|
|
|||||||||||
| Total DDR SAU Retail Fund LLC |
$ | 183.1 | $ | 36.6 | ||||||||||
| Sonae Sierra Brasil BV Sarl |
||||||||||||||
| Sonae Sierra Brasil Limitadas, Brazil |
$ | 10.5 | $ | 3.5 | 11/15 | CDI + 285 | ||||||||
| Patio Boavista, Brazil |
14.3 | 4.8 | 11/16 | CDI + 330 | ||||||||||
| Shopping Metropole, Brazil |
29.2 | 9.7 | 05/18 | TR + 1030 | ||||||||||
| Manaura Shopping, Brazil |
71.0 | 23.7 | 12/20 | 10.00 | ||||||||||
| Patio Londrina, Brazil |
22.0 | 7.3 | 10/25 | TR + 1090 | ||||||||||
| Patio Uberlandia, Brazil |
28.8 | 9.6 | 10/25 | TR + 1130 | ||||||||||
|
|
|
|
|
|||||||||||
| Total Sonae Sierra Brasil BV Sarl |
$ | 175.8 | $ | 58.6 | ||||||||||
| DDRA Ahwatukee Foothills LLC, Phoenix, AZ |
106.4 | 53.2 | 08/12 | 5.30 | ||||||||||
| DDRA Arrowhead Crossing LLC, Phoenix, AZ |
47.5 | 23.7 | 08/12 | 5.30 | ||||||||||
| DDRA Tanasbourne Town Center LLC, Portland, OR |
57.1 | 28.6 | 08/12 | 5.30 | ||||||||||
| Jefferson County Plaza LLC, Arnold, MO |
3.5 | 1.8 | 08/12 | LIBOR + 200 | ||||||||||
| DDR MDT PS, LLC (7 assets) |
86.0 | — | 07/13 | 6.00 | ||||||||||
| DDR Markaz II (13 assets) |
150.5 | 30.1 | 11/14 | 5.15 | ||||||||||
| TRT DDR Holdings I LLC (3 assets) |
110.0 | 11.0 | 05/17 | 5.51 | ||||||||||
| Lennox Town Center Limited, Columbus, OH |
1.0 | 0.5 | 06/17 | 6.44 | ||||||||||
| Lennox Town Center Limited, Columbus, OH |
26.0 | 13.0 | 06/17 | 5.64 | ||||||||||
47
DDR
Quarterly Financial Supplement
For the nine months ended September 30, 2011
Joint Venture Debt Detail
(In Millions)
| Loan Balance |
DDR Proportionate Share |
Final Maturity Date (1) |
Interest Rate |
|||||||||||||
| Cole DDR MT Independence, Independence, MO |
$ | 34.1 | $ | 5.0 | 01/19 | 5.95 | ||||||||||
| RO & SW Realty LLC (9 assets) |
21.9 | 5.5 | 10/20 | 5.25 | ||||||||||||
| Sun Center Limited, Columbus, OH |
23.6 | 18.8 | 04/21 | 5.99 | ||||||||||||
| RVIP IIIB, Deer Park, IL |
75.0 | 19.3 | 09/21 | 4.84 | ||||||||||||
|
|
|
|
|
|||||||||||||
| Total |
$ | 742.6 | $ | 210.5 | ||||||||||||
| Total Joint Venture Debt |
$ | 3,891.0 | $ | 789.1 | ||||||||||||
|
|
|
|
|
|||||||||||||
| Wtd. Avg. Maturity |
Wtd. Avg. Interest Rate |
|||||||||||||||
| Total Joint Venture Debt: |
||||||||||||||||
| Fixed Rate |
$ | 3,218.3 | $ | 662.3 | 3.9 years | 5.64 | % | |||||||||
| Variable Rate |
672.7 | 126.8 | 3.5 years | 5.42 | % | |||||||||||
|
|
|
|
|
|
|
|
|
|||||||||
| $ | 3,891.0 | $ | 789.1 | 3.8 years | 5.60 | % | ||||||||||
|
|
|
|
|
|
|
|
|
|||||||||
DERIVATIVE INSTRUMENTS
| Notional Amount | Underlying Debt Hedged | Rate Hedged | Capped Rate | Termination Date | ||||||||||||
| Interest Rate Cap |
$ | 76.1 | Coventry II DDR SM | 1 mo. LIBOR | 3.00 | % | September 1, 2012 | |||||||||
| Interest Rate Cap |
$ | 65.0 | Coventry II Christown Spectrum Mall | 1 mo. LIBOR | 2.85 | % | November 22, 2013 | |||||||||
Notes:
| (1) | Assumes borrower extension options are exercised. |
| (2) | Includes approximately $300.8 million of mortgage debt of which the Company’s prorata share of non-recourse mortgage debt is $48.2 million associated with joint ventures for which the Company has written its investment down to zero and is receiving no allocation of income. |
| (3) | The following loans have floor interest rates: |
| Loan |
Floor | |
| Westover Marketplace, San Antonio, TX |
1 month LIBOR of 1.50% | |
| Watters Creek, Allen, TX |
1 month LIBOR of 0.50% | |
| Christown Spectrum Mall, Phoenix, AZ |
1 month LIBOR of 0.26% |
48
DDR
Quarterly Financial Supplement
| Corporate Headquarters | Investor Relations | |||
| DDR Corp. | Samir Khanal | |||
| 3300 Enterprise Parkway | Toll Free: (877) 225-5337 | |||
| Beachwood, Ohio 44122 | Main: (216) 755-5500 | |||
| Website: www.ddr.com | Email: skhanal@ddr.com | |||
| Equity Research Coverage | ||||
| BofA Merrill Lynch | ||||
| Craig Schmidt |
craig.schmidt@baml.com | (646) 855-3640 | ||
| Lindsay Schroll |
lindsay.schroll@baml.com | (646) 855-1829 | ||
| Citigroup |
||||
| Michael Bilerman |
michael.bilerman@citi.com | (212) 816-1383 | ||
| Quentin Velleley |
quentin.velleley@citi.com | (212) 816-6981 | ||
| Cowen & Company |
||||
| Jim Sullivan |
james.sullivan@cowen.com | (646) 562-1380 | ||
| Mike Gorman |
michael.gorman@cowen.com | (646) 562-1381 | ||
| Deutsche Bank |
||||
| John Perry |
john.perry@db.com | (212) 250-4912 | ||
| Vincent Chao |
vincent.chao@db.com | (212) 250-6799 | ||
| DISCERN, Inc. |
||||
| Dave Wigginton |
dwigginton@discern.com | (646) 863-4177 | ||
| Goldman Sachs |
||||
| Jay Habermann |
jonathan.habermann@gs.com | (917) 343-4260 | ||
| Ji Young Kim |
jiyoung.kim@gs.com | (212) 902-4736 | ||
| Green Street Advisors |
||||
| Cedrik Lachance |
clachance@greensteetadvisors.com | (949) 640-8780 | ||
| Jason White |
jwhite@greenstreetadvisors.com | (949) 640-8780 | ||
| Hilliard Lyons |
||||
| Carol Kemple |
ckemple@hilliard.com | (502) 588-1839 | ||
| ISI Group |
||||
| Steve Sakwa |
ssakwa@isigrp.com | (212) 446-9462 | ||
| Samit Parikh |
sparikh@isigrp.com | (212) 888-3796 | ||
| Jefferies and Company |
||||
| Tayo Okusanya |
tokusanya@jefferies.com | (212) 336-7076 | ||
| J.P. Morgan |
||||
| Michael Mueller |
michael.w.mueller@jpmorgan.com | (212) 622-6689 | ||
| Macquarie |
||||
| Ki Bin Kim |
kibin.kim@macquarie.com | (212) 231-6386 | ||
| Morgan Stanley |
||||
| Paul Morgan |
paul.b.morgan@morganstanley.com | (415) 576-2627 | ||
| Stephen Bakke |
stephen.bakke@morganstanley.com | (415) 576-2696 | ||
| RBC Capital Markets |
||||
| Rich Moore |
rich.moore@rbccm.com | (440) 715-2646 | ||
| Wes Golladay |
wes.golladay@rbccm.com | (440) 715-2650 | ||
| Sandler O’Neill |
||||
| Alex Goldfarb |
agoldfarb@sandleroneill.com | (212) 466-7937 | ||
| James Milam |
jmilam@sandleroneill.com | (212) 466-8066 | ||
| UBS |
||||
| Ross Nussbaum |
ross.nussbaum@ubs.com | (212) 713-2484 | ||
| Christy McElroy |
christy.mcelroy@ubs.com | (203) 719-7831 | ||
| Wells Fargo |
||||
| Jeff Donnelly |
jeff.donnelly@wellsfargo.com | (617) 603-4262 | ||
| Tamara Fique |
tamara.fique@wellsfargo.com | (443) 263-6568 | ||
| Fixed Income Research Coverage |
||||
| BofA Merrill Lynch |
||||
| Tom Truxillo |
thomas.c.truxillo_jr@baml.com | (980) 386-5212 | ||
| Citigroup |
||||
| Tom Cook |
thomas.n.cook@citigroup.com | (212) 723-1112 | ||
| J.P. Morgan |
||||
| Mark Streeter |
mark.streeter@jpmorgan.com | (212) 834-5086 | ||
| RBC Capital Markets |
||||
| Seth Levine |
seth.levine@rbccm.com | (212) 618-3523 | ||
| Wells Fargo |
||||
| Thierry Perrein |
thierry.perrein@wachovia.com | (704) 715-8455 | ||
49