Attached files
| file | filename |
|---|---|
| EX-99.1 - EX-99.1 - TRIMAS CORP | trs_093011xexhibit991.htm |
| 8-K - 8-K - TRIMAS CORP | trs_093011x8k.htm |
q32011earningspresentati
Third Quarter 2011 Earnings Presentation October 27, 2011 NASDAQ • TRS
Safe Harbor Statement Any “forward-looking” statements contained herein, including those relating to market conditions or the Company’s financial condition and results, expense reductions, liquidity expectations, business goals and sales growth, involve risks and uncertainties, including, but not limited to, risks and uncertainties with respect to general economic and currency conditions, various conditions specific to the Company’s business and industry, the Company’s substantial leverage, liabilities imposed by the Company’s debt instruments, market demand, competitive factors, supply constraints, material and energy costs, technology factors, litigation, government and regulatory actions, the Company’s accounting policies, future trends, and other risks which are detailed in the Company’s Annual Report on Form 10-K for the fiscal year ended December 31, 2010, and in the Company’s Quarterly Reports on Form 10-Q. These risks and uncertainties may cause actual results to differ materially from those indicated by the forward-looking statements. All forward-looking statements made herein are based on information currently available, and the Company assumes no obligation to update any forward-looking statements. 2
Agenda • Opening Remarks • Financial Highlights • Segment Highlights • Outlook and Summary • Questions and Answers • Appendix 3
Opening Remarks – Third Quarter Results • Playbook in place continues to enhance TriMas value ̶ Operating processes established to maximize results ̶ Great execution of growth and productivity programs ̶ Strategic plans and actions to maximize long-term portfolio and business focus • Sixth consecutive quarter of double-digit sales and earnings growth despite choppy markets ̶ Diversified business portfolio driving positive results ̶ Took quick actions in response to mixture of end market softness and strength in our diverse segments ̶ Ongoing “restructuring” to ensure best cost producer position • Strategic aspirations consistent Delivering on our commitments, while investing in future growth. 4
Financial Highlights
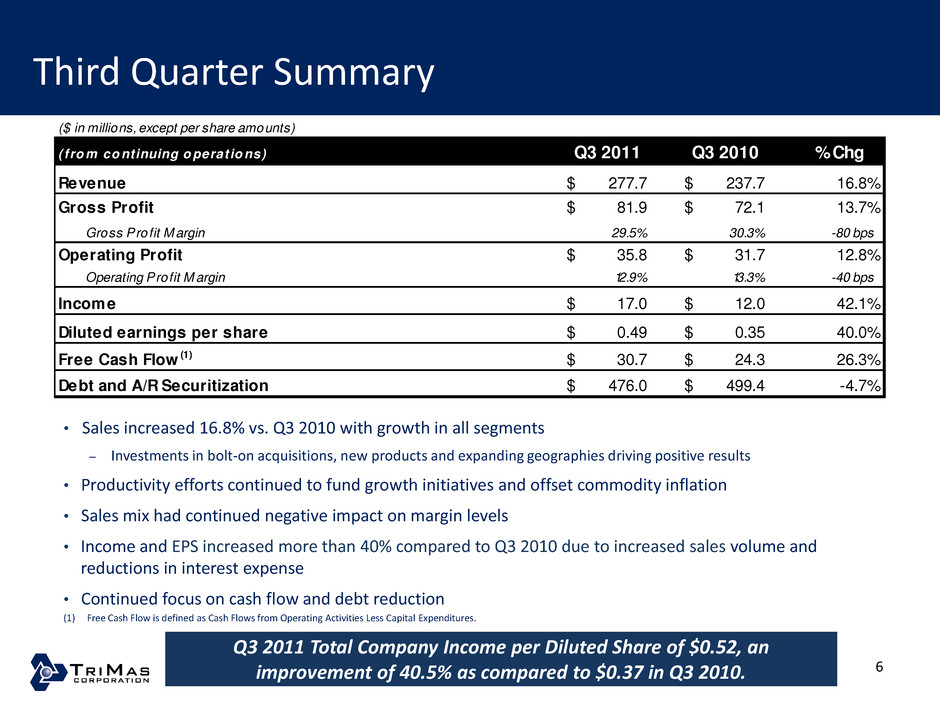
Third Quarter Summary • Sales increased 16.8% vs. Q3 2010 with growth in all segments ̶ Investments in bolt-on acquisitions, new products and expanding geographies driving positive results • Productivity efforts continued to fund growth initiatives and offset commodity inflation • Sales mix had continued negative impact on margin levels • Income and EPS increased more than 40% compared to Q3 2010 due to increased sales volume and reductions in interest expense • Continued focus on cash flow and debt reduction 6 (1) Free Cash Flow is defined as Cash Flows from Operating Activities Less Capital Expenditures. ($ in millions, except per share amounts) ( f ro m co ntinuing o perat io ns) Q3 2011 Q3 2010 % Chg Revenue 277.7$ 237.7$ 16.8% Gross Profit 81.9$ 72.1$ 13.7% Gross Profit M argin 29.5% 30.3% -80 bps Operating Profit 35.8$ 31.7$ 12.8% Operating Profit M argin 12.9% 13.3% -40 bps Income 17.0$ 12.0$ 42.1% Diluted earnings per share 0.49$ 0.35$ 40.0% Free Cash Flow (1) 30.7$ 24.3$ 26.3% Debt and A/R Securitization 476.0$ 499.4$ -4.7% Q3 2011 Total Company Income per Diluted Share of $0.52, an improvement of 40.5% as compared to $0.37 in Q3 2010.
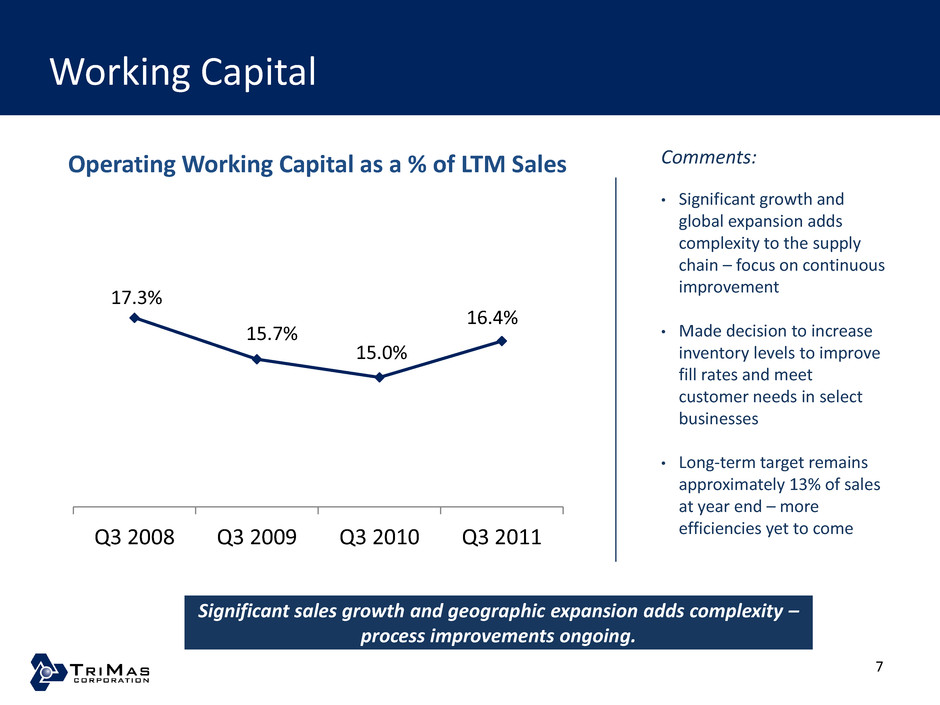
Working Capital Significant sales growth and geographic expansion adds complexity – process improvements ongoing. 7 Comments: • Significant growth and global expansion adds complexity to the supply chain – focus on continuous improvement • Made decision to increase inventory levels to improve fill rates and meet customer needs in select businesses • Long-term target remains approximately 13% of sales at year end – more efficiencies yet to come 17.3% 15.7% 15.0% 16.4% Q3 2008 Q3 2009 Q3 2010 Q3 2011 Operating Working Capital as a % of LTM Sales
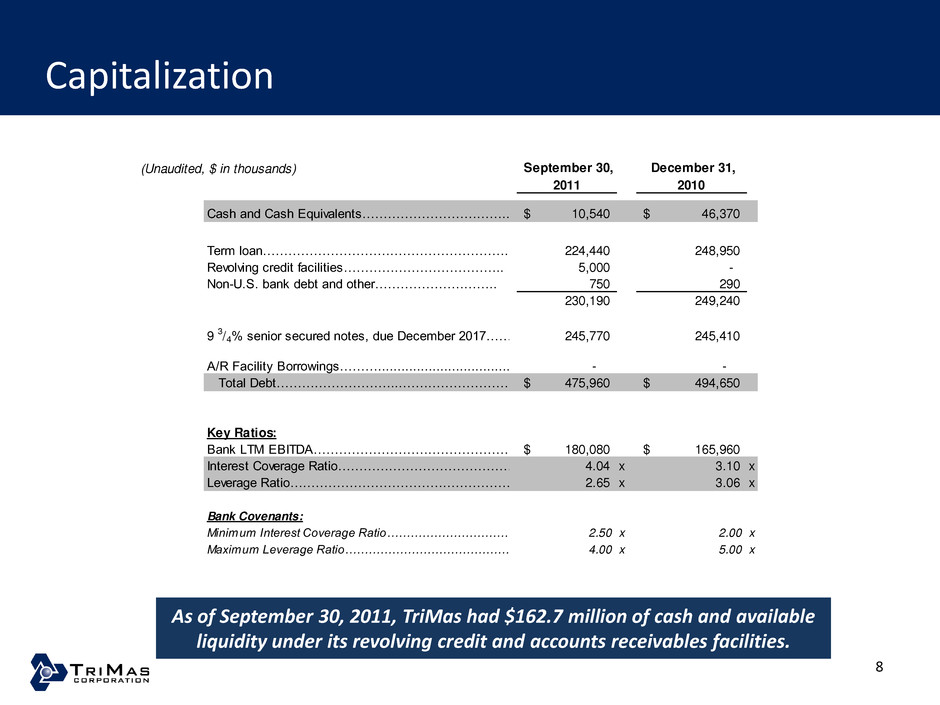
Capitalization As of September 30, 2011, TriMas had $162.7 million of cash and available liquidity under its revolving credit and accounts receivables facilities. 8 (Unaudited, $ in thousands) September 30, December 31, 2011 2010 Cash and Cash Equivalents……………………………..………………… 10,540$ 46,370$ Term loan…………………………………………………. 224,440 248,950 Revolving credit facilities……………………………….. 5,000 - Non-U.S. bank debt and other……………………….. 750 290 230,190 249,240 9 3/4% senior secured notes, due December 2017………………………………………………………………………………. 245,770 245,410 A/R Facility Borrowings………............................................................ - - Total Debt………………………...………………………...………………………… 475,960$ 494,650$ Key Ratios: Bank LTM EBITDA……………………………………………………………………………….……………………………………… 180,080$ 165,960$ Interest Coverage Ratio………………………………………………………………… 4.04 x 3.10 x Leverage Ratio…………………………………………………………………... 2.65 x 3.06 x Bank Covenants: Minimum Interest Coverage Ratio………………………………………………………………… 2.50 x 2.00 x Maximum Leverage Ratio………………………………………………………………………………… 4.00 x 5.00 x
Segment Highlights
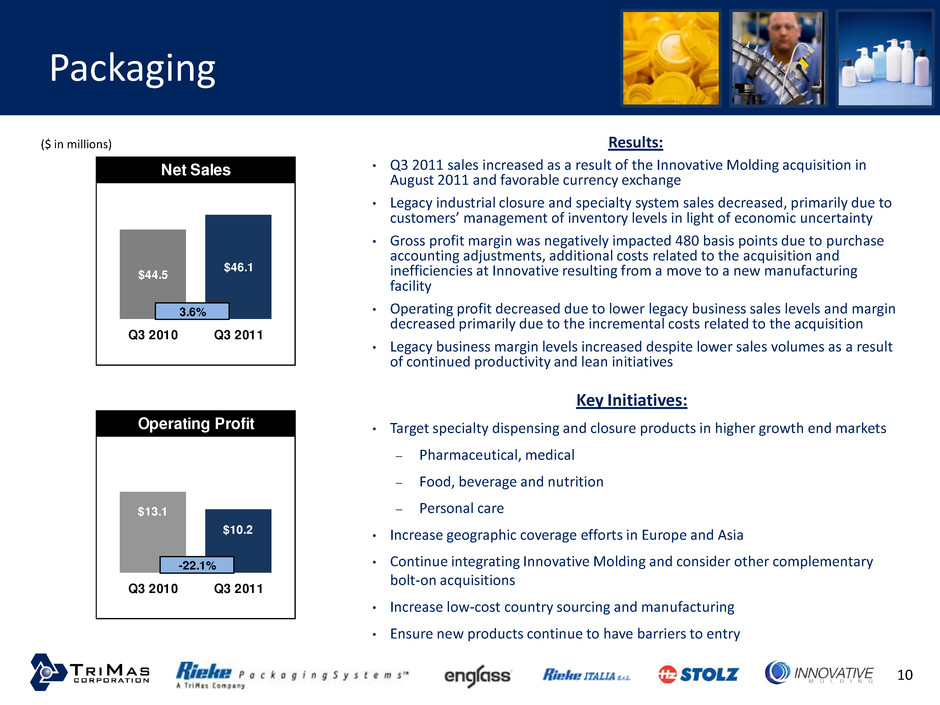
Packaging Results: • Q3 2011 sales increased as a result of the Innovative Molding acquisition in August 2011 and favorable currency exchange • Legacy industrial closure and specialty system sales decreased, primarily due to customers’ management of inventory levels in light of economic uncertainty • Gross profit margin was negatively impacted 480 basis points due to purchase accounting adjustments, additional costs related to the acquisition and inefficiencies at Innovative resulting from a move to a new manufacturing facility • Operating profit decreased due to lower legacy business sales levels and margin decreased primarily due to the incremental costs related to the acquisition • Legacy business margin levels increased despite lower sales volumes as a result of continued productivity and lean initiatives ($ in millions) Key Initiatives: • Target specialty dispensing and closure products in higher growth end markets – Pharmaceutical, medical – Food, beverage and nutrition – Personal care • Increase geographic coverage efforts in Europe and Asia • Continue integrating Innovative Molding and consider other complementary bolt-on acquisitions • Increase low-cost country sourcing and manufacturing • Ensure new products continue to have barriers to entry 10 Net Sales $44.5 $46.1 Q3 2010 Q3 2011 3.6% Operating Profit $13.1 $10.2 Q3 2010 Q3 2011 -22.1%
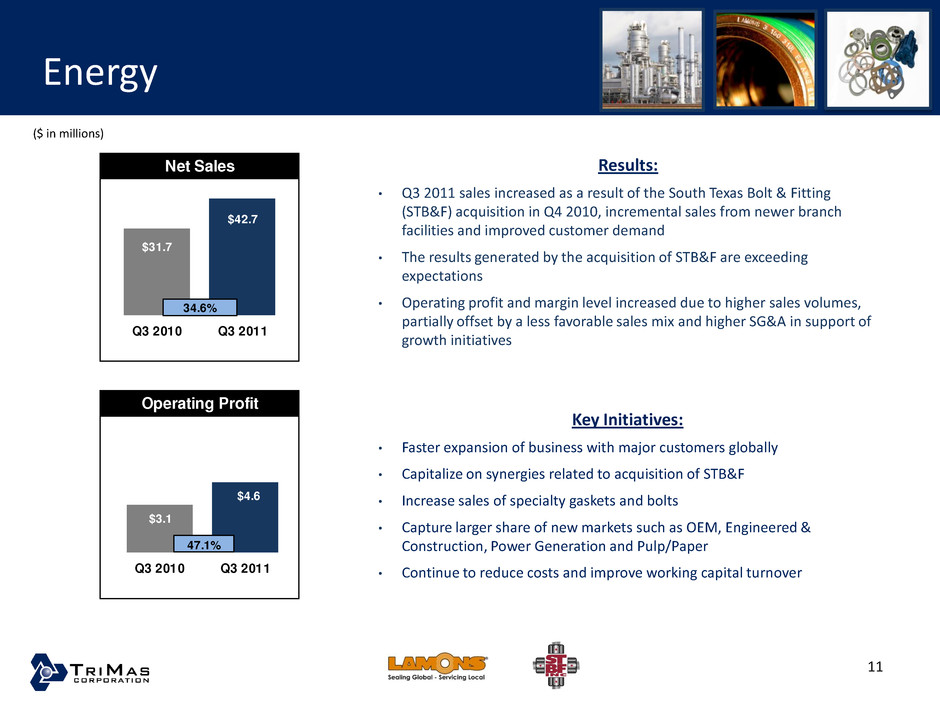
Energy ($ in millions) Results: • Q3 2011 sales increased as a result of the South Texas Bolt & Fitting (STB&F) acquisition in Q4 2010, incremental sales from newer branch facilities and improved customer demand • The results generated by the acquisition of STB&F are exceeding expectations • Operating profit and margin level increased due to higher sales volumes, partially offset by a less favorable sales mix and higher SG&A in support of growth initiatives Key Initiatives: • Faster expansion of business with major customers globally • Capitalize on synergies related to acquisition of STB&F • Increase sales of specialty gaskets and bolts • Capture larger share of new markets such as OEM, Engineered & Construction, Power Generation and Pulp/Paper • Continue to reduce costs and improve working capital turnover 11 Net Sales $31.7 $42.7 Q3 2010 Q3 2011 34.6% Operating Profit $3.1 $4.6 Q3 2010 Q3 2011 47.1%
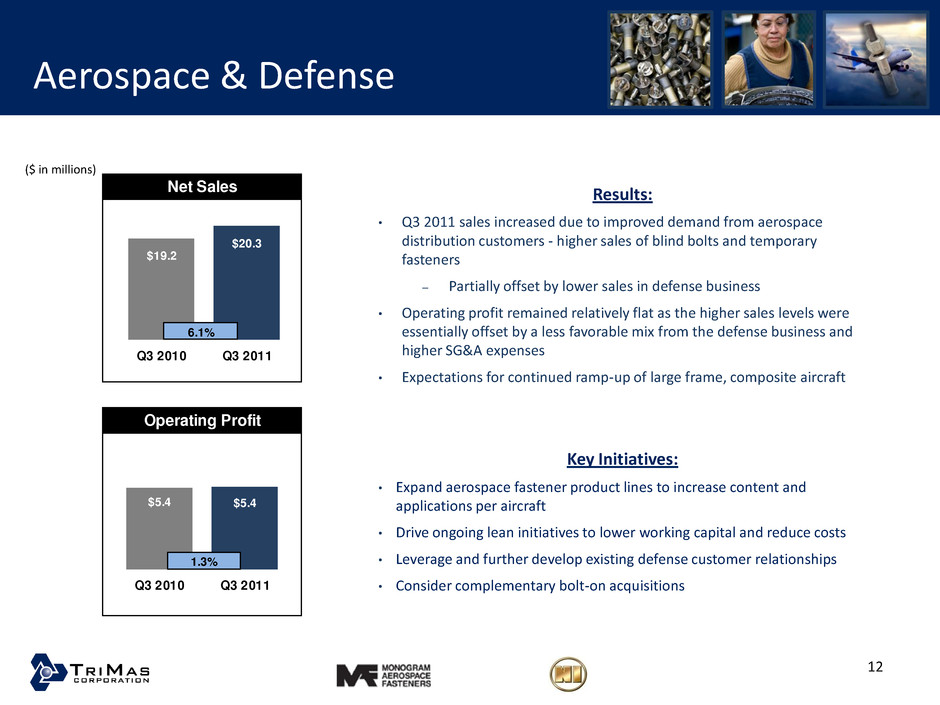
Aerospace & Defense Key Initiatives: • Expand aerospace fastener product lines to increase content and applications per aircraft • Drive ongoing lean initiatives to lower working capital and reduce costs • Leverage and further develop existing defense customer relationships • Consider complementary bolt-on acquisitions ($ in millions) Results: • Q3 2011 sales increased due to improved demand from aerospace distribution customers - higher sales of blind bolts and temporary fasteners ̶ Partially offset by lower sales in defense business • Operating profit remained relatively flat as the higher sales levels were essentially offset by a less favorable mix from the defense business and higher SG&A expenses • Expectations for continued ramp-up of large frame, composite aircraft 12 Net Sales $19.2 $20.3 Q3 2010 Q3 2011 6.1% Operating Profit $5.4 $5.4 Q3 2010 Q3 2011 1.3%
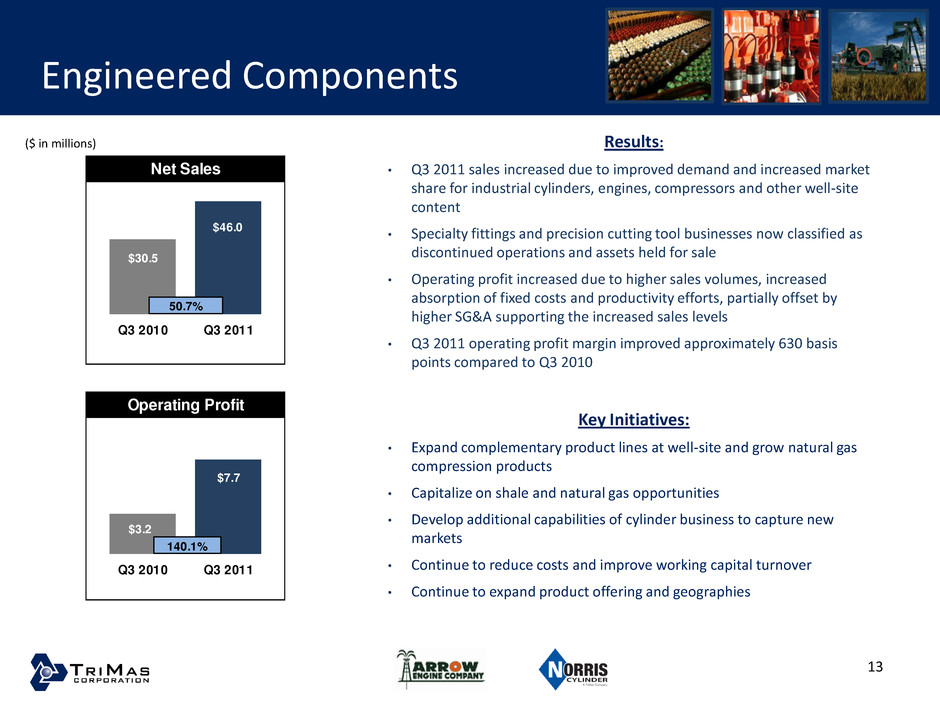
Engineered Components ($ in millions) Key Initiatives: • Expand complementary product lines at well-site and grow natural gas compression products • Capitalize on shale and natural gas opportunities • Develop additional capabilities of cylinder business to capture new markets • Continue to reduce costs and improve working capital turnover • Continue to expand product offering and geographies Results: • Q3 2011 sales increased due to improved demand and increased market share for industrial cylinders, engines, compressors and other well-site content • Specialty fittings and precision cutting tool businesses now classified as discontinued operations and assets held for sale • Operating profit increased due to higher sales volumes, increased absorption of fixed costs and productivity efforts, partially offset by higher SG&A supporting the increased sales levels • Q3 2011 operating profit margin improved approximately 630 basis points compared to Q3 2010 13 Net Sales $30.5 Q3 2010 Q3 2011 50.7% $46.0 Operating Profit $3.2 $7.7 Q3 2010 Q3 2011 140.1%
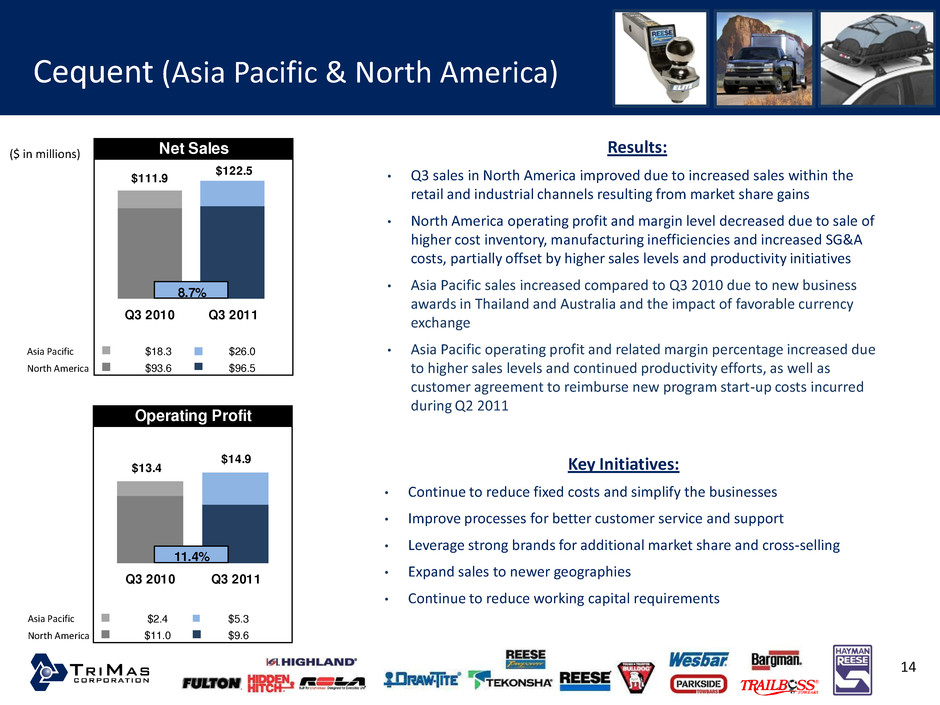
Cequent (Asia Pacific & North America) ($ in millions) $46.4 Results: • Q3 sales in North America improved due to increased sales within the retail and industrial channels resulting from market share gains • North America operating profit and margin level decreased due to sale of higher cost inventory, manufacturing inefficiencies and increased SG&A costs, partially offset by higher sales levels and productivity initiatives • Asia Pacific sales increased compared to Q3 2010 due to new business awards in Thailand and Australia and the impact of favorable currency exchange • Asia Pacific operating profit and related margin percentage increased due to higher sales levels and continued productivity efforts, as well as customer agreement to reimburse new program start-up costs incurred during Q2 2011 Key Initiatives: • Continue to reduce fixed costs and simplify the businesses • Improve processes for better customer service and support • Leverage strong brands for additional market share and cross-selling • Expand sales to newer geographies • Continue to reduce working capital requirements Asia Pacific North America 14 Asia Pacific North America $26.0 $96.5 Net Sales $18.3 $93.6 Q3 2010 Q3 2011 $111.9 $122.5 8.7% $5.3 $9.6 Operating Profit $2.4 $11.0 Q3 2010 Q3 2011 $14.9 11.4% $13.4
YTD 2011 Summary • Strong organic growth through market share gains, product innovation, geographic expansion and increased end market demand • Recent acquisitions ahead of schedule with enhanced synergies and growth • Improved operating leverage and capital structure • Successfully refinanced and amended debt – Strong capital position through 2016 • Working capital provides ongoing opportunity to increase efficiency • Continuous productivity initiatives fund investments in long-term growth Continue momentum to drive positive results. 15
Outlook and Summary
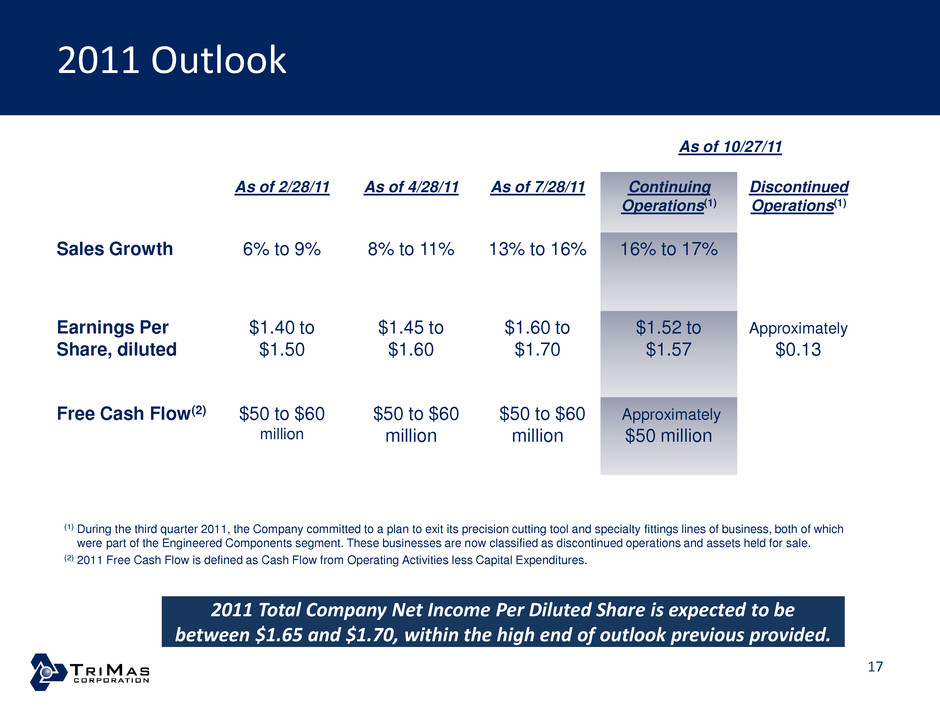
2011 Outlook As of 10/27/11 As of 2/28/11 As of 4/28/11 As of 7/28/11 Continuing Operations(1) Discontinued Operations(1) Sales Growth 6% to 9% 8% to 11% 13% to 16% 16% to 17% Earnings Per Share, diluted $1.40 to $1.50 $1.45 to $1.60 $1.60 to $1.70 $1.52 to $1.57 Approximately $0.13 Free Cash Flow(2) $50 to $60 million $50 to $60 million $50 to $60 million Approximately $50 million (1) During the third quarter 2011, the Company committed to a plan to exit its precision cutting tool and specialty fittings lines of business, both of which were part of the Engineered Components segment. These businesses are now classified as discontinued operations and assets held for sale. (2) 2011 Free Cash Flow is defined as Cash Flow from Operating Activities less Capital Expenditures. 2011 Total Company Net Income Per Diluted Share is expected to be between $1.65 and $1.70, within the high end of outlook previous provided. 17
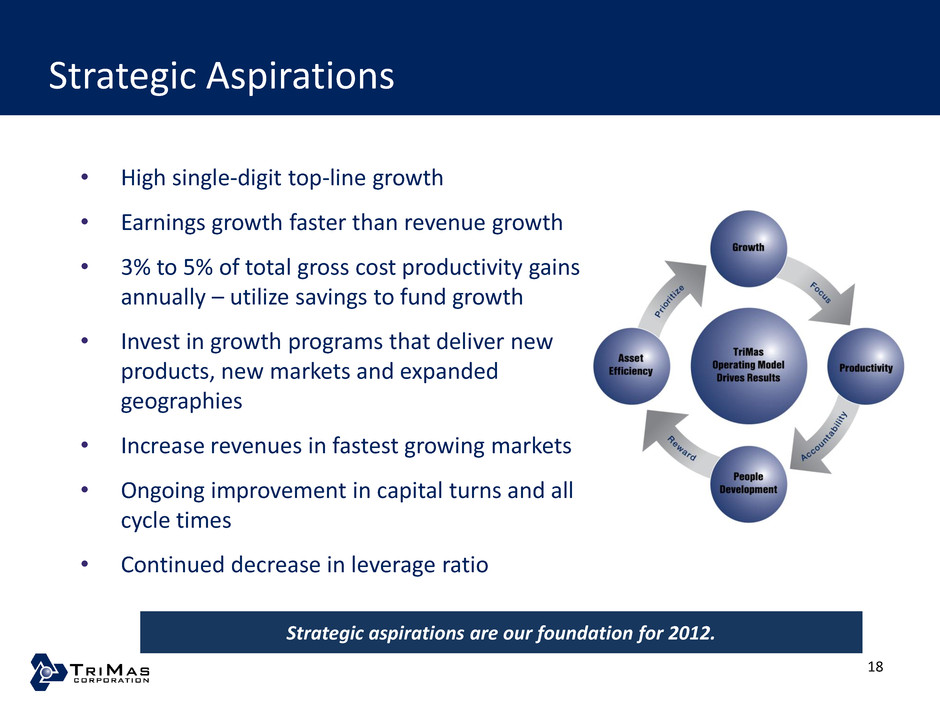
Strategic Aspirations • High single-digit top-line growth • Earnings growth faster than revenue growth • 3% to 5% of total gross cost productivity gains annually – utilize savings to fund growth • Invest in growth programs that deliver new products, new markets and expanded geographies • Increase revenues in fastest growing markets • Ongoing improvement in capital turns and all cycle times • Continued decrease in leverage ratio Strategic aspirations are our foundation for 2012. 18
Questions & Answers
Appendix
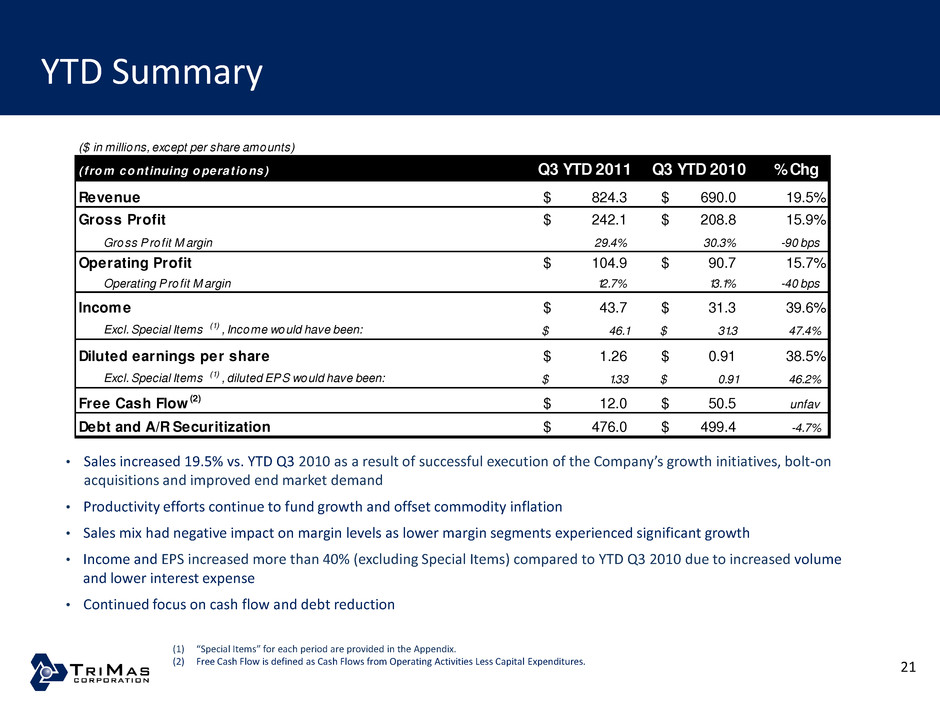
YTD Summary • Sales increased 19.5% vs. YTD Q3 2010 as a result of successful execution of the Company’s growth initiatives, bolt-on acquisitions and improved end market demand • Productivity efforts continue to fund growth and offset commodity inflation • Sales mix had negative impact on margin levels as lower margin segments experienced significant growth • Income and EPS increased more than 40% (excluding Special Items) compared to YTD Q3 2010 due to increased volume and lower interest expense • Continued focus on cash flow and debt reduction (1) “Special Items” for each period are provided in the Appendix. (2) Free Cash Flow is defined as Cash Flows from Operating Activities Less Capital Expenditures. 21 ($ in millions, except per share amounts) ( f ro m co ntinuing o perat io ns) Q3 YTD 2011 Q3 YTD 2010 % Chg Revenue 824.3$ 690.0$ 19.5% Gross Profit 242.1$ 208.8$ 15.9% Gross Profit M argin 29.4% 30.3% -90 bps Operating Profit 104.9$ 90.7$ 15.7% Operating Profit M argin 12.7% 13.1% -40 bps Income 43.7$ 31.3$ 39.6% Excl. Special Items (1) , Income would have been: 46.1$ 31.3$ 47.4% Diluted earnings per share 1.26$ 0.91$ 38.5% Excl. Special Items (1) , diluted EPS would have been: 1.33$ 0.91$ 46.2% Free Cash Flow (2) 12.0$ 50.5$ unfav Debt and A/R Securitization 476.0$ 499.4$ -4.7%
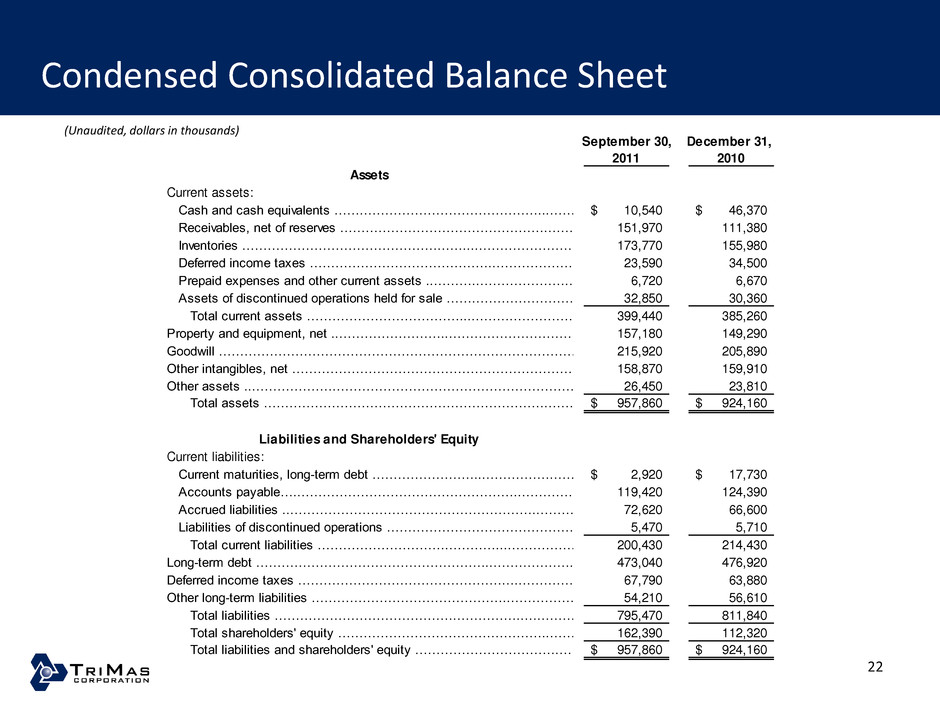
Condensed Consolidated Balance Sheet (Unaudited, dollars in thousands) 22 September 30, December 31, 2011 2010 Assets Current assets: Cash and cash equivalents …………………………………………...……………………………………….10,540$ 46,370$ Receivables, net of reserves ………………………………………………….………………………….. 151,970 111,380 Inventories .……………………………………………...……………………………………………………...173,770 155,980 Deferred income taxes …………………………………….……………………………………………………………………23,590 34,500 Prepaid expenses and other current assets ..……….………………….……………………………………………………6,720 6,670 Assets of discontinued operations held for sale ……………………………………….32,850 30,360 Total current assets ………………………………...……….……………………………………………….. 399,440 385,260 Property and equipment, net ..……………………..…………………………………………157,180 149,290 Goodwill …………………………………………………………………………………………………215,920 205,890 Other intangibles, net ……………………………………………………………………….158,870 159,910 Other assets ...………………………………………………………………………………..26,450 23,810 Total assets …………………………………………………………………………………..957,860$ 924,160$ Liabilities and Shareholders' Equity Current liabilities: Current maturities, long-term debt ……………………...………………………………………………..2,920$ 17,730$ Accounts payable….…………………………………………….……………………………..119,420 124,390 Accrued liabilities ..………………………………………………….……………………………….72,620 66,600 Liabilities of discontinued operations ………………………………………. 5,470 5,710 Total current liabilities ……………………………………...………………………………..200,430 214,430 Long-term d bt ………………………………………………..……………………………………473,040 476,920 Deferred income taxes ……………………………………………..…………………………….67,790 63,880 Other long-term liabilities ……………………………………….………………………………………54,210 56,610 Total liabilities …………………………………………………..…………………………………….795,470 811,840 Total shareholders' equity …………………………………………..………………….162,390 112,320 Total liabilities and shareholders' equity …………………………….……………………957,860$ 924,160$
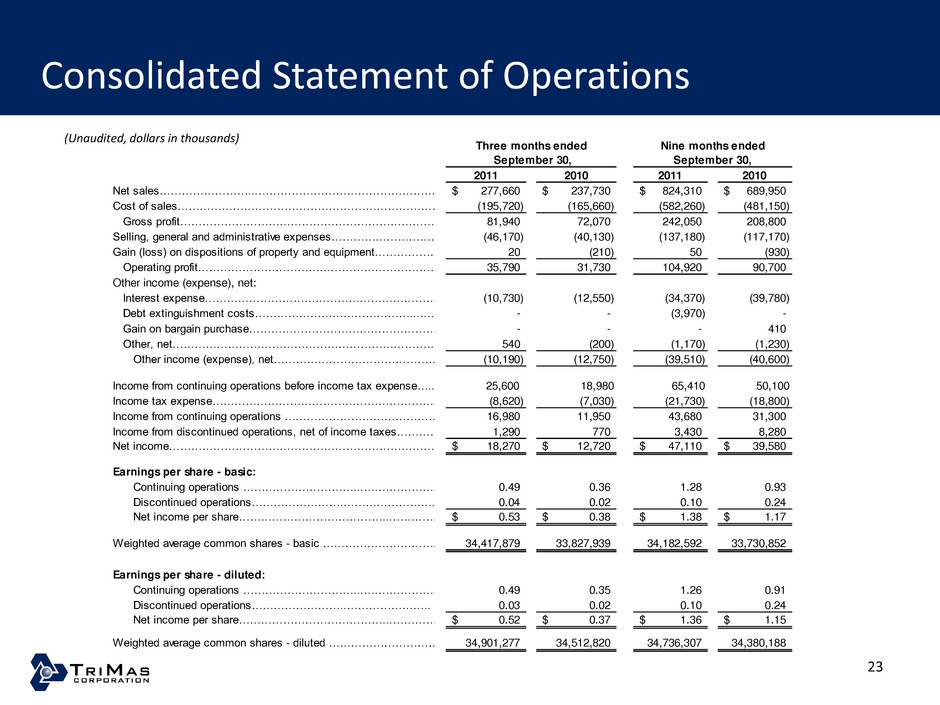
Consolidated Statement of Operations (Unaudited, dollars in thousands) 23 Nine months ended 2011 2010 2011 2010 Net sales……………………...………………………………………….…………………….. 277,660$ 237,730$ 824,310$ 689,950$ Cost of sales………………………………………………………………………………………………………… (195,720) (165,660) (582,260) (481,150) Gross profit……………………………………………………………………………. 81,940 72,070 242,050 208,800 Selling, general and administrative expenses………………………………………….... (46,170) (40,130) (137,180) (117,170) Gain (loss) on dispositions of property and equipment…………………….. 20 (210) 50 (930) Operating profit……………………………………………………………………………………………………………….…………………….. 35,790 31,730 104,920 90,700 Other income (expense), net: Interest expense…………………………………………………………..…………………………………………….…………………….. (10,730) (12,550) (34,370) (39,780) Debt extinguishment costs……………………………………...…. - - (3,970) - Gain on bargain purchase…………………………………………… - - - 410 Other, net……………………………………………………………………..…………………………………………………………………….…………………….. 540 (200) (1,170) (1,230) Other income (expense), net…………………………………………………………………..…………………………………………….…………………….. (10,190) (12,750) (39,510) (40,600) Income from continuing operations before income tax expense….. 25,600 18,980 65,410 50,100 Income tax expense……………………………………………………………………………………………………………….…………………….. (8,620) (7,030) (21,730) (18,800) Income from continuing operations …………………………………………………………………………………………………….…………………….. 16,980 11,950 43,680 31,300 Income from discontinued operations, net of income taxes…………. 1,290 770 3,430 8,280 Net income…………………………………………………………………………….…………………………………………….…………………….. 18,270$ 12,720$ 47,110$ 39,580$ Earnings per share - basic: Continuing operations …………………………...….…………………………………………………………………………….…………………….. 0.49 0.36 1.28 0.93 Discontinued operations…………………….……………………..……. 0.04 0.02 0.10 0.24 Net income per share…………………………………...…………. 0.53$ 0.38$ 1.38$ 1.17$ Weighted average common shares - basic …………………………...………………….….. 34,417,879 33,827,939 34,182,592 33,730,852 Earnings per share - diluted: Continuing operations …………………………...….……………………………… 0.49 0.35 1.26 0.91 Discontinued operations……………………..………………….. 0.03 0.02 0.10 0.24 Net income per share…………………………………...…………. 0.52$ 0.37$ 1.36$ 1.15$ Weighted average common shares - diluted …………………………...………………….….. 34,901,277 34,512,820 34,736,307 34,380,188 September 30, September 30, Three months ended
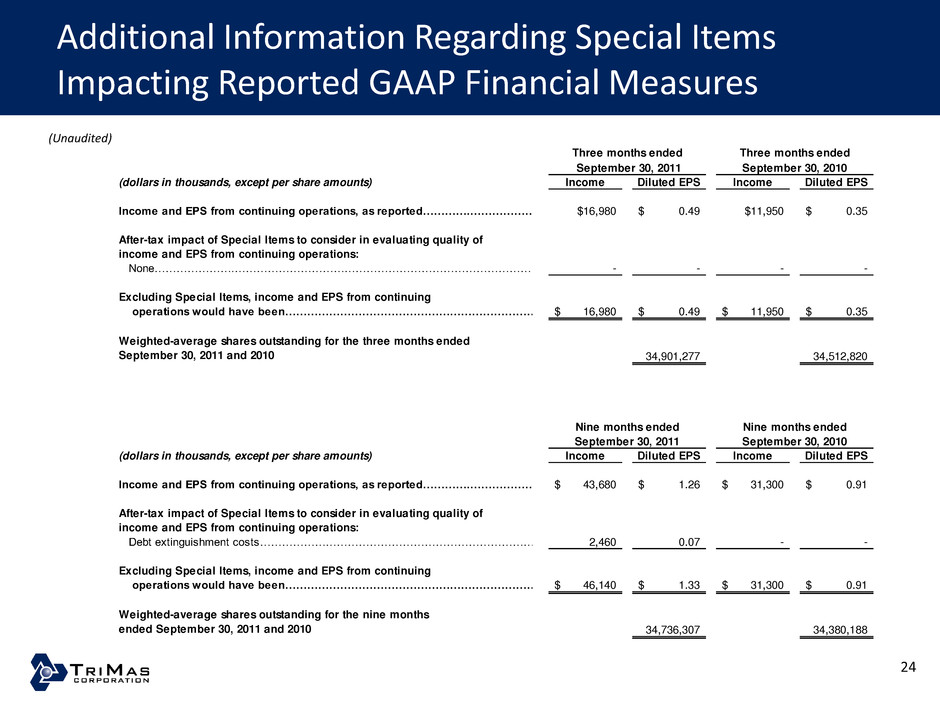
Additional Information Regarding Special Items Impacting Reported GAAP Financial Measures (Unaudited) 24 Three months ended Three months ended September 30, 2011 September 30, 2010 (dollars in thousands, except per share amounts) Income Diluted EPS Income Diluted EPS Income and EPS from continuing operations, as reported………….……………………………………………………$16,980 0.49$ $11,950 0.35$ After-tax impact of Special Items to consider in evaluating quality of income and EPS from continuing operations: None………………….………………………………………………………………………………………………. - - - - Excluding Special Items, income and EPS from continuing operations would have been…………………………………………………………………………………………………… 16,980$ 0.49$ 11,950$ 0.35$ Weighted-average shares outstanding for the three months ended September 30, 2011 and 2010 34,901,277 34,512,820 Nine months ended Nine months ended September 30, 2011 September 30, 2010 (dollars in thousands, except per share amounts) Income Diluted EPS Income Diluted EPS Income and EPS from continuing operations, as reported………….……………………………………43,680$ 1.26$ 31,300$ 0.91$ After-tax impact of Special Items to consider in evaluating quality of income and EPS from continuing operations: Debt extinguishment costs………………………………………………………………………………………………. 2,460 0.07 - - Excluding Special Items, income and EPS from continuing operations would have been…………………………………………………………………………………………………… 46,140$ 1.33$ 31,300$ 0.91$ Weighted-average shares outstanding for the nine months ended September 30, 2011 and 2010 34,736,307 34,380,188
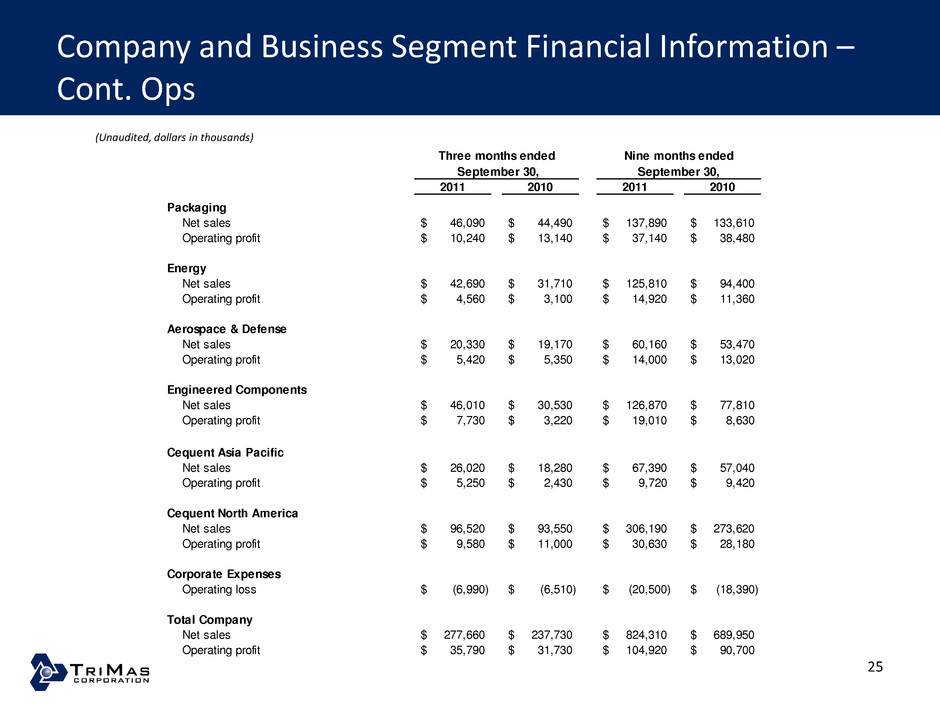
Company and Business Segment Financial Information – Cont. Ops (Unaudited, dollars in thousands) 25 Three months ended 2011 2010 2011 2010 Packaging Net sales 46,090$ 44,490$ 137,890$ 133,610$ Operating profit 10,240$ 13,140$ 37,140$ 38,480$ Energy Net sales 42,690$ 31,710$ 125,810$ 94,400$ Operating profit 4,560$ 3,100$ 14,920$ 11,360$ Aerospace & Defense Net sales 20,330$ 19,170$ 60,160$ 53,470$ Operating profit 5,420$ 5,350$ 14,000$ 13,020$ Engineered Components Net sales 46,010$ 30,530$ 126,870$ 77,810$ Operating profit 7,730$ 3,220$ 19,010$ 8,630$ Cequent Asia Pacific Net sales 26,020$ 18,280$ 67,390$ 57,040$ Operating profit 5,250$ 2,430$ 9,720$ 9,420$ Cequent North America Net sales 96,520$ 93,550$ 306,190$ 273,620$ Operating profit 9,580$ 11,000$ 30,630$ 28,180$ Corporate Expenses Operating loss (6,990)$ (6,510)$ (20,500)$ (18,390)$ Total Company Net sales 277,660$ 237,730$ 824,310$ 689,950$ Operating profit 35,790$ 31,730$ 104,920$ 90,700$ Nine months ended September 30, September 30,
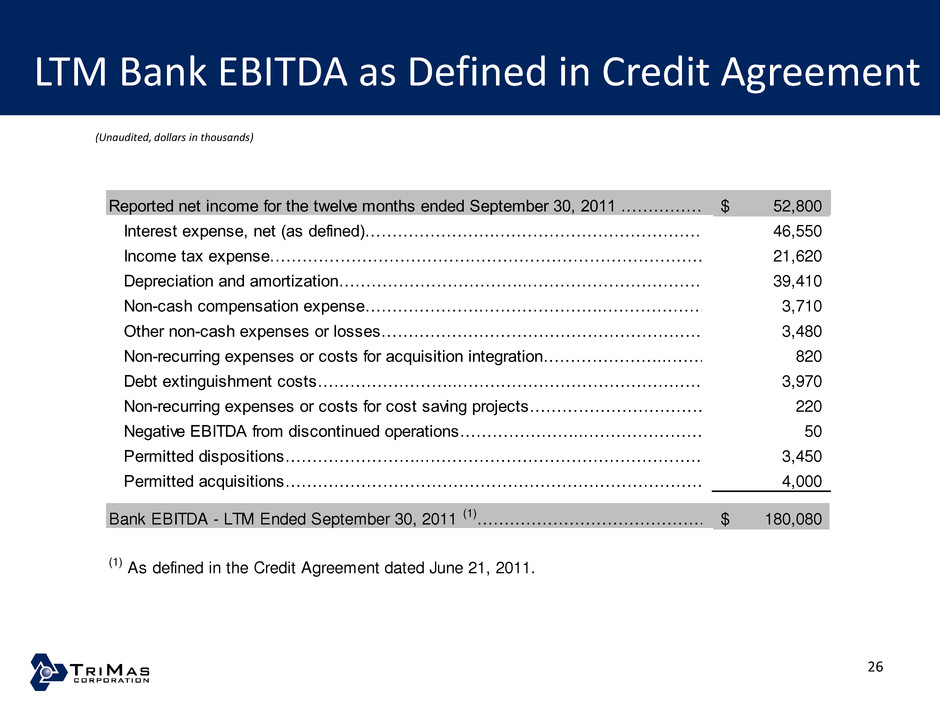
LTM Bank EBITDA as Defined in Credit Agreement 26 (Unaudited, dollars in thousands) Reported net income for the twelve months ended September 30, 2011 ……………………………………………………………….. 52,800$ Interest expense, net (as defined)…………………….………………………………………………………….. 46,550 Income tax expense.……………………………….…………………………………………………………. 21,620 Depreciation and amortization……………………………...…………………………………………………….. 39,410 Non-cash compensation expense………………….…………………..………………………………….. 3,710 Other non-cash expenses or losses………………………………………………………………………………….. 3,480 Non-recurring expenses or costs for acquisition integration…………………...…………………………………………………………… 820 Debt extinguishment costs……………………...………………………………………………………………… 3,970 Non-recurring expenses or costs for cost saving projects…………………………………………………………………. 220 Negative EBITDA from discontinued operations…………………...…………………………………………………………………….. 50 Permitted dispositions……………………...…………………………………………………………………3,450 Permitted acquisitions………………………………………………………………………………… 4,000 Ba k EBITDA - LTM Ended September 30, 2011 (1)…………………………………………………………………………………………… 180,080$ (1) As defined in the Credit Agreement dated June 21, 2011.
