Attached files
| file | filename |
|---|---|
| EX-12 - EXHIBIT 12 - TRIMAS CORP | a2196991zex-12.htm |
| EX-4.6 - EXHIBIT 4.6 - TRIMAS CORP | a2196991zex-4_6.htm |
| EX-21.1 - EXHIBIT 21.1 - TRIMAS CORP | a2196991zex-21_1.htm |
| EX-23.1 - EXHIBIT 23.1 - TRIMAS CORP | a2196991zex-23_1.htm |
| EX-31.1 - EXHIBIT 31.1 - TRIMAS CORP | a2196991zex-31_1.htm |
| EX-10.47 - EXHIBIT 10.47 - TRIMAS CORP | a2196991zex-10_47.htm |
| EX-10.56 - EXHIBIT 10.56 - TRIMAS CORP | a2196991zex-10_56.htm |
| EX-10.57 - EXHIBIT 10.57 - TRIMAS CORP | a2196991zex-10_57.htm |
| EX-10.48 - EXHIBIT 10.48 - TRIMAS CORP | a2196991zex-10_48.htm |
| EX-10.58 - EXHIBIT 10.58 - TRIMAS CORP | a2196991zex-10_58.htm |
| EX-31.2 - EXHIBIT 31.2 - TRIMAS CORP | a2196991zex-31_2.htm |
| EX-32.2 - EXHIBIT 32.2 - TRIMAS CORP | a2196991zex-32_2.htm |
| EX-32.1 - EXHIBIT 32.1 - TRIMAS CORP | a2196991zex-32_1.htm |
UNITED STATES
SECURITIES AND EXCHANGE COMMISSION
Washington D.C. 20549
Form 10-K
| (Mark One) | ||
ý |
ANNUAL REPORT PURSUANT TO SECTION 13 OR 15(d) OF THE SECURITIES EXCHANGE ACT OF 1934 |
|
For the fiscal year ended December 31, 2009. |
||
Or |
||
o |
TRANSITION REPORT PURSUANT TO SECTION 13 or 15(d) OF THE SECURITIES EXCHANGE ACT OF 1934 |
|
For the transition period from to |
||
Commission file number 001-10716
TRIMAS CORPORATION
(Exact Name of Registrant as Specified in Its Charter)
| Delaware (State or Other Jurisdiction of Incorporation or Organization) |
38-2687639 (IRS Employer Identification No.) |
39400 Woodward Avenue, Suite 130
Bloomfield Hills, Michigan 48304
(Address of Principal Executive Offices, Including Zip Code)
(248) 631-5450
(Registrant's telephone number, including area code)
Securities registered pursuant to Section 12(b) of the Act:
| Title of Each Class: | Name of Each Exchange on Which Registered: | |
|---|---|---|
| Common stock, $0.01 par value | NASDAQ |
Securities registered pursuant to Section 12(g) of the Act: None
Indicate by check mark if the registrant is a well-known seasoned issuer, as defined in Rule 405 of the Securities Act. Yes o No ý
Indicate by check mark if the registrant is not required to file reports pursuant to Section 13 and Section 15(d) of the Act. Yes o No ý
Indicate by check mark whether the Registrant (1) has filed all reports required to be filed by Section 13 or 15(d) of the Securities Exchange Act of 1934 during the preceding 12 months (or for such shorter period that the Registrant was required to file such reports), and (2) has been subject to such filing requirements for the past 90 days. Yes ý No o
Indicate by check mark whether the registrant has submitted electronically and posted on its corporate Web site, if any, every Interactive Data File required to be submitted and posted pursuant to Rule 405 of Regulation S-T (§ 232.405 of this chapter) during the preceding 12 months (or for such shorter period that the registrant was required to submit and post such files). Yes o No o
Indicate by check mark if disclosure of delinquent filers pursuant to Item 405 of Regulation S-K is not contained herein, and will not be contained, to the best of Registrant's knowledge, in definitive proxy or information statements incorporated by reference in Part III of this Form 10-K or any amendment to this Form 10-K. ý
Indicate by check mark whether the Registrant is a large accelerated filer, an accelerated filer, a non-accelerated filer or a smaller reporting company. See definition of "accelerated filer," "large accelerated filer," and "smaller reporting company" in Rule 12b-2 of the Exchange Act.
| Large Accelerated Filer o | Accelerated Filer ý | Non-accelerated Filer o (Do not check if a smaller reporting company) |
Smaller Reporting Company o |
Indicate by check mark whether the registrant is a shell company (as defined in Rule 12b-2 of the Act). Yes o No ý
The aggregate market value of the voting common equity held by non-affiliates of the Registrant as of June 30, 2009 was approximately $59.7 million, based upon the closing sales price of the Registrant's common stock, $0.01 par value, reported for such date on the New York Stock Exchange. For purposes of this calculation only, directors, executive officers and the principal controlling shareholder or entities controlled by such controlling shareholder are deemed to be affiliates of the Registrant.
As of March 4, 2010, the number of outstanding shares of the Registrant's common stock, $.01 par value, was 33,977,319 shares.
Portions of the Registrant's Proxy Statement for the 2010 Annual Meeting of Stockholders are incorporated herein by reference in Part III of this Annual Report on Form 10-K to the extent stated herein.
2
This report contains forward-looking statements (as that term is defined by the federal securities laws) about our financial condition, results of operations and business. You can find many of these statements by looking for words such as "may," "will," "expect," "anticipate," "believe," "estimate" and similar words used in this report.
These forward-looking statements are subject to numerous assumptions, risks and uncertainties. Because the statements are subject to risks and uncertainties, actual results may differ materially from those expressed or implied by the forward-looking statements. We caution readers not to place undue reliance on the statements, which speak only as of the date of this report.
The cautionary statements set forth above should be considered in connection with any subsequent written or oral forward-looking statements that we or persons acting on our behalf may issue. We do not undertake any obligation to review or confirm analysts' expectations or estimates or to release publicly any revisions to any forward-looking statement to reflect events or circumstances after the date of this report or to reflect the occurrence of unanticipated events.
We disclose important factors that could cause our actual results to differ materially from our expectations under Item 1A, "Risk Factors," and Item 7, "Management's Discussion and Analysis of Financial Condition and Results of Operations" and elsewhere in this report. These cautionary statements qualify all forward-looking statements attributed to us or persons acting on our behalf. When we indicate that an event, condition or circumstance could or would have an adverse effect on us, we mean to include effects upon our business, financial and other condition, results of operations, prospects and ability to service our debt.
3
We are a global manufacturer and distributor of products for commercial, industrial and consumer markets. Most of our businesses share important characteristics, including leading market shares, strong brand names, broad product offerings, established distribution networks, relatively high operating margins, relatively low capital investment requirements, product growth opportunities and strategic acquisition opportunities. We believe that a majority of our 2009 net sales were in markets in which our products enjoy the number one or number two market position within their respective product categories. In addition, we believe that in many of our businesses, we are one of only a few manufacturers in the geographic markets where we currently compete.
Our Business Segments
Effective April 1, 2009, we realigned our reportable segments as a result of our recent management reporting and business consolidation changes. We previously reported under the following five segments: Packaging Systems, Energy Products, Industrial Specialties, RV & Trailer Products and Recreational Accessories. Following the realignment, we are principally engaged in five reportable segments: Packaging, Energy, Aerospace & Defense, Engineered Components and Cequent. Our business segments had net sales and operating profit for the year ended December 31, 2009 as follows: Packaging (net sales: $145.1 million; operating profit: $33.1 million), Energy (net sales: $148.9 million; operating profit: $12.8 million), Aerospace & Defense (net sales: $74.4 million; operating profit: $21.8 million), Engineered Components (net sales: $62.3 million; operating profit: $3.0 million), and Cequent (net sales: $373.0 million; operating profit: $4.8 million).
In addition to our business segments as presented, we have discontinued certain lines of businesses over the past three years as follows, the results of which are presented as discontinued operations for all periods presented in the financial statements attached hereto:
- •
- During the fourth quarter of 2009, we discontinued our medical device manufacturing line of business, which was previously
included within our Engineering Components segment.
- •
- During the fourth quarter of 2008, we entered into a binding agreement to sell certain assets within our specialty
laminates, jacketings and insulation tapes line of business, which was previously included within our Packaging segment. We concluded the sale of these assets in February 2009.
- •
- In the fourth quarter of 2007, we reached a decision to sell the N.I. Industries rocket launcher and property management businesses within our Aerospace & Defense segment. We sold the rocket launcher business in December 2007. The property management line of business has not yet been sold, but continues to be actively marketed for sale.
Each segment has distinctive products, distribution channels, strengths and strategies, which are described below.
Packaging
We believe Packaging is a leading designer, manufacturer and distributor of specialty, highly engineered closure and dispensing systems for a range of end markets, including steel and plastic industrial and consumer packaging applications. We believe that Packaging is one of the largest manufacturers of steel and plastic industrial container closures and dispensing products in North America and also has a significant presence in Europe and other international markets. Packaging manufactures high performance, value-added products that are designed to enhance its customers' ability to store, ship, process and dispense various products in the industrial, agricultural, consumer, food, personal care and
4
pharmaceutical markets. Packaging's products include steel and plastic closure caps, drum enclosures, rings and levers, and dispensing systems, such as pumps and specialty sprayers.
Our Packaging brands, which include Rieke®, Englass®, Rieke® Italia and Stolz® are well established and recognized in their respective markets.
- •
- Rieke®, located in Auburn, Indiana, designs and manufactures traditional industrial closures and dispensing
products in North America and Asia. We believe Rieke® has significant market share for many of its key products, such as steel drum enclosures, plastic drum closures and plastic pail
dispensers and plugs.
- •
- Englass®, located in the United Kingdom, focuses on pharmaceutical and personal care dispensers sold primarily
in Europe, but its product and engineering "know-how" is applicable to the consumer dispensing market in North America and other regions, which provides continuing significant
opportunities for growth.
- •
- Rieke® Italia, located in Italy, specializes in ring and lever closures that are used in the European
industrial market. This specialty closure system is also sold into the North American Free Trade Agreement ("NAFTA") markets.
- •
- We believe that Rieke® Germany, which designs, manufactures and distributes products under our Stolz® brand, is a European leader in plastic enclosures for sub-20 liter sized containers used in automotive and chemical applications.
Competitive Strengths
We believe Packaging benefits from the following competitive strengths:
- •
- Strong Product Innovation. We believe that Packaging's
research and development capability and new product focus is a competitive advantage. For more than 85 years, Packaging's product development programs have provided innovative and proprietary
product solutions, such as the Visegrip® steel flange and plug closure, the Poly-Visegrip™ plastic closure and the all-plastic, environmentally safe,
self-venting FlexSpout® flexible pouring spout. Packaging's emphasis upon highly engineered packaging solutions and research and development has yielded numerous issued and
enforceable patents, with many other patent applications pending.
- •
- Customized Solutions that Enhance Customer Loyalty and
Relationships. A significant portion of Packaging's products are customized for end-users. Packaging provides extensive
in-house design and development technical staff to provide solutions to customer requirements for closures and dispensing applications. For example, the installation in customer drum and
pail plants of customized, patent protected, Rieke®-designed insertion equipment and tools that are specially designed for use on Rieke® manufactured closures and dispensers
creates substantial switching costs. As a result, and because the equipment is located inside customers' plants, we are able to support favorable pricing and generate a high degree of customer
loyalty. Rieke® has also been successful in promoting the sale of complementary products in an effort to create preferred supplier status.
- •
- Leading Market Positions and Global Presence. We believe that Packaging is a leading designer and manufacturer of plastic closure caps, drum enclosures, rings and levers and dispensing systems, such as pumps and specialty sprayers. Packaging maintains a global presence, reflecting its global opportunities and customer base. The majority of Rieke®'s manufacturing facilities around the world have technologically advanced injection molding machines required to manufacture industrial container closures and specialty dispensing and packaging products, as well as automated, high-speed assembly equipment for multiple component products.
5
Strategies
We believe Packaging has significant opportunities to grow, including:
- •
- New Product Applications. Rieke® has focused
its research and development capabilities on North American consumer applications requiring special packaging forms, and stylized containers and dispenser applications requiring a high degree of
functionality and engineering. We believe that Rieke® Germany, which designs, manufactures and distributes products under our Stolz® brand, is a European leader in plastic
enclosures for sub-20 liter sized containers used in automotive and chemical applications. In 2009, we introduced the DuraTouch® product line of small pump sprayers. These
pumps emit volumes from 100-700 mcl per stroke and are used in personal care, cosmetics and pharmaceutical markets. During calendar year 2008, we introduced two major new dispensing
products into various markets: an airless dispensing system for dosing hygienic solutions such as lotions, creams and gels, and an airless high viscosity dispensing system ("HVDS").
- •
- Product Cross-Selling Opportunities. Recently,
Rieke® began to cross-market successful European products, such as rings and levers, to a similar end-user customer base in the North American market utilizing its direct sales
force. We believe that, as compared with its competitors, Rieke® is able to offer a wider variety of products to its long-term North American customers at better pricing and
with enhanced service and tooling support. Many of these customers have entered into supply agreements with Rieke® on these broader product offerings.
- •
- Increased International Presence. Packaging has increased its international manufacturing and sales presence, adding a manufacturing facility in China and increasing capabilities at its locations in Europe. By maintaining a presence in certain foreign locations, Rieke® hopes to continue to discover new markets and new applications in international markets and to capitalize on lower-cost production opportunities.
Marketing, Customers and Distribution
Packaging employs an internal sales force in the NAFTA and European regions, and uses third-party agents and distributors in key geographic markets, including Europe, South America and Asia. Rieke®'s agents and distributors primarily sell directly to container manufacturers and to users or fillers of containers. While the point of sale may be to a container manufacturer, Rieke®, via a "pull through" strategy, calls on the container user or filler and suggests that it specify that a Rieke® product be used on its container.
To support its "pull-through" strategy, Rieke® offers more attractive pricing on products purchased directly from Rieke® and products where the container users or fillers specify Rieke®. Users or fillers that use or specify Rieke®'s products include industrial chemical, agricultural chemical, petroleum, paint, personal care, pharmaceutical and sanitary supply chemical companies such as BASF, Bayer, Dupont, General Electric, ICI Paints, Lucas Oil, Sherwin-Williams, and PPG, among others.
Packaging's primary customers include Berlin Packaging, Boots, Diversey, Ecolab, Lyons Magnus, Pepsi, Pharmacia, Schering Plough, and Wings Foods as well as major container manufacturers around the world. Packaging maintains a customer service center that provides technical support as well as other technical assistance to customers to reduce overall production costs.
Competition
Since Rieke® has a broad range of products in both closures and dispensing products, there are competitors in each of our product offerings. We do not believe that there is a single competitor that matches our entire product offering.
6
In the industrial steel closure product line, our competitors within the NAFTA market include Greif Closure Systems and Technocraft. In the industrial plastic 55-gallon drum closure line, our primary competitor is Greif Closure Systems. In the 5-gallon container closure market, our primary competitors are Greif Closure Systems, Bericap and APC. Our primary competitors in the ring and lever product line are Self Industries and Technocraft. In the dispensing product lines, our major competitors are Calmar, Aptar, Airspray and Indesco.
In the European market, our industrial steel closure product lines compete with Greif Closure Systems and Technocraft. The industrial plastic 55-gallon drum closure lines compete with Greif Closure Systems and Mauser. The Rieke® 5-gallon container closure products compete with those of Greif Closure Systems and Bericap. Rieke®'s ring and lever products compete with those of Berger and Technocraft. Rieke®'s dispensing products compete with those of Jaycare, Calmar, WIKO and Airspray.
Energy
We believe Energy is a leading designer, manufacturer and distributor of a variety of natural gas engines, compressors, gas production equipment and chemical pumps engineered at well sites for the oil and gas industry as well as metallic and non-metallic industrial sealant products and fasteners for the petroleum refining, petrochemical and other industrial markets. Our companies and brands which comprise this segment include Lamons® Gasket and Arrow® Engine.
Lamons® manufactures and distributes metallic and nonmetallic industrial gaskets and complementary fasteners for refining, petrochemical and other industrial applications principally in the U.S. and Canada. Lamons® supplies gaskets and complementary fasteners for both industrial original equipment manufacturers and maintenance repair operations.
Arrow® Engine manufactures specialty engines, compressors, gas production equipment, chemical pumps and engine replacement parts for use in oil and natural gas production and other industrial and commercial markets. Arrow® Engine distributes its products through a worldwide distribution network with a particularly strong presence in the U.S. and Canada.
Competitive Strengths
We believe Energy benefits from the following competitive strengths:
- •
- Leading Market Positions and Strong Brand Names. We
believe Lamons® is the largest gasket supplier to the domestic petroleum industry, while Arrow® Engine owns the original equipment manufacturing rights to distribute engines
and replacement parts for four main engine lines and offers a full range of replacement parts for an additional seven engine lines, which are widely used in the energy industry and other industrial
applications.
- •
- Broad Product Portfolio. Arrow® Engine
currently offers a broad range of products within the oil and gas industry and industrial and commercial markets, focusing on new product development and expanding complementary product offerings to
these existing markets, while simultaneously expanding into new energy markets through its distributors. Recent examples of new products include the introduction of a new line of compressors and gas
production equipment with complementary meter run capability. In these and other instances, Arrow® Engine expects the expansion of their product offerings to existing customers to fuel
future growth and provide content per well site.
- •
- Established and Extensive Distribution Channels. Our Lamons® business utilizes an established hub-and-spoke distribution system whereby our primary manufacturing facility supplies product to our highly knowledgeable network of worldwide distributors, which are located in close proximity to our primary customers. This established network comprised of both Company-owned and third-party distributors allows us to add new customers in various locations or to increase distribution to
7
existing customers with relatively small increases in incremental costs. Our experienced in-house sales support team works with our network of distributors to create a strong market presence in all aspects of the oil and gas and petrochemical refining industries.
Strategies
We believe Energy has significant opportunities to grow, including:
- •
- Strong Product Innovation. Energy has a history of
successfully creating and introducing new products. Arrow® Engine has recently developed a new line of products in the area of industrial engine spare parts for various industrial engines,
including selected engines manufactured by Caterpillar, Waukesha, Ajax and Gemini. The company has also launched an offering of customizable compressors and gas production and meter run equipment,
which are used by existing end customers in the natural gas extraction market, as well as development of a natural gas compressor ("CNG") used for CNG filling stations.
- •
- Entry into New Markets and Development of New
Customers. Energy has significant opportunities to grow its businesses by offering its products to new customers and new markets.
Lamons® is presently targeting both additional industries (pulp and paper, power plants, mining) and international expansion, and plans further penetration in Europe, Asia and North and
South America. Arrow® Engine continues to focus on expanding market share in the North America Free Trade region and growing its international presence in markets for oilfield pumping and
gas compression engines and related products.
- •
- Pursue Lower-Cost Manufacturing and Sourcing Initiatives. As the businesses in Energy expand and develop, we believe that there will be further opportunities to reduce their cost structures through ongoing manufacturing, overhead and administrative productivity initiatives, global sourcing and selectively shifting manufacturing capabilities to countries with lower costs. Lamons® and Arrow® Engine each have advanced domestic manufacturing facilities and sourcing capabilities, most notably in China and India.
Marketing, Customers and Distribution
Given the focused nature of many of our products, Energy relies upon a combination of direct sales forces and established networks of independent distributors with familiarity of the end users. The narrow end-user base of many of these products makes it possible for Energy to respond to customer-specific engineered applications and provide a high degree of customer service. Gasket sales are made directly from the factory to major customers through Lamons'® sales and service facilities in major regional markets, or through a large network of independent distributors. Lamons'® overseas sales are either through our new sales and service facilities in China and the Netherlands, Lamons'® licensees or through its many distributors. Arrow® Engine markets product through a network of distributors, many with strong ties to larger energy companies that offer a wide range of products and services in the global oil and gas industry. In many of the markets this segment serves, its companies' brand names are virtually synonymous with product applications. Significant Energy customers include BPAmoco, C.E. Franklin, Chevron, Dow, ExxonMobil, McJunkin Corporation, National Oilwell, Shearer, Weatherford Artificial Lift and Wilson Supply.
Competition
Energy's primary competitors include Garlock (EnPro), Leader GT and Flexitallic/Siem in gaskets, CAT and Cummins in engines and engine replacement parts, and Texsteam and Williams Pumps in the chemical pump line. Approximately 60% of the products of Energy's companies are highly-engineered, non-commodity, customer-specific products and most have large shares of small markets supplied by a limited number of competitors. In a significant number of areas, value-added design, finishing,
8
warehousing, packaging, distribution and after-sales service have generated strong customer loyalty. This supplements lower cost manufacturing and relevant industry experience in promoting each of our business' competitiveness.
Aerospace & Defense
We believe Aerospace & Defense is a leading designer, manufacturer of a diverse range of products for use in focused markets within the aerospace and defense markets. This segment's products include aerospace fasteners and military munitions components to serve aircraft and weapons platforms. In general, these products are highly-engineered, customer-specific items that are sold into focused markets with few competitors.
Aerospace & Defense's brands include Monogram™ Aerospace Fasteners which is well established and recognized in its market.
- •
- Monogram™ Aerospace
Fasteners. We believe Monogram™ Aerospace Fasteners ("Monogram™") is a leading manufacturer of permanent blind bolt and temporary fasteners used in
commercial, business and military aircraft construction and assembly. Certain of Monogram™'s products contain patent protection, with additional patents pending. We believe
Monogram™ is a leader in the development of blind bolt fastener technology for the aerospace industry. Its Visu-Lok®, Visu-Lok®II and
Radial-Lok® blind bolts allow sections of aircraft to be joined together when access is limited to only one side of the airframe, providing certain cost efficiencies over
conventional two piece fastening devices. Monogram™'s Composi-Lok®, Composi-Lok®II and Ti-OSI® blind bolts are
designed to solve unique fastening problems associated with the assembly of composite aircraft structures, and are therefore particularly well suited to take advantage of the increasing use of
composite materials in aircraft construction.
- •
- NI Industries™. NI Industries™ has utilized proprietary know-how to manufacture a variety of munitions components, large diameter shell casings, for the U.S. government. We believe NI Industries™ is a leading manufacturer in its product markets, due to its unique technical capabilities in the entire metal-forming process from the acquisition of raw material to the design and fabrication of the final product. The Riverbank Army Ammunition Plant ("Riverbank") California facility of NI Industries™ was included on the 2005 Base Realignment and Closure ("BRAC"). NI Industries™ completed production at this facility in 2009 and is working with military and government personnel to relocate the manufacturing capability from Riverbank to the Rock Island Arsenal in Illinois. NI Industries™ may have the opportunity to operate the Rock Island facility once the relocation is complete, subject to the U.S. government's request and approval. While NI currently has limited production due to the relocation of its primary facility, NI is currently marketing the manufacturing capabilities of other select TriMas entities to its government customers, as well as developing plans to expand its product portfolio.
Strategies
We believe the businesses within the Aerospace & Defense segment have significant opportunities to grow, based on the following:
- •
- Strong Product Innovation. The Aerospace & Defense segment has a history of successfully creating and introducing new products and there are currently several significant product initiatives underway. Monogram™ has developed the next generation Composi-Lok® offering a flush break upon installation, and is testing an enlarged foot-print version of the Composi-Lok® offering improved clamping force on composite structures. The company is also working on the next generation of temporary fastener which is targeted to have load clamping capabilities in the range of a permanent fastener. We believe the strategy of offering a variety of custom engineered variants
9
- •
- Entry into New Markets and Development of New
Customers. The Aerospace & Defense segment has significant opportunities to grow its businesses by offering its products to new
customers and new markets.
- •
- Expand Product Line Offerings. Monogram™ is expanding its aerospace fastener product lines to include new bolts, screws and collars and is rapidly increasing its applications and content on planes. NI Industries™ continues to investigate additional platforms that it can manufacture in support of the U.S. military's missions in Iraq and Afghanistan.
has been very well received by Monogram™'s customer base and is increasing our share of custom-engineered purchases.
Marketing, Customers and Distribution
Aerospace & Defenses' customers operate primarily in the aerospace and defense industries. Given the focused nature of many of our products, the Aerospace & Defense segment relies upon a combination of direct sales forces and established networks of independent distributors with familiarity of the end-users. For example, Monogram™'s aerospace fasteners are sold through internal sales personnel and independent sales representatives. Although the overall market for fasteners and metallurgical services is highly competitive, these businesses provide products and services primarily for specialized markets, and compete principally as technology, quality and service-oriented suppliers in their respective markets. Monogram™'s products are sold to manufacturers and distributors within the commercial, business and military aerospace industry, both domestic and foreign. Monogram™ works directly with aircraft manufacturers to develop and test new products and improve existing products. This close working relationship is a necessity given the critical safety nature and regulatory environment of its customers' products. The narrow end-user base of many of these products makes it possible for this segment to respond to customer-specific engineered applications and provide a high degree of customer service. Aerospace & Defenses' OEM and aftermarket customers include Airbus, Boeing, Peerless and Wesco.
Competition
This segment's primary competitors include Cherry (PCC) and Fairchild Fasteners (Alcoa) in aerospace fasteners and General Dynamics and Medico Industries in defense products. We believe that Monogram™ is a leader in the blind bolt market with significant market share in all blind fastener product categories in which they compete. Aerospace & Defenses' companies supply highly engineered, non-commodity, customer-specific products that principally have large shares of small markets supplied by a limited number of competitors.
Engineered Components
We believe Engineered Components is a leading designer, manufacturer and distributor of high-pressure and low-pressure cylinders for the transportation, storage and dispensing of compressed gases, specialty fittings for the automotive industry, precision cutting instruments for the medical industry, and specialty precision tools such as center drills, cutters, end mills and countersinks for the industrial metal-working market. In general, these products are highly-engineered, customer-specific items that are sold into focused markets with few competitors.
Engineered Components' brands, including Hi-Vol™ Products, Norris Cylinder™, KEO® Cutters, Richards Micro-Tool™ and Cutting Edge TechnologiesTM are well established and recognized in their respective markets.
- •
- Hi-Vol™ Products. We believe Hi-Vol™ Products ("Hi-Vol™") is a market leading supplier of tube nuts and engineered precision machined components to the automotive and industrial markets of North America. Hi-Vol™ recently launched a line of fuel system components for a next generation gasoline direct injection engine. Hi-Vol™'s market leading position is attributable to its long standing reputation for quality and innovation in the area of cold-forming hollow components.
10
- •
- Norris Cylinder™. Norris Cylinder™ is one of the
few manufacturers in North America that provides a complete line of large and intermediate size, high-pressure and low-pressure steel cylinders for the transportation, storage
and dispensing of compressed gases. Norris Cylinder™'s large high-pressure seamless compressed gas cylinders are used principally for shipping, storing and dispensing oxygen,
nitrogen, argon, helium and other gases for industrial and health-care markets. In addition, Norris Cylinder™ offers a complete line of low-pressure steel cylinders
used to contain and dispense acetylene gas for the welding and cutting industries. Norris Cylinder™ markets cylinders primarily to major industrial gas producers and distributors, welding
equipment distributors and buying groups as well as equipment manufacturers.
- •
- Precision Tool Company™. Precision Tool Company™ produces a variety of specialty precision tools such as combined drills and countersinks, NC spotting drills, key seat cutters, end mills and countersinks. Markets served by these products include the industrial, aerospace, automotive and medical equipment industries. We believe Precision Tool Company™'s Keo® brand is the market share leader in the industrial combined drill and countersink markets, while Richards Micro-Tool™ and Cutting Edge TechnologiesTM are leading suppliers of miniature end mills to the tool-making industry. Richards Micro-Tool™ has also been successful in supplying the growing medical device market with bone drills, cranial surgery tools and dental reamers.
Strategies
We believe the businesses within the Engineered Components segment have significant opportunities to grow, based on the following:
- •
- Strong Product Innovation. The Engineered Components
segment has a history of successfully creating and introducing new products and there are currently several significant product initiatives underway. Norris Cylinder™ developed a process
for manufacturing ISO cylinders capable of holding higher pressure gases, and has been awarded a U.N. certification for its ISO cylinders, making Norris the first manufacturer approved to distribute
ISO cylinders internationally. Norris Cylinder™ also is creating new designs for use in Hydrogen Fuel Cell applications related to Clean Energy programs. Precision Tool
Company™ is developing new products for use in the medical instrumentation market. In recent periods, Hi-Vol™ has had success expanding its product offerings, and
has been awarded a contract to produce a line of cold formed and machined fuel system components.
- •
- Entry into New Markets and Development of New Customers. The Engineered Components segment has significant opportunities to grow its businesses by offering its products to new customers and new markets and new geographies. Norris Cylinder™ is expanding international sales of its ISO cylinders to Europe, South Africa and South America. Hi-Vol™ has recently ramped up production on a contract with a transplant tier 2 supplier for a line of fuel system components that represents a significant expansion from the traditional product line and customers served by this company. Precision Tool Company™ continues to expand its offerings and capabilities in the market for medical and dental equipment tools.
Marketing, Customers and Distribution
Engineered Components' customers operate primarily in the industrial, commercial, automotive and medical equipment industries. Given the focused nature of many of our products, the Engineered Components segment relies upon a combination of direct sales forces and established networks of independent distributors with familiarity of the end-users. For example, Hi-Vol™'s automotive fasteners are sold through internal sales personnel and independent sales representatives. Although the overall market for fasteners and metallurgical services is highly competitive, these businesses provide products and services primarily for specialized markets, and compete principally as quality and service-oriented suppliers
11
in their respective markets. Hi-Vol™ sells its products to distributors and manufacturers in automotive markets. In many of the markets this segment serves, its companies' brand names are virtually synonymous with product applications. The narrow end-user base of many of these products makes it possible for this segment to respond to customer-specific engineered applications and provide a high degree of customer service. Engineered Components' OEM and aftermarket customers include Aigras, Air Liquide, Air Products, Cooper-Standard Automotive, Grainger, Honeywell, Martinrea, McMaster Carr, Medtronic, MSC Industrial, Praxair, TI Automotive and Worthington Cylinders.
Competition
This segment's primary competitors include H&L (Chicago Rivet) and Nagano in tube nuts and fittings. Other competitors include Taylor Wharton and Worthington in cylinders; and M.A. Ford, Niagara, Whitney Tool and Magafor in precision tools. Engineered Components' companies supply highly engineered, non-commodity, customer-specific products and most have large shares of small markets supplied by a limited number of competitors.
Cequent
We believe Cequent is a leading designer, manufacturer and distributor of a wide variety of high quality, custom-engineered towing and trailer products including vehicle specific wiring and hitch applications, heavy duty towing products, lighting, jacks, couplers and cargo management. These products were designed to support all Original Equipment Manufacturers and aftermarket customers within the automotive, recreational vehicle, agricultural, utility, military, marine and industrial vehicle and trailer markets. We believe that Cequent's brand names and product lines are among the most recognized and extensive in the industry.
Cequent has positioned its product portfolio to create pricing options for entry-level through premium across all of our market channels. We believe that no other competitor features a comparable array of components and brand names.
Our primary product categories are offered through a number of channels as described below;
- •
- The Fulton® and Bulldog® brands include trailer products and accessories, such as jacks, winches,
couplers and fenders. These brands are sold through independent installers, trailer OEMs, military and distributor channels serving the marine, agricultural, industrial and horse/livestock market
sectors.
- •
- The Tekonsha® brand is the most recognized name in brake controls and related brake components with market
leading technology to assure safe towing. These products are sold through automotive, recreational vehicle and agricultural distributors and OEMs.
- •
- The Bargman® and Wesbar® brands are recognized names for recreational vehicle and marine lighting,
respectively. Bargman® branded products include interior and exterior recreational vehicle lighting and accessories, while Wesbar® branded products include submersible and
utility trailer lighting. These brands and products are sold through independent installers, trailer and recreational vehicle OEMs and wholesale distributors, and marine retail specialty
stores.
- •
- The Hayman-Reese™ brand of towing products has strong brand awareness in the Australian marketplace where it
is well established at both the wholesale and retail levels of the aftermarket. Products include tow bars, electrical connectivity, brake controls, cargo management and accessories.
- •
- The Draw-Tite®, Reese® and Hidden Hitch® brands represent towing products and accessories, such as hitches, weight distribution systems, fifth wheel hitches, ball mounts, draw bars, gooseneck hitches, brake controls, wiring harnesses and T-connectors and are sold to independent installers
12
- •
- Highland and ROLA® brands anchor our presence in the cargo management category. Products include bike racks,
cargo carriers, luggage boxes, tie-downs and soft travel interior organizers which are sold through hitch installers, independent bike dealers, wholesale distributors, retail and mass
merchandising channels.
- •
- Pro Series™ & Tow Ready™ brands offer Cequent the ability to meet the need for entry-level towing products without reducing the value of our premium brands and their position within the market. The brands include products such as hitches, weight distribution systems, fifth wheel hitches, ball mounts, draw bars, cargo management, wiring harnesses and T-connectors. These products complement the premium brands in all the markets we serve.
and distributor channels for automotive, truck and recreational vehicles. Similar towing accessory products are sold through the retail and mass merchandising channel under the Reese Towpower™ brand name.
Competitive Strengths
- •
- Diverse Portfolio. Cequent benefits from a diverse range
of product offerings and does not solely rely upon any single item. By offering a wide range of products, Cequent is able to provide a complete solution to satisfy its customers' towing and cargo
management needs.
- •
- Value Engineering. Cequent has extensive engineering and
performance capability, enabling this segment to continue its product innovation, improve product reliability and reduce manufacturing costs. The businesses within this segment conduct extensive
testing of their products in an effort to assure high quality and reliable product performance. Engineering, product design and fatigue testing are performed utilizing computer aided design and finite
element analysis.
- •
- Established Distribution Channels. Cequent utilizes
several distribution channels for its sales, including OEM trailer manufacturers, OEM vehicle manufacturers, wholesale distribution, dealers, installers, specialty retailers, internet resellers and
mass merchants. Cequent is positioned to meet all delivery requirements specified by our diverse group of customers.
- •
- Flexibility in Supply. As a result of significant restructuring activity completed over the last few years, Cequent has reduced its cost structure and improved its supply flexibility, allowing for quicker and more efficient responses to changes in the end market demand. We have the ability to produce low-volume, customized products in-house, quickly and efficiently at manufacturing facilities in both the U.S. and Mexico. We outsource high-volume production to lower cost supply partners in Southeast Asia. Extensive sourcing arrangements with suppliers in low-cost environments enable the flexibility to choose to manufacture or source products as end-market demand fluctuates.
Strategies
We believe that Cequent has opportunities to grow, including the following:
- •
- Enhanced Towing Solutions. As a result of its broad
product portfolio, Cequent is well positioned to provide customers with solutions for trailering, towing and cargo management needs. Due to this segment's product breadth and depth, Cequent believes
it can provide customers with compelling value propositions with superior features and convenience. In many instances, Cequent can offer more competitive pricing by providing complete sets of product
rather than underlying components separately. We believe this merchandising strategy also enhances the segment's ability to better compete in markets where its competitors have narrower product lines
and are unable to provide "one stop shopping" to customers.
- •
- Cross-Selling Products. We believe that Cequent has significant opportunities to further introduce products into new channels of distribution that traditionally concentrated in other products or
13
- •
- International Expansion. Cequent has a strong business
presence in Australia with its Hayman-Reese™ brand which was further enhanced with the acquisition of Parkside Towbars in 2008, providing a greater penetration into Western Australia. In
addition, we have introduced products into the local market in Thailand after launching our local plant there.
- •
- Strong Product Innovation. Cequent has a history of successfully developing and launching new products. Newer introductions include F-2 aluminum jack and RV landing gear, brake controls (P3), custom harnesses, LED lighting and electrical accessories, a plug and play brake controller, and a heavy duty towing weight distribution with sway control unit. In addition, it is continually refreshing its existing retail products with new designs and features and innovative packaging and merchandising.
product lines. Cequent has also developed strategies to introduce its products into new channels, including the Asian automotive manufacturer "port of entry" market, the retail sporting goods market, the independent bike dealer, the ATV and motorcycle market, the military and within select international markets.
Marketing, Customers and Distribution
Cequent employs a dedicated sales force in each of the primary channels, including automotive aftermarket, automotive OEM, industrial, power sports, recreational vehicle installers, and retail including: mass merchants, auto specialty, marine specialty, hardware/home centers, and catalogs. Cequent relies upon strong historical relationships, significant brand heritage and its broad product offerings to bolster its towing, trailer and accessory product sales through the OEM channel and in various aftermarket segments. Cequent is well represented in retail stores through mass merchants like Wal-Mart, hardware home centers such as Lowe's and Home Depot, and specialty auto retailers which include Pep Boys, AutoZone, Advanced Auto and CSK Auto.
Competition
The competitive environment for towing products is highly fragmented and is characterized by numerous smaller suppliers, even the largest of which tends to focus in narrow product categories. Significant trailer competitors include Pacific Rim, Dutton-Lainson, Shelby, Ultra-Fab, Sea-Sense and Atwood. Significant electrical competitors include Hayes Brake Control Company, Hopkins Manufacturing, Peterson Industries, Grote, Optronics and Pollack. Significance towing competitors include Curt Manufacturing, Valley Towing Products, B&W, Buyers and Camco. The retail channel presents a different set of competitors that are typically not seen in our installer and distributor channels, including Masterlock, Buyers, Allied, Keeper, Bell and Axius. Cequent faces competition in the cargo management product category primarily from Thule and Yakima.
Acquisition Strategy
We believe that our businesses have significant opportunities to grow through disciplined, strategic acquisitions. We typically seek "bolt-on" acquisitions, in which we would acquire another industry participant or product line within our industries and to enhance the strengths of our core businesses. When seeking acquisition targets, we are looking for opportunities to supplement our existing product lines, gain access to additional distribution channels, expand our geographic footprint and achieve scale and cost efficiencies.
Materials and Supply Arrangements
Our largest raw materials purchases are for steel, copper, aluminum, polyethylene and other resins, and energy. Raw materials and other supplies used in our operations are normally available from a variety
14
of competing suppliers. In addition to raw materials, we purchase a variety of components and finished products from low-cost sources in China, Taiwan and India.
Steel is purchased primarily from steel mills and service centers with pricing contracts principally in the three to six month time frame. Changing global dynamics for steel production and supply will continue to present a challenge to our business. Polyethylene is generally a commodity resin with multiple suppliers capable of providing product. While both steel and polyethylene are readily available from a variety of competing suppliers, our business has experienced, and we believe will continue to experience, volatility in the costs of these raw materials
Employees and Labor Relations
As of December 31, 2009, we employed approximately 3,900 people, of which approximately 27% were unionized and approximately 48% were located outside the U.S. We currently have collective bargaining agreements covering eight facilities worldwide for our continuing operations, five of which are in the U.S. In the fourth quarter of 2009, we concluded negotiations on two union collective bargaining agreements in our Cequent segment that were set to expire. Negotiations were concluded prior to the expiration dates of the collective bargaining agreements without work stoppages or strikes. There have been six contracts renegotiated in 2009 without any strikes, work stoppages or slowdowns. Employee relations have generally been satisfactory.
Seasonality and Backlog
There is some seasonality in our Cequent segment. Sales of towing and trailer products within these business segments are generally stronger in the second and third quarters as trailer OEMs, distributors and retailers acquire product for the spring and summer selling seasons. No other operating segment experiences significant seasonal fluctuation in its business. We do not consider sales order backlog to be a material factor in our business.
Environmental Matters
Our operations are subject to federal, state, local and foreign laws and regulations pertaining to pollution and protection of the environment, health and safety, governing among other things, emissions to air, discharge to waters and the generation, handling, storage, treatment and disposal of waste and other materials, and remediation of contaminated sites. We have been named as a potentially responsible party under CERCLA, the federal Superfund law, or similar state laws at several sites requiring clean-up related to the disposal of wastes we generate. These laws generally impose liability for costs to investigate and remediate contamination without regard to fault and under certain circumstances liability may be joint and several resulting in one responsible party being held responsible for the entire obligation. Liability may also include damages to natural resources. We have entered into consent decrees relating to two sites in California along with the many other co-defendants in these matters. We have incurred substantial expenses for these sites over a number of years, a portion of which has been covered by insurance. In addition to the foregoing, our businesses have incurred and likely will continue to incur expenses to investigate and clean up existing and former company-owned or leased property, including those properties made the subject of sale-leaseback transactions for which we have provided environmental indemnities to the lessors.
At our currently owned property located in Vernon, California, we expect to incur expenses to investigate the environmental conditions associated with historical operations of N.I. Industries and/or its tenants. Preliminary site assessment information indicates that further investigation will be necessary in order to determine whether remediation or controls will be required beyond those that had been previously approved by the governing regulatory authority, and if so, to develop an estimate of the likely costs thereof.
15
In 1992, Rieke® Packaging Systems and numerous other companies entered into a consent decree with the United States Environmental Protection Agency ("EPA") and the State of Indiana under which Rieke® and the other companies agreed to remediate contaminated soil and groundwater at the Wayne Reclamation and Recycling Site near Columbia City, Indiana. Contractors for the group of companies completed construction of the remediation systems required by the consent decree in 1995, and have operated them since then under the oversight of the EPA and the State of Indiana. The remediation systems have successfully removed substantial amounts of contaminants from the soil and the groundwater; however, some contaminants remain at concentrations above the performance standards set by the consent decree, and are still being removed. Consultants to the group of companies expect that some or all of the remediation systems will be required to operate indefinitely. A 2004 report by the EPA concluded that operation of the existing systems is "protective of human health and the environment." The agreement among the companies provides that Rieke®'s share is approximately 9% of total remediation costs for the site.
U.S. regulations pertaining to climate change continue to evolve in both the U.S. and internationally. We do not anticipate any impact that would be unique to our operations.
We believe that our business, operations and facilities are being operated in compliance in all material respects with applicable environmental and health and safety laws and regulations, many of which provide for substantial fines and criminal sanctions for violations. Based on information presently known to us and accrued environmental reserves, we do not expect environmental costs or contingencies to have a material adverse effect on us. The operation of manufacturing plants entails risks in these areas, however, and we may incur material costs or liabilities in the future that could adversely affect us. Potentially material expenditures could be required in the future. For example, we may be required to comply with evolving environmental and health and safety laws, regulations or requirements that may be adopted or imposed in the future or to address newly discovered information or conditions that require a response.
Intangibles and Other Assets
Our identified intangible assets, consisting of customer relationships, trademarks and trade names and technology, are recorded at approximately $164.1 million at December 31, 2009, net of accumulated amortization. The valuation of each of the identified intangibles was performed using broadly accepted valuation methodologies and techniques.
Customer Relationships. We have developed and maintained stable, long-term selling relationships with customer groups for specific branded products and/or focused market product offerings within each of our operating group segments. Useful lives assigned to customer relationship intangibles range from 5 to 25 years and have been estimated using historic customer retention and turnover data. Other factors considered in evaluating estimated useful lives include the diverse nature of focused markets and products of which we have significant share, how customers in these markets make purchases and these customers' position in the supply chain. We also monitor and evaluate the impact of other evolving risks including the threat of lower cost competitors and evolving technology.
Trademarks and Trade Names. Each of our operating groups designs and manufactures products for focused markets under various trade names and trademarks including Draw-Tite®, Reese®, Hidden Hitch®, Bulldog®, Tekonsha®, Highland "The Pro's Brand"®, Fulton®, Wesbar®, Visu-Lok®, ViseGrip® and FlexSpout®, among others. Our trademark/trade name intangibles are well-established and considered long-lived assets that require maintenance through advertising and promotion expenditures. Because it is our practice and intent to maintain and to continue to support, develop and market these trademarks/trade names for the foreseeable future, we consider our rights in these trademarks/trade names to have an indefinite life, except as otherwise dictated by applicable law.
16
Technology. We hold a number of U.S. and foreign patents, patent applications, and unpatented or proprietary product and process oriented technologies within all five of our operating segments. We have, and will continue to dedicate, technical resources toward the further development of our products and processes in order to maintain our competitive position in the transportation, industrial and commercial markets that we serve. Estimated useful lives for our technology intangibles range from one to thirty years and are determined in part by any legal, regulatory or contractual provisions that limit useful life. For example, patent rights have a maximum limit of twenty years in the U.S. Other factors considered include the expected use of the technology by the operating groups, the expected useful life of the product and/or product programs to which the technology relates, and the rate of technology adoption by the industry.
Quarterly, or as conditions may warrant, we assess whether the value of our identified intangibles has been impaired. Factors considered in performing this assessment include current operating results, business prospects, customer retention, market trends, potential product obsolescence, competitor activities and other economic factors. We continue to invest in maintaining customer relationships, trademarks and trade names, and the design, development and testing of proprietary technologies that we believe will set our products apart from those of our competitors.
International Operations
Approximately 17.7% of our net sales for the year ended December 31, 2009 were derived from sales by our subsidiaries located outside of the U.S., and we may significantly expand our international operations through organic growth actions and acquisitions. In addition, approximately 20.2% of our operating net assets as of December 31, 2009 were located outside of the U.S. We operate manufacturing facilities in Australia, Thailand, Canada, China, the United Kingdom (U.K.), Italy, Germany, Netherlands and Mexico. For information pertaining to the net sales and operating net assets attributed to our international operations, refer to Note 19, "Segment Information," to the audited financial statements included herein.
Sales outside of the U.S., particularly sales to emerging markets, are subject to various risks that are not present in sales within U.S. markets, including governmental embargoes or foreign trade restrictions such as antidumping duties, changes in U.S. and foreign governmental regulations, tariffs and other trade barriers, the potential for nationalization of enterprises, foreign exchange risk and other political, economic and social instability. In addition, there are tax inefficiencies in repatriating portions of our cash flow from non-U.S. subsidiaries.
17
You should carefully consider each of the risks described below, together with information included elsewhere in this Annual Report on Form 10-K and other documents we file with the SEC. The risks and uncertainties described below are those that we have identified as material, but are not the only risks and uncertainties facing us. Additional risks and uncertainties not currently known to us or that we currently believe are immaterial may also impact our business operations, financial results and liquidity.
We have a history of net losses.
We incurred net losses of $0.2 million, $136.2 million and $158.4 million for the years ended December 31, 2009, 2008 and 2007, respectively. The losses in 2008 and 2007 principally resulted from pre-tax, non-cash goodwill and indefinite-lived impairment charges of $166.6 million and $171.2 million, respectively, included in continuing operations. The losses in 2009 and 2008 were also impacted by losses from discontinued operations of $13.0 million and $12.1 million, respectively. In addition, interest expense associated with our highly leveraged capital structure, non-cash expenses such as depreciation and amortization of intangible assets and other asset impairments also contributed to our net losses. We may continue to experience net losses in the future.
Our businesses depend upon general economic conditions and we serve some customers in highly cyclical industries; as such we are subject to the loss of sales and margins due to an economic downturn or recession.
Our financial performance depends, in large part, on conditions in the markets that we serve in both the U.S. and global economies. Some of the industries that we serve are highly cyclical, such as the automotive, construction, industrial equipment, energy, aerospace and electrical equipment industries. We may experience a reduction in sales and margins as a result of a downturn in economic conditions or other macroeconomic factors. Lower demand for our products may also negatively affect the capacity utilization of our production facilities, which may further reduce our operating margins.
Many of the markets we serve are highly competitive, which could limit the volume of products that we sell and reduce our operating margins.
Many of our products are sold in competitive markets. We believe that the principal points of competition in our markets are product quality and price, design and engineering capabilities, product development, conformity to customer specifications, reliability and timeliness of delivery, customer service and effectiveness of distribution. Maintaining and improving our competitive position will require continued investment by us in manufacturing, engineering, quality standards, marketing, customer service and support of our distribution networks. We may have insufficient resources in the future to continue to make such investments and, even if we make such investments, we may not be able to maintain or improve our competitive position. We also face the risk of lower-cost foreign manufacturers located in China, Southeast Asia and other regions competing in the markets for our products and we may be driven as a consequence of this competition to increase our investment overseas. Making overseas investments can be highly complicated and we may not always realize the advantages we anticipate from any such investments. Competitive pressure may limit the volume of products that we sell and reduce our operating margins.
Increases in our raw material or energy costs or the loss of critical suppliers could adversely affect our profitability and other financial results.
We are sensitive to price movements in our raw materials supply base. Our largest material purchases are for steel, copper, aluminum, polyethylene and other resins and energy. Prices for these products fluctuate with market conditions and we have experienced sporadic increases recently. We may be unable to completely offset the impact with price increases on a timely basis due to outstanding commitments to our customers, competitive considerations or our customers' resistance to accepting such price increases
18
and our financial performance may be adversely impacted by further price increases. A failure by our suppliers to continue to supply us with certain raw materials or component parts on commercially reasonable terms, or at all, could have a material adverse effect on us. To the extent there are energy supply disruptions or material fluctuations in energy costs, our margins could be materially adversely impacted.
We may be unable to successfully implement our business strategies. Our ability to realize our business strategies may be limited.
Our businesses operate in relatively mature industries and it may be difficult to successfully pursue our growth strategies and realize material benefits therefrom. Even if we are successful, other risks attendant to our businesses and the economy generally may substantially or entirely eliminate the benefits. While we have successfully utilized some of these strategies in the past, our growth has principally come through acquisitions.
Our products are typically highly engineered or customer-driven and we are subject to risks associated with changing technology and manufacturing techniques that could place us at a competitive disadvantage.
We believe that our customers rigorously evaluate their suppliers on the basis of product quality, price competitiveness, technical expertise and development capability, new product innovation, reliability and timeliness of delivery, product design capability, manufacturing expertise, operational flexibility, customer service and overall management. Our success depends on our ability to continue to meet our customers' changing expectations with respect to these criteria. We anticipate that we will remain committed to product research and development, advanced manufacturing techniques and service to remain competitive, which entails significant costs. We may be unable to address technological advances, implement new and more cost-effective manufacturing techniques, or introduce new or improved products, whether in existing or new markets, so as to maintain our businesses' competitive positions or to grow our businesses as desired.
We depend on the services of key individuals and relationships, the loss of which could materially harm us.
Our success will depend, in part, on the efforts of our senior management, including our chief executive officer. Our future success will also depend on, among other factors, our ability to attract and retain other qualified personnel. The loss of the services of any of our key employees or the failure to attract or retain employees could have a material adverse effect on us.
We have substantial debt and interest payment requirements that may restrict our future operations and impair our ability to meet our obligations.
We continue to have indebtedness that is substantial in relation to our shareholders' equity. As of December 31, 2009, we have approximately $514.6 million of outstanding debt and approximately $62.0 million of shareholders' equity. Approximately 14% of our debt bears interest at variable rates and we may experience material increases in our interest expense as a result of increases in interest rate levels generally. Our debt service payment obligations in 2009 were approximately $46.2 million and, based on amounts outstanding as of December 31, 2009. Our degree of leverage and level of interest expense may have important consequences, including:
- •
- our leverage may place us at a competitive disadvantage as compared with our less leveraged competitors and make us more
vulnerable in the event of a downturn in general economic conditions or in any of our businesses;
- •
- our flexibility in planning for, or reacting to, changes in our business and the industry in which we operate may be limited;
19
- •
- our ability to obtain additional financing in the future for working capital, capital expenditures, acquisitions, business
development efforts, general corporate or other purposes may be impaired;
- •
- a substantial portion of our cash flow from operations will be dedicated to the payment of interest and principal on our
indebtedness, thereby reducing the funds available to us for other purposes, including our operations, capital expenditures, future business opportunities or obligations to pay rent in respect of our
operating leases; and
- •
- our operations are restricted by our debt instruments, which contain material financial and operating covenants, and those restrictions may limit, among other things, our ability to borrow money in the future for working capital, capital expenditures, acquisitions, rent expense or other purposes.
Our ability to service our debt and other obligations will depend on our future operating performance, which will be affected by prevailing economic conditions and financial, business and other factors, many of which are beyond our control. Our business may not generate sufficient cash flow, and future financings may not be available to provide sufficient net proceeds, to meet these obligations or to successfully execute our business strategies. See "Management's Discussion and Analysis of Financial Condition and Results of Operations—Liquidity and Capital Resources."
Restrictions in our debt instruments and accounts receivable facility limit our ability to take certain actions and breaches thereof could impair our liquidity.
Our credit facility and the indenture governing our senior subordinated notes contain covenants that restrict our ability to:
- •
- pay dividends or redeem or repurchase capital stock;
- •
- incur additional indebtedness and grant liens;
- •
- make acquisitions and joint venture investments;
- •
- sell assets; and
- •
- make capital expenditures.
Our credit facility also requires us to comply with financial covenants relating to, among other things, interest coverage and leverage. Our accounts receivable facility contains covenants similar to those in our credit facility and includes additional requirements regarding our receivables. We may not be able to satisfy these covenants in the future or be able to pursue our strategies within the constraints of these covenants. Substantially all of our assets and the assets of our domestic subsidiaries (other than our special purpose receivables subsidiary) are pledged as collateral pursuant to the terms of our credit facility. A breach of a covenant contained in our debt instruments could result in an event of default under one or more of our debt instruments, our accounts receivable facility and our lease financing arrangements. Such breaches would permit the lenders under our credit facility to declare all amounts borrowed thereunder to be due and payable, and the commitments of such lenders to make further extensions of credit could be terminated. In addition, such breach may cause a termination of our accounts receivable facility. Each of these circumstances could materially and adversely impair our liquidity.
We have significant goodwill and intangible assets, and future impairment of our goodwill and intangible assets could have a material negative impact on our financial results.
We test goodwill and indefinite-lived intangible assets for impairment on an annual basis as of October 1, and more frequently if we experience changes in our business conditions that indicate an interim test may be required, by comparing the estimated fair values with their respective carrying values. We estimate the fair value of our goodwill and indefinite-lived intangible assets utilizing a combination of a
20
discounted cash flow approach, which is based upon management's operating budget and internal five-year forecast, and market-based valuation measures that consider earnings multiples (for goodwill testing) and royalty rates (for indefinite-lived intangible asset testing). We test goodwill for impairment by comparing the estimated fair value of each of our reporting units, determined using a combination of the aforementioned techniques, to its respective carrying value on our balance sheet. If carrying value exceeds fair value, then a possible impairment of goodwill exists and further evaluation is performed. We test indefinite-lived intangible assets by comparing the estimated fair value of the assets, determined based on discounted future cash flows related to the net amount of royalty expenses avoided due to the existence of the trademark or trade name, to the carrying value. If the carrying value exceeds fair value, an impairment charge is recorded.
The utilization of a discounted cash flow approach in the impairment test for both goodwill and indefinite-lived intangible assets requires us to make significant estimates regarding future revenues and expenses, projected capital expenditures, changes in working capital and the appropriate discount rate. The projections also take into account several factors including current and estimated economic trends and outlook, costs of raw materials, consideration of our market capitalization in comparison to the estimated fair value of our reporting units determined using discounted cash flow analyses and other factors that are beyond our control.
At December 31, 2009, our goodwill and intangible assets were approximately $360.4 million and represented approximately 43.6% of our total assets. Our net loss of $136.2 million and $158.4 million for the years ended December 31, 2008 and 2007, respectively, included $166.6 million and $171.2 million, respectively of pre-tax charges for impairment of goodwill and indefinite-lived intangible assets in continuing operations, and $0.9 million and $17.9 million of such charges in discontinued operations in 2009 and 2008, respectively. If we experience declines in sales and operating profit or do not meet our current and forecasted operating budget, we may be subject to future goodwill impairments. In addition, while the fair value of our remaining goodwill exceeds its carrying value, significantly different assumptions regarding future performance of our businesses or significant declines in our stock price could result in additional impairment losses. Because of the significance of our goodwill and intangible assets, any future impairment of these assets could have a material adverse effect on our financial results.
We may face liability associated with the use of products for which patent ownership or other intellectual property rights are claimed.
We may be subject to claims or inquiries regarding alleged unauthorized use of a third party's intellectual property. An adverse outcome in any intellectual property litigation could subject us to significant liabilities to third parties, require us to license technology or other intellectual property rights from others, require us to comply with injunctions to cease marketing or using certain products or brands, or require us to redesign, reengineer, or rebrand certain products or packaging, any of which could affect our business, financial condition and operating results. If we are required to seek licenses under patents or other intellectual property rights of others, we may not be able to acquire these licenses on acceptable terms, if at all. In addition, the cost of responding to an intellectual property infringement claim, in terms of legal fees and expenses and the diversion of management resources, whether or not the claim is valid, could have a material adverse effect on our business, results of operations and financial condition.
We may be unable to adequately protect our intellectual property.
While we believe that our patents, trademarks and other intellectual property have significant value, it is uncertain that this intellectual property or any intellectual property acquired or developed by us in the future, will provide a meaningful competitive advantage. Our patents or pending applications may be challenged, invalidated or circumvented by competitors or rights granted thereunder may not provide meaningful proprietary protection. Moreover, competitors may infringe on our patents or successfully avoid them through design innovation. Policing unauthorized use of our intellectual property is difficult
21
and expensive, and we may not be able to, or have the resources to, prevent misappropriation of our proprietary rights, particularly in countries where the laws may not protect such rights as fully as in the U.S. The cost of protecting our intellectual property may be significant and have a material adverse effect on our financial condition and future results of operations.
We may incur material losses and costs as a result of product liability, recall and warranty claims that may be brought against us.
We are subject to a variety of litigation incidental to our businesses, including claims for damages arising out of use of our products, claims relating to intellectual property matters and claims involving employment matters and commercial disputes.
We currently carry insurance and maintain reserves for potential product liability claims. However, our insurance coverage may be inadequate if such claims do arise and any liability not covered by insurance could have a material adverse effect on our business. Although, we have been able to obtain insurance in amounts we believe to be appropriate to cover such liability to date, our insurance premiums may increase in the future as a consequence of conditions in the insurance business generally or our situation in particular. Any such increase could result in lower net income or cause the need to reduce our insurance coverage. In addition, a future claim may be brought against us that could have a material adverse effect on us. Any product liability claim may also include the imposition of punitive damages, the award of which, pursuant to certain state laws, may not be covered by insurance. Our product liability insurance policies have limits that, if exceeded, may result in material costs that could have an adverse effect on our future profitability. In addition, warranty claims are generally not covered by our product liability insurance. Further, any product liability or warranty issues may adversely affect our reputation as a manufacturer of high-quality, safe products, divert management's attention, and could have a material adverse effect on our business.
In addition, one of our Energy segment subsidiaries is a party to lawsuits related to asbestos contained in gaskets formerly manufactured by it or its predecessors. Some of this litigation includes claims for punitive and consequential as well as compensatory damages. We are not able to predict the outcome of these matters given that, among other things, claims may be initially made in jurisdictions without specifying the amount sought or by simply stating the minimum or maximum permissible monetary relief, and may be amended to alter the amount sought. Of the 7,816 claims pending at December 31, 2009, 96 set forth specific amounts of damages (other than those stating the statutory minimum or maximum). 71 of the 96 claims sought between $1.0 million and $5.0 million in total damages (which includes compensatory and punitive damages), 21 sought between $5.0 million and $10.0 million in total damages (which includes compensatory and punitive damages) and 4 sought over $10.0 million (which includes compensatory and punitive damages). Solely with respect to compensatory damages, 74 of the 96 claims sought between $50,000 and $600,000, 18 sought between $1.0 million and $5.0 million and 4 sought over $5.0 million. Solely with respect to punitive damages, 71 of the 96 claims sought between $0 million and $2.5 million, 20 sought between $2.5 million and $5.0 million and 5 sought over $5.0 million. Total defense costs from January 1, 2009 to December 31, 2009 were approximately $2.7 million and total settlement costs (exclusive of defense costs) for all asbestos cases since inception have been approximately $5.4 million through December 31, 2009. To date, approximately 50% of our costs related to defense and settlement of asbestos litigation have been covered by our primary insurance. Effective February 14, 2006, we entered into a coverage-in-place agreement with our first level excess carriers regarding the coverage to be provided to us for asbestos-related claims when our primary insurance is exhausted. The coverage-in-place agreement makes asbestos defense costs and indemnity insurance coverage available to us that might otherwise be disputed by the carriers and provides a methodology for the administration of such expenses. Nonetheless, there may be a period prior to the commencement of coverage under this agreement and following exhaustion of our primary insurance coverage during which we would be solely responsible for defense costs and indemnity payments, the duration of which would be subject to the scope of damage
22
awards and settlements paid. We also may incur significant litigation costs in defending these matters in the future. We may be required to incur additional defense costs and pay damage awards or settlements or become subject to equitable remedies that could adversely affect our businesses.
Our business may be materially and adversely affected by compliance obligations and liabilities under environmental laws and regulations.
We are subject to federal, state, local and foreign environmental laws and regulations which impose limitations on the discharge of pollutants into the ground, air and water and establish standards for the generation, treatment, use, storage and disposal of solid and hazardous wastes, and remediation of contaminated sites. We may be legally or contractually responsible or alleged to be responsible for the investigation and remediation of contamination at various sites, and for personal injury or property damages, if any, associated with such contamination. We have been named as potentially responsible parties under CERCLA (the federal Superfund law) or similar state laws in several sites requiring clean-up related to disposal of wastes we generated. These laws generally impose liability for costs to investigate and remediate contamination without regard to fault and under certain circumstances liability may be joint and several resulting in one responsible party being held responsible for the entire obligation. Liability may also include damages to natural resources. We have entered into consent decrees relating to two sites in California along with the many other co-defendants in these matters. We have incurred substantial expenses for each of these sites over a number of years, a portion of which has been covered by insurance. In addition to the foregoing, our businesses have incurred and likely will continue to incur expenses to investigate and clean up existing and former company-owned or leased property, including those properties made the subject of sale-leaseback transactions for which we have provided environmental indemnities to the lessors. Additional sites may be identified at which we are a potentially responsible party under the federal Superfund law or similar state laws. We must also comply with various health and safety regulations in the U.S. and abroad in connection with our operations.
We believe that our business, operations and facilities are being operated in compliance in all material respects with applicable environmental and health and safety laws and regulations, many of which provide for substantial fines and criminal sanctions for violations. Based on information presently known to us and accrued environmental reserves, we do not expect environmental costs or contingencies to have a material adverse effect on us. The operation of manufacturing plants entails risks in these areas, however, and we may incur material costs or liabilities in the future that could adversely affect us. There can be no assurance that we have been or will be at all times in substantial compliance with environmental health and safety laws. Failure to comply with any of these laws could result in civil, criminal, monetary and non-monetary penalties and damage to our reputation. In addition, potentially material expenditures could be required in the future. For example, we may be required to comply with evolving environmental and health and safety laws, regulations or requirements that may be adopted or imposed in the future or to address newly discovered information or conditions that require a response.
Our growth strategy includes the impact of acquisitions. If we are unable to identify attractive acquisition candidates, successfully integrate acquired operations or realize the intended benefits of our acquisitions, we may be adversely affected.
One of our principal growth strategies is to pursue strategic acquisition opportunities. Since our separation from Metaldyne in June 2002, we have completed eleven acquisitions. Each of these acquisitions required integration expense and actions that negatively impacted our results of operations and that could not have been fully anticipated beforehand. In addition, attractive acquisition candidates may not be identified and acquired in the future, financing for acquisitions may be unavailable on satisfactory terms and we may be unable to accomplish our strategic objectives in effecting a particular acquisition. We may encounter various risks in acquiring other companies, including the possible inability to integrate an acquired business into our operations, diversion of management's attention and
23
unanticipated problems or liabilities, some or all of which could materially and adversely affect our business strategy and financial condition and results of operations.
We have significant operating lease obligations and our failure to meet those obligations could adversely affect our financial condition.
We lease many of our manufacturing facilities and certain capital equipment. Our annualized rental expense in 2009 under these operating leases was approximately $14.7 million. A failure to pay our rental obligations would constitute a default allowing the applicable landlord to pursue any remedy available to it under applicable law, which would include taking possession of our property and, in the case of real property, evicting us. These leases are categorized as operating leases and are not considered indebtedness for purposes of our debt instruments.
We may be subject to further unionization and work stoppages at our facilities or our customers may be subject to work stoppages, which could seriously impact the profitability of our business.
As of December 31, 2009, approximately 27% of our work force in our continuing operations was unionized under several different unions and bargaining agreements. If our unionized workers were to engage in a strike, work stoppage or other slowdown in the future, we could experience a significant disruption of our operations. In addition, if a greater percentage of our work force becomes unionized, our labor costs and risks associated with strikes, work stoppages or other slowdowns may increase.
On July 10, 2009, we reached a mutually agreeable settlement with the United Steel, Paper and Forestry, Rubber, Manufacturing, Energy, Allied Industrial and Service Workers International Union ("Union") regarding the duration of a neutrality agreement we have with the Union. The agreement commits us to remain generally neutral in Union organizing drives through the duration of the agreement. On August 17, 2009, the Union began an organizing drive under the terms of the neutrality agreement at our facility located in Houston, Texas, which is included in our Energy segment. Since the Union obtained a simple majority of authorization cards during the organizing drive, on November 4, 2009 we recognized the Union at this facility. The recognition requires us and the Union to negotiate a first collective bargaining agreement within 180 days from the date of recognition. Under the neutrality agreement, there is no threat of strike or work slowdown during the first collective bargaining agreement.
On December 4, 2009, we received a notice of filing petition for union representation election filed by the International Association of Machinists and Aerospace workers with regard to our Engineered Components facility located in Plymouth, Massachusetts. On January 15, 2010, a vote was held according to the rules of the National Labor Relations Board. The union was unsuccessful in receiving the simple majority of the required votes; therefore, the Plymouth, Massachusetts facility remains in a union free status.
On December 10, 2009, we received a notice of filing petition for union decertification at the Houston, Texas facility. The hearing on the petition has not yet been scheduled. The decertification petition is still pending with the National Labor Relations Board.
Other than as described above, we are not aware of any present active union organizing drives at any of our other facilities. We cannot predict the impact of any further unionization of our workplace.
Many of our direct or indirect customers have unionized work forces. Strikes, work stoppages or slowdowns experienced by these customers or their suppliers could result in slowdowns or closures of assembly plants where our products are included. In addition, organizations responsible for shipping our customers' products may be impacted by occasional strikes or other activity. Any interruption in the delivery of our customers' products could reduce demand for our products and could have a material adverse effect on us.
24
Our healthcare costs for active employees and future retirees may exceed our projections and may negatively affect our financial results.
We maintain a range of healthcare benefits for our active employees and a limited number of retired employees pursuant to labor contracts and otherwise. Healthcare benefits for active employees and certain retirees are provided through comprehensive hospital, surgical and major medical benefit provisions or through health maintenance organizations, all of which are subject to various cost-sharing features. Some of these benefits are provided for in fixed amounts negotiated in labor contracts with the respective unions. If our costs under our benefit programs for active employees and retirees exceed our projections, our business and financial results could be materially adversely affected. Additionally, foreign competitors and many domestic competitors provide fewer benefits to their employees and retirees, and this difference in cost could adversely impact our competitive position.
A growing portion of our sales may be derived from international sources, which exposes us to certain risks which may adversely affect our financial results and impact our ability to service debt.
Approximately 17.7% of our net sales for the year ended December 31, 2009 were derived from sales by our subsidiaries located outside of the U.S. We may significantly expand our international operations through internal growth and acquisitions. Sales outside of the U.S., particularly sales to emerging markets, and manufacturing in non-US countries are subject to various other risks which are not present within U.S. markets, including governmental embargoes or foreign trade restrictions such as antidumping duties, changes in U.S. and foreign governmental regulations, tariffs and other trade barriers, the potential for nationalization of enterprises, foreign exchange risk and other political, economic and social instability. In addition, there are tax inefficiencies in repatriating cash flow from non-U.S. subsidiaries that could affect our financial results and reduce our ability to service debt.
Our stock price may be subject to significant volatility due to our own results or market trends.
If our revenue, earnings or cash flows in any quarter fail to meet the investment community's expectations, there could be an immediate negative impact on our stock price. Our stock price could also be impacted by broader market trends and world events unrelated to our performance.
If we do not meet the continued listing requirements of the NASDAQ our common stock may be delisted.
Our common stock is listed on the NASDAQ. The NASDAQ requires us to continue to meet certain listing standards, including standards related to our shareholders' equity and stock price. In instances where we do not meet the NASDAQ's continued listing standards, we may be notified by the NASDAQ and we may be required to take corrective action to meet the continued listing standards; otherwise, our common stock may be delisted from the NASDAQ. A delisting of our common stock on the NASDAQ would reduce the liquidity and market price of our common stock and the number of investors willing to hold or acquire our common stock, which could negatively impact our ability to access the public capital markets. A delisting would also reduce the value of our equity compensation plans, which could negatively impact our ability to retain key employees.
Heartland owns approximately 44% of our voting common equity.
Heartland Industrial Partners ("Heartland") beneficially owns approximately 44% of our outstanding voting common equity. As a result, Heartland has the power to substantially influence all matters submitted to our stockholders, exercise significant influence over our decisions to enter into any corporate transaction and any transaction that requires the approval of stockholders regardless of whether other stockholders believe that any such transactions are in their own best interests. For example, Heartland could cause us to make acquisitions that increase the amount of our indebtedness, sell revenue-generating assets or cause us to undergo a "going private" transaction with it or one of its affiliates based on its
25
ownership without a legal requirement of unaffiliated shareholder approval. In addition, Heartland has the power to control the election of a majority of our directors. So long as Heartland continues to own a significant amount of the outstanding shares of our common stock, it will continue to be able to strongly influence or effectively control our decisions. Its interests may differ from other stockholders and it may vote in a way with which other stockholders disagree. In addition, this concentration of ownership may have the effect of preventing, discouraging or deterring a change of control. One of our directors is the Managing Member of Heartland's general partner. Heartland also has the right to require us to file a registration statement with the SEC for purposes of registering for sale to the public some or all of the common stock of ours that it owns. See "Certain Relationships and Related Party Transactions" within this Form 10-K for further information.
Item 1B. Unresolved Staff Comments
Not applicable.
Properties
Our principal manufacturing facilities range in size from approximately 10,000 square feet to approximately 380,000 square feet. Except as set forth in the table below, all of our manufacturing facilities are owned. The leases for our manufacturing facilities have initial terms that expire from 2010 through 2022 and are all renewable, at our option, for various terms, provided that we are not in default under the lease agreements. Substantially all of our owned U.S. real properties are subject to liens under our amended and restated credit facility and will be subject to several liens in favor of the notes. Our executive offices are located in Bloomfield Hills, Michigan under a lease through June 2015. Our buildings, have been generally well maintained, are in good operating condition and are adequate for current production requirements.
The following list sets forth the location of our principal owned and leased manufacturing and other facilities used in continuing operations and identifies the principal operating segment utilizing such facilities, as of December 31, 2009:
Packaging
|
Energy | Aerospace & Defense | Engineered Components | Cequent | ||||
|---|---|---|---|---|---|---|---|---|
| United States: Indiana: Auburn Hamilton(1) International: Germany: Neunkirchen Mexico: Mexico City United Kingdom: Leicester China: Hangzhou(1) |
United States: Oklahoma: Tulsa Texas: Houston(1) International: Canada: Sarnia, Ontario(1) China: Hangzhou(1) |
United States: California: Riverbank(2) Commerce(1) |
United States: Massachusetts: Plymouth(1) Michigan: Warren(1) Livonia(1) Texas: Longview |
United States: Indiana: Goshen(1) Huntington(1) South Bend(1) Michigan: Plymouth(1) Tekonsha(1) Ohio: Solon(1) International: Australia: Dandenong, Victoria Lyndhurst, Victoria(1) Perth, Western Australia(1) Canada: Burlington, Ontario Mexico: Juarez(1) Reynosa Thailand: Chon Buri(1) |
- (1)
- Represents
a leased facility. All such leases are operating leases.
- (2)
- Owned by the U.S. Government and operated by our NI Industries™ business under a facility maintenance contract.
26
During 2002 and 2003, we entered into sale-leaseback transactions with respect to twelve real properties in the U.S. and Canada. The term of these leases is between 15 and 20 years, with the right to extend. Rental payments are due monthly. All of the foregoing leases are accounted for as operating leases. In general, pursuant to the terms of each sale-leaseback transactions, we transferred title of the real property to a purchaser and, in turn, entered into separate leases with the purchaser having a basic lease term plus renewal options. With respect to the 2002 sale-leaseback transactions, which includes nine of the twelve properties, the renewal option must be exercised with respect to all, and not less than all, of the property locations.
See Note 15, "Commitments and Contingencies" included in Part II, Item 8, "Notes to Audited Consolidated Financial Statements," within this Form 10-K.
Supplementary Item. Executive Officers of the Company
The following are our executive officers as of March 4, 2010:
Name
|
Age | Title | |||
|---|---|---|---|---|---|
David M. Wathen |
57 | President and Chief Executive Officer |
|||
A. Mark Zeffiro |
43 | Chief Financial Officer |
|||
Joshua A. Sherbin |
46 | Vice President, General Counsel and Secretary |
|||
Lynn A. Brooks |
57 | President, Packaging |
|||
Robert J. Zalupski |
50 | Vice President Finance and Treasurer |
|||
David M. Wathen. Mr. Wathen was appointed as our President and Chief Executive Officer and as a member of the board in January 2009. He is currently a director and member of the Audit Committee and Corporate Governance Committee of Franklin Electric Co., Inc. From 2002 until 2006, Mr. Wathen was President and Chief Executive Officer of Balfour Beatty, Inc. (US Operations) an engineering, construction and building management services company. Prior to his Balfour Beatty appointment in 2002, he served as a Principal Member of the General Partnership of QUESTOR, a private equity firm. Mr. Wathen has also held management positions with General Electric, Emerson Electric, Allied Signal, and Eaton Corporation.
A. Mark Zeffiro. Mr. Zeffiro was appointed our Chief Financial Officer in June 2008. Prior to joining TriMas, Mr. Zeffiro held various financial management and business positions with General Electric Company ("GE") and Black and Decker Corporation ("Black & Decker"). From 2004, during Mr. Zeffiro's four-year tenure with Black & Decker, he was Vice President of Finance for the Global Consumer Product Group and Latin America. In addition, Mr. Zeffiro was directly responsible for and functioned as general manager of the factory store business unit, a $50 million business comprising 38 factory stores and 500 personnel. In 2003-2004 Mr. Zeffiro was Chief Financial Officer of First Quality Enterprises, a private company producing consumer products for the health care market globally. He led all financial activities including funding, banking and audit. From 1988 through 2002 he held a series of operational and financial leadership positions with GE, the most recent of which was Chief Financial Officer of their medical imaging manufacturing division.
Joshua A. Sherbin. Mr. Sherbin was appointed our General Counsel and Secretary in March 2005, and Vice President in May 2008, prior to which he was employed as the North American Corporate Counsel and Corporate Secretary for Valeo, a diversified Tier 1 international automotive supplier headquartered in Europe. Prior to joining Valeo in 1997, Mr. Sherbin was Senior Counsel, Assistant Corporate Secretary for Kelly Services, Inc., an employment staffing company, from 1995 to 1997. From 1988 until 1995, he was an associate with Butzel Long's general business practice.
27
Lynn A. Brooks. Mr. Brooks has been President of Packaging since July 1996. He joined Rieke® in May 1978. Prior to his current position, his responsibilities at Rieke® included Assistant Controller, Corporate Controller, and Vice President-General Manager of Rieke®. Before joining Rieke®, he served with Ernst & Young in the Toledo, Ohio and Fort Wayne, Indiana offices.
Robert J. Zalupski. Mr. Zalupski was appointed our Vice President, Finance and Treasurer in January 2003. He joined us as Director of Finance and Treasury in July 2002, prior to which he worked in the Detroit office of Arthur Andersen. From August 1996 through November 2001, Mr. Zalupski was a partner in the audit and business advisory services practice of Arthur Andersen providing audit, business consulting, and risk management services to both public and privately held companies in the manufacturing, defense and automotive industries. Prior to August 1996, Mr. Zalupski held various positions of increasing responsibility within the audit practice of Arthur Andersen serving public and privately held clients in a variety of industries.
28
Item 5. Market for Registrant's Common Equity, Related Stockholder Matters and Issuer Purchases of Equity Securities
In the second quarter of 2007, we completed our initial public offering of common stock ("IPO"), issuing 12,650,000 shares at a price of $11 per share. Prior to our IPO, there was no trading market for our common stock.
Our common stock, par value $0.01 per share, is listed for trading on the NASDAQ Global Market under the symbol "TRS." As of February 26, 2010, there were 604 holders of record of our common stock.
We did not pay dividends in 2009 or 2008. Our current policy is to retain earnings to repay debt and finance our operations and acquisitions. In addition, our credit facility and the indenture governing our outstanding senior subordinated notes restrict the payment of dividends on common stock. See the discussion under Item 7, "Management's Discussion and Analysis of Financial Condition and Results of Operations—Liquidity and Capital Resources" and Note 12 to the Company's financial statements captioned "Long-term Debt," included in Item 8 of this report.
The high and low sales prices per share of our common stock by quarter subsequent to our IPO, as reported on the New York Stock Exchange, in May 2007 through August 23, 2009, and as reported on the NASDAQ from August 24, 2009 through December 31, 2009, are shown below:
| |
Price range of common stock |
|||||||
|---|---|---|---|---|---|---|---|---|
| |
High Price | Low Price | ||||||
Year Ended December 31, 2009: |
||||||||
4th Quarter |
$ | 7.49 | $ | 4.23 | ||||
3rd Quarter |
$ | 5.37 | $ | 2.84 | ||||
2nd Quarter |
$ | 4.28 | $ | 1.81 | ||||
1st Quarter |
$ | 2.19 | $ | 0.97 | ||||
Year Ended December 31, 2008: |
||||||||
4th Quarter |
$ | 6.25 | $ | 1.19 | ||||
3rd Quarter |
$ | 8.09 | $ | 5.53 | ||||
2nd Quarter |
$ | 8.17 | $ | 5.50 | ||||
1st Quarter |
$ | 10.07 | $ | 5.13 | ||||
Year Ended December 31, 2007: |
||||||||
4th Quarter |
$ | 16.15 | $ | 10.22 | ||||
3rd Quarter |
$ | 13.44 | $ | 11.58 | ||||
2nd Quarter |
$ | 12.85 | $ | 11.70 | ||||
1st Quarter |
N/A | N/A | ||||||
Please see Item 12, "Security Ownership of Certain Beneficial Owners and Management and Related Stockholder Matters" for securities authorized for issuance under equity compensation plans.
29
Performance Graph
The following graph compares the cumulative total stockholder return from the date of our IPO through December 31, 2009 for TriMas' common stock, the Russell 2000 Index and peer group(1) of companies we have selected for purposes of this comparison. We have assumed that dividends have been reinvested and returns have been weighted-averaged based on market capitalization. The graph assumes that $100 was invested in each of TriMas' common stock, the stocks comprising the Russell 2000 Index and the stocks comprising the peer group.
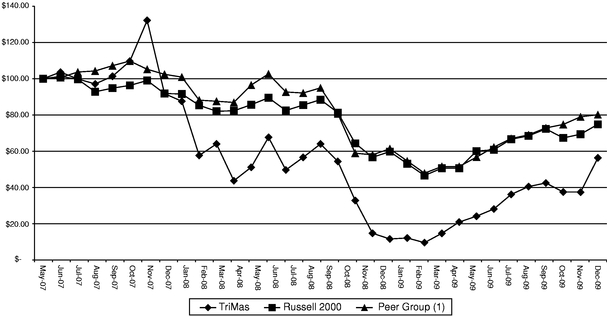
- (1)
- Includes Actuant Corporation, Carlisle Companies Inc., Crane Co., Dover Corporation, IDEX Corporation, Illinois Tool Works, Inc., Kaydon Corporation, SPX Corporation and Teleflex, Inc.
30
Item 6. Selected Financial Data
The following table sets forth our selected historical financial data from continuing operations for the five years ended December 31, 2009. The financial data for each of the five years presented has been audited by KPMG LLP and has been derived from our audited financial statements and notes to those financial statements. The following data should be read in conjunction with Item 7. "Management's Discussion and Analysis of Financial Condition and Results of Operations" and our audited financial statements included elsewhere in this report.
| |
Year ended December 31, | |||||||||||||||||
|---|---|---|---|---|---|---|---|---|---|---|---|---|---|---|---|---|---|---|
| |
2009 | 2008 | 2007 | 2006 | 2005 | |||||||||||||
| |
(dollars and shares in thousands, except per share data) |
|||||||||||||||||
Statement of Operations Data: |
||||||||||||||||||
Net sales |
$ | 803,650 | $ | 1,013,820 | $ | 999,130 | $ | 948,340 | $ | 932,990 | ||||||||
Gross profit |
208,820 | 263,370 | 272,500 | 255,800 | 231,720 | |||||||||||||
Impairment of goodwill and indefinite-lived intangible assets |
— | (166,610 | ) | (171,210 | ) | (116,500 | ) | — | ||||||||||
Operating profit (loss) |
49,910 | (69,340 | ) | (95,250 | ) | (18,800 | ) | 81,170 | ||||||||||
Income (loss) from continuing operations |
12,730 | (124,070 | ) | (161,580 | ) | (111,430 | ) | (1,250 | ) | |||||||||
Per Share Data: |
||||||||||||||||||
Basic: |
||||||||||||||||||
Continuing operations |
$ | 0.38 | $ | (3.71 | ) | $ | (5.67 | ) | $ | (5.51 | ) | $ | (0.06 | ) | ||||
Weighted average shares |
33,490 | 33,423 | 28,499 | 20,230 | 20,010 | |||||||||||||
Diluted: |
||||||||||||||||||
Continuing operations |
$ | 0.37 | $ | (3.71 | ) | $ | (5.67 | ) | $ | (5.51 | ) | $ | (0.06 | ) | ||||
Weighted average shares |
33,892 | 33,423 | 28,499 | 20,230 | 20,010 | |||||||||||||
| |
Year ended December 31, | |||||||||||||||||
|---|---|---|---|---|---|---|---|---|---|---|---|---|---|---|---|---|---|---|
| |
2009 | 2008 | 2007 | 2006 | 2005 | |||||||||||||
| |
(dollars in thousands) |
|||||||||||||||||
Statement of Cash Flows Data: |
||||||||||||||||||
Cash flows provided by (used for) |
$ | 83,510 | $ | 31,170 | $ | 64,970 | $ | 15,880 | $ | 29,890 | ||||||||
Investing activities |
9,130 | (33,380 | ) | (68,910 | ) | (22,160 | ) | (16,640 | ) | |||||||||
Financing activities |
(87,070 | ) | 1,320 | 5,140 | 6,150 | (12,610 | ) | |||||||||||
Balance Sheet Data: |
||||||||||||||||||
Total assets |
$ | 825,780 | $ | 930,220 | $ | 1,127,990 | $ | 1,286,060 | $ | 1,428,510 | ||||||||
Total debt |
514,550 | 609,940 | 615,990 | 734,490 | 727,680 | |||||||||||||
Goodwill and other intangibles |
360,410 | 380,100 | 567,170 | 769,850 | 900,000 | |||||||||||||
31
Item 7. Management's Discussion and Analysis of Financial Condition and Results of Operations
The statements in the discussion and analysis regarding industry outlook, our expectations regarding the performance of our business and the other non-historical statements in the discussion and analysis are forward-looking statements. These forward-looking statements are subject to numerous risks and uncertainties, including, but not limited to, the risks and uncertainties described in Item 1A "Risk Factors." Our actual results may differ materially from those contained in or implied by any forward-looking statements. You should read the following discussion together with Item 8, "Financial Statements and Supplementary Data."
Introduction
We are a global manufacturer and distributor of products for commercial, industrial and consumer markets. We are principally engaged in five reportable segments: Packaging, Energy, Aerospace & Defense, Engineered Components and Cequent. In reviewing our financial results, consideration should be given to certain critical events, particularly our initial public offering in May 2007 and expenses related thereto, acquisitions and consolidation, integration and restructuring efforts in several of our business operations. Effective April 1, 2009, we realigned our reportable segments as a result of our recent management reporting and business consolidation changes. We previously reported under five segments: Packaging Systems, Energy Products, Industrial Specialties, RV & Trailer Products and Recreational Accessories. All information included in this "Management's Discussion and Analysis of Financial Condition and Results of Operations" reflects this realignment.
Key Factors and Risks Affecting Our Reported Results. Our businesses and results of operations depend upon general economic conditions and we serve some customers in cyclical industries that are highly competitive and themselves adversely impacted by unfavorable economic conditions. During the fourth quarter of 2008, worldwide credit markets and global economic conditions deteriorated significantly, resulting in declines in demand for our products and services. These conditions have persisted during 2009, resulting in reductions in sales from comparable prior periods across all of our reportable segments and reductions in earnings in all reportable segments but Packaging. We expect that revenue and earnings will continue to trend below historical levels until the current unfavorable economic conditions improve.
Critical factors affecting our ability to succeed include: our ability to successfully pursue organic growth through product development, cross selling and extending product-line offerings, and our ability to quickly and cost-effectively introduce new products; our ability to acquire and integrate companies or products that will supplement existing product lines, add new distribution channels, expand our geographic coverage or enable us to better absorb overhead costs; our ability to manage our cost structure more efficiently through improved supply base management, internal sourcing and/or purchasing of materials, selective outsourcing and/or purchasing of support functions, working capital management, and greater leverage of our administrative and overhead functions. If we are unable to do any of the foregoing successfully, our financial condition and results of operations could be materially and adversely impacted.
There is some seasonality in the businesses within our Cequent reportable segment, where sales of towing and trailering products are generally stronger in the second and third quarters, as trailer original equipment manufacturers ("OEMs"), distributors and retailers acquire product for the spring and summer selling seasons. No other reportable segment experiences significant seasonal fluctuation in its businesses. We do not consider sales order backlog to be a material factor in our business. A growing portion of our sales may be derived from international sources, which exposes us to certain risks, including currency risks.
The demand for some of our products, particularly in the Cequent segment, is heavily influenced by consumer sentiment. We experienced decreases in sales and earnings in 2008 as a result of an uncertain credit market and interest rate environment and rising energy costs, among other things. Sales and earnings have declined further as a result of the worsening of the global economic conditions in 2009. We expect the current end market conditions in the Cequent segment will continue to remain weak and/or
32
decline until the U.S. economy recovers from existing recessionary forces, employment levels increase and consumer credit availability improves, thereby increasing consumer discretionary spending.
We are sensitive to price movements in our raw materials supply base. Our largest material purchases are for steel, copper, aluminum, polyethylene and other resins and energy. Historically, we have experienced increasing costs of steel and resin and have worked with our suppliers to manage cost pressures and disruptions in supply. We have also initiated pricing programs to pass increased steel, copper, aluminum and resin costs to customers. Although we may experience delays in our ability to implement price increases, we generally are able to recover such increased costs. Although there have been no significant disruptions in the supply of steel since 2005, we may experience disruptions in supply in the future and we may not be able to pass along higher costs associated with such disruptions to our customers in the form of price increases. We will continue to take actions as necessary to manage risks associated with increasing steel or other raw material costs. However, such increased costs may adversely impact our earnings.
We report shipping and handling expenses, associated with certain businesses within our Cequent segment, for its sales distribution network, as an element of selling, general and administrative expenses in our consolidated statement of operations. As such, gross margins for the Cequent segment may not be comparable to other companies which include all costs related to their distribution network in cost of sales.
We have substantial debt, interest and lease payment requirements that may restrict our future operations and impair our ability to meet our obligations and, in a rising interest rate environment, our performance may be adversely affected by our degree of leverage.
Recent Consolidation, Integration and Restructuring Activities. Since our separation from Metaldyne in 2002, we have undertaken significant consolidation, integration and other cost-savings programs to enhance our efficiency and achieve cost reduction opportunities which exist in our businesses. In addition to major consolidation projects, there have also been a series of ongoing initiatives to eliminate duplicative and excess manufacturing and distribution facilities, sales forces, and back office and other support functions in order to continue to optimize our cost structure in response to competitor actions and market conditions.
In the fourth quarter of 2008, in response to the deteriorating recent economic conditions, we accelerated our Profit Improvement Plan, which included further consolidation of distribution and manufacturing activities, continued integration of certain business activities, movement of production to lower-cost environments and expansion of strategic sourcing initiatives. We have also implemented reductions in salaried headcount and in fixed and variable spending to better align the fixed cost structure of these operating segments with the reality of our current market environment and to maintain or improve operating margins. We have implemented commercial actions to protect and gain market share through continued introduction of new and innovative products and by providing superior delivery and service to our customers. Further, we also have pricing initiatives in place to recover inflationary cost increases and we are continuing actions to leverage our businesses' strong brand names. The Company has realized savings during 2009 of approximately $32 million resulting from actions taken as a part of the Profit Improvement Plan. These savings are the significant driver of the Company maintaining its gross profit margin in 2009 despite a 20% reduction in sales as compared to 2008.
The most significant element of our Profit Improvement Plan implemented during 2009 is the restructuring of our legacy towing, trailering and electrical businesses within our Cequent reportable segment into one business, rationalizing facilities and the management team. This restructuring plan included the closure of the Mosinee, WI manufacturing facility, with the production and distribution functions previously located in Mosinee being relocated to lower-cost manufacturing facilities or to third party sourcing partners.
33
In 2008, our most significant action was the restructuring of our organizational structure within our corporate office.
In 2007, the key action taken was the closure of Cequent's manufacturing facility in Huntsville, Ontario, Canada, with the consolidation of its operations into our Goshen, Indiana manufacturing facility.
Key Indicators of Performance. In evaluating our business, our management considers Adjusted EBITDA as a key indicator of financial operating performance and as a measure of cash generating capability. We define Adjusted EBITDA as net income (loss) before cumulative effect of accounting change, interest, taxes, depreciation, amortization, debt extinguishment costs, non-cash asset and goodwill impairment charges and write-offs and non-cash losses on sale-leaseback of property and equipment. In evaluating Adjusted EBITDA, our management deems it important to consider the quality of our underlying earnings by separately identifying certain costs undertaken to improve our results, such as costs related to consolidating facilities and businesses in an effort to eliminate duplicative costs or achieve efficiencies, costs related to integrating acquisitions and restructuring costs related to expense reduction efforts. Although we may undertake new consolidation, restructuring and integration efforts in the future as a result of our acquisition activity, our management separately considers these costs in evaluating underlying business performance. Caution must be exercised in considering these items as they include substantially (but not necessarily entirely) cash costs and there can be no assurance that we will ultimately realize the benefits of these efforts. Moreover, even if the anticipated benefits are realized, they may be offset by other business performance or general economic issues.
Management believes that consideration of Adjusted EBITDA together with a careful review of our results reported under GAAP is the best way to analyze our ability to service and/or incur indebtedness, as we are a highly leveraged company. We use Adjusted EBITDA as a key performance measure because we believe it facilitates operating performance comparisons from period to period and company to company by excluding potential differences caused by variations in capital structures (affecting interest expense), tax positions (such as the impact on periods or companies of changes in effective tax rates or net operating losses), and the impact of purchase accounting as well as depreciation and amortization expense. Because Adjusted EBITDA facilitates internal comparisons of our historical operating performance on a more consistent basis, we also use Adjusted EBITDA for business planning purposes, in measuring our performance relative to that of our competitors and in evaluating acquisition opportunities.
In addition, we believe Adjusted EBITDA and similar measures are widely used by investors, securities analysts, ratings agencies and other interested parties as a measure of financial performance and debt-service capabilities. Our use of Adjusted EBITDA has limitations as an analytical tool, and you should not consider it in isolation or as a substitute for analysis of our results as reported under GAAP. Some of these limitations are:
- •
- it does not reflect our cash expenditures for capital equipment or other contractual commitments;
- •
- although depreciation, amortization and asset impairment charges and write-offs are non-cash
charges, the assets being depreciated, amortized or written off may have to be replaced in the future, and Adjusted EBITDA does not reflect cash capital expenditure requirements for such replacements;
- •
- it does not reflect changes in, or cash requirements for, our working capital needs;
- •
- it does not reflect the significant interest expense or the cash requirements necessary to service interest or principal
payments on our indebtedness;
- •
- it does not reflect certain tax payments that may represent a reduction in cash available to us;
34
- •
- it includes amounts resulting from matters we consider not to be indicative of underlying performance of our fundamental
business operations; and
- •
- other companies, including companies in our industry, may calculate these measures differently and as the number of differences in the way two different companies calculate these measures increases, the degree of their usefulness as a comparative measure correspondingly decreases.
Because of these limitations, Adjusted EBITDA should not be considered as a measure of discretionary cash available to us to invest in our growth. We compensate for these limitations by relying primarily on our GAAP results and using Adjusted EBITDA only supplementally. We carefully review our operating profit margins (operating profit as a percentage of net sales) at a segment level, which are discussed in detail in our year-to-year comparison of operating results.
The following is a reconciliation of our net loss to Adjusted EBITDA and cash flows provided by operating activities for the three years ended December 31:
| |
Year ended December 31, | ||||||||||
|---|---|---|---|---|---|---|---|---|---|---|---|
| |
2009 | 2008 | 2007 | ||||||||
| |
(dollars in thousands) |
||||||||||
Net loss |
$ | (220 | ) | $ | (136,190 | ) | $ | (158,430 | ) | ||
Income tax benefit(1) |
(520 | ) | (12,610 | ) | (10,410 | ) | |||||
Interest expense(2) |
45,720 | 55,920 | 68,310 | ||||||||
Debt extinguishment costs |
11,400 | 140 | 7,440 | ||||||||
Impairment of property and equipment(3) |
2,340 | 500 | 3,370 | ||||||||
Impairment of goodwill and indefinite-lived intangible assets(4) |
930 | 184,530 | 171,210 | ||||||||
Depreciation and amortization(5) |
43,940 | 44,070 | 41,350 | ||||||||
Adjusted EBITDA |
$ | 103,590 | $ | 136,360 | $ | 122,840 | |||||
Interest paid |
(43,600 | ) | (52,660 | ) | (63,690 | ) | |||||
Taxes paid |
(8,200 | ) | (8,060 | ) | (8,660 | ) | |||||
(Gain) loss on disposition of plant and equipment(6) |
570 | 70 | (630 | ) | |||||||
Gain on extinguishment of debt |
(24,500 | ) | (3,880 | ) | — | ||||||
Receivables sales and securitization, net |
(15,550 | ) | (18,310 | ) | 25,980 | ||||||
Net change in working capital |
71,200 | (22,350 | ) | (10,870 | ) | ||||||
Cash flows provided by operating activities |
$ | 83,510 | $ | 31,170 | $ | 64,970 | |||||
- (1)
- Includes
income tax benefit (expense) of approximately $8.9 million, $13.1 million and ($2.9) million recorded in 2009, 2008 and
2007, respectively, related to discontinued operations. See Note 5, "Discontinued Operations and Assets Held for Sale" to the financial statements attached hereto for further information.
- (2)
- Includes
interest expense related to discontinued operations in the amounts of $0.7 million and $0.2 million in 2009 and 2008,
respectively.
- (3)
- Includes
asset impairments related to discontinuing operations of approximately $2.3 million in 2009.
- (4)
- Includes
goodwill and indefinite-lived intangible asset impairment charges of $0.9 million and $15.5 million related to
discontinued operations in 2009 and 2008, respectively.
- (5)
- Includes
depreciation and amortization related to discontinued operations in the amounts of $3.5 million, $6.5 million and
$2.8 million in 2009, 2008 and 2007, respectively.
- (6)
- Includes gain on disposition of plant and equipment related to discontinued operations in the amounts of $0.3 million and $2.3 million in 2008 and 2007, respectively.
35
The following details certain items relating to our consolidation, restructuring and integration efforts, the use of proceeds from our initial public offering of common stock and other items that are included in the determination of net loss under GAAP and are not added back to net loss in determining Adjusted EBITDA, but that we separately consider in evaluating our Adjusted EBITDA:
| |
Year ended December 31, | |||||||||
|---|---|---|---|---|---|---|---|---|---|---|
| |
2009 | 2008 | 2007 | |||||||
| |
(dollars in thousands) |
|||||||||
Severance and business unit restructuring costs(a) |
$ | 10,870 | $ | 4,910 | $ | 5,620 | ||||
Estimated future unrecoverable lease obligations(b) |
5,250 | — | — | |||||||
Fees incurred under advisory services agreement(c) |
2,890 | — | 10,000 | |||||||
Costs for early termination of operating leases(d) |
— | — | 4,230 | |||||||
Settlement of Canadian benefit plan liability(e) |
— | — | 3,870 | |||||||
Gross gain on extinguishment of debt(f) |
(29,390 | ) | (3,880 | ) | — | |||||
|
$ | (10,380 | ) | $ | 1,030 | $ | 23,720 | |||
- (a)
- Principally
employee severance costs associated with business unit restructuring and other cost reduction activities.
- (b)
- Estimate
of future unrecoverable lease obligations for facilities no longer utilized, net of projected sublease recoveries.
- (c)
- Expenses
associated with our advisory services agreement with Heartland.
- (d)
- Costs
associated with the early termination of operating leases and purchase of underlying machinery and equipment assets.
- (e)
- Non-cash
expense associated with a settlement of our Canadian defined benefit pension plan liability, resulting from the closure
of a distribution facility in 1997, for which the ultimate resolution and related accounting for distribution of surplus assets of the plan was not approved by Canadian authorities until 2007.
- (f)
- Gains recognized in connection with the extinguishment of $81.2 million of our senior subordinated notes due 2012, excluding debt extinguishment costs.
Segment Information and Supplemental Analysis
The following table summarizes financial information for our five current operating segments:
| |
Year ended December 31, | |||||||||||||||||||
|---|---|---|---|---|---|---|---|---|---|---|---|---|---|---|---|---|---|---|---|---|
(dollars in thousands)
|
2009 | As a Percentage of Net Sales |
2008 | As a Percentage of Net Sales |
2007 | As a Percentage of Net Sales |
||||||||||||||
Net Sales: |
||||||||||||||||||||
Packaging |
$ | 145,060 | 18.1 | % | $ | 161,330 | 15.9 | % | $ | 151,950 | 15.2 | % | ||||||||
Energy |
148,930 | 18.5 | % | 213,750 | 21.1 | % | 163,470 | 16.4 | % | |||||||||||
Aerospace & Defense |
74,420 | 9.3 | % | 95,300 | 9.4 | % | 79,550 | 8.0 | % | |||||||||||
Engineered Components |
62,290 | 7.8 | % | 119,050 | 11.7 | % | 121,140 | 12.1 | % | |||||||||||
Cequent |
372,950 | 46.4 | % | 424,390 | 41.9 | % | 483,020 | 48.3 | % | |||||||||||
Total |
$ | 803,650 | 100.0 | % | $ | 1,013,820 | 100.0 | % | $ | 999,130 | 100.0 | % | ||||||||
Gross Profit: |
||||||||||||||||||||
Packaging |
$ | 52,920 | 36.5 | % | $ | 53,500 | 33.2 | % | $ | 51,380 | 33.8 | % | ||||||||
Energy |
36,940 | 24.8 | % | 59,230 | 27.7 | % | 47,600 | 29.1 | % | |||||||||||
Aerospace & Defense |
30,290 | 40.7 | % | 40,660 | 42.7 | % | 33,690 | 42.4 | % | |||||||||||
Engineered Components |
8,810 | 14.1 | % | 21,610 | 18.2 | % | 25,460 | 21.0 | % | |||||||||||
Cequent |
79,860 | 21.4 | % | 88,370 | 20.8 | % | 114,370 | 23.7 | % | |||||||||||
Total |
$ | 208,820 | 26.0 | % | $ | 263,370 | 26.0 | % | $ | 272,500 | 27.3 | % | ||||||||
36
| |
Year ended December 31, | |||||||||||||||||||
|---|---|---|---|---|---|---|---|---|---|---|---|---|---|---|---|---|---|---|---|---|
(dollars in thousands)
|
2009 | As a Percentage of Net Sales |
2008 | As a Percentage of Net Sales |
2007 | As a Percentage of Net Sales |
||||||||||||||
Selling, General and Administrative: |
||||||||||||||||||||
Packaging |
$ | 19,630 | 13.5 | % | $ | 22,400 | 13.9 | % | $ | 21,490 | 14.1 | % | ||||||||
Energy |
24,090 | 16.2 | % | 26,470 | 12.4 | % | 24,550 | 15.0 | % | |||||||||||
Aerospace & Defense |
8,490 | 11.4 | % | 8,790 | 9.2 | % | 10,210 | 12.8 | % | |||||||||||
Engineered Components |
5,690 | 9.1 | % | 7,350 | 6.2 | % | 7,490 | 6.2 | % | |||||||||||
Cequent |
69,710 | 18.7 | % | 78,090 | 18.4 | % | 84,400 | 17.5 | % | |||||||||||
Corporate expenses |
22,590 | N/A | 22,160 | N/A | 25,220 | N/A | ||||||||||||||
Total |
$ | 150,200 | 18.7 | % | $ | 165,260 | 16.3 | % | $ | 173,360 | 17.4 | % | ||||||||
Impairment of Assets and Goodwill: |
||||||||||||||||||||
Packaging |
$ | — | 0.0 | % | $ | 62,490 | 38.7 | % | $ | — | 0.0 | % | ||||||||
Energy |
— | 0.0 | % | — | 0.0 | % | — | 0.0 | % | |||||||||||
Aerospace & Defense |
— | 0.0 | % | — | 0.0 | % | — | 0.0 | % | |||||||||||
Engineered Components |
— | 0.0 | % | 19,180 | 16.1 | % | — | 0.1 | % | |||||||||||
Cequent |
— | 0.0 | % | 85,440 | 20.1 | % | 174,580 | 36.1 | % | |||||||||||
Total |
$ | — | 0.0 | % | $ | 167,110 | 16.5 | % | $ | 174,580 | 17.5 | % | ||||||||
Operating Profit (Loss): |
||||||||||||||||||||
Packaging |
$ | 33,050 | 22.8 | % | $ | (31,200 | ) | (19.3 | )% | $ | 26,880 | 17.7 | % | |||||||
Energy |
12,780 | 8.6 | % | 32,740 | 15.3 | % | 22,860 | 14.0 | % | |||||||||||
Aerospace & Defense |
21,770 | 29.3 | % | 31,850 | 33.4 | % | 23,190 | 29.2 | % | |||||||||||
Engineered Components |
2,960 | 4.8 | % | (5,140 | ) | (4.3 | )% | 17,970 | 14.8 | % | ||||||||||
Cequent |
4,830 | 1.3 | % | (75,430 | ) | (17.8 | )% | (145,430 | ) | (30.1 | )% | |||||||||
Corporate expenses |
(25,480 | ) | N/A | (22,160 | ) | N/A | (40,730 | ) | N/A | |||||||||||
Total |
$ | 49,910 | 6.2 | % | $ | (69,340 | ) | (6.8 | )% | $ | (95,260 | ) | (9.5 | )% | ||||||
Capital Expenditures: |
||||||||||||||||||||
Packaging |
$ | 4,190 | 2.9 | % | $ | 5,890 | 3.7 | % | $ | 14,340 | 9.4 | % | ||||||||
Energy |
1,860 | 1.2 | % | 5,100 | 2.4 | % | 5,590 | 3.4 | % | |||||||||||
Aerospace & Defense |
1,550 | 2.1 | % | 5,720 | 6.0 | % | 6,110 | 7.7 | % | |||||||||||
Engineered Components |
3,060 | 4.9 | % | 6,040 | 5.1 | % | 9,780 | 8.1 | % | |||||||||||
Cequent |
3,280 | 0.9 | % | 5,010 | 1.2 | % | 11,450 | 2.4 | % | |||||||||||
Corporate |
80 | N/A | 100 | N/A | 120 | N/A | ||||||||||||||
Total |
$ | 14,020 | 1.7 | % | $ | 27,860 | 2.7 | % | $ | 47,390 | 4.7 | % | ||||||||
Depreciation and Amortization |
||||||||||||||||||||
Packaging |
$ | 13,330 | 9.2 | % | $ | 13,780 | 8.5 | % | $ | 11,840 | 7.8 | % | ||||||||
Energy |
2,960 | 2.0 | % | 2,790 | 1.3 | % | 2,470 | 1.5 | % | |||||||||||
Aerospace & Defense |
2,260 | 3.0 | % | 1,960 | 2.1 | % | 1,530 | 1.9 | % | |||||||||||
Engineered Components |
3,010 | 4.8 | % | 2,890 | 2.4 | % | 2,980 | 2.5 | % | |||||||||||
Cequent |
19,730 | 5.3 | % | 18,410 | 4.3 | % | 19,530 | 4.0 | % | |||||||||||
Corporate |
110 | N/A | 100 | N/A | 170 | N/A | ||||||||||||||
Total |
$ | 41,400 | 5.2 | % | $ | 39,930 | 3.9 | % | $ | 38,520 | 3.9 | % | ||||||||
Adjusted EBITDA: |
||||||||||||||||||||
Packaging |
$ | 45,730 | 31.5 | % | $ | 45,030 | 27.9 | % | $ | 38,840 | 25.6 | % | ||||||||
Energy |
15,870 | 10.7 | % | 35,430 | 16.6 | % | 25,430 | 15.6 | % | |||||||||||
Aerospace & Defense |
24,030 | 32.3 | % | 33,810 | 35.5 | % | 24,790 | 31.2 | % | |||||||||||
Engineered Components |
5,990 | 9.6 | % | 17,000 | 14.3 | % | 20,930 | 17.3 | % | |||||||||||
Cequent |
25,280 | 6.8 | % | 28,310 | 6.7 | % | 47,960 | 9.9 | % | |||||||||||
Corporate income (expenses) |
2,050 | N/A | (20,280 | ) | N/A | (43,980 | ) | N/A | ||||||||||||
Subtotal from continuing operations |
$ | 118,950 | 14.8 | % | $ | 139,300 | 13.7 | % | $ | 113,970 | 11.4 | % | ||||||||
Discontinued operations |
(15,360 | ) | N/A | (2,940 | ) | N/A | 8,870 | N/A | ||||||||||||
Total |
$ | 103,590 | 12.9 | % | $ | 136,360 | 13.5 | % | $ | 122,840 | 12.3 | % | ||||||||
37
Results of Operations
Year Ended December 31, 2009 Compared with Year Ended December 31, 2008
The principal factors impacting us during the year ended December 31, 2009 compared with the year ended December 31, 2008 were:
- •
- the impact of the current global economic recession, resulting in lower sales volumes across all of our reportable
segments and reduced earnings in all reportable segments except Packaging;
- •
- costs incurred and savings realized related to our Profit Improvement Plan, primarily in our Packaging and Cequent
segments;
- •
- compression of gross profit margins in certain of our segments due to lower absorption of fixed costs and, during the
early 2009, sales of higher-cost inventory;
- •
- increases in the value of the U.S. dollar as compared to the currencies in other countries where we operate;
- •
- gains on extinguishment of debt in 2009 resulting from the repurchase of our 97/8% senior subordinated
notes at prices below their face value; and
- •
- costs incurred resulting from the refinancing of our credit facilities and senior notes in December 2009.
Overall, net sales decreased approximately $210.2 million, or approximately 20.7%, to $803.7 million in 2009, as compared to $1.014 billion in 2008. Although a few of our businesses benefitted from new product introductions and new sales promotions during 2009, net sales declined in each of our five reportable segments, generally due to lower sales volumes resulting from the global economic recession. In addition, net sales were unfavorably impacted by approximately $9.6 million as a result of currency exchange, as our reported results in U.S. dollars were negatively impacted by weaker foreign currencies.
Gross profit margin (gross profit as a percentage of sales) approximated 26.0% in both 2009 and 2008, as we were able to essentially hold our gross profit margin despite the 21% reduction in sales volumes, reduced absorption of fixed costs and unfavorable currency exchange as a result of realization of savings from our cost reduction and alternate sourcing initiatives that began in the fourth quarter of 2008, with the largest impact experienced in our Packaging and Cequent segments.
Operating profit margin (operating profit as a percentage of sales) approximated 6.2% and (6.8)% in 2009 and 2008, respectively. Operating profit increased $119.3 million in 2009 as compared to 2008. In 2008, we experienced a negative operating profit margin as a result of approximately $167.1 million in impairment of asset and goodwill charges. We did not record any similar charges in 2009. We were able to essentially hold our gross profit margin, and although selling, general and administrative expenses were higher as a percentage of sales, we lowered such costs by approximately $15.1 million compared to 2008 based on cost reduction and discretionary spend actions in response to the lower sales volumes.
Adjusted EBITDA margin from continuing operations (Adjusted EBITDA as a percentage of sales) approximated 14.8% and 13.7% in 2009 and 2008, respectively. Adjusted EBITDA decreased approximately $20.4 million in 2009 as compared to 2008. After consideration of the $167.1 million impairment of goodwill and asset charges in 2008, $25.3 million higher gross gain on debt extinguishment resulting from the repurchase of our senior subordinated notes in 2009 compared to 2008, an increase in year-over-year depreciation and amortization expense of approximately $1.5 million and approximately $0.5 million lower year-over-year expense for receivables sales and securitization, the change in Adjusted EBITDA is consistent with the change in operating profit between years.
See below for a discussion of operating results by segment.
Packaging. Net sales decreased approximately $16.2 million, or 10.1%, to $145.1 million in 2009, as compared to $161.3 million in 2008. Overall, sales decreased approximately $6.6 million due to currency
38
exchange, as our reported results in U.S. dollars were negatively impacted as a result of the stronger U.S. dollar relative to foreign currencies. Sales of our specialty dispensing products and new product introductions increased by approximately $16.1 million in 2009 compared to 2008, due primarily to increased sales into the personal care markets, pharmaceuticals and the food industries. Sales of our industrial closures, rings and levers decreased by approximately $25.7 million in 2009 compared to 2008, primarily as a result of the continued general economic slowdown.
Packaging's gross profit decreased approximately $0.6 million to $52.9 million, or 36.5% of sales in 2009, as compared to $53.5 million, or 33.2% of sales in 2008. The decrease in gross profit between years is primarily attributed to lower sales volumes of our industrial products and unfavorable currency exchange. However, our gross profit margin improved 330 basis points in 2009 compared to 2008 due to the impact of the implementation of productivity projects, improved matching of resources with lower industrial sales volumes and lower costs for certain commodities due to alternate sourcing or improved internal processing.
Packaging's selling, general and administrative expenses decreased approximately $2.8 million to $19.6 million, or 13.5% of sales in 2009, as compared to $22.4 million, or 13.9% of sales in 2008. Discretionary spending has been reduced from 2008 levels, and additional selling, general and administrative cost reduction plans have been implemented to better align the fixed cost structure with current business requirements resulting from the general economic decline.
Packaging's operating profit increased approximately $64.3 million to $33.1 million, or 22.8% of sales in 2009, as compared to an operating loss of $31.2 million, or (19.3)% of sales, in 2008. The increase in operating profit between years is due primarily to the recognition of a $62.5 million goodwill and indefinite-lived intangible asset impairment charge recorded in 2008. After consideration of the 2008 impairment charge, operating profit improved as compared to 2008 due to the impact of our productivity projects, alternate sourcing of commodities and reduced selling, general and administrative costs.
Packaging's Adjusted EBITDA increased approximately $0.7 million to $45.7 million, or 31.5% of sales in 2009, as compared to $45.0 million, or 27.9% of sales in 2008, consistent with the change in operating profit between years after consideration of the $62.5 million goodwill impairment in 2008 and losses on transactions denominated in foreign currencies of approximately $0.5 million in 2009 as compared to gains on similar transactions of $0.5 million in 2008.
Energy. Net sales in 2009 decreased approximately $64.8 million, or 30.3%, to $148.9 million, as compared to $213.7 million in 2008. Sales of specialty gaskets and related fastening hardware decreased approximately $21.2 million as a result of reduced levels of turn-around activity at petrochemical refineries and decreased sales demand from the chemical industry, as customers continue to defer maintenance and new programs that require our replacement and specialty gaskets and hardware. Sales of slow speed and compressor engines and related products decreased by approximately $43.6 million, due to a reduction of drilling activity in North America and customers deferring completion of previously drilled wells. Sales of compression products increased slightly, as the Company continues to develop new products to add to its well-site content.
Gross profit within Energy decreased approximately $22.3 million to $36.9 million, or 24.8% of sales, in 2009, as compared to $59.2 million, or 27.7% of sales, in 2008. Gross profit decreased approximately $18.0 million as a result of the reduction in sales levels between years. The remaining decrease in gross profit is primarily attributable to lower absorption of fixed costs as a result of the lower sales volumes.
Selling, general and administrative expenses within Energy decreased approximately $2.4 million to $24.1 million, or 16.2% of net sales, in 2009, as compared to $26.5 million or 12.4% of net sales, in 2008. This decrease was primarily due to reduced sales commissions in our specialty gasket business, and lower compensation and other administrative costs in an effort to match spending and headcount to current production volumes in both our specialty gasket and engine businesses. These decreases were partially offset by the opening of two new branches within our specialty gasket business, one in Salt Lake City, Utah, and one in Rotterdam, Netherlands, in 2009, which has increased selling, general and administrative expenses in 2009 by approximately $0.9 million.
39
Overall, operating profit within Energy decreased approximately $19.9 million to $12.8 million, or 8.6% of sales, in 2009, as compared to $32.7 million, or 15.3% of sales, in 2008, due principally to lower sales volumes and lower absorption of fixed costs, which were partially offset by reductions in compensation and other administrative costs as a result of management actions in response to lower sales volumes.
Energy's Adjusted EBITDA decreased $19.5 million to $15.9 million, or 10.7% of sales, in 2009, as compared to $35.4 million, or 16.6% of sales, in 2008, consistent with the decrease in operating profit between years.
Aerospace & Defense. Net sales in 2009 decreased approximately $20.9 million, or 21.9%, to $74.4 million, as compared to $95.3 million in 2008. Sales in our aerospace business decreased approximately $17.1 million, primarily due to lower blind-bolt fastener sales resulting from the consolidation of the distributor segment of our customer base and inventory reductions by our distribution customers, who are adjusting inventory levels in response to slowing of production levels by aircraft manufacturers and as a result of the current economic uncertainty. This decrease was partially offset by sales of new products, primarily titanium screws, of approximately $4.5 million during 2009, which increased our content on certain aircraft. Sales in our defense business decreased approximately $3.8 million. Revenue associated with managing the relocation and closure of the defense facility increased approximately $2.6 million in 2009 compared to 2008. In addition, we had approximately $1.7 million of new product sales during 2009. These increases in revenue were more than offset by a decrease in cartridge sales of approximately $8.1 million in 2009 compared with 2008, as our customer had been building its inventory throughout 2008 in advance of the relocation of the facility, which began in second quarter 2009.
Gross profit within Aerospace & Defense decreased approximately $10.4 million to $30.3 million, or 40.7% of sales, in 2009, from $40.7 million, or 42.7% of sales, in 2008. Gross profit decreased approximately $8.9 million as a result of the decline in sales levels between years. This decrease in gross profit was also impacted by lower absorption of fixed costs as a result of lower production and/or sales levels, primarily within our aerospace business, and a less favorable product sales mix.
Selling, general and administrative expenses decreased approximately $0.3 million to $8.5 million, or 11.4% of sales, in 2009, as compared to $8.8 million, or 9.2% of sales, in 2008, due primarily to reduced sales commissions and expenses and discretionary spending in light of the decrease in sales levels between years.
Operating profit within Aerospace & Defense decreased approximately $10.1 million to $21.8 million, or 29.3% of sales, in 2009, as compared to $31.9 million, or 33.4% of sales, in 2008, primarily due to lower sales volumes, lower absorption of fixed costs and a less favorable product sales mix, which were partially offset by reduced selling, general and administrative expenses.
Aerospace & Defense's Adjusted EBITDA decreased $9.8 million to $24.0 million, or 32.3% of sales, in 2009, as compared to $33.8 million, or 35.5% of sales, in 2008, consistent with the decrease in operating profit between years.
Engineered Components. Net sales in 2009 decreased approximately $56.8 million, or 47.7%, to $62.3 million, as compared to $119.1 million in 2008. Sales within our specialty fittings business declined $1.3 million due to lower sales of our core tube nut products which have been significantly impacted by the continued weak domestic automotive market demand, this decrease was partially offset by new product offerings for automotive fuel systems. Sales in our industrial cylinder and precision tool cutting businesses decreased $50.6 million and $4.9 million, respectively, due primarily to the global economic recession, which significantly impacted industrial applications and products.
Gross profit within Engineered Components decreased approximately $12.8 million to $8.8 million, or 14.1% of sales, in 2009, from $21.6 million, or 18.2% of sales, in 2008. Gross profit decreased
40
approximately $10.3 million as a result of the decline in sales levels between years. This decrease in gross profit was also impacted by sales of higher-cost inventory, primarily related to steel, in excess of the businesses' ability to secure price increases and lower absorption of fixed costs as a result of lower production and/or sales levels.
Selling, general and administrative expenses decreased approximately $1.7 million to $5.7 million, or 9.1% of sales, in 2009, as compared to $7.4 million, or 6.2% of sales, in 2008, due primarily to lower sales commissions as a result of the decrease in sales levels between years, and reduced compensation and discretionary spending as a result of action items taken in response to the lower sales levels.
Operating profit within Engineered Components increased approximately $8.1 million to $3.0 million, or 4.8% of sales, in 2009, as compared to a loss of $5.1 million, or (4.3)% of sales, in 2008. The increase in operating profit between years is due primarily to the recognition of a $19.2 million goodwill and indefinite-lived intangible asset impairment charge recorded in 2008. After consideration of the 2008 impairment charge, operating profit declined primarily due to lower sales volumes, reduced absorption of fixed costs and sales of higher-cost inventory, which were partially offset by reduced sales commissions, compensation expense and discretionary spending within selling, general and administrative expenses.
Engineered Components' Adjusted EBITDA decreased approximately $11.0 million to $6.0 million, or 9.6% of sales, in 2009, as compared to $17.0 million, or 14.3% of sales, in 2008, consistent with the change in operating profit between years after consideration of the 2008 goodwill and indefinite-lived intangible asset impairment charge.
Cequent. Net sales decreased approximately $51.4 million, or 12.1%, to $373.0 million in 2009, as compared to $424.4 million in 2008. Net sales were unfavorably impacted by approximately $2.4 million of currency exchange, as our reported results in U.S. dollars were negatively impacted as a result of the stronger U.S. dollar relative to foreign currencies. Sales in our retail business increased approximately $1.4 million due to additional business at a few large customers and the addition of several new customers during 2009, which were partially offset by reduced sales volumes to existing retail customers due to the economic uncertainty. Sales within our performance products business (includes the legacy towing, trailering and electrical businesses) decreased by $51.2 million, due to the continued soft demand in the majority of the end markets we serve due to the current uncertain economic conditions. Sales in our Australia/Asia Pacific business, excluding the impact of currency exchange, increased approximately $0.8 million, due primarily to significant increases in sales in the second half of 2009 as compared to the first half of 2009 and 2008 levels resulting from a government incentive stimulus in Australia. The increases in sales resulting from the stimulus were mostly offset by decreases in certain original equipment manufacturer revenue and reduced sales in the first half of 2009 due to the overall global economic recession.
Cequent's gross profit decreased approximately $8.5 million to $79.9 million, or 21.4% of sales, in 2009, from approximately $88.4 million, or 20.8% of sales, in 2008. The decline in gross profit between years was primarily due to lower sales volumes in North America resulting from the economic uncertainty, sales of higher-cost inventory in excess of the businesses' ability to secure sales price increases during the first two quarters of 2009, lower absorption of fixed costs as a result of lower production and/or sales levels and accelerated depreciation expense related to machinery and equipment in our Mosinee, WI manufacturing facility that is no longer utilized following the closure in late 2009. However, our gross profit margin improved 60 basis points in 2009 compared to 2008 due to the impact of the implementation of Profit Improvement Plan initiatives in late 2008 and early 2009, from which we began to realize increasing cost savings as we progressed through 2009 via fixed cost reductions.
Selling, general and administrative expenses decreased approximately $8.4 million to $69.7 million, or 18.7% of sales, in 2009, as compared to $78.1 million, or 18.4% of sales, in 2008, due primarily to reductions in salaries, sales promotions, sales commissions and other discretionary spending, all as a part of our Profit Improvement Plan to better align the spending and cost structure with the current demand
41
and production levels. These decreases were partially offset by severance charges of approximately $1.6 million incurred in 2009 associated with the involuntary termination of employees located at our Mosinee, WI manufacturing facility, which was closed during the fourth quarter of 2009.
Cequent's operating profit increased approximately $80.2 million to $4.8 million, or 1.3% of sales, in 2009, from an operating loss of $75.4 million, or (17.8)% of net sales, in 2008. The increase in operating profit between years is due primarily to the recognition of a $85.4 million goodwill and indefinite-lived intangible asset impairment charge recorded in 2008. After consideration of this charge in 2008, the decline in operating profit between years was primarily due to lower sales volumes, sales of higher-cost inventory, lower absorption of fixed costs and costs associated with the closure of the Mosinee, WI manufacturing facility, which were partially offset by cost savings realized as a result of actions taken as part of the Profit Improvement Plan.
Cequent's Adjusted EBITDA decreased approximately $3.0 million to $25.3 million, or 6.8% of sales, in 2009, from $28.3 million, or 6.7% of sales, in 2008. In 2009, Cequent recognized approximately $1.0 million greater gains on transactions denominated in foreign currencies as compared to 2008. In addition, depreciation expense was approximately $1.3 million higher in 2009 compared to 2008, primarily as a result of accelerated depreciation incurred in 2009 in connection with certain machinery and equipment that will no longer be utilized following the closure of the Mosinee facility. After consideration of these two items and consideration of the 2008 goodwill and indefinite-lived intangible asset impairment charge, the change in Adjusted EBITDA is consistent with the change in operating profit between years.
Corporate (Income) Expenses. Corporate expenses and management fees included in operating profit and Adjusted EBITDA consist of the following:
| |
Year ended December 31, |
|||||||
|---|---|---|---|---|---|---|---|---|
| |
2009 | 2008 | ||||||
| |
(in millions) |
|||||||
Corporate operating expenses |
$ | 10.7 | $ | 11.6 | ||||
Employee costs and related benefits |
11.7 | 10.4 | ||||||
Management fees and expenses |
3.1 | 0.2 | ||||||
Corporate expenses—operating loss |
$ | 25.5 | $ | 22.2 | ||||
Receivables sales and securitization expenses |
1.7 | 2.6 | ||||||
Gain on repurchase of bonds |
(29.4 | ) | (3.9 | ) | ||||
Depreciation |
(0.1 | ) | (0.1 | ) | ||||
Other, net |
0.2 | (0.5 | ) | |||||
Corporate (income) expenses—Adjusted EBITDA |
$ | (2.1 | ) | $ | 20.3 | |||
Corporate expenses included in operating profit increased by approximately $3.3 million to $25.5 million in 2009, from $22.2 million in 2008. During 2009, we recorded a charge of approximately $2.9 million associated with the termination of our former chief executive officer. During 2008, we recorded a charge of approximately $1.6 million related to severance related to our corporate office restructuring. In addition, we incurred approximately $2.9 million of Heartland Industrial Partners ("Heartland") advisory services fees in connection with the debt refinancing activities in the fourth quarter of 2009. The net increase of $1.3 million in severance costs and $2.9 million in management fees and expenses was partially offset by a $0.9 million reduction in discretionary and overall spending levels in 2009. See gain (loss) on extinguishment of debt and other expense, net below for explanations for changes in receivables sales and securitization expenses and gain on repurchase of bonds.
Interest Expense. Interest expense decreased approximately $10.6 million, to $45.1 million in 2009 as compared to $55.7 million in 2008. The decrease in interest expense was primarily the result of a decrease
42
in our effective weighted average interest rate on variable rate U.S. borrowings to approximately 3.9% during 2009, from approximately 5.3% during 2008. Partially offsetting this reduction in interest rates was an increase in our weighted-average U.S. borrowings from approximately $297.1 million in 2008 to approximately $307.8 million in 2009, as we utilized our revolving credit facility as our primary source to fund operations in 2009 (as it was our lowest cost source of borrowings), as compared to utilizing our securitization facility as the primary source of operational funding in 2008 when it was the more cost-effective alternative. In addition, we recorded approximately $5.8 million lower interest expense related to our senior subordinated notes in 2009 compared to 2008, due primarily to approximately $73.2 million of note repurchases during 2009.
Gain (loss) on extinguishment of debt. Our net gain on extinguishment of debt increased approximately $14.3 million to a gain of $18.0 million in 2009, from a gain of $3.7 million in 2008. During the first three quarters of 2009, we retired approximately $73.2 million face value of our senior subordinated notes, resulting in a gross gain of $29.4 million, less $1.1 million in debt extinguishment costs. During the fourth quarter, we incurred approximately $10.3 million in net debt extinguishment costs related to the refinance of our credit facility and senior notes. In 2008, we recognized a $3.9 million gross gain on the repurchase of $8.0 million face value of senior subordinated notes, less $0.2 million in debt extinguishment costs.
Other Expense, Net. Other expense, net decreased approximately $0.5 million to $1.7 million in 2009, from $2.3 million in 2008. During 2009, we incurred approximately $2.1 million of expenses in connection with the use of our receivables securitization facility and sales of receivables to fund working capital needs and experienced approximately $0.7 million of gains on transactions denominated in foreign currencies. During 2008, we incurred approximately $2.6 million of expenses in connection with the use of our receivables securitization facility and sales of receivables to fund working capital needs and experienced approximately $0.8 million of gains on transactions denominated in foreign currencies. There were no other individually significant amounts incurred or changes in amounts incurred in either 2009 or 2008.
Income Taxes. The effective income tax rate for 2009 was 39.6% compared to (0.4)% for 2008. In 2009, we reported domestic and foreign pre-tax income of approximately $2.8 million and $18.3 million, respectively. In 2009, we recorded $1.1 million tax expense associated with deferred tax adjustments for prior years and tax expense of $1.7 million related to increases in valuation allowances related to our change in judgments about the effects of tax restrictions on utilizing certain deferred tax assets, including a foreign capital loss carryforward and certain state and foreign tax operating loss carryforwards. The pre-tax loss in 2008 is primarily the result of a goodwill impairment charge of $166.6 million, for which we received an income tax benefit of only $15.2 million, which significantly reduced our effective tax rate in 2008. In 2008, we also recorded a tax benefit of approximately $2.9 million primarily associated with the release of a capital loss valuation allowance.
Discontinued Operations. The results of discontinued operations consist of our medical device line of business and our N.I. Industries property management line of business, both of which are classified as held for sale for all periods presented, as well as our specialty laminates, jacketings and insulation tapes business, which was sold in February 2009. Loss from discontinued operations, net of income tax benefit, was $13.0 million and $12.1 million in 2009 and 2008, respectively. See Note 5, "Discontinued Operations and Assets Held for Sale," to our consolidated financial statements attached herein.
Year Ended December 31, 2008 Compared with Year Ended December 31, 2007
The principal factors impacting us during the year ended December 31, 2008 compared with the year ended December 31, 2007 were:
- •
- strong demand in certain industrial sectors during the first three quarters of 2008, most notably energy and aerospace, positively impacting our specialty gasket and engine businesses in the Energy
43
- •
- continued declines in end-market demand across most market channels in our Cequent operating segments as a
result of reduced consumer discretionary spending in response to unfavorable economic conditions including higher fuel prices, uncertain credit market and interest rate environment and diminished
consumer confidence;
- •
- non-cash goodwill and indefinite-lived intangible asset impairment charges of $166.6 million and
$171.2 million in the fourth quarter of 2008 and 2007, respectively, as a result of declining market capitalization, the impact of weakening demand and order intake for the Company's products
due to recessionary forces in the U.S. and globally, the significant decline in the financial markets and continued uncertainty and lack of availability in the credit markets;
- •
- inflationary increases in raw material prices, most notably for steel and resin, and increases in costs and freight
related to foreign-sourced products, which impacted our businesses most significantly in the second and third quarters of 2008; and
- •
- completion of our initial public offering of our common stock in May 2007, the use of proceeds therefrom to retire $100.0 million face value of senior subordinated notes, to effect early termination of operating leases and acquire underlying machinery and equipment assets and to terminate an advisory services agreement, and the related cost savings from such retirements/terminations;
operating segment and the aerospace fastener business in our Aerospace & Defense operating segment;
Overall, net sales increased $14.7 million, or approximately 1.5%, in 2008 as compared with 2007. Of this increase, approximately $5.6 million is due to currency exchange as our reported results in U.S. dollars benefited from stronger foreign currencies. Sales increased in three of our segments due primarily to new products and increased demand, however this was substantially offset by sales decreases in our other two segments primarily due to weak end market demand.
Gross profit margin (gross profit as a percentage of sales) approximated 26.0% and 27.3% for 2008 and 2007, respectively. The overall decline in gross profit margin is primarily due to increases in raw material and commodity costs that were not fully recoverable through sales price increases, less favorable product mix, and lower absorption of fixed costs due to weak end market demand, offset slightly by increased sales.
Operating profit (loss) margin (operating profit (loss) as a percentage of sales) approximated (6.8)% and (9.5)% in 2008 and 2007, respectively. Operating profit increased approximately $25.9 million, to an operating loss of $69.3 million in 2008, compared to an operating loss of $95.3 million in 2007. In 2008, we recorded a non-cash goodwill and indefinite-lived intangible asset impairment charge of $166.6 million in our Packaging, Engineered Components and Cequent segments. In 2007, we recorded a non-cash goodwill and indefinite-lived intangible asset impairment charge of $171.2 million in our Cequent segment. In addition to these impairment charges, during 2007, we utilized proceeds from our IPO to fund a $10.0 million fee to Heartland for agreeing to a contractual settlement of its right to receive a $4.0 million annual fee under its advisory services agreement and $4.2 million of costs and expenses related to the early termination of operating leases. In 2007, we also recorded approximately $9.0 million related to the closure of our Huntsville, Ontario, Canada facility within our Cequent segment and a non-cash settlement of a benefit plan liability of approximately $3.9 million in our Packaging segment.
Adjusted EBITDA margin (Adjusted EBITDA as a percentage of sales) approximated 13.7% and 11.4% in 2008 and 2007, respectively. Adjusted EBITDA increased approximately $25.3 million in 2008 compared to 2007. After consideration of the $166.6 million non-cash goodwill and intangible asset impairment charges, $2.8 million of increases in depreciation expense, and the $3.4 million Huntsville facility impairment charge, the change in Adjusted EBITDA was consistent with the change in operating profit.
44
See below for a discussion of operating results by segment.
Packaging. Net sales increased $9.4 million, or approximately 6.2%, to $161.3 million in 2008, as compared to $151.9 million in 2007. Overall, approximately $2.1 million of the increase in sales was due to favorable currency exchange, as our reported results in U.S. dollars were positively impacted as a result of stronger foreign currencies. In addition, sales of our specialty dispensing products and new product introductions increased approximately $7.3 million and sales of our industrial closures remained relatively flat year over year.
Packaging's gross profit increased approximately $2.1 million to $53.5 million, or 33.2% of sales, in 2008, as compared to $51.4 million, or 33.8% of sales, in 2007. The increase in gross profit between years was primarily attributed to higher sales levels, but was partially offset by increased raw material and commodity costs which, while recovered, were not recovered at cost plus a normal gross profit margin.
Packaging's selling, general and administrative costs increased approximately $0.9 million to $22.4 million, or 13.9% of sales, in 2008, as compared to $21.5 million, or 14.1% of sales, in 2007. The increase in selling, general and administrative expenses was primarily due to increased spending to support sales growth initiatives.
Packaging's operating profit (loss) decreased $58.1 million to $(31.2) million, or (19.3)% of sales, in 2008, as compared to $26.9 million, or 17.7% of sales, in 2007. The decrease in operating profit was due primarily to the recognition of a $62.5 million non-cash goodwill and indefinite-lived intangible asset impairment in 2008, which was partially offset by a non-cash charge in 2007 that did not recur in 2008 of $3.9 million related to settlement of a defined benefit plan liability resulting from the closure of a distribution facility. The remaining change between years was due to increased profit due to higher sales levels, which was partially offset by increased selling, general and administrative costs incurred to support sales growth initiatives.
Packaging's Adjusted EBITDA increased $6.2 million to $45.0 million, or 27.9% of sales, in 2008, as compared to $38.8 million, or 25.6% of sales, in 2007. After consideration of the $62.5 million non-cash goodwill and indefinite-lived intangible asset impairment charge in 2008 and an increase in depreciation expense of $1.8 million in 2008 as compared to 2007, the change in Adjusted EBITDA was consistent with the change in operating profit (loss).
Energy. Net sales for 2008 increased $50.3 million, or 30.8%, to $213.8 million, as compared to $163.5 million in 2007. Sales of specialty gaskets and related fastening hardware increased approximately $15.5 million as compared to 2007 as a result of increased demand from customers with whom we have global supply agreements, continued penetration in our fastening hardware product line and increased demand for replacement parts as refineries continued to operate at capacity for most of the year. Sales of slow speed and compressor engines and related products increased approximately $34.8 million in 2008 as compared to 2007, as higher commodity prices drove a robust drilling and completion market. Our engine business also benefited from investments made in prior years to develop compression and gas production equipment products, which contributed about 10% of the year-on-year growth.
Gross profit within Energy increased $11.6 million to $59.2 million, or 27.7% of sales, in 2008, as compared to $47.6 million, or 29.1% of sales in 2007. While the increase in sales volume contributed $4.8 million to gross profit in our specialty gasket business, this increase was partially offset by a combined approximately $2.8 million of increased costs related to imported materials, an unfavorable product sales mix and the launch of a new branch in the Netherlands. Gross profit increased by $9.6 million in our engine business in 2008 as compared to 2007, approximately $8.6 million of which was driven by the increase in sales volumes year over year. The remainder of the increase resulted from production efficiencies realized with higher, predictable volumes in 2008 as compared to 2007, which was partially offset by higher costs of imported components.
45
Selling, general and administrative expenses within Energy increased $1.9 million to $26.5 million, or 12.4% of net sales, in 2008, as compared to $24.6 million, or 15.0% of net sales, in 2007. This change is comprised of an increase of approximately $3.0 million in compensation and commission expenses in support of increased sales in both businesses in this group and severance and other charges associated with the separation of the former Energy, Aerospace & Defense and Engineered Components Group President in the second quarter of 2008, which were partially offset by lower legal costs associated with the defense of asbestos claims.
Overall, operating profit within Energy increased $9.8 million to $32.7 million, or 15.3% of sales, in 2008, as compared to $22.9 million, or 14.0% of sales, in 2007. This increase is due principally to higher sales volumes and other operational improvements, which were partially offset by increases in the costs of imported materials and components and compensation expenses.
Energy's Adjusted EBITDA increased $10.0 million to $35.4 million, or 16.6% of sales, in 2008, as compared to $25.4 million, or 15.6% of sales, in 2007, consistent with the improvement in operating profit between years.
Aerospace & Defense. Net sales in 2008 increased $15.8 million, or approximately 19.8%, to $95.3 million, from $79.6 million in 2007. Net sales in 2008 increased 16.9% in our aerospace fastener business as compared to 2007, as we continued to benefit from share gains as well as strong market demand. Net sales grew 29.8% in our defense business, primarily as our customers continued to build-up their inventory of cartridge cases in advance of the closure of the army munitions plant.
Gross profit within Aerospace & Defense increased $7.0 million to $40.7 million, or 42.7% of sales, in 2008, from $33.7 million, or 42.4% of sales, in 2007. Gross profit increased approximately $6.2 million at our aerospace fastener business, approximately $4.6 million of which was attributable to higher sales in 2008 and $1.6 million from improved operating leverage and efficiencies. Gross profit also increased at our defense business by $0.8 million, primarily as a result of incremental sales volume.
Selling, general and administrative expenses decreased $1.4 million to $8.8 million, or 9.2% of sales, in 2008, as compared to $10.2 million, or 12.8% of sales, in 2007. The businesses in this segment largely held their investment in sales resources and product development flat in 2008, and benefited by approximately $0.9 million from the curtailment of a postretirement benefit pension plan.
Overall, operating profit within Aerospace & Defense increased $8.7 million to $31.9 million, or 33.4% of sales, in 2008, as compared to $23.2 million, or 29.2% of sales, in 2007, primarily due to higher sales levels in our aerospace and defense businesses.
Aerospace & Defense's Adjusted EBITDA increased $9.0 million to $33.8 million, or 35.5% of sales, in 2008, as compared to $24.8 million, or 31.2% of sales, in 2007. The change in Adjusted EBITDA was consistent with the change in operating profit.
Engineered Components. Net sales in 2008 decreased $2.1 million, or approximately 1.7%, to $119.1 million, from $121.1 million in 2007. Sales within our industrial gas cylinders and specialty cutting tools remained essentially flat year over year. Sales within our specialty fittings business declined approximately 16.8% in 2008 as compared to 2007 due to the severe decline in the domestic automotive end market.
Gross profit within Engineered Components decreased $3.9 million to $21.6 million, or 18.2% of sales, in 2008, from $25.5 million, or 21.0% of sales, in 2007. Gross profit was flat to lower across the businesses in this segment, which were unfavorably impacted by 2008 material cost increases in excess of the businesses' ability to secure price increases and a significant decline in industrial demand in the fourth quarter of 2008, most notably in our specialty fittings business.
46
Selling, general and administrative expenses remained relatively flat in 2008, decreasing $0.1 million to $7.4 million, or 6.2% of sales, in 2008, as compared to $7.5 million, or 6.2% of sales, in 2007. The businesses in this segment largely held their investment in sales resources and product development flat in 2008.
Overall, operating profit within Engineered Components decreased $23.1 million to ($5.1) million or (4.3)%, in 2008, as compared to $18.0 million, or 14.8% of sales, in 2007, primarily due to the $19.2 million non-cash goodwill and indefinite-lived intangible asset impairment charge in 2008, in addition to higher commodity costs not fully recovered and declines in industrial demand, most notably within our specialty fittings business.
Engineered Components' Adjusted EBITDA decreased $3.9 million to $17.0 million, or 14.3% of sales, in 2008, as compared to $20.9 million, or 17.3% of sales, in 2007. After consideration of the $19.2 million non-cash goodwill and indefinite-lived intangible asset impairment charge in 2008, the change in Adjusted EBITDA was consistent with the change in operating profit.
Cequent. Net sales decreased $58.6 million, or 12.1%, to $424.4 million in 2008, from $483.0 million in 2007. Net sales were favorably impacted by approximately $3.5 million of currency exchange, as our reported results in U.S. dollars were positively impacted as a result of stronger foreign currencies. In addition, this segment benefited from $4.7 million in higher sales in 2008 in our Australian legacy business and from the acquisition of Parkside Towbars, which was completed in the first quarter of 2008. However, these amounts were more than offset by the decrease in sales within our performance products business of approximately $45.1 million in 2008 as compared to 2007, as increases in sales of new products were more than offset by declines in sales to the installer, distributor and original equipment channels due to continued weak end-market demand and low consumer confidence resulting from uncertain economic conditions. Sales in our retail business declined $19.9 million in 2008 as compared 2007 due to the combination of lower sales volumes as a result of the current economic uncertainty and changes in certain customer promotional programs and one-time product pipeline fills that did not recur in 2008.
Cequent's gross profit decreased $26.0 million to $88.4 million, or 20.8% of net sales in 2008, from $114.4 million, or 23.7% of net sales, in 2007. Of the decrease in gross profit between years, approximately $13.9 million was attributed to the decline in sales volumes between periods. Gross profit between years further decreased by approximately $12.1 million of operating inefficiencies and lower absorption of fixed costs resulting from reduced manufacturing activity in response to lower demand and a less favorable product sales mix. The impact of increasing commodity and higher freight costs was largely offset by pricing initiatives and cost savings realized as a result of the closure of our Huntsville, Ontario, Canada facility, which was closed in the fourth quarter of 2007.
Cequent's selling, general and administrative expenses decreased $6.3 million to $78.1 million, or 18.4% of sales in 2008, from $84.4 million, or 17.5% of sales in 2007. The decrease between years was due primarily to reductions in selling and distribution expenses in our performance products business as a result of further consolidation of our warehouse and distribution network. In addition, our discretionary spending was reduced in 2008 commensurate with the decline in sales in our installer and distributor channels and we lowered our promotional spending in our retail business. This decrease was partially offset by $1.6 million in higher spending within our Australian business, including spending within our Parkside Towbars business acquired in January 2008 and to support growth initiatives in Thailand.
Cequent's operating loss was $75.4 million in 2008, compared to an operating loss of $145.4 million in 2007. In 2008, we recognized a non-cash goodwill and indefinite-lived intangible asset impairment charge of $85.4 million due to continued declines in the fair value of this business, compared to a non-cash goodwill and indefinite-lived intangible asset impairment charge in 2007 of $174.6 million. The remaining incremental operating loss of $19.2 million is primarily the result of the decline in sales between years, operating inefficiencies from reduced manufacturing activity in response to the lower demand, and a less favorable sales mix.
47
Cequent's Adjusted EBITDA decreased $19.7 million to $28.3 million, or 6.7% of net sales in 2008, from $48.0 million, or 9.9% of net sales in 2007 which, after considering the impact of the goodwill and indefinite-lived intangible asset impairment charges in 2008 and 2007, is consistent with the decline in operating profit between years.
Corporate Expenses. Corporate expenses and management fees included in operating profit and Adjusted EBITDA consist of the following:
| |
Year ended December 31, |
|||||||
|---|---|---|---|---|---|---|---|---|
| |
2008 | 2007 | ||||||
| |
(in millions) |
|||||||
Corporate operating expenses |
$ | 11.6 | $ | 14.8 | ||||
Employee costs and related benefits |
10.4 | 9.6 | ||||||
Costs for early termination of operating leases |
— | 4.2 | ||||||
Management fees and expenses |
0.2 | 12.1 | ||||||
Corporate expenses—operating loss |
$ | 22.2 | $ | 40.7 | ||||
Receivables sales and securitization expenses |
2.6 | 4.1 | ||||||
Gain on repurchase of bonds |
(3.9 | ) | — | |||||
Depreciation |
(0.1 | ) | (0.1 | ) | ||||
Other, net |
(0.5 | ) | (0.7 | ) | ||||
Corporate expenses—Adjusted EBITDA |
$ | 20.3 | $ | 44.0 | ||||
Corporate expenses included in our operating loss decreased by approximately $18.5 million to $22.2 million in 2008, from $40.7 million in 2007, primarily due to the impact of the use of IPO proceeds in 2007, including payment of a $10.0 million termination fee to Heartland for agreeing to a contractual settlement of its right to receive a $4.0 million annual fee under its advisory services agreement and $4.2 million of costs and expenses related to the early termination of operating leases. Additionally, we incurred higher-than-normal professional fees expense in 2007 in support of our efforts to fully document and complete initial testing associated with the requirements of Sarbanes-Oxley. Employee costs and related benefits increased by approximately $0.8 million to $10.4 million in 2008, from $9.6 million in 2007, primarily due to approximately $1.6 million of severance charges incurred in connection with our corporate office restructuring during the second quarter of 2008, which were partially offset by the benefit of having fewer employees during the second half of 2008. Receivables sales and securitization expenses decreased approximately $1.5 million in 2008 as compared to 2007, due primarily to an approximate 2.4% decrease in the weighted average securitization rate from 2007 to 2008. In addition, during the fourth quarter of 2008, we repurchased $8.0 million face value of our senior subordinated notes, resulting in a $3.9 million gain.
Interest Expense. Interest expense decreased approximately $12.6 million to $55.7 million in 2008, from $68.3 million in 2007. Approximately $5.0 million of the reduction in interest expense is a result of the retirement of $100.0 million senior subordinated notes in June 2007 with our IPO proceeds. The decrease is also a result of a decrease in our weighted-average U.S. variable-rate on U.S. borrowings of 5.4% in 2008, from 7.8% in 2007. Weighted-average borrowings on U.S. variable-rate debt were approximately flat year-over-year.
Gain (loss) on extinguishment of debt. Our net gain on extinguishment of debt increased approximately $11.1 million to a gain of $3.7 million in 2008, from a loss of $7.4 million in 2007. In 2008, we recognized a $3.9 million gross gain on the repurchase of $8.0 million face value of senior subordinated notes, less $0.2 million in debt extinguishment costs, while in 2007 we incurred approximately $7.4 million of debt extinguishment costs in connection with the retirement of $100.0 million senior subordinated notes in June 2007 with our IPO proceeds.
48
Other Expense, Net. Other expense, net decreased approximately $1.6 million to $2.3 million in 2008, from $3.9 million in 2007. The decrease is principally due a $1.5 million decrease in costs related to receivable sales and securitization expenses resulting from an approximate 2.4% decrease in the weighted average securitization rate from 2007 to 2008.
Income Taxes. The effective income tax rate for 2008 was (0.4)% compared with 7.6% for 2007. In 2008, we reported domestic and foreign pre-tax loss of approximately $91.5 million and $32.1 million, respectively. The pre-tax loss in 2008 is primarily the result of a goodwill and intangible asset impairment charge of $166.6 million, for which we received an income tax benefit of only $15.2 million, which significantly reduced our effective tax rate in 2008. In 2008, we also recorded a $2.9 million tax benefit associated with the release valuation allowances related to our change in judgments about the effects of tax restrictions on utilizing certain deferred tax assets, primarily a capital loss carryforward. The pre-tax loss in 2007 is primarily the result of a goodwill and indefinite-lived intangible asset impairment charge of $171.2 million, for which we recorded an income tax benefit of only $11.3 million. In 2007, we also recorded a $1.4 million tax benefit associated change in statutory tax rates and tax law. The Company reduced its net deferred income tax liabilities for the tax law changes that were signed into effect during 2007. In addition, the Company recorded a valuation allowance of $1.0 million against certain state NOL's during 2007.
Discontinued Operations. The results of discontinued operations consist of our medical device line of business and our N.I. Industries property management line of business, both of which are classified as held for sale for all periods presented, as well as our specialty laminates, jacketings and insulation tapes business, which was sold in February 2009. The results of operations also include certain non-operating charges related to our industrial fastening businesses post-sale. Loss from discontinued operations, net of income tax benefit, was $12.1 million in 2008, as compared to income from discontinued operations, net of income tax expense, of $3.2 million in 2007. See Note 5, "Discontinued Operations and Assets Held for Sale," to our consolidated financial statements included herein.
Liquidity and Capital Resources
Cash Flows
Cash provided by operating activities in 2009 was approximately $83.5 million, as compared to $31.2 million in 2008. Significant changes in cash flows provided by operating activities and the reasons for such changes are as follows:
- •
- In 2009, the Company generated $20.7 million in cash flows, based on the reported net loss from operations and
after considering the effects of non-cash items related to asset impairments, depreciation, amortization, compensation, changes in deferred taxes, debt extinguishment costs, other, net. In
2008, the Company generated $69.1 million based on the reported net loss from operations and after considering the effects of comparable non-cash items.
- •
- In 2009, activity related to the sale of receivables and use of our accounts receivable facility resulted in a net cash
use of approximately $15.6 million, compared to a net cash use of approximately $18.3 million in 2008. During both 2009 and 2008, we relied on our revolving credit facility as the
principal source of funding for our working capital requirements and ordinary course needs, as it was our lowest cost source of borrowings. The decrease in 2009 from 2008 primarily represents our
lower borrowing requirements, as we did not require any funding from our receivables securitization facility at December 31, 2009, compared to amounts outstanding on the facility of
$20.0 million at December 31, 2008.
- •
- Reductions in receivables resulted in a source of cash of approximately $30.4 million in 2009, while increases in receivables resulted in a use of cash of approximately $0.5 million in 2008. As compared to 2008, fourth quarter 2009 sales decreased approximately 10%, while the gross level of accounts
49
- •
- For the year ended December 31, 2009, we reduced our investment in inventory by approximately $41.8 million,
consistent with our management strategy to reduce overall inventory levels and to better align levels with the current lower end market demand. For the year ended December 31, 2008, we used
approximately $8.7 million of cash relative to our investment in inventory.
- •
- During 2009 and 2008, accounts payable and accrued liabilities resulted in a net use of cash of approximately
$11.4 million and $13.9 million, respectively. During 2009, the reduction in accounts payable and accrued liabilities resulted from the continued lowering our inventory purchases to
align our inventory levels with end market demand. During 2008, the relative level of accounts payables and accrued liabilities declined as the Company reduced levels of manufacturing and purchasing
activity in response to an abrupt slowdown in order activity experienced during the fourth quarter of 2008.
- •
- Management of prepaid expenses and other assets resulted in a source of cash of approximately $7.0 million and $3.5 million in 2009 and 2008, respectively, primarily as a result of ongoing initiatives to reduce the relative level of investment in manufacturing supplies, spare parts and tooling assets.
receivable at December 31, 2009 declined approximately 25% from December 31, 2008. The additional source of cash in 2009 resulted from our successful cash collection efforts, as we were able to reduce our days sales in receivables by approximately 14 days from 2008 yearend levels.
Net cash provided by investing activities for the year ended December 31, 2009 was approximately $9.1 million, as compared to net cash used of $33.4 million for the year ended December 31, 2008. During 2009, we generated approximately $23.2 million of cash from business and asset dispositions, primarily related to the sale of our specialty laminates, jacketings and insulation tapes line of business. We also incurred approximately $14.1 million in capital expenditures to support certain of our growth initiatives, most notably in our Packaging segment. We decreased our capital expenditure spending levels from 2008 ($29.2 million) and historical levels (typically around 3% of net sales) in response to the current economic recession, choosing to utilize cash to pay down long-term debt. In 2008, we paid approximately $3.2 million for the acquisition of Parkside Towbars, net of cash acquired, and paid approximately $3.4 million of additional purchase price in connection with earn-out clauses related to prior year acquisitions. We also received approximately $2.4 million in cash related to asset dispositions in 2008.
Net cash used by financing activities in 2009 was approximately $87.1 million, as compared to net cash provided by financing activities of approximately $1.3 million for 2008. During the first three quarters of 2009, we used approximately $43.8 million of available cash to retire $73.2 million face value of our 97/8% senior subordinated notes due 2012 via open market purchases. During the fourth quarter of 2009, we refinanced our long-term debt, amending and extending our credit facility, retiring our senior subordinated notes and issuing new senior secured notes, paying approximately $16.7 million in fees and expenses for the entire refinance. In conjunction with our debt refinance, we reduced the total amount of senior notes outstanding by approximately $11.6 million. In addition, in both 2009 and 2008, we relied upon our revolving credit facility as the primary source of funding our working capital requirements, as it was our lowest cost source of borrowing. We reduced our borrowings on our revolving credit facilities in 2009 by approximately $10.1 million, due primarily to lower cash requirements, as compared with increasing borrowings by approximately $10.0 million in 2008 in support of our increased inventory levels as compared to 2007.
Although we have reported a net loss from continuing operations in 2008 and 2007, and had lower Adjusted EBITDA in four of our operating segments in 2009 compared to 2008, each of our operating segments was profitable before consideration of non-cash impairments and generated positive cash flows from operations. Beginning in the second half of 2008, we were impacted by the significant decline in the financial markets, continued uncertainty and lack of availability in the credit markets, and the economic recession in the U.S. and other major global economies. These impacts were most notable in our Cequent
50
reportable segment, whose end markets are more sensitive to declining consumer confidence and lack of credit availability, which impacted discretionary consumer spending. Although we experienced a continued decline in end markets in 2009 in all of our reportable segments, which has resulted in lower reported sales (20.7% reduction in 2009 compared to 2008) in all reportable segments and reduced earnings in all segments but Packaging, our businesses remain profitable before consideration of non-cash impairment charges and continue to generate positive cash flows from operations.
As more fully described in our "Key Factors and Risks Affecting our Reported Results," in response to the expected continuation of these end market conditions, we accelerated our Profit Improvement Plan, principally via restructuring within our Cequent segment, with the movement of production to lower-cost environments and the expansion of strategic sourcing initiatives. We also took actions to reduce fixed and variable spending and fixed headcount, and implemented reductions in working capital and capital expenditures in order to improve cash flows and lower our long-term debt. Our businesses also implemented commercial actions to protect and gain our market share through continued introduction of new and innovative products and by providing superior delivery and service to our customers. We believe that the actions we have implemented to-date and our future plans to reduce costs and generate additional cash flows have and will continue to substantially mitigate the impacts of declining consumer confidence, lack of credit availability and the economic recession.
Our Packaging and Cequent reportable segments experienced higher sales in the fourth quarter of 2009 than in the fourth quarter of 2008, signaling that these end markets may be stabilizing and allowing for more optimism for the future than in late 2008. We expect to continue to have challenges in all of our segments until the US economy recovers from existing recessionary forces, employment levels increase and consumer credit availability improves. However, we continue to improve our businesses' alignment with the current economic environment, focusing on working capital reductions and cost savings and productivity initiatives as a part of our Profit Improvement Plan, while still allowing for capital spending on strategic growth projects where prudent.
Our Debt and Other Commitments
During the fourth quarter of 2009, the Company amended and restated its credit facilities. Prior to the amendment and restatement, the credit facilities consisted of a $90.0 million revolving credit facility, a $60.0 million deposit-linked supplemental revolving credit facility and a $260.0 million term loan facility, of which $252.2 million was outstanding. Under the amended and restated credit facilities, the revolving credit facility was reduced to $78.0 million, while the supplemental revolving credit facility and term loan facility remained at $60.0 million and $252.2 million, respectively (collectively, the Amended and Restated Credit Agreement or "ARCA"). Under the ARCA, the Company extended the maturity of $70.0 million of its revolving credit facility until December 15, 2013, and the maturity of $226.3 million of its term loan until December 15, 2015. The maturity date of $8.0 million of its revolving credit facility and the $60.0 million deposit-linked supplemental revolving credit facility remained at August 2, 2011, and the maturity date of $25.9 million of its term loan remained at August 2, 2013. At December 31, 2009, approximately $251.6 million was outstanding on the term loan and $5.1 million was outstanding on the revolving credit facilities. Under the ARCA, up to $25.0 million of our revolving credit facility in the aggregate is available in 2010 to be used for one or more permitted acquisitions subject to certain conditions and other outstanding borrowings and issued letters of credit.
Amounts drawn under our revolving credit facilities fluctuate daily based upon our working capital and other ordinary course needs. Availability under our revolving credit facilities depends upon, among other things, compliance with our credit agreement's financial covenants. Our credit facilities contain negative and affirmative covenants and other requirements affecting us and our subsidiaries, including among others: restrictions on incurrence of debt (except for permitted acquisitions and subordinated indebtedness), liens, mergers, investments, loans, advances, guarantee obligations, acquisitions, asset dispositions, sale-leaseback transactions, hedging agreements, dividends and other restricted junior
51
payments, stock repurchases, transactions with affiliates, restrictive agreements and amendments to charters, by-laws, and other material documents. The terms of our credit agreement require us and our subsidiaries to meet certain restrictive financial covenants and ratios computed quarterly, including a leverage ratio (total consolidated indebtedness plus outstanding amounts under the accounts receivable securitization facility over consolidated EBITDA, as defined), interest expense coverage ratio (consolidated EBITDA, as defined, over cash interest expense, as defined) and a capital expenditures covenant. The most restrictive of these financial covenants are the leverage ratio and interest expense coverage ratio. Our permitted leverage ratio under the ARCA is 4.50 to 1.00 as of December 31, 2009, 5.00 to 1.00 for January 1, 2010 to March 31, 2010, 5.25 to 1.00 for April 1, 2010 to June 30, 2010, 5.00 to 1.00 for July 1, 2010 to December 31, 2010, 4.75 to 1.00 for January 1, 2011 to June 30, 2011, 4.50 to 1.00 for July 1, 2011 to September 30, 2011, 4.25 to 1.00 for October 1, 2011 to September 30, 2012, 4.00 to 1.00 for October 1, 2012 to June 30, 2013 and 3.25 to 1.00 from July 1, 2013 and thereafter. Our actual leverage ratio was 3.68 to 1.00 at December 31, 2009. Our permitted interest expense coverage ratio under the ARCA is 2.20 to 1.00 as of December 31, 2009, 2.30 to 1.00 for January 1, 2010 to March 31, 2010, 2.15 to 1.00 for April 1, 2010 to June 30, 2010, 2.00 to 1.00 for July 1, 2010 to June 30, 2011, 2.25 to 1.00 for July 1, 2011 to June 30, 2012, 2.40 to 1.00 for July 1, 2012 to December 31, 2012, 2.50 to 1.00 for January 1, 2013 to September 30, 2013 and 2.75 to 1.00 for October 1, 2013 and thereafter. Our actual interest expense coverage ratio was 3.13 to 1.00 at December 31, 2009. At December 31, 2009, we were in compliance with our financial covenants.
The following is a reconciliation of net loss, as reported, which is a GAAP measure of our operating results, to Consolidated Bank EBITDA, as defined in our credit agreement, for the year ended December 31, 2009.
| |
Year ended December 31, 2009 |
||||
|---|---|---|---|---|---|
| |
(dollars in thousands) |
||||
Net loss, as reported |
$ | (220 | ) | ||
Bank stipulated adjustments: |
|||||
Interest expense, net (as defined) |
45,720 | ||||
Income tax benefit(1) |
(520 | ) | |||
Depreciation and amortization |
43,940 | ||||
Extraordinary non-cash charges(2) |
3,270 | ||||
Monitoring fees(3) |
2,890 | ||||
Interest equivalent costs(4) |
1,530 | ||||
Non-cash expenses related to stock option grants(5) |
1,370 | ||||
Other non-cash expenses or losses |
3,570 | ||||
Non-recurring expenses or costs for cost savings projects(6) |
10,940 | ||||
Debt extinguishment costs(7) |
11,400 | ||||
Negative EBITDA from discontinued operations(8) |
3,720 | ||||
Permitted dispositions(9) |
12,130 | ||||
Consolidated Bank EBITDA, as defined |
$ | 139,740 | |||
52
| |
December 31, 2009 | |||
|---|---|---|---|---|
| |
(dollars in thousands) |
|||
Total long-term debt |
$ | 514,550 | ||
Aggregate funding under the receivables securitization facility |
— | |||
Total Consolidated Indebtedness, as defined |
$ | 514,550 | ||
Consolidated Bank EBITDA, as defined |
$ | 139,740 | ||
Actual leverage ratio |
3.68 | x | ||
Covenant requirement |
4.50 | x | ||
Interest expense, as reported |
45,720 | |||
Interest equivalent costs from receivables financing |
1,530 | |||
Interest income |
(310 | ) | ||
Noncash amounts attributable to amortization of financing costs |
(2,240 | ) | ||
Total Consolidated Cash Interest Expense, as defined |
$ | 44,700 | ||
Consolidated Bank EBITDA, as defined |
$ | 139,740 | ||
Actual interest expense ratio |
3.13 | x | ||
Covenant requirement |
2.20 | x | ||
- (1)
- Amount
includes tax (expense) benefits associated with discontinued operations.
- (2)
- Non-cash
charges associated with tangible and intangible asset impairments, including goodwill.
- (3)
- Represents
management fees and expenses paid to Heartland and/or its affiliates pursuant to the Heartland Advisory Agreement.
- (4)
- Interest-equivalent
costs associated with the Company's receivables securitization facility.
- (5)
- Non-cash
expenses resulting from the grant of restricted shares of common stock and common stock options.
- (6)
- Non-recurring
costs and expenses relating to cost savings projects, including restructuring and severance expenses, not to exceed
$32,000,000 in the aggregate, subsequent to October 1, 2009.
- (7)
- Costs
incurred in connection with amending and restating our credit facilities, issuance of our 93/4% senior secured notes and
the retirement of our 97/8%senior subordinated notes.
- (8)
- Not
to exceed $10,000,000 in any fiscal year.
- (9)
- EBITDA from permitted dispositions, as defined.
Three of our international businesses are also parties to loan agreements with banks, denominated in their local currencies.
In the United Kingdom, we are party to a revolving debt agreement with a bank in the amount of £1.0 million, At December 31, 2009, the balance outstanding under this agreement, which is secured by a letter of credit under our credit facilities, was approximately $0.8 million at an interest rate of 2.5%.
In Australia, we are party to a debt agreement with a bank in the amount of $23.0 million Australian dollars which expires December 31, 2010. At December 31, 2009, the balance outstanding under this agreement was approximately $11.7 million at an interest rate of 6.6%. Borrowings under this arrangement are secured by substantially all the assets of our local business which is also subject to financial and reporting covenants. Financial covenants include a capital adequacy ratio (tangible net worth over total tangible assets) and an interest coverage ratio (EBIT over gross interest cost) and we were in compliance with such covenants at December 31, 2009. In addition to the financial covenants there are other financial
53
restrictions such as: restrictions on dividend payments, U.S. parent loan repayments, negative pledge and undertakings with respect to related entities.
During the fourth quarter of 2009, we re-paid in full the $1.9 million balance outstanding under a loan agreement with a bank in Italy.
Another important source of liquidity is our $75.0 million accounts receivable facility, under which we have the ability to sell eligible accounts receivable to a third-party multi-seller receivables funding company. Through December 28, 2009, we were party to a 364-day accounts receivable facility through TSPC, Inc. ("TSPC"), a wholly-owned subsidiary, to sell trade accounts receivable of substantially all of our domestic business operations. On December 29, 2009, we entered into a new three year accounts receivable facility through TSPC. This facility replaced our existing 364-day facility, which was due in February 2010. Our new three year facility increased the level of committed funding from $55.0 million to $75.0 million. As of December 31, 2009, we had no amounts funded under the facility with $32.1 million available but not utilized.
At December 31, 2009, our available revolving credit capacity of $138.0 million under our credit facility was reduced by approximately $31.2 million of letters of credit outstanding as of that date. The letters of credit are used for a variety of purposes, including support of certain operating lease agreements, vendor payment terms and other subsidiary operating activities, and to meet various states' requirements to self-insure workers' compensation claims, including incurred but not reported claims. After consideration of outstanding letters of credit and $5.1 million outstanding under our revolving credit facility at December 31, 2009, we had $101.7 million of revolving credit capacity available, in addition to $32.1 million of available liquidity under our accounts receivable facility discussed above. However, after consideration of our leverage covenant, we had aggregate available funding under our revolving credit and accounts receivable facilities of $114.3 million at December 31, 2009.
Our available revolving credit capacity under our credit facility, after consideration of approximately $31.2 million in letters of credit outstanding related thereto, is approximately $106.8 million, while our available liquidity under our accounts receivable securitization facility ranges from $38.0 million to $75.0 million, depending on the level of our receivables outstanding at a given point in time during the year. We rely upon our cash flow from operations and available liquidity under our revolving credit and accounts receivable facilities to fund our debt service obligations and other contractual commitments, working capital and capital expenditure requirements. Generally, we use available liquidity under these facilities to fund capital expenditures and daily working capital requirements during the first half of the year, as we experience some seasonality in our Cequent operating segment. Sales of towing and trailering products within this segment are generally stronger in the second and third quarters, as original equipment manufacturers (OEMs), distributors and retailers acquire product for the spring and summer selling seasons. None of our other operating segments experience any significant seasonal fluctuations in their respective businesses. During the second half of the year, the investment in working capital is reduced and amounts outstanding under our credit and securitization facilities are paid down. At the end of each quarter, we generally use cash on hand to pay down amounts outstanding under our revolving credit and accounts receivable facilities.
Cash management related to our revolving credit and accounts receivable facilities is centralized. We monitor our cash position and available liquidity on a daily basis and forecast our cash needs on a weekly basis within the current quarter and on a monthly basis outside the current quarter over the remainder of the year. Our business and related cash forecasts are updated monthly. Given aggregate available funding under our revolving credit and accounts receivable facilities of $114.3 million at December 31, 2009, after consideration of the aforementioned leverage restrictions, and based on forecasted cash sources and requirements inherent in our business plans, we believe that our liquidity and capital resources, including anticipated cash flows from operations, will be sufficient to meet our debt service, capital expenditure and other short-term and long-term obligation needs for the foreseeable future.
54
During the fourth quarter of 2009, the Company issued $250.0 million principal amount of 93/4% senior secured notes due 2017 ("Senior Notes") at a discount of $5.0 million. The Senior Notes were issued in a private placement under Rule 144A of the Securities Act of 1933, as amended. The net proceeds of the offering of approximately $239.7 million, together with $29.3 million of cash on hand, were used to repurchase $256.5 million principal amount of the Company's 97/8% senior subordinated notes due 2012 ("Sub Notes"), to pay tender costs and expenses related to repurchase of the Sub Notes, and to pay fees and expenses related to issuance of the Senior Notes. The tender costs, fees and expenses for both the Sub Notes and Senior Notes amounted to approximately $12.5 million, of which $6.5 million were deferred as debt issuance costs in the accompanying consolidated balance sheet and $6.0 million were included as a reduction in the net gain on extinguishment of debt line item in the accompanying statement of operations. Interest on the Senior Notes accrues at the rate of 9.75% per annum and is payable semi-annually in arrears on June 15 and December 15.
The Senior Notes are general senior secured obligations of the Company and are pari passu in right of payment with all existing and future indebtedness of the Company that is not subordinated in right of payment to the Senior Notes.
Prior to December 15, 2012, the Company may redeem up to 35% of the principal amount of Senior Notes at a redemption price equal to 109.750% of the principal amount, plus accrued and unpaid interest to the applicable redemption date plus additional interest, if any, with the net cash proceeds of one or more equity offerings, provided that at least 65% of the original principal amount of Senior Notes issued remains outstanding after such redemption, and provided further that each such redemption occurs within 90 days of the date of closing of each such equity offering.
During the first three quarters of 2009, the Company utilized approximately $43.8 million of cash on hand to retire $73.2 million of face value of Sub Notes, resulting in a net gain of approximately $28.3 million, after considering non-cash debt extinguishment costs of $1.1 million.
Principal payments required under our amended and restated credit facility term loan are: $0.7 million due each calendar quarter through September 30, 2015; $24.9 million due August 2, 2013 relative to term loan amounts not extended, and; $211.7 million due on December 15, 2015.
Our credit facility is guaranteed on a senior secured basis by us and all of our domestic subsidiaries, other than our special purpose receivables subsidiary, on a joint and several basis. In addition, our obligations and the guarantees thereof are secured by substantially all the assets of us and the guarantors.
Our exposure to interest rate risk results from variable rates under our credit facility. Borrowings under our credit facility bear interest at various rates some of which are subject to a 2% LIBOR-floor, as more fully described in Note 12, "Long-term Debt," to the accompanying 2009 consolidated financial statements.
At December 31, 2009, LIBOR approximated .25%. Based on our variable rate-based borrowings outstanding at December 31, 2009, and after consideration of the 2% LIBOR-floor applicable to $53.8 million of our supplemental revolving credit facility and $225.7 million of our term loan, a 1% increase in the per annum interest rate for borrowings under our U.S. and foreign credit facilities would increase our interest expense by approximately $ 0.5 million annually. The impact of a further decrease in LIBOR on our annual interest expense would not be material.
In February 2008, the Company had entered into a interest rate swap agreement to fix the LIBOR-based variable portion of its interest rate on $125.0 million notional amount of its term loan facility at 2.73%. In January 2009, the company entered into two additional interest rate swap agreements. The first of these swaps was effective in January 2009 and fixed the LIBOR-based variable portion of the interest rate on $75.0 million notional amount of its term loan facility at 1.39% through January 2011. The second of these swaps was effective in October 2009 upon the maturity of the February 2008 interest rate swap, and fixed the LIBOR-based variable portion of the interest rate on $125.0 million notional amount of its
55
term loan facility at 1.91% through July 2011. The Company formally designated these swap agreements as cash flow hedges upon entry into the contracts and expected them to be highly effective in offsetting fluctuations in the designated interest payments resulting from changes in the benchmark interest rate. However, upon the Company's amendment and restatement of its credit facilities, the Company determined that these interest rate swaps were no longer effective economic hedges due to the imposition of a LIBOR floor in the determination of the variable interest rate and de-designated the hedges.
We have other cash commitments related to leases. We account for these lease transactions as operating leases and annual rent expense for continuing operations related thereto approximated $14.7 million. We expect to continue to utilize leasing as a financing strategy in the future to meet capital expenditure needs and to reduce debt levels.
In addition to rent expense from continuing operations, we also have approximately $2.3 million in annual future lease obligations related to businesses that have been discontinued, of which approximately 61% relates to the facility for the former specialty laminates, jacketings and insulation tapes line of business (which extends through 2024), 33% relates to the Wood Dale facility in the former industrial fastening business (which extends through 2022) and 6% relates to the facility in our medical device line of business (which extends through 2012).
Market Risk
We conduct business in various locations throughout the world and are subject to market risk due to changes in the value of foreign currencies. We do not currently use derivative financial instruments to manage these risks. The functional currencies of our foreign subsidiaries are the local currency in the country of domicile. We manage these operating activities at the local level and revenues and costs are generally denominated in local currencies; however, results of operations and assets and liabilities reported in U.S. dollars will fluctuate with changes in exchange rates between such local currencies and the U.S. dollar.
Common Stock
We voluntarily transferred our stock exchange listing in the U.S. from The New York Stock Exchange to the NASDAQ Global MarketSM effective August 24, 2009. Our stock continues to trade under the symbol "TRS".
Off-Balance Sheet Arrangements
Through December 28, 2009, we were party to a 364-day accounts receivable facility to sell, on an ongoing basis, the trade accounts receivable of certain business operations to our wholly-owned, bankruptcy-remote, special purpose subsidiary, TSPC. Subject to certain conditions, TSPC could from time to time sell an undivided fractional ownership interest in the pool of domestic receivables, up to approximately $55.0 million, to a third party multi-seller receivables funding company, or conduit. The proceeds of the sale were less than the face amount of accounts receivable sold by an amount that approximated the cost of funds under the facility which was equal to a commercial paper-based rate plus a usage fee of 4.5%. On December 29, 2009, we entered into a new three year accounts receivable facility through TSPC. This facility replaced our existing 364-day facility, which was due in February 2010. Our new three year facility is an important source of liquidity and increased the level of committed funding from $55.0 million to $75.0 million, at a cost of funds equal to LIBOR plus a usage fee of 3.25%. As of December 31, 2009, we had no amounts funded under the facility and $32.1 million available but not utilized, based on eligible receivables and before consideration of leverage restrictions. Effective January 1, 2010, based on changes in the accounting literature governing receivables sales, we believe that any amounts funded under facility will be on-balance sheet. In future periods, if we are unable to renew or replace this facility, it could materially and adversely affect our liquidity.
56
Commitments and Contingencies
Under various agreements, we are obligated to make future cash payments in fixed amounts. These include payments under our long-term debt agreements, rent payments required under operating lease agreements for 19 facilities and certain capital equipment, our allocable share of certain compensation and benefit obligations to Metaldyne and principal and interest obligations on our senior secured term loan and Senior Notes. Interest on the extended term loans is based on LIBOR plus 400 basis points per annum with a 2.00% LIBOR floor, and interest on the non-extended term loans is based on LIBOR plus 225 basis points, which equaled 6.0% and 2.5%, at December 31, 2009, respectively. These rates were used to estimate our future interest obligations with respect to the term loan included in the table below.
The following table summarizes our expected fixed cash obligations over various future periods related to these items as of December 31, 2009.
| |
Payments Due by Periods (dollars in thousands) | |||||||||||||||||
|---|---|---|---|---|---|---|---|---|---|---|---|---|---|---|---|---|---|---|
| |
Total | Less than One Year |
1 - 3 Years | 3 - 5 Years | More than 5 Years |
|||||||||||||
Contractual cash obligations: |
||||||||||||||||||
Long-term debt |
$ | 519,570 | $ | 20,390 | $ | 5,390 | $ | 30,110 | $ | 463,680 | ||||||||
Lease obligations |
135,860 | 15,850 | 29,290 | 24,050 | 66,670 | |||||||||||||
Benefit obligations |
5,860 | 350 | 700 | 710 | 4,100 | |||||||||||||
Interest obligations: |
||||||||||||||||||
Term loan |
77,650 | 14,100 | 27,760 | 26,230 | 9,560 | |||||||||||||
Senior secured notes |
194,610 | 24,380 | 48,750 | 48,750 | 72,730 | |||||||||||||
Total contractual obligations |
$ | 933,550 | $ | 75,070 | $ | 111,890 | $ | 129,850 | $ | 616,740 | ||||||||
As of December 31, 2009, we had a $78.0 million revolving credit facility (subsequently increased to $83.0 million on January 13, 2010), a $60.0 million deposit-linked supplemental revolving credit facility and a $75.0 million accounts receivable facility. Throughout the year, outstanding balances under these facilities fluctuate and we incur additional interest (or, in the case of the accounts receivable facility, interest-like charges) obligations on such variable outstanding debt.
As of December 31, 2009, we are contingently liable for standby letters of credit totaling $31.2 million issued on our behalf by financial institutions under our credit facilities. These letters of credit are used for a variety of purposes, including to support certain operating lease agreements, vendor payment terms and other subsidiary operating activities, and to meet various states' requirements to self-insure workers' compensation claims, including incurred but not reported claims.
Credit Rating
We and certain of our outstanding debt obligations are rated by Standard & Poor's and Moody's. On December 19, 2009, Moody's assigned a rating of Caa1 to our senior secured notes, improved the outlook from negative to stable, and affirmed our corporate family and senior secured credit rating at B3 and B1, respectively. On December 16, 2009, Standard & Poor's assigned a rating of B- to our senior secured notes, affirmed our credit facilities and corporate credit ratings of BB and B+ respectively, but maintained a negative outlook. If our credit ratings were to decline, our ability to access certain financial markets may become limited, the perception of us in the view of our customers, suppliers and security holders may worsen and as a result, we may be adversely affected.
Outlook
Although 2009 represented a period of very weak global economic activity as a result of the recession in the United States and other major markets around the world, we were able to accomplish several
57
significant initiatives that were critical to reducing costs in our businesses, improving our liquidity and strengthening our capital structure, including:
- •
- Business restructuring and other cost reduction activities which resulted in $32 million of realized cost savings
in 2009.
- •
- Generated cash flows from operating activities of $83.5 million.
- •
- Generated $23.2 million of cash flows from disposition of business and other assets.
- •
- Refinanced our debt capital structure and reduced long-term debt and amounts outstanding under our receivables securitization facility by $115.4 million compared to the prior year.
Although we anticipate 2010 will again be a challenging year, we believe the actions completed in 2009 position us for even more profitable future growth and place us in a better competitive position by enabling strategies focused on reduced cycle times and securing our position as best cost producer. Among our top priorities for 2010 are continuing to identify and execute on cost savings and productivity initiatives, to grow revenue via new products and expand our core products in non-U.S. markets, to continue to reduce our debt leverage and to increase our available liquidity. The refinance of our debt structure in 2009 significantly pushed out debt maturities and modified financial covenants to improve operating flexibility, providing additional liquidity to execute on these business strategies. However, significant deterioration in general economic conditions would adversely impact our anticipated revenue growth and financial performance.
Impact of New Accounting Standards
In June 2009, the Financial Accounting Standards Board ("FASB") issued amended guidance related to the transfer of financial assets. The new guidance, listed under Accounting Standards Codification ("ASC") Topic 860, "Transfers and Servicing," requires more information about transfers of financial assets, including securitization transactions, and where companies have continuing exposure to the risk related to transferred financial assets. ASC Topic 860 eliminates the concept of a qualifying special purpose entity, changes the requirements for derecognizing financial assets and requires additional disclosure. This standard will be effective for our first quarter of 2010. When this standard is adopted, we anticipate that amounts outstanding under our receivables securitization facility will be on-balance sheet and included in receivables, net and long-term debt in our consolidated balance sheet. We had $0 million and $20.0 million outstanding under our receivables securitization facility as of December 31, 2009 and 2008, respectively.
In June 2009, the FASB issued amended guidance related to consolidation of variable interest entities. The new guidance, listed under ASC Topic 810, "Consolidation," changes how a reporting entity determines when a variable interest entity should be consolidated. It also requires additional disclosures about its involvement with variable interest entities and any significant changes in risk exposure due to that involvement. This standard is effective for our interim and annual periods ending after January 1, 2010. We are currently assessing the impact of this standard on our consolidated financial statements.
In December 2008, the FASB issued amended guidance relating to the disclosure of employers' postretirement benefit plan assets. The new guidance, which is now part of ASC Topic 715, "Compensation—Retirement Benefits," requires more detailed disclosures about employers' pension plan assets. New disclosures include additional information on investment strategies, major categories of plan assets, concentrations of risk within plan assets and valuation techniques used to measure the fair value of plan assets. We adopted the new guidance in the fourth quarter of 2009 by expanding our disclosures in Note 17 in the accompanying financial statements.
58
Critical Accounting Policies
The following discussion of accounting policies is intended to supplement the accounting policies presented in our audited financial statements included elsewhere in this Form 10K. Certain of our accounting policies require the application of significant judgment by management in selecting the appropriate assumptions for calculating financial estimates. By their nature, these judgments are subject to an inherent degree of uncertainty. These judgments are based on our historical experience, our evaluation of business and macroeconomic trends, and information from other outside sources, as appropriate.
Receivables. Receivables are presented net of allowances for doubtful accounts of approximately $5.7 million at December 31, 2009. We monitor our exposure for credit losses and maintain adequate allowances for doubtful accounts. We determine these allowances based on our historical write-off experience and/or specific customer circumstances and provide such allowances when amounts are reasonably estimable and it is probable a loss has been incurred. We do not have concentrations of accounts receivable with a single customer or group of customers and do not believe that significant credit risk exists due to our diverse customer base. Trade accounts receivable of substantially all domestic business operations may be sold, on an ongoing basis, to TSPC.
Depreciation and Amortization. Depreciation is computed principally using the straight-line method over the estimated useful lives of the assets. Annual depreciation rates are as follows: buildings and buildings/land improvements, 10 to 40 years, and machinery and equipment, 3 to 15 years. Capitalized debt issuance costs are amortized over the underlying terms of the related debt securities. Customer relationship intangibles are amortized over periods ranging from 5 to 25 years, while technology and other intangibles are amortized over periods ranging from 1 to 30 years.
Impairment of Long-Lived Assets and Definite-Lived Intangible Assets. We review, on at least a quarterly basis, the financial performance of each business unit for indicators of impairment. In reviewing for impairment indicators, we also consider events or changes in circumstances such as business prospects, customer retention, market trends, potential product obsolescence, competitive activities and other economic factors. An impairment loss is recognized when the carrying value of an asset group exceeds the future net undiscounted cash flows expected to be generated by that asset group. The impairment loss recognized is the amount by which the carrying value of the asset group exceeds its fair value.
Goodwill and Indefinite-Lived Intangibles. We test goodwill and indefinite-lived intangible assets for impairment on an annual basis as of October 1, by comparing the estimated fair value of each of our reporting units and indefinite-lived intangible assets to the respective carrying value on our balance sheet. More frequent evaluations may be required if we experience changes in our business climate or as a result of other triggering events that take place. If carrying value exceeds fair value, a possible impairment exists and further evaluation is performed.
For the purposes of the goodwill impairment test, one of our five operating segments, Cequent, is considered a reporting unit because the individual businesses within this segment have similar economic characteristics, including their products, services, customers, and distribution. The eight businesses which comprise our remaining four operating segments are considered separate reporting units for purposes of the impairment test. These businesses are less similar in their economic characteristics and have discrete financial information available which management regularly reviews for purposes of evaluating performance.
We estimate the fair value of our reporting units utilizing a combination of three valuation techniques: discounted cash flow (Income Approach), market comparable method (Market Approach) and market capitalization (Direct Market Data Method). The Income Approach is based on management's operating budget and internal five-year forecast. This approach utilizes forward-looking assumptions and projections, but considers factors unique to each of our businesses and related long-range plans that may not be comparable to other companies and that are not yet publicly available. The Market Approach considers
59
potentially comparable companies and transactions within the industries where our reporting units participate, and applies their trading multiples to our reporting units. This approach utilizes data from actual marketplace transactions, but reliance on its results is limited by difficulty in identifying companies that are specifically comparable to our reporting units, considering the diversity of our businesses, their relative sizes and levels of complexity. We also use the Direct Market Data Method by comparing our book value and the estimates of fair value of the reporting units to our market capitalization as of and at dates near the annual testing date. Management uses this comparison as additional evidence of the fair value of the Company, as its market capitalization may be suppressed by other factors such as the control premium associated with a controlling shareholder, the Company's high degree of leverage, and the limited float of our common stock. Management evaluates and weights the results based on a combination of the Income and Market Approaches, and, in situations where the Income Approach results differ significantly from the Market and Direct Market Data Approaches, management re-evaluates and adjusts, if necessary, its assumptions.
The Income Approach requires us to calculate the present value of estimated future cash flows. In making this calculation, management makes significant estimates regarding future revenues and expenses, projected capital expenditures, changes in working capital and the appropriate discount rate. The projections also include significant assumptions related to including current and estimated economic trends and outlook, costs of raw materials, consideration of our market capitalization as compared to the estimated fair values of our reporting units determined using the Income Approach and other factors which are beyond management's control.
We utilize the estimates of fair value determined under the Income Approach as the basis for our indefinite-lived intangible asset testing. Management utilizes the royalty relief method to estimate the fair value of its indefinite-lived intangible assets, basing the estimate on discounted future cash flows related to the net amount of royalty expenses avoided due to the existence of the trademark or tradename. Management then compares the estimated fair value to the carrying value. If carrying value exceeds fair value, an impairment charge is recorded.
Prior to 2008, our accounting policy was to conduct the annual impairment test as of December 31st; however, effective in the second quarter of 2008, we changed our accounting policy to conduct the annual impairment test as of October 1st, with the testing to be conducted during the fourth quarter of each year. This change is preferable as it provides us additional time to complete the required testing and evaluate the results prior to the year-end closing and reporting activities and better enables us to comply with required reporting dates as an accelerated filer. The change in impairment test dates had no impact on our financial results or financial position for any period presented.
Future declines in sales and/or operating profit, declines in our stock price, or other changes in our business or the markets for our products could result in further impairments of goodwill and other intangible assets.
Pension and Postretirement Benefits Other than Pensions. Annual net periodic expense and accrued benefit obligations recorded with respect to our defined benefit plans are determined on an actuarial basis. We determine assumptions used in the actuarial calculations which impact reported plan obligations and expense, considering trends and changes in the current economic environment in determining the most appropriate assumptions to utilize as of our measurement date. Annually, we review the actual experience compared to the most significant assumptions used and make adjustments to the assumptions, if warranted. The healthcare trend rates are reviewed with the actuaries based upon the results of their review of claims experience. Discount rates are based upon an expected benefit payments duration analysis and the equivalent average yield rate for high-quality fixed-income investments. Pension benefits are funded through deposits with trustees and the expected long-term rate of return on fund assets is based upon actual historical returns modified for known changes in the market and any expected change in investment policy. Postretirement benefits are not funded and our policy is to pay these benefits as they
60
become due. Certain accounting guidance, including the guidance applicable to pensions, does not require immediate recognition of the effects of a deviation between actual and assumed experience or the revision of an estimate. This approach allows the favorable and unfavorable effects that fall within an acceptable range to be netted.
Income Taxes. We compute income taxes using the asset and liability method, whereby deferred income taxes using current enacted tax rates are provided for the temporary differences between the financial reporting basis and the tax basis of assets and liabilities and for operating loss and tax credit carryforwards. We determine valuation allowances based on an assessment of positive and negative evidence on a jurisdiction-by-jurisdiction basis and record a valuation allowance to reduce deferred tax assets to the amount more likely than not to be realized. Recognized income tax positions are measured at the largest amount that is greater than 50% likely of being realized. Changes in recognition or measurement are reflected in the period in which the change in judgment occurs. We record interest and penalties related to unrecognized tax benefits in income tax expense.
Derivative Financial Instruments. Derivative financial instruments are recorded at fair value on the balance sheet as either assets or liabilities. The effective portion of changes in the fair value of derivatives which qualify for hedge accounting is recorded in other comprehensive income and is recognized in the statement of operations when the hedged item affects earnings. The ineffective portion of the change in fair value of a hedge is recognized in income immediately. We have historically entered into interest rate swaps to hedge cash flows associated with variable rate debt.
Other Loss Reserves. We have other loss exposures related to environmental claims, asbestos claims and litigation. Establishing loss reserves for these matters requires the use of estimates and judgment in regard to risk exposure and ultimate liability. We are generally self-insured for losses and liabilities related principally to workers' compensation, health and welfare claims and comprehensive general, product and vehicle liability. Generally, we are responsible for up to $0.5 million per occurrence under our retention program for workers' compensation, between $0.3 million and $2.0 million per occurrence under our retention programs for comprehensive general, product and vehicle liability, and have a $0.3 million per occurrence stop-loss limit with respect to our self-insured group medical plan. We accrue loss reserves up to our retention amounts based upon our estimates of the ultimate liability for claims incurred, including an estimate of related litigation defense costs, and an estimate of claims incurred but not reported using actuarial assumptions about future events. We accrue for such items in accordance with the Contingencies Topic of the FASB Accounting Standards Codification when such amounts are reasonably estimable and probable. We utilize known facts and historical trends, as well as actuarial valuations in determining estimated required reserves. Changes in assumptions for factors such as medical costs and actual experience could cause these estimates to change significantly.
Item 7A. Quantitative and Qualitative Disclosures About Market Risk
In the normal course of business, we are exposed to market risk associated with fluctuations in foreign currency exchange rates, commodity prices, insurable risks due to property damage, employee and liability claims, and other uncertainties in the financial and credit markets, which may impact demand for our products. We are also subject to interest risk as it relates to long-term debt, for which we have historically and plan to prospectively employ derivative instruments such as interest rate swaps to mitigate the risk of variable interest rates. See Item 7. "Management's Discussion and Analysis of Financial Condition and Results of Operations" for details about our primary market risks, and the objectives and strategies used to manage these risks. Also see Note 12, "Long-term Debt," in the notes to the financial statements for additional information.
61
Item 8. Financial Statements and Supplementary Data
REPORT OF INDEPENDENT REGISTERED PUBLIC ACCOUNTING FIRM
The
Board of Directors and Shareholders
TriMas Corporation:
We have audited the accompanying consolidated balance sheets of TriMas Corporation and subsidiaries as of December 31, 2009 and 2008, and the related consolidated statements of operations, shareholders' equity, and cash flows for each of the years in the three-year period ended December 31, 2009. In connection with our audits of the consolidated financial statements, we also have audited the financial statement schedule in the 2009 Annual Report on Form 10-K. These consolidated financial statements and the financial statement schedule are the responsibility of the Company's management. Our responsibility is to express an opinion on these consolidated financial statements and the financial statement schedule based on our audits.
We conducted our audits in accordance with the standards of the Public Company Accounting Oversight Board (United States). Those standards require that we plan and perform the audit to obtain reasonable assurance about whether the financial statements are free of material misstatement. An audit includes examining, on a test basis, evidence supporting the amounts and disclosures in the financial statements. An audit also includes assessing the accounting principles used and significant estimates made by management, as well as evaluating the overall financial statement presentation. We believe that our audits provide a reasonable basis for our opinion.
In our opinion, the consolidated financial statements referred to above present fairly, in all material respects, the financial position of TriMas Corporation and subsidiaries as of December 31, 2009 and 2008, and the results of their operations and their cash flows for each of the years in the three-year period ended December 31, 2009, in conformity with U.S. generally accepted accounting principles. Also in our opinion, the related financial statement schedule, when considered in relation to the basic consolidated financial statements taken as a whole, presents fairly, in all material respects, the information set forth therein.
We also have audited, in accordance with the standards of the Public Company Accounting Oversight Board (United States), TriMas Corporation's internal control over financial reporting as of December 31, 2009, based on criteria established in Internal Control—Integrated Framework issued by the Committee of Sponsoring Organizations of the Treadway Commission (COSO), and our report dated March 4, 2010 expressed an unqualified opinion on the effectiveness of the Company's internal control over financial reporting.
/s/ KPMG LLP
Detroit,
Michigan
March 4, 2010
62
TriMas Corporation
Consolidated Balance Sheet
(Dollars in thousands, except per share amounts)
| |
December 31, | ||||||||
|---|---|---|---|---|---|---|---|---|---|
| |
2009 | 2008 | |||||||
Assets |
|||||||||
Current assets: |
|||||||||
Cash and cash equivalents |
$ | 9,480 | $ | 3,910 | |||||
Receivables, net |
93,380 | 104,760 | |||||||
Inventories |
141,840 | 188,900 | |||||||
Deferred income taxes |
24,320 | 16,970 | |||||||
Prepaid expenses and other current assets |
6,500 | 7,430 | |||||||
Assets of discontinued operations held for sale |
4,250 | 32,030 | |||||||
Total current assets |
279,770 | 354,000 | |||||||
Property and equipment, net |
162,220 | 176,850 | |||||||
Goodwill |
196,330 | 202,280 | |||||||
Other intangibles, net |
164,080 | 177,820 | |||||||
Other assets |
23,380 | 19,270 | |||||||
Total assets |
$ | 825,780 | $ | 930,220 | |||||
Liabilities and Shareholders' Equity |
|||||||||
Current liabilities: |
|||||||||
Current maturities, long-term debt |
$ | 20,390 | $ | 10,360 | |||||
Accounts payable |
92,840 | 111,810 | |||||||
Accrued liabilities |
65,750 | 66,340 | |||||||
Liabilities of discontinued operations |
1,070 | 1,340 | |||||||
Total current liabilities |
180,050 | 189,850 | |||||||
Long-term debt |
494,160 | 599,580 | |||||||
Deferred income taxes |
42,590 | 51,650 | |||||||
Other long-term liabilities |
47,000 | 34,240 | |||||||
Total liabilities |
763,800 | 875,320 | |||||||
Preferred stock $0.01 par: Authorized 100,000,000 shares; |
— | — | |||||||
Common stock, $0.01 par: Authorized 400,000,000 shares; |
330 | 330 | |||||||
Paid-in capital |
528,370 | 527,000 | |||||||
Accumulated deficit |
(510,380 | ) | (510,160 | ) | |||||
Accumulated other comprehensive income |
43,660 | 37,730 | |||||||
Total shareholders' equity |
61,980 | 54,900 | |||||||
Total liabilities and shareholders' equity |
$ | 825,780 | $ | 930,220 | |||||
The accompanying notes are an integral part of these financial statements.
63
TriMas Corporation
Consolidated Statement of Operations
(Dollars in thousands, except per share amounts)
| |
Year ended December 31, | |||||||||||
|---|---|---|---|---|---|---|---|---|---|---|---|---|
| |
2009 | 2008 | 2007 | |||||||||
Net sales |
$ | 803,650 | $ | 1,013,820 | $ | 999,130 | ||||||
Cost of sales |
(594,830 | ) | (750,450 | ) | (726,630 | ) | ||||||
Gross profit |
208,820 | 263,370 | 272,500 | |||||||||
Selling, general and administrative expenses |
(150,200 | ) | (165,260 | ) | (173,350 | ) | ||||||
Estimated future unrecoverable lease obligations |
(5,250 | ) | — | — | ||||||||
Fees incurred under advisory services agreement |
(2,890 | ) | — | (10,000 | ) | |||||||
Costs for early termination of operating leases |
— | — | (4,230 | ) | ||||||||
Settlement of Canadian benefit plan liability |
— | — | (3,870 | ) | ||||||||
Net loss on dispositions of property and equipment |
(570 | ) | (340 | ) | (1,720 | ) | ||||||
Impairment of property and equipment |
— | (500 | ) | (3,370 | ) | |||||||
Impairment of goodwill and indefinite-lived intangible assets |
— | (166,610 | ) | (171,210 | ) | |||||||
Operating profit (loss) |
49,910 | (69,340 | ) | (95,250 | ) | |||||||
Other expense, net: |
||||||||||||
Interest expense |
(45,070 | ) | (55,740 | ) | (68,310 | ) | ||||||
Gain (loss) on extinguishment of debt |
17,990 | 3,740 | (7,440 | ) | ||||||||
Other expense, net |
(1,750 | ) | (2,260 | ) | (3,870 | ) | ||||||
Other expense, net |
(28,830 | ) | (54,260 | ) | (79,620 | ) | ||||||
Income (loss) from continuing operations before income tax benefit (expense) |
21,080 | (123,600 | ) | (174,870 | ) | |||||||
Income tax benefit (expense) |
(8,350 | ) | (470 | ) | 13,290 | |||||||
Income (loss) from continuing operations |
12,730 | (124,070 | ) | (161,580 | ) | |||||||
Income (loss) from discontinued operations, net of income tax benefit (expense) |
(12,950 | ) | (12,120 | ) | 3,150 | |||||||
Net loss |
$ | (220 | ) | $ | (136,190 | ) | $ | (158,430 | ) | |||
Earnings (loss) per share—basic: |
||||||||||||
Continuing operations |
0.38 | (3.71 | ) | (5.67 | ) | |||||||
Discontinued operations, net of income tax benefit |
(0.39 | ) | (0.36 | ) | 0.11 | |||||||
Net loss per share |
$ | (0.01 | ) | $ | (4.07 | ) | $ | (5.56 | ) | |||
Weighted average common shares—basic |
33,489,659 | 33,422,572 | 28,498,678 | |||||||||
Earnings (loss) per share—diluted: |
||||||||||||
Continuing operations |
0.37 | (3.71 | ) | (5.67 | ) | |||||||
Discontinued operations, net of income tax benefit |
(0.38 | ) | (0.36 | ) | 0.11 | |||||||
Net loss per share |
$ | (0.01 | ) | $ | (4.07 | ) | $ | (5.56 | ) | |||
Weighted average common shares—diluted |
33,892,170 | 33,422,572 | 28,498,678 | |||||||||
The accompanying notes are an integral part of these financial statements.
64
TriMas Corporation
Consolidated Statement of Cash Flows
(Dollars in thousands)
| |
Year ended December 31, | |||||||||||
|---|---|---|---|---|---|---|---|---|---|---|---|---|
| |
2009 | 2008 | 2007 | |||||||||
Cash Flows from Operating Activities: |
||||||||||||
Net loss |
$ | (220 | ) | $ | (136,190 | ) | $ | (158,430 | ) | |||
Adjustments to reconcile net loss to net cash provided by operating activities, net of acquisition impact: |
||||||||||||
Impairment of goodwill and indefinite-lived intangible assets |
930 | 184,530 | 171,210 | |||||||||
Impairment of property and equipment |
2,340 | 500 | 3,370 | |||||||||
(Gain) loss on dispositions of property and equipment |
570 | 70 | (630 | ) | ||||||||
Depreciation |
29,050 | 28,430 | 25,870 | |||||||||
Amortization of intangible assets |
14,890 | 15,640 | 15,480 | |||||||||
Amortization of debt issue costs |
2,240 | 2,450 | 2,700 | |||||||||
Deferred income taxes |
(5,950 | ) | (19,690 | ) | (9,480 | ) | ||||||
(Gain) loss on extinguishment of debt |
(24,500 | ) | (3,740 | ) | 2,500 | |||||||
Non-cash compensation expense |
580 | 1,040 | 550 | |||||||||
Net proceeds from (reductions in) sale of receivables and receivables securitization |
(15,550 | ) | (18,310 | ) | 25,980 | |||||||
(Increase) decrease in receivables |
30,400 | (480 | ) | (15,670 | ) | |||||||
(Increase) decrease in inventories |
51,780 | (8,740 | ) | (25,080 | ) | |||||||
Decrease in prepaid expenses and other assets |
7,010 | 3,490 | 12,540 | |||||||||
Increase (decrease) in accounts payable and accrued liabilities |
(11,440 | ) | (13,930 | ) | 13,690 | |||||||
Other, net |
1,380 | (3,900 | ) | 370 | ||||||||
Net cash provided by operating activities, net of acquisition impact |
83,510 | 31,170 | 64,970 | |||||||||
Cash Flows from Investing Activities: |
||||||||||||
Capital expenditures |
(14,060 | ) | (29,170 | ) | (34,730 | ) | ||||||
Acquisition of leased assets |
— | — | (29,960 | ) | ||||||||
Acquisition of businesses, net of cash acquired |
— | (6,650 | ) | (13,540 | ) | |||||||
Net proceeds from disposition of businesses and other assets |
23,190 | 2,440 | 9,320 | |||||||||
Net cash provided by (used for) investing activities |
9,130 | (33,380 | ) | (68,910 | ) | |||||||
Cash Flows from Financing Activities: |
||||||||||||
Proceeds from sale of common stock in connection with the Company's initial public offering, net of issuance costs |
— | — | 126,460 | |||||||||
Repayments of borrowings on senior credit facilities |
(4,840 | ) | (5,070 | ) | (4,940 | ) | ||||||
Proceeds from borrowings on term loan facilities |
— | 490 | — | |||||||||
Proceeds from borrowings on revolving credit facilities |
802,820 | 576,990 | 508,540 | |||||||||
Repayments of borrowings on revolving credit facilities |
(812,910 | ) | (566,970 | ) | (524,920 | ) | ||||||
Retirement of senior subordinated notes |
(300,390 | ) | (4,120 | ) | (100,000 | ) | ||||||
Proceeds on borrowings on senior secured notes |
244,980 | — | — | |||||||||
Debt refinance fees and expenses |
(16,730 | ) | — | — | ||||||||
Net cash provided by (used for) financing activities |
(87,070 | ) | 1,320 | 5,140 | ||||||||
Cash and Cash Equivalents: |
||||||||||||
Increase (decrease) for the year |
5,570 | (890 | ) | 1,200 | ||||||||
At beginning of year |
3,910 | 4,800 | 3,600 | |||||||||
At end of year |
$ | 9,480 | $ | 3,910 | $ | 4,800 | ||||||
Supplemental disclosure of cash flow information: |
||||||||||||
Cash paid for interest |
$ | 43,600 | $ | 52,660 | $ | 63,690 | ||||||
Cash paid for income taxes |
$ | 8,200 | $ | 8,060 | $ | 8,660 | ||||||
The accompanying notes are an integral part of these financial statements.
65
TriMas Corporation
Consolidated Statement of Shareholders' Equity
Years Ended December 31, 2009, 2008 and 2007
(Dollars in thousands)
| |
Common Stock |
Paid-In Capital |
Accumulated Deficit |
Accumulated Other Comprehensive Income (Loss) |
Total | ||||||||||||
|---|---|---|---|---|---|---|---|---|---|---|---|---|---|---|---|---|---|
Balances, December 31, 2006 |
$ | 210 | $ | 399,070 | $ | (215,220 | ) | $ | 48,720 | $ | 232,780 | ||||||
Comprehensive income (loss): |
|||||||||||||||||
Net loss |
— | — | (158,430 | ) | — | (158,430 | ) | ||||||||||
Foreign currency translation |
— | — | — | 8,900 | 8,900 | ||||||||||||
Defined pension and postretirement pension plans amortization of actuarial losses (net of tax of $0.6 million) |
— | — | — | 1,020 | 1,020 | ||||||||||||
Total comprehensive loss |
— | — | — | — | (148,510 | ) | |||||||||||
Net proceeds from the Company's initial |
|||||||||||||||||
public offering of common stock (Note 4) |
120 | 126,340 | — | — | 126,460 | ||||||||||||
Non-cash compensation expense |
— | 550 | — | — | 550 | ||||||||||||
Effects of accounting change regarding pension and post-retirement plans measurement dates pursuant to SFAS No. 158 (net of tax of $0.1 million) |
— | — | (200 | ) | — | (200 | ) | ||||||||||
Cumulative impact of change in accounting for benefit plans (net of tax of $1.2 million) |
— | — | — | (2,470 | ) | (2,470 | ) | ||||||||||
Cumulative impact of change in accounting for uncertainties in income taxes |
— | — | (120 | ) | (120 | ) | |||||||||||
Balances at December 31, 2007 |
$ | 330 | $ | 525,960 | $ | (373,970 | ) | $ | 56,170 | $ | 208,490 | ||||||
Comprehensive income (loss): |
|||||||||||||||||
Net loss |
— | — | (136,190 | ) | — | (136,190 | ) | ||||||||||
Foreign currency translation |
— | — | — | (17,810 | ) | (17,810 | ) | ||||||||||
Defined pension and postretirement pension plans (net of tax of $0.04 million) (Note 17) |
— | — | — | 90 | 90 | ||||||||||||
Change in fair value of cash flow hedge (net of tax of $0.4 million) (Note 13) |
— | — | — | (720 | ) | (720 | ) | ||||||||||
Total comprehensive loss |
— | — | — | — | (154,630 | ) | |||||||||||
Non-cash compensation expense |
— | 1,040 | — | — | 1,040 | ||||||||||||
Balances at December 31, 2008 |
$ | 330 | $ | 527,000 | $ | (510,160 | ) | $ | 37,730 | $ | 54,900 | ||||||
Comprehensive income (loss): |
|||||||||||||||||
Net loss |
— | — | (220 | ) | — | (220 | ) | ||||||||||
Foreign currency translation |
— | — | — | 7,620 | 7,620 | ||||||||||||
Defined pension and postretirement pension plans (net of tax of $0.5 million) (Note 17) |
— | — | — | (750 | ) | (750 | ) | ||||||||||
Changes in fair value of cash flow hedges (net of tax of $0.6 million) (Note 13) |
— | — | — | (940 | ) | (940 | ) | ||||||||||
Total comprehensive income |
— | — | — | — | 5,710 | ||||||||||||
Reclassification of compensation expense to be paid in restricted shares of common stock (Note 18) |
— | 790 | — | — | 790 | ||||||||||||
Non-cash compensation expense |
— | 580 | — | — | 580 | ||||||||||||
Balances at December 31, 2009 |
$ | 330 | $ | 528,370 | $ | (510,380 | ) | $ | 43,660 | $ | 61,980 | ||||||
The accompanying notes are an integral part of these financial statements.
66
TRIMAS CORPORATION
NOTES TO CONSOLIDATED FINANCIAL STATEMENTS
1. Basis of Presentation
TriMas Corporation ("TriMas" or the "Company"), and its consolidated subsidiaries, is a global manufacturer and distributor of products for commercial, industrial and consumer markets. The Company is principally engaged in five business segments with diverse products and market channels. Packaging offers a broad spectrum of closure and dispensing solutions in industrial and consumer packaging applications. Energy is a manufacturer and distributor of a variety of engines, engine replacement parts and specialty gaskets for the oil and gas industry, petrochemical and industrial markets. Aerospace & Defense designs and manufactures a diverse range of industrial products for use in focused markets within the aerospace and defense markets. Engineered Components designs and manufactures a diverse range of industrial products for use in focused markets within the industrial, automotive and medical equipment markets. Cequent is a manufacturer and distributor of custom-engineered towing, trailering and electrical products. See Note 19, "Segment Information," for further information on each of the Company's business segments.
2. New Accounting Pronouncements
In June 2009, the Financial Accounting Standards Board ("FASB") issued amended guidance related to the transfer of financial assets. The new guidance, listed under Accounting Standards Codification ("ASC") Topic 860, "Transfers and Servicing," requires more information about transfers of financial assets, including securitization transactions, and where companies have continuing exposure to the risk related to transferred financial assets. ASC Topic 860 eliminates the concept of a qualifying special purpose entity, changes the requirements for derecognizing financial assets and requires additional disclosure. This standard will be effective for the Company's first quarter of 2010. When this standard is adopted, the Company anticipates that amounts outstanding under its receivables securitization facility will be on-balance sheet and included in receivables, net and long-term debt in its consolidated balance sheet. The Company had $0 million and $20.0 million outstanding under its receivables securitization facility as of December 31, 2009 and 2008, respectively.
In June 2009, the FASB issued amended guidance related to consolidation of variable interest entities. The new guidance, listed under ASC Topic 810, "Consolidation," changes how a reporting entity determines when a variable interest entity should be consolidated. It also requires additional disclosures about its involvement with variable interest entities and any significant changes in risk exposure due to that involvement. This standard is effective for the Company's interim and annual periods ending after January 1, 2010. The Company is currently assessing the impact of this standard on its consolidated financial statements.
In December 2008, the FASB issued amended guidance relating to the disclosure of employers' postretirement benefit plan assets. The new guidance, which is now part of ASC Topic 715, "Compensation—Retirement Benefits," requires more detailed disclosures about employers' pension plan assets. New disclosures include additional information on investment strategies, major categories of plan assets, concentrations of risk within plan assets and valuation techniques used to measure the fair value of plan assets. The Company adopted the new guidance in the fourth quarter of 2009 by expanding its disclosures in Note 17 herein.
67
TRIMAS CORPORATION
NOTES TO CONSOLIDATED FINANCIAL STATEMENTS (Continued)
3. Summary of Significant Accounting Policies
Principles of Consolidation. The accompanying consolidated financial statements include the accounts and transactions of TriMas and its wholly-owned subsidiaries. Significant intercompany transactions have been eliminated.
Use of Estimates. The preparation of financial statements in conformity with accounting principles generally accepted in the United States of America requires management of the Company to make estimates and assumptions that affect the reported amounts of assets and liabilities and the disclosure of contingent assets and liabilities at the date of the financial statements. Such estimates and assumptions also affect the reported amounts of revenues and expenses during the reporting periods. Significant items subject to such estimates and assumptions include the carrying amount of property and equipment, goodwill and other intangibles, valuation allowances for receivables, inventories and deferred income tax assets, valuation of derivatives, estimated future unrecoverable lease costs, reserves for legal and product liability matters and assets and obligations related to employee benefits. Actual results may differ from such estimates and assumptions.
Cash and Cash Equivalents. The Company considers cash on hand and on deposit and investments in all highly liquid debt instruments with initial maturities of three months or less to be cash and cash equivalents.
Receivables. Receivables are presented net of allowances for doubtful accounts of approximately $5.7 million at December 31, 2009 and 2008. The Company monitors its exposure for credit losses and maintains allowances for doubtful accounts based upon the Company's best estimate of probable losses inherent in the accounts receivable balances. The Company does not believe that significant credit risk exists due to its diverse customer base.
Sales of Receivables. The Company may, from time to time, sell certain of its receivables to third parties. Sales of receivables are recognized at the point in which the receivables sold are transferred beyond the reach of the Company and its creditors, the purchaser has the right to pledge or exchange the receivables and the Company has surrendered control over the transferred receivables.
Inventories. Inventories are stated at the lower of cost or net realizable value, with cost determined using the first-in, first-out method. Direct materials, direct labor and allocations of variable and fixed manufacturing-related overhead are included in inventory cost.
Property and Equipment. Property and equipment additions, including significant improvements, are recorded at cost. Upon retirement or disposal of property and equipment, the cost and accumulated depreciation are removed from the accounts, and any gain or loss is included in the accompanying statement of operations. Repair and maintenance costs are charged to expense as incurred.
Depreciation and Amortization. Depreciation is computed principally using the straight-line method over the estimated useful lives of the assets. Annual depreciation rates are as follows: buildings and buildings/land improvements, 10 to 40 years, and machinery and equipment, 3 to 15 years. Capitalized debt issuance costs are amortized over the underlying terms of the related debt securities. Customer relationship intangibles are amortized over periods ranging from 5 to 25 years, while technology and other intangibles are amortized over periods ranging from 1 to 30 years.
Impairment of Long-Lived Assets and Definite-Lived Intangible Assets. The Company reviews, on at least a quarterly basis, the financial performance of each business unit for indicators of impairment. In
68
TRIMAS CORPORATION
NOTES TO CONSOLIDATED FINANCIAL STATEMENTS (Continued)
3. Summary of Significant Accounting Policies (Continued)
reviewing for impairment indicators, the Company also considers events or changes in circumstances such as business prospects, customer retention, market trends, potential product obsolescence, competitive activities and other economic factors. An impairment loss is recognized when the carrying value of an asset group exceeds the future net undiscounted cash flows expected to be generated by that asset group. The impairment loss recognized is the amount by which the carrying value of the asset group exceeds its fair value.
Goodwill and Indefinite-Lived Intangibles. The Company tests goodwill and indefinite-lived intangible assets for impairment on an annual basis by comparing the estimated fair value of each of its reporting units and indefinite-lived intangible assets to the respective carrying value on the balance sheet. More frequent evaluations may be required if the Company experiences changes in its business climate or as a result of other triggering events that take place. If carrying value exceeds fair value, a possible impairment exists and further evaluation is performed.
For the purposes of the goodwill impairment test, one of the Company's five operating segments, Cequent, is considered a reporting unit because the individual businesses within this segment have similar economic characteristics, including their products, services, customers, and distribution. The eight businesses which comprise the Company's remaining four operating segments are considered separate reporting units for purposes of the impairment test. These businesses are less similar in their economic characteristics and have discrete financial information available which management regularly reviews for purposes of evaluating performance.
The Company estimates the fair value of its reporting units utilizing a combination of three valuation techniques: discounted cash flow (Income Approach), market comparable method (Market Approach) and market capitalization (Direct Market Data Method). The Income Approach is based on management's operating budget and internal five-year forecast. This approach utilizes forward-looking assumptions and projections, but considers factors unique to each of the Company's businesses and related long-range plans that may not be comparable to other companies and that are not yet publicly available. The Market Approach considers potentially comparable companies and transactions within the industries where the Company's reporting units participate, and applies their trading multiples to the Company's reporting units. This approach utilizes data from actual marketplace transactions, but reliance on its results is limited by difficulty in identifying companies that are specifically comparable to the Company's reporting units, considering the diversity of the Company's businesses, their relative sizes and levels of complexity. The Company also uses the Direct Market Data Method by comparing its book value and the estimates of fair value of the reporting units to the Company's market capitalization as of and at dates near the annual testing date. Management uses this comparison as additional evidence of the fair value of the Company, as its market capitalization may be suppressed by other factors such as the control premium associated with a controlling shareholder, the Company's high degree of leverage, and the limited float of the Company's common stock. Management evaluates and weights the results based on a combination of the Income and Market Approaches, and, in situations where the Income Approach results differ significantly from the Market and Direct Market Data Approaches, management re-evaluates and adjusts, if necessary, its assumptions.
The Income Approach requires the Company to calculate the present value of estimated future cash flows. In making this calculation, management makes significant estimates regarding future revenues and expenses, projected capital expenditures, changes in working capital and the appropriate discount rate. The projections also include significant assumptions related to including current and estimated economic
69
TRIMAS CORPORATION
NOTES TO CONSOLIDATED FINANCIAL STATEMENTS (Continued)
3. Summary of Significant Accounting Policies (Continued)
trends and outlook, costs of raw materials, consideration of the Company's market capitalization as compared to the estimated fair values of the Company's reporting units determined using the Income Approach and other factors which are beyond management's control.
The Company utilizes the estimates of fair value determined under the Income Approach as the basis for its indefinite-lived intangible asset testing. Management utilizes the royalty relief method to estimate the fair value of its indefinite-lived intangible assets, basing the estimate on discounted future cash flows related to the net amount of royalty expenses avoided due to the existence of the trademark or tradename. Management then compares the estimated fair value to the carrying value. If carrying value exceeds fair value, an impairment charge is recorded.
Prior to 2008, the Company's accounting policy was to conduct the annual impairment test as of December 31st; however, effective in the second quarter of 2008, the Company changed its accounting policy to conduct the annual impairment test as of October 1st, with the testing to be conducted during the fourth quarter of each year. This change is preferable as it provides the Company additional time to complete the required testing and evaluate the results prior to the year-end closing and reporting activities and better enables the Company to comply with required reporting dates as an accelerated filer. The change in impairment test dates had no impact on the Company's financial results or financial position for any period presented.
Future declines in sales and/or operating profit, declines in the Company's stock price, or other changes in the Company's business or the markets for its products could result in further impairments of goodwill and other intangible assets.
Self-insurance. The Company is generally self-insured for losses and liabilities related to workers' compensation, health and welfare claims and comprehensive general, product and vehicle liability. The Company is generally responsible for up to $0.5 million per occurrence under its retention program for workers' compensation, between $0.3 million and $2.0 million per occurrence under its retention programs for comprehensive general, product and vehicle liability, and has a $0.3 million per occurrence stop-loss limit with respect to its self-insured group medical plan. Total insurance limits under these retention programs vary by year for comprehensive general, product and vehicle liability and extend to the applicable statutory limits for workers' compensation. Reserves for claims losses, including an estimate of related litigation defense costs, are recorded based upon the Company's estimates of the aggregate liability for claims incurred using actuarial assumptions about future events. Changes in assumptions for factors such as medical costs and actual experience could cause these estimates to change.
Pension Plans and Postretirement Benefits Other Than Pensions. Annual net periodic pension expense and benefit liabilities under defined benefit pension plans are determined on an actuarial basis. Assumptions used in the actuarial calculations have a significant impact on plan obligations and expense. Annually, the Company reviews the actual experience compared to the more significant assumptions used and makes adjustments to the assumptions, if warranted. The healthcare trend rates are reviewed with the actuaries based upon the results of their review of claims experience. Discount rates are based upon an expected benefit payments duration analysis and the equivalent average yield rate for high-quality fixed-income investments. Pension benefits are funded through deposits with trustees and the expected long-term rate of return on fund assets is based upon actual historical returns modified for known changes in the market and any expected change in investment policy. Postretirement benefits are not funded and it is the Company's policy to pay these benefits as they become due.
70
TRIMAS CORPORATION
NOTES TO CONSOLIDATED FINANCIAL STATEMENTS (Continued)
3. Summary of Significant Accounting Policies (Continued)
Revenue Recognition. Revenues from product sales, except products shipped on a consignment basis, are recognized when products are shipped or services are provided to customers, the customer takes ownership and assumes risk of loss, the sales price is fixed and determinable and collectability is reasonably assured. Net sales is comprised of gross revenues less estimates of expected returns, trade discounts and customer allowances, which include incentives such as cooperative advertising agreements, volume discounts and other supply agreements in connection with various programs. Such deductions are recorded during the period the related revenue is recognized. For products shipped on a consignment basis, revenue is recognized when the customer provides notice of end product use or sale.
Cost of Sales. Cost of sales includes material, labor and overhead costs incurred in the manufacture of products sold in the period. Material costs include raw material, purchased components, outside processing and inbound freight costs. Overhead costs consist of variable and fixed manufacturing costs, wages and fringe benefits, and purchasing, receiving and inspection costs.
Selling, General and Administrative Expenses. Selling, general and administrative expenses include the following: costs related to the advertising, sale, marketing and distribution of our products, shipping and handling costs, amortization of customer intangible assets, costs of finance, human resources, legal functions, executive management costs and other administrative expenses.
Shipping and Handling Expenses. Freight costs are included in cost of sales and shipping and handling expenses, including those of Cequent's distribution network, are included in selling, general and administrative expenses in the accompanying statement of operations. Shipping and handling costs were $3.1 million, $4.4 million and $4.7 million for the years ended December 31, 2009, 2008 and 2007, respectively.
Advertising and Sales Promotion Costs. Advertising and sales promotion costs are expensed as incurred. Advertising costs were approximately $4.8 million, $6.9 million and $7.4 million for the years ended December 31, 2009, 2008 and 2007, respectively, and are included in selling, general and administrative expenses in the accompanying statement of operations.
Research and Development Costs. Research and development ("R&D") costs are expensed as incurred. R&D expenses were approximately $0.9 million, $1.3 million and $1.4 million for the years ended December 31, 2009, 2008 and 2007, respectively, and are included in cost of sales in the accompanying statement of operations.
Income Taxes. The Company computes income taxes using the asset and liability method, whereby deferred income taxes using current enacted tax rates are provided for the temporary differences between the financial reporting basis and the tax basis of assets and liabilities and for operating loss and tax credit carryforwards. The Company determines valuation allowances based on an assessment of positive and negative evidence on a jurisdiction-by-jurisdiction basis and records a valuation allowance to reduce deferred tax assets to the amount more likely than not to be realized. The Company recognizes the effect of income tax positions only if those positions are more likely than not of being sustained. Recognized income tax positions are measured at the largest amount that is greater than 50% likely of being realized. Changes in recognition or measurement are reflected in the period in which the change in judgment occurs. The Company records interest and penalties related to unrecognized tax benefits in income tax expense.
71
TRIMAS CORPORATION
NOTES TO CONSOLIDATED FINANCIAL STATEMENTS (Continued)
3. Summary of Significant Accounting Policies (Continued)
Foreign Currency Translation. The financial statements of subsidiaries located outside of the United States are measured using the currency of the primary economic environment in which they operate as the functional currency. Net foreign currency transaction gains (losses) were approximately $0.7 million, $0.8 million and $(0.2) million for the years ended December 31, 2009, 2008 and 2007, respectively, and are included in other expense, net in the accompanying statement of operations. When translating into U.S. dollars, income and expense items are translated at average monthly exchange rates and assets and liabilities are translated at exchange rates in effect at the balance sheet date. Translation adjustments resulting from translating the functional currency into U.S. dollars are deferred as a component of accumulated other comprehensive income in the statement of shareholders' equity.
Derivative Financial Instruments. The Company records all derivative financial instruments at fair value on the balance sheet as either assets or liabilities, and changes in their fair values are immediately recognized in earnings if the derivatives do not qualify as effective hedges. If a derivative is designated as a fair value hedge, then changes in the fair value of the derivative are offset against the changes in the fair value of the underlying hedged item. If a derivative is designated as a cash flow hedge, then the effective portion of the changes in the fair value of the derivative is recognized as a component of other comprehensive income until the underlying hedged item is recognized in earnings or the forecasted transaction is no longer probable of occurring. The Company formally documents hedging relationships for all derivative transactions and the underlying hedged items, as well as its risk management objectives and strategies for undertaking the hedge transactions. See Note 13, "Derivative Instruments," for further information on the Company's financial instruments.
Fair Value of Financial Instruments. The Company accounts for its financial instruments at fair value. In accounting for and disclosing the fair value of these instruments, the Company uses the following hierarchy:
- •
- Level 1 inputs are quoted prices (unadjusted) in active markets for identical assets or liabilities that the
Company has the ability to access at the measurement date;
- •
- Level 2 inputs are inputs other than quoted prices included within Level 1 that are observable for the asset
or liability, either directly or indirectly;
- •
- Level 3 inputs are unobservable inputs for the asset or liability.
Valuation of the interest rate swaps and foreign currency forward contracts are based on the income approach which uses observable inputs such as interest rate yield curves and forward currency exchange rates.
The carrying value of financial instruments reported in the balance sheet for current assets and current liabilities approximates fair value due to the short maturity of these instruments. The Company's term loan traded at 95.5% and 58.0% of par value as of December 31, 2009 and 2008, respectively. The Company's senior secured notes traded at approximately 98.5% of par value as of December 31, 2009 and the Company's senior subordinated notes traded at approximately 51.5% of par value as of December 31, 2008. The valuation of the term loan, senior secured notes and senior subordinated notes was determined based on Level 2 inputs.
Earnings Per Share. Net earnings are divided by the weighted average number of shares outstanding during the year to calculate basic earnings per share. Diluted earnings per share are calculated to give
72
TRIMAS CORPORATION
NOTES TO CONSOLIDATED FINANCIAL STATEMENTS (Continued)
3. Summary of Significant Accounting Policies (Continued)
effect to stock options and other stock-based awards. The calculation of diluted earnings per share included 64,882 restricted shares for the year ended December 31, 2009. For the years ended December 31, 2008 and 2007, no restricted shares were included in the computation of net income (loss) per share because to do so would be anti-dilutive. Options to purchase 1,285,344, 1,596,213 and 2,000,481 shares of common stock were outstanding at December 31, 2009, 2008 and 2007, respectively. The calculation of diluted earnings per share included 337,629 options to purchase share of common stock for the year ended December 31, 2009; however, for the years ended December 31, 2008 and 2007, no options to purchase shares of common stock were included the computation of net income (loss) per share because to do so would have been anti-dilutive for the periods presented.
Stock-based Compensation. The Company recognizes compensation expense related to equity awards based on their fair values as of the grant date.
Other Comprehensive Income. The Company refers to other comprehensive income as revenues, expenses, gains and losses that under accounting principles generally accepted in the United States are included in comprehensive income but are excluded from net earnings as these amounts are recorded directly as an adjustment to stockholders' equity. Other comprehensive income is comprised of foreign currency translation adjustments, amortization of prior service costs and unrecognized gains and losses in actuarial assumptions, and changes in unrealized gains and losses on derivatives.
The components of accumulated other comprehensive income as of December 31 are as follows:
| |
2009 | 2008 | |||||
|---|---|---|---|---|---|---|---|
| |
(dollars in thousands) |
||||||
Foreign currency translation adjustments |
$ | 51,350 | $ | 43,720 | |||
Unrecognized prior service cost and unrecognized loss in actuarial assumptions |
(6,030 | ) | (5,270 | ) | |||
Unrealized loss on derivatives |
(1,660 | ) | (720 | ) | |||
Accumulated other comprehensive income |
$ | 43,660 | $ | 37,730 | |||
Reclassifications. Certain prior year amounts have been reclassified to conform with the current year presentation.
4. Initial Public Offering
During the second quarter of 2007, the Company completed the sale of 12,650,000 shares of common stock to the public pursuant to an effective registration statement at a price of $11.00 per share. Gross proceeds from the common stock offering were $139.2 million. Net proceeds from the offering, after deducting underwriting discounts and commissions of $9.7 million and offering expenses of $3.0 million,
73
TRIMAS CORPORATION
NOTES TO CONSOLIDATED FINANCIAL STATEMENTS (Continued)
4. Initial Public Offering (Continued)
totaled approximately $126.5 million. The net proceeds of $126.5 million, together with approximately $10.1 million of cash on hand and revolving credit borrowings, were utilized as follows (in thousands):
Retirement of senior subordinated notes |
$ | 100,000 | ||
Call premium associated with retirement of senior subordinated notes |
4,940 | |||
Advisory services agreement termination fee |
10,000 | |||
Early termination of operating leases and acquisition of underlying machinery and equipment |
21,680 | |||
|
$ | 136,620 | ||
In connection with the common stock offering and the use of proceeds therefrom, the Company incurred the following costs and expenses which are included in the Company's consolidated statement of operations for the year ended December 31, 2007 (in thousands):
Advisory services agreement termination fee |
$ | 10,000 | ||
Call premium associated with retirement of senior subordinated notes |
4,940 | |||
Costs for early termination of operating leases |
4,230 | |||
Non-cash write-off of deferred financing fees and accretion of unamortized discount and premium associated with retirement of senior subordinated notes |
2,500 | |||
|
$ | 21,670 | ||
5. Discontinued Operations and Assets Held for Sale
During the fourth quarter of 2009, the Company committed to a plan to exit its medical device line of business which was part of the Engineered Components operating segment. The Company recognized an impairment charge of approximately $3.3 million in the fourth quarter of 2009, primarily to write-down the value of its property and equipment and customer relationship intangible assets to their estimated fair values. The Company also recorded a charge of approximately $0.4 million related to severance benefits for approximately 40 employees to be involuntarily terminated as a result of this action. In addition, in the fourth quarter of 2008, the Company recognized an impairment charge of approximately $5.6 million as a part of the Company's annual goodwill impairment test to fully-impair the recorded goodwill of the medical device business.
During the fourth quarter of 2008, the Company entered into a binding agreement to sell certain assets within its specialty laminates, jacketings and insulation tapes line of business, which was part of the Packaging operating segment. The Company recognized an impairment charge of approximately $12.3 million in December 2008 to write-down the value of goodwill and intangible assets to fair value in this business and recorded a charge of approximately $1.8 million related to severance benefits for approximately 125 employees to be terminated upon completion of the sale. The sale was completed in February 2009 for cash proceeds of approximately $21.0 million. The Company's manufacturing facility is subject to a lease agreement expiring in 2024 that was not assumed by the purchaser of the business. During first quarter 2009, upon the cease use date of the facility, the Company recorded a pre-tax charge of approximately $10.7 million for future lease obligations on the facility, net of estimated sublease recoveries.
74
TRIMAS CORPORATION
NOTES TO CONSOLIDATED FINANCIAL STATEMENTS (Continued)
5. Discontinued Operations and Assets Held for Sale (Continued)
During the fourth quarter of 2007, the Company committed to a plan to sell its rocket launcher and property management line of business, both of which were part of the Engineered Components operating segment. The Company sold the assets of the rocket launcher business in December 2007 for cash proceeds of approximately $3.1 million, and recognized a gain on sale of approximately $2.3 million. As of December 31, 2009, the property management line of business was not yet sold. However, the Company continues to actively market the business and has adjusted its sales price expectations, consistent with changes in the current economic conditions. As such, the Company continues to report the property management business as discontinued operations and assets held for sale for all periods presented.
The assets and liabilities of the Wood Dale, IL operating location that was part of the Company's discontinued industrial fastening business were sold in December 2006, but purchaser did not assume the lease agreement for the facility that expires in 2022. During the fourth quarters of 2008 and 2007, the Company re-evaluated its estimate of unrecoverable future obligations and recorded charges of $3.7 million and $3.6 million, respectively. The facility remains available for sublease as of December 31, 2009.
The results of the aforementioned businesses are reported as discontinued operations for all periods presented.
Results of discontinued operations are summarized as follows:
| |
Year ended December 31, | |||||||||
|---|---|---|---|---|---|---|---|---|---|---|
| |
2009 | 2008 | 2007 | |||||||
| |
(dollars in thousands) |
|||||||||
Net sales |
$ | 13,500 | $ | 64,920 | $ | 82,590 | ||||
Income (loss) from discontinued operations, before income tax (expense) benefit |
$ | (21,820 | ) | $ | (25,200 | ) | $ | 6,030 | ||
Income tax (expense) benefit |
8,870 | 13,080 | (2,880 | ) | ||||||
Income (loss) from discontinued operations, net of income tax (expense) benefit |
$ | (12,950 | ) | $ | (12,120 | ) | $ | 3,150 | ||
Assets and liabilities of the discontinued operations are summarized as follows:
| |
2009 | 2008 | ||||||
|---|---|---|---|---|---|---|---|---|
| |
(dollars in thousands) |
|||||||
Receivables, net |
$ | 200 | $ | 680 | ||||
Inventories |
— | 7,800 | ||||||
Prepaid expenses and other assets |
— | 8,710 | ||||||
Property and equipment, net |
4,050 | 14,840 | ||||||
Total assets |
$ | 4,250 | $ | 32,030 | ||||
Accounts payable |
$ | 150 | $ | 90 | ||||
Accrued liabilities and other |
920 | 1,250 | ||||||
Total liabilities |
$ | 1,070 | $ | 1,340 | ||||
75
TRIMAS CORPORATION
NOTES TO CONSOLIDATED FINANCIAL STATEMENTS (Continued)
6. Facility Closures
Mosinee, WI facility
In March 2009, the Company announced plans to close its manufacturing facility in Mosinee, Wisconsin, moving production and distribution functions currently in Mosinee to lower-cost manufacturing facilities or to third-party sourcing partners. As of December 31, 2009, the Company completed the move and ceased operations in Mosinee. During the fourth quarter of 2009, upon the cease use date of the facility, the Company recorded a pre-tax charge within its Cequent segment of approximately $5.3 million for future lease obligations on the facility, net of estimated lease recoveries. During 2009, the Company recorded charges of approximately $1.8 million, primarily related to cash costs for severance benefits for approximately 160 employees to be involuntarily terminated as part of the closure. As of December 31, 2009, the Company had paid approximately $1.3 million of severance benefits, with the remaining $0.5 million expected to be paid by the end of 2010.
In addition, the Company incurred pre-tax, non-cash charges of approximately $2.6 million in 2009, related to accelerated depreciation expense as a result of shortening the expected useful lives on certain machinery and equipment assets that the Company no longer utilizes following the closure (see Note 10).
Huntsville, Ontario facility
In October 2007, the Company announced plans to close its manufacturing facility in Huntsville, Ontario, Canada and consolidate its operations into the Company's Goshen, Indiana manufacturing facility. These actions were substantially complete as of December 31, 2007. As a result of these actions, the Company recorded a pre-tax charge within its Cequent segment of approximately $9.0 million in the fourth quarter of 2007, of which approximately $5.6 million related to cash costs incurred as a part of the closure, primarily relating to severance benefits to approximately 160 employees terminated as a part of the closure. The remaining $3.4 million of the pre-tax charge related to impairment of assets recorded to reduce the book value of the building and building improvements and certain machinery and equipment assets that the Company no longer utilized as a result of the closure to management's estimate of net realizable value (see Note 10).
In addition, the Company incurred approximately $0.7 million of costs and expenses in 2008 resulting from completion of the consolidation into the Goshen facility, including severance and other benefits for approximately 10 key employees who remained with the Company to assist in finalizing the closure.
7. Goodwill and Other Intangible Assets
The Company conducted its annual goodwill and indefinite-lived intangible asset impairment test as of October 1, 2009. For purposes of this test, the Company gave equal weight to the Income and Market Approaches, while utilizing the Direct Market Data Approach for additional evidence of fair value. Significant management assumptions used under the Income Approach were weighted average costs of capital ranging from 13.0% - 16.0% and estimated residual growth rates ranging from 0% - 2.0%. In considering the weighted average cost of capital for each reporting unit, management considered the level of risk inherent in the cash flow projections based on historical attainment of its projections and current market conditions. Upon completion of its annual test in 2009, the Company determined that each of its reporting units with recorded goodwill and indefinite-lived intangible assets passed the Step I impairment test, with the estimated fair value of each of these reporting units exceeding the carrying value by more than 20%. In addition, a 1% reduction in residual growth rate combined with a 1% increase in the
76
TRIMAS CORPORATION
NOTES TO CONSOLIDATED FINANCIAL STATEMENTS (Continued)
7. Goodwill and Other Intangible Assets (Continued)
weighted average cost of capital would not have changed the conclusions reached under the Step I impairment test.
In completing its annual goodwill and indefinite-lived intangible asset impairment test as of October 1, 2008, the Company contemplated its significant decline in its stock price during the fourth quarter of 2008, when the Company's market capitalization fell below the recorded value of its consolidated net assets. The reduced market capitalization reflected, in part, the impact to the Company's businesses of weakening market demand and declining order intake as a result of the economic recession in the US and other major global economies, the significant decline in the financial markets, and continued uncertainty and lack of availability in the credit markets. The decline in the Company's market capitalization was reflective of an overall market view that the value of the Company had declined significantly, particularly in relation to the Cequent reporting unit. Considering the uncertainty as to how long these end market conditions would persist and the related impacts on the Company's businesses, management reduced projections of future cash flows and added risk premiums as appropriate to reduce the values of its reporting units overall consistent with the decline in the Company's market capitalization subsequent to October 1st.
Upon completion of its annual test in 2008, the Company determined that six of its reporting units failed Step I of the impairment test, requiring a Step II test to determine the amount, if any, of an impairment charge. Based on the results of Step II testing, the Company recorded pre-tax goodwill and indefinite-lived intangible asset impairment charges in the fourth quarter of 2008 of $76.1 million and $8.8 million, respectively, in its Cequent reporting unit, and $58.7 million and $3.8 million, respectively, in a reporting unit within the Company's Packaging segment. The Company recorded a pre-tax goodwill impairment charge in the fourth quarter of 2008 of $19.2 million in certain reporting units within its Engineered Components segment.
In completing its annual goodwill and indefinite-lived intangible asset impairment test as of December 31, 2007, the Company's Step I testing indicated that the carrying value of its Cequent reporting unit exceeded its estimated fair value. Based on the results of Step II testing, the Company recorded pre-tax goodwill and indefinite-lived intangible asset impairment charges in the fourth quarter of 2007 of $159.6 million and $11.6 million, respectively, in its Cequent reporting unit.
Future declines in sales and operating profit or further declines in the Company's stock price may result in additional goodwill and indefinite-lived intangible asset impairments.
77
TRIMAS CORPORATION
NOTES TO CONSOLIDATED FINANCIAL STATEMENTS (Continued)
7. Goodwill and Other Intangible Assets (Continued)
Changes in the carrying amount of goodwill for the years ended December 31, 2009 and 2008 are as follows:
| |
Packaging | Energy | Aerospace & Defense |
Engineered Components |
Cequent | Total | ||||||||||||||
|---|---|---|---|---|---|---|---|---|---|---|---|---|---|---|---|---|---|---|---|---|
| |
(dollars in thousands) |
|||||||||||||||||||
Balance, December 31, 2007 |
$ | 180,770 | $ | 46,050 | $ | 43,540 | $ | 19,180 | $ | 75,650 | $ | 365,190 | ||||||||
Goodwill from acquisitions |
— | — | — | — | 710 | 710 | ||||||||||||||
Impairment charge |
(58,660 | ) | — | — | (19,180 | ) | (76,110 | ) | (153,950 | ) | ||||||||||
Foreign currency translation and other |
(8,350 | ) | (1,070 | ) | — | — | (250 | ) | (9,670 | ) | ||||||||||
Balance, December 31, 2008 |
$ | 113,760 | $ | 44,980 | $ | 43,540 | $ | — | $ | — | $ | 202,280 | ||||||||
Purchase accounting adjustments |
(740 | ) | (5,990 | ) | (2,410 | ) | — | — | (9,140 | ) | ||||||||||
Foreign currency translation and other |
2,440 | 750 | — | — | — | 3,190 | ||||||||||||||
Balance, December 31, 2009 |
$ | 115,460 | $ | 39,740 | $ | 41,130 | $ | — | $ | — | $ | 196,330 | ||||||||
In 2009, the Company identified a balance sheet gross-up of goodwill and deferred tax liabilities in the amount of $9.1 million and $8.0 million, respectively, which were incorrectly established in purchase accounting for business combinations occurring prior to 2004. Management corrected the affected accounts in 2009, which resulted in a non-cash charge to income tax expense of $1.1 million.
The gross carrying amounts and accumulated amortization of the Company's other intangibles as of December 31, 2009 and 2008 are summarized below. The Company amortizes these assets over periods ranging from 1 to 30 years.
| |
As of December 31, 2009 | As of December 31, 2008 | ||||||||||||
|---|---|---|---|---|---|---|---|---|---|---|---|---|---|---|
Intangible Category by Useful Life
|
Gross Carrying Amount |
Accumulated Amortization |
Gross Carrying Amount |
Accumulated Amortization |
||||||||||
| |
(dollars in thousands) |
|||||||||||||
Customer relationships: |
||||||||||||||
5 - 12 years |
$ | 24,710 | $ | (18,290 | ) | $ | 24,370 | $ | (15,970 | ) | ||||
15 - 25 years |
154,610 | (61,250 | ) | 154,610 | (53,010 | ) | ||||||||
Total customer relationships |
179,320 | (79,540 | ) | 178,980 | (68,980 | ) | ||||||||
Technology and other: |
||||||||||||||
1 - 15 years |
25,800 | (22,060 | ) | 25,570 | (19,890 | ) | ||||||||
17 - 30 years |
42,120 | (16,640 | ) | 42,000 | (14,700 | ) | ||||||||
Total technology and other |
67,920 | (38,700 | ) | 67,570 | (34,590 | ) | ||||||||
Trademark/Trade names (indefinite life) |
35,080 | — | 34,840 | — | ||||||||||
|
$ | 282,320 | $ | (118,240 | ) | $ | 281,390 | $ | (103,570 | ) | ||||
Amortization expense related to technology and other intangibles was approximately $4.2 million, $3.9 million, and $4.0 million for the years ended December 31, 2009, 2008 and 2007, respectively, and is
78
TRIMAS CORPORATION
NOTES TO CONSOLIDATED FINANCIAL STATEMENTS (Continued)
7. Goodwill and Other Intangible Assets (Continued)
included in cost of sales in the accompanying statement of operations. Amortization expense related to customer intangibles was approximately $10.5 million, $10.5 million, and $10.3 million for the years ended December 31, 2009, 2008 and 2007, respectively, and is included in selling, general and administrative expense in the accompanying statement of operations.
Estimated amortization expense for the next five fiscal years beginning after December 31, 2009 is as follows: 2010—$13.6 million, 2011—$12.7 million, 2012—$12.5 million , 2013—$10.9 million and 2014—$10.7 million.
8. Receivables Facility
Through December 28, 2009, TriMas was party to a 364-day accounts receivable facility through TSPC, Inc. ("TSPC"), a wholly-owned subsidiary, to sell trade accounts receivable of substantially all of the Company's domestic business operations. Under this facility, TSPC, from time to time, was able to sell an undivided fractional ownership interest in the pool of receivables up to approximately $55.0 million to a third party multi-seller receivables funding company. The net proceeds of the sale of receivables are less than the face amount of accounts receivable sold by an amount that approximates the purchaser's financing costs. The cost of funds under this facility consisted of a commercial paper-based rate plus a usage fee of 4.5%, 1.05% and 1.35% in 2009, 2008 and 2007, respectively, and a fee on the unused portion of the facility of 2.25%, 0.5% and 0.5% during 2009, 2008 and 2007, respectively. The amount of such costs incurred under this facility aggregated to $1.2 million, $2.3 million and $3.9 million in 2009, 2008 and 2007, respectively, and such amounts are included in other expense, net in the accompanying consolidated statement of operations.
The costs of funds incurred are determined by calculating the estimated present value of the receivables sold compared to their carrying amount. The estimated present value factor is based on historical collection experience and a discount rate based on a commercial paper-based rate plus the usage fee discussed above and is computed in accordance with the terms of the securitization agreement. For the years ended December 31, 2009, 2008 and 2007, the costs of funds under the facility were based on an average liquidation period of the portfolio of approximately 1.2 months and an average discount rate of 2.5%, 2.1% and 3.0%, respectively.
On December 29, 2009, the Company entered into a new three year accounts receivable facility through TSPC. This facility replaced the Company's existing 364-day facility, which was due in February 2010. The Company's new three year facility increased the level of committed funding from $55.0 million to $75.0 million. The discount rate used in the present value factor is based on 3-month LIBOR rather than a commercial paper-based rate and the related usage fee was reduced from 4.5% to a range of 2.75% - 3.5%, dependent upon the Company's earnings to debt leverage, as defined. At December 31, 2009, such rate was 3.25%. The fee on the unused portion of the facility was reduced from 2.25% to a range of 0.5% - 1.0%, dependent on the amount of the facility not drawn. The Company incurred approximately $1.3 million in fees and expenses to complete the new facility which expires on December 29, 2012. The Company did not sell any receivables under the new facility during December 2009.
As of December 31, 2009 and 2008, the Company's funding under the facility was $0 and $20.0 million, respectively, with an additional $32.1 million and $30.9 million, respectively, available but not utilized. The Company had pledged receivables of approximately $79.5 million in support of the $20.0 million of
79
TRIMAS CORPORATION
NOTES TO CONSOLIDATED FINANCIAL STATEMENTS (Continued)
8. Receivables Facility (Continued)
outstanding funding as of December 31, 2008. The pledged receivables are included in receivables in the accompanying consolidated balance sheet.
In addition, the Company from time to time may sell an undivided interest in accounts receivable under factoring arrangements at three of its European subsidiaries. As of December 31, 2009 and December 31, 2008, the Company's funding under these arrangements was approximately $4.5 million and $3.2 million, respectively. Sales of the European subsidiaries' accounts receivable were sold at a discount from face value of approximately 1.9%, 2.2% and 2.2%, at December 31, 2009, 2008 and 2007, respectively. Costs associated with the Company's European factoring arrangements were approximately $0.3 million, $0.4 million and $0.3 million in 2009, 2008 and 2007, respectively, and are included in other expense, net in the accompanying consolidated statement of operations.
9. Inventories
Inventories consist of the following components:
| |
December 31, 2009 |
December 31, 2008 |
||||||
|---|---|---|---|---|---|---|---|---|
| |
(dollars in thousands) |
|||||||
Finished goods |
$ | 95,420 | $ | 119,980 | ||||
Work in process |
16,270 | 23,250 | ||||||
Raw materials |
30,150 | 45,670 | ||||||
Total inventories |
$ | 141,840 | $ | 188,900 | ||||
10. Property and Equipment, Net
Property and equipment consists of the following components:
| |
December 31, 2009 |
December 31, 2008 |
||||||
|---|---|---|---|---|---|---|---|---|
| |
(dollars in thousands) |
|||||||
Land and land improvements |
$ | 2,380 | $ | 4,920 | ||||
Buildings |
44,810 | 44,140 | ||||||
Machinery and equipment |
283,710 | 273,930 | ||||||
|
330,900 | 322,990 | ||||||
Less: Accumulated depreciation |
168,680 | 146,140 | ||||||
Property and equipment, net |
$ | 162,220 | $ | 176,850 | ||||
Depreciation expense was approximately $26.7 million, $25.5 million and $24.2 million for each of the years ended December 31, 2009, 2008 and 2007, respectively, of which $23.8 million, $21.8 million and $19.6 million, respectively, is included in cost of sales in the accompanying statement of operations, and $2.9 million, $3.7 million and $4.6 million, respectively, is included in selling, general and administrative expenses in the accompanying statement of operations.
80
TRIMAS CORPORATION
NOTES TO CONSOLIDATED FINANCIAL STATEMENTS (Continued)
10. Property and Equipment, Net (Continued)
In 2009, in connection with the closure of the Mosinee facility (see Note 6), the Company recorded accelerated depreciation expense of approximately $2.6 million, which is included in the $23.8 million of depreciation expense recorded in cost of sales. This charge related to shortening the expected useful lives on certain machinery and equipment.
In 2008, the Company recorded an impairment charge of approximately $0.5 million to the write-down of the net book value of certain machinery and equipment within the Cequent segment to net realizable value.
In 2007, in connection with the closure of the Huntsville facility (see Note 6), the Company recorded an impairment charge of approximately $3.4 million. This charge related to the write-down of the net book value of building and building improvements and certain machinery and equipment within the Cequent segment to net realizable value.
11. Accrued Liabilities
| |
December 31, 2009 |
December 31, 2008 |
||||||
|---|---|---|---|---|---|---|---|---|
| |
(dollars in thousands) |
|||||||
Self-insurance |
$ | 10,840 | $ | 13,620 | ||||
Vacation, holiday and bonus |
14,720 | 14,760 | ||||||
Other |
40,190 | 37,960 | ||||||
Total accrued liabilities |
$ | 65,750 | $ | 66,340 | ||||
12. Long-term Debt
The Company's long-term debt consists of the following:
| |
December 31, 2009 |
December 31, 2008 |
||||||
|---|---|---|---|---|---|---|---|---|
| |
(dollars in thousands) |
|||||||
U.S. bank debt |
$ | 256,680 | $ | 262,580 | ||||
Non-U.S. bank debt and other |
12,890 | 18,220 | ||||||
93/4% senior secured notes, due December 2017 |
244,980 | — | ||||||
97/8% senior subordinated notes, due June 2012 |
— | 329,140 | ||||||
|
514,550 | 609,940 | ||||||
Less: Current maturities, long-term debt |
20,390 | 10,360 | ||||||
Long-term debt |
$ | 494,160 | $ | 599,580 | ||||
U.S. Bank Debt
During the fourth quarter of 2009, the Company amended and restated its credit facilities. Prior to the amendment and restatement, the credit facilities consisted of a $90.0 million revolving credit facility, a $60.0 million deposit-linked supplemental revolving credit facility and a $260.0 million term loan facility, of which $252.2 million was outstanding. Under the amended and restated credit facilities, the revolving credit facility was reduced to $78.0 million, while the supplemental revolving credit facility and term loan facility remained at $60.0 million and $252.2 million, respectively (collectively, the Amended and Restated
81
TRIMAS CORPORATION
NOTES TO CONSOLIDATED FINANCIAL STATEMENTS (Continued)
12. Long-term Debt (Continued)
Credit Agreement or "ARCA"). Under the ARCA, the Company extended the maturity of $70.0 million of its revolving credit facility until December 15, 2013, and the maturity of $226.3 million of its term loan until December 15, 2015. The maturity date of $8.0 million of its revolving credit facility and the $60.0 million deposit-linked supplemental revolving credit facility remained at August 2, 2011, and the maturity date of $25.9 million of its term loan remained at August 2, 2013. Under the ARCA, the Company may refinance its extended term loan and/or its $60.0 million deposit-linked supplemental revolving credit facility within one year by paying 2% prepayment premium. If such refinance takes place within two years, the prepayment premium is reduced to 1%. The Company pays no prepayment premium if the refinance takes place after two years. The interest rate margins on the Company's extended revolving credit facility increased from the London Interbank Offered Rate ("LIBOR") plus 1.75% to LIBOR plus 4.00% per annum and on the extended term loan facility from LIBOR plus 2.25% to LIBOR plus 4.00% per annum with a 2.00% LIBOR floor. The Company is also able to issue letters of credit, not to exceed $65.0 million in aggregate, against its revolving credit facility commitments. At December 31, 2009 and December 31, 2008, the Company had letters of credit of approximately $31.2 million and $34.1 million, respectively, issued and outstanding. The weighted average interest rate on borrowings was 3.9% and 5.4% at December 31, 2009 and December 31, 2008, respectively.
At December 31, 2009, the Company had $5.1 million outstanding under its revolving credit facility and had an additional $101.7 million potentially available after giving effect to approximately $31.2 million of letters of credit issued and outstanding. However, including availability under its accounts receivable facility and after consideration of leverage restrictions contained in the ARCA, the Company had $114.3 million of capacity available to it for general corporate purposes under its revolving credit and accounts receivable facilities.
The bank debt is an obligation of the Company and its subsidiaries. Although the terms of the ARCA do not restrict the Company's subsidiaries from making distributions to it in respect of its 93/4% senior secured notes, it does contain certain other limitations on the distribution of funds from TriMas Company LLC, the principal subsidiary, to the Company. The restricted net assets of the guarantor subsidiaries, of approximately $270.4 million and $339.4 million at December 31, 2009 and December 31, 2008, respectively, are presented in the financial information in Note 22, "Supplemental Guarantor Condensed Consolidating Financial Information." The ARCA also contains various negative and affirmative covenants and other requirements affecting the Company and its subsidiaries, including: restrictions on incurrence of debt, except for permitted acquisitions and subordinated indebtedness, liens, mergers, investments, loans, advances, guarantee obligations, acquisitions, asset dispositions, sale-leaseback transactions, hedging agreements, dividends and other restricted junior payments, stock repurchases, transactions with affiliates, restrictive agreements and amendments to charters, by-laws, and other material documents. The ARCA also requires the Company and its subsidiaries to meet certain restrictive financial covenants and ratios computed quarterly, including a leverage ratio (total consolidated indebtedness plus outstanding amounts under the accounts receivable securitization facility over consolidated EBITDA, as defined), interest expense ratio (consolidated EBITDA, as defined, over cash interest expense, as defined) and a capital expenditures covenant. The Company was in compliance with its covenants at December 31, 2009.
Principal payments required under the ARCA term loan are: $0.7 million due each calendar quarter through September 30, 2015, with $24.9 million due on September 30, 2013 and $211.7 million due on December 15, 2015.
82
TRIMAS CORPORATION
NOTES TO CONSOLIDATED FINANCIAL STATEMENTS (Continued)
12. Long-term Debt (Continued)
Non-U.S. Bank Debt
In the United Kingdom, the Company's subsidiary is party to a revolving debt agreement which is secured by a letter of credit under the ARCA. At December 31, 2009, the balance outstanding under this agreement was approximately $0.8 million at an interest rate of 2.5%. At December 31, 2008, the balance outstanding under this agreement was approximately $0.3 million at an interest rate of 3.5%.
In Australia, the Company's subsidiary is party to a debt agreement which matures December 31, 2010 and is secured by substantially all the assets of the subsidiary. At December 31, 2009, the balance outstanding under this agreement was approximately $11.7 million at an average interest rate of approximately 6.6%. At December 31, 2008, the balance outstanding under this agreement was approximately $15.3 million at an average interest rate of approximately 5.9%.
During the fourth quarter of 2009, the Company's subsidiary in Italy paid-in-full its outstanding balance under a loan agreement. At December 31, 2008, the balance outstanding under this agreement was approximately $2.2 million at an interest rate of 3.6%.
Notes
During the fourth quarter of 2009, the Company issued $250.0 million principal amount of 93/4% senior secured notes due 2017 ("Senior Notes") at a discount of $5.0 million. The Senior Notes were issued in a private placement under Rule 144A of the Securities Act of 1933, as amended. The net proceeds of the offering, approximately $239.7 million, together with $29.3 million of cash on hand, were used to repurchase $256.5 million principal amount of the Company's 97/8% senior subordinated notes due 2012 ("Sub Notes"), for tender costs and expenses related thereto, and to pay fees and expenses related to the Notes. The tender costs, fees and expenses for both the Senior Notes and Sub Notes amounted to approximately $12.5 million, of which $6.5 million were deferred as debt issuance costs in the accompanying consolidated balance sheet and $6.0 million were included as a reduction in the net gain on extinguishment of debt line item in the accompanying statement of operations. Interest on the Senior Notes accrues at the rate of 9.75% per annum and is payable semi-annually in arrears on June 15 and December 15.
The Notes are general senior secured obligations of the Company, and are pari passu in right of payment with all existing and future indebtedness of the Company that is not subordinated in right of payment to the Senior Notes.
Prior to December 15, 2012, the Company may redeem up to 35% of the principal amount of Senior Notes at a redemption price equal to 109.750% of the principal amount, plus accrued and unpaid interest to the applicable redemption date plus additional interest, if any, with the net cash proceeds of one or more equity offerings, provided that at least 65% of the original principal amount of Senior Notes issued remains outstanding after such redemption, and provided further that each such redemption occurs within 90 days of the date of closing of each such equity offering. Prior to December 15, 2013, the Company may redeem all or a part of the Senior Notes, at a redemption price equal to 100% of the principal amount of the Notes redeemed plus the applicable "make whole premium", accrued and unpaid interest and additional interest, if any, to the date of such redemption After December 15, 2013, the Company may redeem all or a part of the Senior Notes at the redemption prices (expressed as percentages of principal amount) set forth below plus accrued and unpaid interest on the Senior Notes redeemed to the applicable
83
TRIMAS CORPORATION
NOTES TO CONSOLIDATED FINANCIAL STATEMENTS (Continued)
12. Long-term Debt (Continued)
redemption date, if redeemed during the twelve-month period beginning on December 15 of the years indicated below:
Year
|
Percentage | |||
|---|---|---|---|---|
2013 |
104.875 | % | ||
2014 |
102.438 | % | ||
2015 |
100.000 | % | ||
During the first three quarters of 2009, the Company utilized approximately $43.8 million of cash on hand to retire $73.2 million of face value of Sub Notes, resulting in a net gain of approximately $28.3 million, after considering non-cash debt extinguishment costs of $1.1 million. During the fourth quarter of 2008, the Company utilized approximately $4.1 million of cash on hand to retire $8.0 million of face value of Sub Notes, resulting in a net gain of approximately $3.7 million after considering non-cash debt extinguishment costs of $0.2 million.
During the second quarter of 2007, the Company utilized approximately $104.9 million of the proceeds from its initial public offering of common stock to retire $100.0 million of face value of Old Notes, paying a $4.9 million call premium to effect the retirement.
The Notes indenture contains negative and affirmative covenants and other requirements that are comparable to those contained under the ARCA. At December 31, 2009, the Company was in compliance with all such covenant requirements.
The Company's unamortized debt issuance costs approximated $13.5 million and $7.4 million at December 31, 2009 and 2008, respectively, and are included in other assets in the accompanying consolidated balance sheet. These amounts consist primarily of legal, accounting and other transaction advisory fees as well as facility fees paid to the lenders. The Company's unamortized discount on the Senior Notes was $5.0 million at December 31, 2009. The Company's unamortized discount on the Sub Notes was $1.0 million and the unamortized premium was $0.3 million at December 31, 2008. Debt issuance costs and the discount on the Senior Notes are amortized using the interest method over the terms of the underlying debt instruments to which these amounts relate. Amortization expense for these items was approximately $2.2 million, $2.5 million and $2.7 million in 2009, 2008 and 2007, respectively, and is included in interest expense in the accompanying statement of operations. In addition, the Company incurred non-cash debt extinguishment costs of approximately $4.9 million, $0.2 million and $2.5 million for the years ended December 31, 2009, 2008 and 2007, respectively.
Future maturities of the face value of long-term debt at December 31, 2009 are as follows:
Year Ending December 31:
|
(dollars in thousands) |
||||
|---|---|---|---|---|---|
2010 |
$ | 20,390 | |||
2011 |
2,740 | ||||
2012 |
2,650 | ||||
2013 |
27,510 | ||||
2014 |
2,600 | ||||
Thereafter |
463,680 | ||||
Total |
$ | 519,570 | |||
84
TRIMAS CORPORATION
NOTES TO CONSOLIDATED FINANCIAL STATEMENTS (Continued)
13. Derivative Instruments
In February 2008, the Company entered into an interest rate swap agreement effective April 2008 to fix the LIBOR-based variable portion of the interest rate on $125.0 million notional amount of its term loan facility at 2.73% through October 2009. In January 2009, the Company entered into two additional interest rate swap agreements. The first of these swaps was effective in January 2009 and fixed the LIBOR-based variable portion of the interest rate on $75.0 million notional amount of its term loan facility at 1.39% through January 2011. The second of these swaps was effective in October 2009 upon the maturity of the February 2008 interest rate swap, and fixed the LIBOR-based variable portion of the interest rate on $125.0 million notional amount of its term loan facility at 1.91% through July 2011. The Company formally designated these swap agreements as cash flow hedges upon entry into the contracts and expected them to be highly effective in offsetting fluctuations in the designated interest payments resulting from changes in the benchmark interest rate. However, upon the Company's amendment and restatement of its credit facilities in the fourth quarter of 2009, the Company determined that these interest rate swaps were no longer effective economic hedges due to the imposition of a LIBOR floor in the determination of the variable interest rate.
Up to the date of the credit facility refinance, the Company had utilized hedge accounting, which allows for the effective portion of the interest rate swaps to be recorded in accumulated other comprehensive income in the accompanying consolidated balance sheet. At the date of the credit facility refinance, the Company had $1.7 million (net of tax of $1.1 million) of unrealized loss in accumulated other comprehensive income related to the interest rate swaps, which, due to the swaps no longer being effective hedges, was frozen and all subsequent changes in the fair value of the interest rate swaps will be recorded directly to interest expense in the statement of operations. The previously-effective amount frozen in accumulated other comprehensive income will be amortized into earnings over the period in which the originally hedged transactions would have affected earnings. For the year ended December 31, 2009, approximately $0.1 million of unrealized loss from accumulated other comprehensive income was amortized into earnings as interest expense after the Company discontinued hedge accounting. Over the next twelve months, the Company expects approximately $1.4 million of unrealized loss in accumulated other comprehensive income to be amortized into earnings as interest expense.
In addition, as of December 31, 2009, the Company held a foreign exchange forward contract with a notional value of 55.5 million Mexican pesos and a foreign exchange forward contract with a notional value of £6.5 million. These foreign exchange forward contracts have not been designated as hedging instruments.
85
TRIMAS CORPORATION
NOTES TO CONSOLIDATED FINANCIAL STATEMENTS (Continued)
13. Derivative Instruments (Continued)
As of December 31, 2009 and 2008, the fair value carrying amounts of the Company's derivative instruments are recorded as follows:
| |
|
Asset Derivatives | Liability Derivatives | |||||||||||||
|---|---|---|---|---|---|---|---|---|---|---|---|---|---|---|---|---|
| |
Balance Sheet Caption | December 31, 2009 |
December 31, 2008 |
December 31, 2009 |
December 31, 2008 |
|||||||||||
| |
|
(dollars in thousands) |
||||||||||||||
Derivatives designated as hedging instruments |
||||||||||||||||
Interest rate contracts |
Accrued liabilities | $ | — | $ | — | $ | — | $ | 1,160 | |||||||
Total derivatives designated as hedging instruments |
$ | — | $ | — | $ | — | $ | 1,160 | ||||||||
Derivatives not designated as hedging instruments |
||||||||||||||||
Interest rate contracts |
Accrued liabilities | $ | — | $ | — | $ | 1,700 | $ | — | |||||||
Interest rate contracts |
Other long-term liabilities | — | — | 660 | — | |||||||||||
Foreign exchange contracts |
Accrued liabilities | — | — | 150 | — | |||||||||||
Total derivatives not designated as hedging instruments |
$ | — | $ | — | $ | 2,510 | $ | — | ||||||||
Total derivatives |
$ | — | $ | — | $ | 2,510 | $ | 1,160 | ||||||||
Fair value measurements and the fair value hierarchy level for the Company's assets and liabilities measured at fair value on a recurring basis as of December 31, 2009, are shown below:
| |
|
December 31, 2009 | |||||||||||||
|---|---|---|---|---|---|---|---|---|---|---|---|---|---|---|---|
Description
|
Frequency | Asset / (Liability) |
Quoted Prices in Active Markets for Identical Assets (Level 1) |
Significant Other Observable Inputs (Level 2) |
Significant Unobservable Inputs (Level 3) |
||||||||||
| |
|
(dollars in thousands) |
|||||||||||||
Interest rate swaps |
Recurring | $ | (2,360 | ) | $ | — | $ | (2,360 | ) | $ | — | ||||
Foreign currency forward contracts |
Recurring | $ | (150 | ) | $ | — | $ | (150 | ) | $ | — | ||||
| |
|
December 31, 2008 | |||||||||||||
|---|---|---|---|---|---|---|---|---|---|---|---|---|---|---|---|
Description
|
Frequency | Asset / (Liability) |
Quoted Prices in Active Markets for Identical Assets (Level 1) |
Significant Other Observable Inputs (Level 2) |
Significant Unobservable Inputs (Level 3) |
||||||||||
| |
|
(dollars in thousands) |
|||||||||||||
Interest rate swaps |
Recurring | $ | (1,160 | ) | $ | — | $ | (1,160 | ) | $ | — | ||||
86
TRIMAS CORPORATION
NOTES TO CONSOLIDATED FINANCIAL STATEMENTS (Continued)
13. Derivative Instruments (Continued)
The effect of derivative instruments on the consolidated statement of operations for the years ended December 31, 2009 and 2008 is summarized as follows:
| |
Amount of Gain (Loss) Recognized in AOCI on Derivative (Effective Portion, net of tax) |
|
Amount of Gain (Loss) Reclassifed from AOCI in to Earnings |
|||||||||||||
|---|---|---|---|---|---|---|---|---|---|---|---|---|---|---|---|---|
| |
As of December 31, | Location of Loss Reclassified from AOCI into Earnings (Effective Portion) |
Year ended December 31 | |||||||||||||
| |
2009 | 2008 | 2009 | 2008 | ||||||||||||
| |
(dollars in thousands) |
|
(dollars in thousands) |
|||||||||||||
Derivatives designated as hedging instruments |
||||||||||||||||
Interest rate contracts |
$ | (1,660 | ) | $ | (720 | ) | Interest expense | $ | (2,880 | ) | $ | 250 | ||||
| |
Amount of Gain (Loss) Recognized in Earnings on Derivative |
|
|||||||
|---|---|---|---|---|---|---|---|---|---|
| |
Year ended December 31 | Location of Gain (Loss) Recognized in Earnings on Derivative |
|||||||
| |
2009 | 2008 | |||||||
| |
(dollars in thousands) |
|
|||||||
Derivatives not designated as hedging instruments |
|||||||||
Interest rate contracts |
$ | 420 | $ | — | Interest expense | ||||
Foreign exchange contracts |
(150 | ) | — | Other expense, net | |||||
14. Leases
TriMas leases certain equipment and plant facilities under non-cancelable operating leases. Rental expense for TriMas totaled approximately $14.7 million in 2009, $15.5 million in 2008 and $17.0 million in 2007.
Minimum payments for operating leases having initial or remaining non-cancelable lease terms in excess of one year at December 31, 2009, including approximately $2.3 million annually related to discontinued operations, are summarized below:
Year Ending December 31:
|
(dollars in thousands) |
||||
|---|---|---|---|---|---|
2010 |
$ | 15,850 | |||
2011 |
15,170 | ||||
2012 |
14,120 | ||||
2013 |
12,700 | ||||
2014 |
11,350 | ||||
Thereafter |
66,670 | ||||
Total |
$ | 135,860 | |||
87
TRIMAS CORPORATION
NOTES TO CONSOLIDATED FINANCIAL STATEMENTS (Continued)
15. Commitments and Contingencies
A civil suit was filed in the United States District Court for the Central District of California in December 1988 by the United States of America and the State of California against more than 180 defendants, including TriMas, for alleged release into the environment of hazardous substances disposed of at the Operating Industries, Inc. site in California. This site served for many years as a depository for municipal and industrial waste. The plaintiffs have requested, among other things, that the defendants clean up the contamination at that site. Consent decrees have been entered into by the plaintiffs and a group of the defendants, including TriMas, providing that the consenting parties perform certain remedial work at the site and reimburse the plaintiffs for certain past costs incurred by the plaintiffs at the site. The Company estimates that its share of the clean-up costs will not exceed $500,000, for which the Company has insurance proceeds. Plaintiffs had sought other relief such as damages arising out of claims for negligence, trespass, public and private nuisance, and other causes of action, but the consent decree governs the remedy. Based upon the Company's present knowledge and subject to future legal and factual developments, the Company does not believe that this matter will have a material adverse effect on its financial position, results of operations or cash flows.
As of December 31, 2009, the Company was a party to approximately 955 pending cases involving an aggregate of approximately 7,816 claimants alleging personal injury from exposure to asbestos containing materials formerly used in gaskets (both encapsulated and otherwise) manufactured or distributed by certain of our subsidiaries for use primarily in the petrochemical refining and exploration industries. The following chart summarizes the number of claimants, number of claims filed, number of claims dismissed, number of claims settled, the average settlement amount per claim and the total defense costs, excluding amounts reimbursed under the Company's primary insurance, at the applicable date and for the applicable periods:
| |
Claims pending at beginning of period |
Claims filed during period |
Claims dismissed during period |
Claims settled during period |
Average settlement amount per claim during period |
Total defense costs during period |
|||||||||||||
|---|---|---|---|---|---|---|---|---|---|---|---|---|---|---|---|---|---|---|---|
Fiscal year ended December 31, 2007 |
10,551 | 619 | 1,484 | 142 | $ | 9,243 | $ | 4,982,000 | |||||||||||
Fiscal year ended December 31, 2008 |
9,544 | 723 | 2,668 | 75 | $ | 1,813 | $ | 3,448,000 | |||||||||||
Fiscal year ended December 31, 2009 |
7,524 | 586 | 254 | 40 | $ | 4,644 | $ | 2,652,000 | |||||||||||
In addition, the Company acquired various companies to distribute its products that had distributed gaskets of other manufacturers prior to acquisition. The Company believes that many of the pending cases relate to locations at which none of its gaskets were distributed or used.
The Company may be subjected to significant additional asbestos-related claims in the future, the cost of settling cases in which product identification can be made may increase, and the Company may be subjected to further claims in respect of the former activities of its acquired gasket distributors. The Company is unable to make a meaningful statement concerning the monetary claims made in the asbestos cases given that, among other things, claims may be initially made in some jurisdictions without specifying the amount sought or by simply stating the requisite or maximum permissible monetary relief, and may be amended to alter the amount sought. The large majority of claims do not specify the amount sought. Of the 7,816 claims pending at December 31, 2009, 96 set forth specific amounts of damages (other than those stating the statutory minimum or maximum). 71 of the 96 claims sought between $1.0 million and $5.0 million in total damages (which includes compensatory and punitive damages), 21 sought between $5.0 million and $10.0 million in total damages (which includes compensatory and punitive damages) and 4
88
TRIMAS CORPORATION
NOTES TO CONSOLIDATED FINANCIAL STATEMENTS (Continued)
15. Commitments and Contingencies (Continued)
sought over $10.0 million in total damages (which includes compensatory and punitive damages). Solely with respect to compensatory damages, 74 of the 96 claims sought between $50,000 and $600,000, 18 sought between $1.0 million and $5.0 million and 4 sought over $5.0 million. Solely with respect to punitive damages, 71 of the 96 claims sought between $0 and $2.5 million, 20 sought between $2.5 million and $5.0 million and 5 sought over $5.0 million. In addition, relatively few of the claims have reached the discovery stage and even fewer claims have gone past the discovery stage.
Total settlement costs (exclusive of defense costs) for all such cases, some of which were filed over 20 years ago, have been approximately $5.4 million. All relief sought in the asbestos cases is monetary in nature. To date, approximately 50% of the Company's costs related to settlement and defense of asbestos litigation have been covered by its primary insurance. Effective February 14, 2006, the Company entered into a coverage-in-place agreement with its first level excess carriers regarding the coverage to be provided to the Company for asbestos-related claims when the primary insurance is exhausted. The coverage-in-place agreement makes asbestos defense costs and indemnity insurance coverage available to the Company that might otherwise be disputed by the carriers and provides a methodology for the administration of such expenses. Nonetheless, there may be a period prior to the commencement of coverage under this agreement and following exhaustion of the Company's primary insurance coverage during which the Company would be solely responsible for defense costs and indemnity payments, the duration of which would be subject to the scope of damage awards and settlements paid.
Based on the settlements made to date and the number of claims dismissed or withdrawn for lack of product identification, the Company believes that the relief sought (when specified) does not bear a reasonable relationship to its potential liability. Based upon the Company's experience to date and other available information (including the availability of excess insurance), the Company does not believe that these cases will have a material adverse effect on its financial position and results of operations or cash flows.
The Company is subject to other claims and litigation in the ordinary course of business, but does not believe that any such claim or litigation will have a material adverse effect on its financial position and results of operations or cash flows.
16. Related Parties
Metaldyne Corporation
In connection with the Company's reorganization in June 2002, TriMas assumed approximately $37.0 million of liabilities and obligations of Metaldyne Corporation ("Metaldyne"), mainly comprised of contractual obligations to former TriMas employees, tax related matters, benefit plan liabilities and reimbursements to Metaldyne for normal course payments made on TriMas' behalf. The remaining contractual obligations to Metaldyne of approximately $6.0 million and $5.8 million at December 31, 2009 and 2008, respectively, are classified as accrued liabilities in the accompanying consolidated balance sheet.
On January 11, 2007, Metaldyne merged into a subsidiary of Asahi Tec Corporation ("Asahi") whereby Metaldyne became a wholly-owned subsidiary of Asahi. In connection with the consummation of the merger, Metaldyne dividended the 4,825,587 shares of the Company's common stock that it owned on a pro rata basis to the holders of Metaldyne's common stock at the time of such dividend. As a result of the merger, Metaldyne and the Company are no longer related parties. In addition, as a result of the merger, it has been asserted that Metaldyne may be obligated to accelerate funding and payment of actuarially
89
TRIMAS CORPORATION
NOTES TO CONSOLIDATED FINANCIAL STATEMENTS (Continued)
16. Related Parties (Continued)
determined amounts owing to seven former Metaldyne executives under a supplemental executive retirement plan ("SERP"). Under the stock purchase agreement between Metaldyne and Heartland Industrial Partners ("Heartland"), TriMas is required to reimburse Metaldyne, when billed, for its allocated portion of the amounts due to certain Metaldyne SERP participants, as defined. At December 31, 2009, TriMas has accrued an estimated liability to Metaldyne on its reported balance sheet of approximately $4.9 million (included in the remaining $6.0 million of contractual obligations above). However, if Metaldyne is required to accelerate funding of the SERP liability, TriMas may be obligated to reimburse Metaldyne up to approximately $7.3 million, which could result in future charges to the Company's statement of operations of up to $2.4 million. The Company continues to review the validity of these assertions.
Additionally, on May 28, 2009, Metaldyne and its U.S. subsidiaries filed voluntary petitions in the United States Bankruptcy Court under Chapter 11 of the U.S. Bankruptcy Code. On February 23, 2010, the U.S. Bankruptcy Court confirmed the reorganization plan of Metaldyne and its U.S. subsidiaries. The Company is evaluating the impact of Metaldyne's reorganization plans on its estimated SERP obligations to Metaldyne.
Subject to certain limited exceptions, Metaldyne and TriMas retained separate liabilities associated with the respective businesses following the reorganization in June 2002. Accordingly, the Company will indemnify and hold Metaldyne harmless from all liabilities associated with TriMas and its subsidiaries and the respective operations and assets, whenever conducted, and Metaldyne will indemnify and hold harmless Heartland and TriMas harmless from all liabilities associated with Metaldyne and its subsidiaries (excluding TriMas and its subsidiaries) and their respective operations and assets, whenever conducted. In addition, TriMas agreed with Metaldyne to indemnify one another for its allocated share (42.01% with respect to TriMas and 57.99% with respect to Metaldyne) of liabilities not readily associated with either business, or otherwise addressed including certain costs related to other matters intended to effectuate other provisions of the agreement. These indemnification provisions survive indefinitely and are subject to a $50,000 deductible.
Heartland Industrial Partners
In connection with the Company's initial public offering of common stock in the second quarter of 2007, the Company paid Heartland $10.0 million to terminate its existing advisory services agreement, under which Heartland had provided services such as monitoring of business plans, strategic direction, development of projections, financial review, management and other restructuring and reorganization efforts, assistance with investor relations and other matters. The advisory services had been provided for an annual fee of $4.0 million plus expenses. Fees under the service agreement for the partial year January 1, 2007 through the date of the initial public offering were approximately $2.1 million. Fees and expenses charged under Heartland's advisory agreement are included in selling, general and administrative expenses in the accompanying consolidated statement of operations. In addition, subject to the approval, on a case-by-case basis, by the disinterested members of the Company's Board of Directors, Heartland retained its right to earn a fee not to exceed 1% of the transaction value for services provided in connection with certain future financings, acquisitions and divestitures by the Company, During 2009, Heartland charged the Company approximately $2.9 million for services rendered in connection with the Company's debt refinancing activities.
90
TRIMAS CORPORATION
NOTES TO CONSOLIDATED FINANCIAL STATEMENTS (Continued)
17. Employee Benefit Plans
Pension and Profit-Sharing Benefits
The Company provides a defined contribution profit sharing plan for the benefit of substantially all the Company's domestic salaried and non-union hourly employees. The plan contains both contributory and noncontributory profit sharing arrangements, as defined. Aggregate charges included in the accompanying statement of operations under this plan for both continuing and discontinued operations were approximately $4.2 million, $4.9 million and $4.9 million in 2009, 2008 and 2007, respectively. The Company's foreign and union hourly employees participate in defined benefit pension plans.
Postretirement Benefits
The Company provides postretirement medical and life insurance benefits, none of which are pre-funded, for certain of its active and retired employees.
Plan Assets, Expenses and Obligations
Plan assets, expenses and obligations for pension and postretirement benefit plans disclosed herein include both continuing and discontinued operations.
Net periodic pension and postretirement benefit costs recorded in the Company's statement of operations for defined benefit pension plans and postretirement benefit plans include the following components:
| |
Pension Benefit | Postretirement Benefit | ||||||||||||||||||
|---|---|---|---|---|---|---|---|---|---|---|---|---|---|---|---|---|---|---|---|---|
| |
2009 | 2008 | 2007 | 2009 | 2008 | 2007 | ||||||||||||||
| |
(dollars in thousands) |
|||||||||||||||||||
Service cost |
$ | 530 | $ | 470 | $ | 570 | $ | — | $ | 90 | $ | 90 | ||||||||
Interest cost |
1,620 | 1,490 | 1,660 | 100 | 420 | 420 | ||||||||||||||
Expected return on plan assets |
(1,610 | ) | (1,560 | ) | (2,060 | ) | — | — | — | |||||||||||
Amortization of prior-service cost |
10 | — | — | (260 | ) | — | — | |||||||||||||
Settlement/curtailment (gain)/loss |
— | — | 3,870 | (90 | ) | (1,600 | ) | — | ||||||||||||
Amortization of net (gain)/loss |
310 | 280 | 470 | (30 | ) | 30 | 100 | |||||||||||||
Net periodic benefit cost |
$ | 860 | $ | 680 | $ | 4,510 | $ | (280 | ) | $ | (1,060 | ) | $ | 610 | ||||||
In 2009 and 2007, the Company settled obligations outstanding under certain of its postretirement benefit plans, resulting in the recognition of previously deferred gains of approximately $0.1 million and $0.2 million, respectively. In 2008, the Company's post-retirement benefit obligation decreased approximately $4.1 million due to amendments and/or curtailments of certain of the Company's plans, resulting in recognition of an approximate $1.6 million gain.
In 2007, the Company's Packaging segment recognized a non-cash defined benefit pension settlement loss of approximately $3.9 million related to a plan for certain employees previously located at a distribution facility in Canada that was closed in 1997. The closure of the facility resulted in a partial windup of the plan. However, Canadian law did not specify how to distribute surplus assets related to partial windups of benefit plans. This issue has been resolved in the Canadian court system and, the Company's plan was approved by the Canadian regulatory authorities in November 2007, at which time the Company recorded the settlement loss.
91
TRIMAS CORPORATION
NOTES TO CONSOLIDATED FINANCIAL STATEMENTS (Continued)
17. Employee Benefit Plans (Continued)
The estimated net actuarial loss and prior service cost for the defined benefit pension and postretirement benefit plans that is expected to be amortized from accumulated other comprehensive income into net periodic benefit cost in 2010 is $0.1 million.
Actuarial valuations of the Company's defined benefit pension and postretirement plans were prepared as of December 31, 2009, 2008 and 2007. Weighted-average assumptions used in accounting for the U.S. defined benefit pension plans and postretirement benefit plans are as follows:
| |
Pension Benefit | Postretirement Benefit | |||||||||||||||||
|---|---|---|---|---|---|---|---|---|---|---|---|---|---|---|---|---|---|---|---|
| |
2009 | 2008 | 2007 | 2009 | 2008 | 2007 | |||||||||||||
Discount rate for obligations |
6.125 | % | 6.375 | % | 6.75 | % | 5.25 | % | 6.65 | % | 6.375 | % | |||||||
Discount rate for benefit costs |
6.375 | % | 6.75 | % | 6.00 | % | 6.65 | % | 6.375 | % | 5.75 | % | |||||||
Rate of increase in compensation levels |
N/A | N/A | N/A | N/A | N/A | N/A | |||||||||||||
Expected long-term rate of return on plan assets |
8.25 | % | 8.50 | % | 8.50 | % | N/A | N/A | N/A | ||||||||||
The Company historically utilized an above-median bond yield curve as the basis for its domestic discount rate for its pension and postretirement benefit plans. In 2008, the Company changed its basis for the discount rate from an above-median bond yield curve to a high-quality (Aa) corporate bond yield curve. Management believes this change removes the impact of including increased required corporate bond yields (potentially considered in the above-median curve) resulting from the economic downturn that began in the fourth quarter of 2008 that do not necessarily reflect the general trend in high-quality interest rates.
Actuarial valuations of the Company's non-U.S. defined benefit pension plans were prepared as of December 31, 2009, 2008 and 2007. Weighted-average assumptions used in accounting for the non-U. S. defined benefit pension plans are as follows:
| |
Pension Benefit | |||||||||
|---|---|---|---|---|---|---|---|---|---|---|
| |
2009 | 2008 | 2007 | |||||||
Discount rate for obligations |
5.90 | % | 6.70 | % | 5.80 | % | ||||
Discount rate for benefit costs |
6.70 | % | 5.80 | % | 5.30 | % | ||||
Rate of increase in compensation levels |
4.20 | % | 4.15 | % | 3.65 | % | ||||
Expected long-term rate of return on plan assets |
7.30 | % | 8.55 | % | 8.55 | % | ||||
92
TRIMAS CORPORATION
NOTES TO CONSOLIDATED FINANCIAL STATEMENTS (Continued)
17. Employee Benefit Plans (Continued)
The following provides a reconciliation of the changes in the Company's defined benefit pension and postretirement benefit plans' projected benefit obligations and fair value of assets for each of the years ended December 31, 2009 and 2008 and the funded status as of December 31, 2009 and 2008:
| |
Pension Benefit | Postretirement Benefit | ||||||||||||
|---|---|---|---|---|---|---|---|---|---|---|---|---|---|---|
| |
2009 | 2008 | 2009 | 2008 | ||||||||||
| |
(dollars in thousands) |
|||||||||||||
Changes in Projected Benefit Obligations |
||||||||||||||
Benefit obligations at January 1 |
$ | (24,500 | ) | $ | (27,780 | ) | $ | (1,830 | ) | $ | (6,880 | ) | ||
Service cost |
(530 | ) | (470 | ) | — | (90 | ) | |||||||
Interest cost |
(1,620 | ) | (1,490 | ) | (100 | ) | (420 | ) | ||||||
Participant contributions |
(50 | ) | (50 | ) | — | (50 | ) | |||||||
Actuarial gain (loss) |
(1,300 | ) | 370 | 240 | 910 | |||||||||
Benefit payments |
1,830 | 1,450 | 100 | 590 | ||||||||||
Curtailment/terminations |
— | (150 | ) | 90 | 4,110 | |||||||||
Change in foreign currency |
(1,080 | ) | 3,620 | — | — | |||||||||
Projected benefit obligations at December 31 |
$ | (27,250 | ) | $ | (24,500 | ) | $ | (1,500 | ) | $ | (1,830 | ) | ||
Accumulated benefit obligations at December 31 |
$ | (26,460 | ) | $ | (23,860 | ) | $ | (1,500 | ) | $ | (1,830 | ) | ||
| |
Pension Benefit | Postretirement Benefit | ||||||||||||
|---|---|---|---|---|---|---|---|---|---|---|---|---|---|---|
| |
2009 | 2008 | 2009 | 2008 | ||||||||||
| |
(dollars in thousands) |
|||||||||||||
Changes in Plan Assets |
||||||||||||||
Fair value of plan assets at January 1 |
$ | 15,110 | $ | 21,010 | $ | — | $ | — | ||||||
Actual return on plan assets |
1,960 | (3,080 | ) | — | — | |||||||||
Employer contributions |
1,640 | 2,040 | 100 | 540 | ||||||||||
Participant contributions |
50 | 50 | — | 50 | ||||||||||
Benefit payments |
(1,830 | ) | (1,450 | ) | (100 | ) | (590 | ) | ||||||
Change in foreign currency |
1,060 | (3,460 | ) | — | — | |||||||||
Fair value of plan assets at December 31 |
$ | 17,990 | $ | 15,110 | $ | — | $ | — | ||||||
| |
Pension Benefit | Postretirement Benefit | ||||||||||||
|---|---|---|---|---|---|---|---|---|---|---|---|---|---|---|
| |
2009 | 2008 | 2009 | 2008 | ||||||||||
| |
(dollars in thousands) |
|||||||||||||
Funded Status |
||||||||||||||
Plan assets less than projected benefits at |
||||||||||||||
December 31 |
$ | (9,250 | ) | $ | (9,390 | ) | $ | (1,500 | ) | $ | (1,830 | ) | ||
Unrecognized prior-service cost |
170 | 170 | (2,070 | ) | (2,330 | ) | ||||||||
Unrecognized net loss/(gain) |
11,380 | 10,340 | (390 | ) | (180 | ) | ||||||||
Net asset (liability) recognized at December 31 |
$ | 2,300 | $ | 1,120 | $ | (3,960 | ) | $ | (4,340 | ) | ||||
93
TRIMAS CORPORATION
NOTES TO CONSOLIDATED FINANCIAL STATEMENTS (Continued)
17. Employee Benefit Plans (Continued)