Attached files
| file | filename |
|---|---|
| 8-K - FORM 8-K - Symetra Financial CORP | d247827d8k.htm |
 Third Quarter 2011
Review
October 27, 2011
Draft, 10/26/11
Exhibit 99.1 |
 2
Forward-Looking Statements |
 3
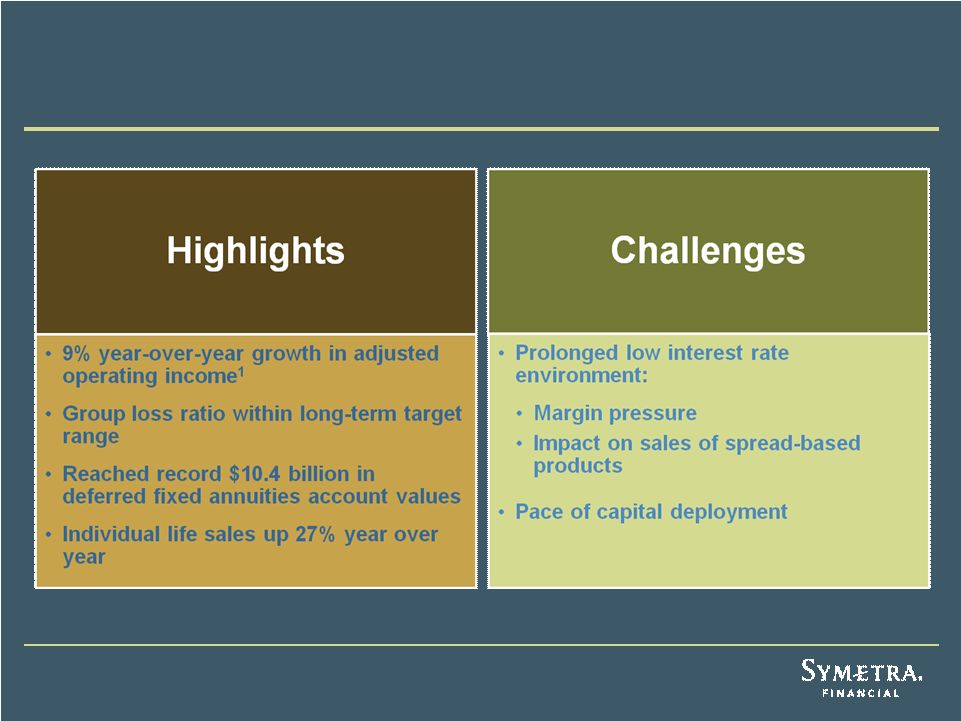
Third Quarter 2011 Summary
1
Denotes a non-GAAP financial measure. See Appendix for a definition of
these measures and reconciliations to the most directly comparable GAAP
measures. |
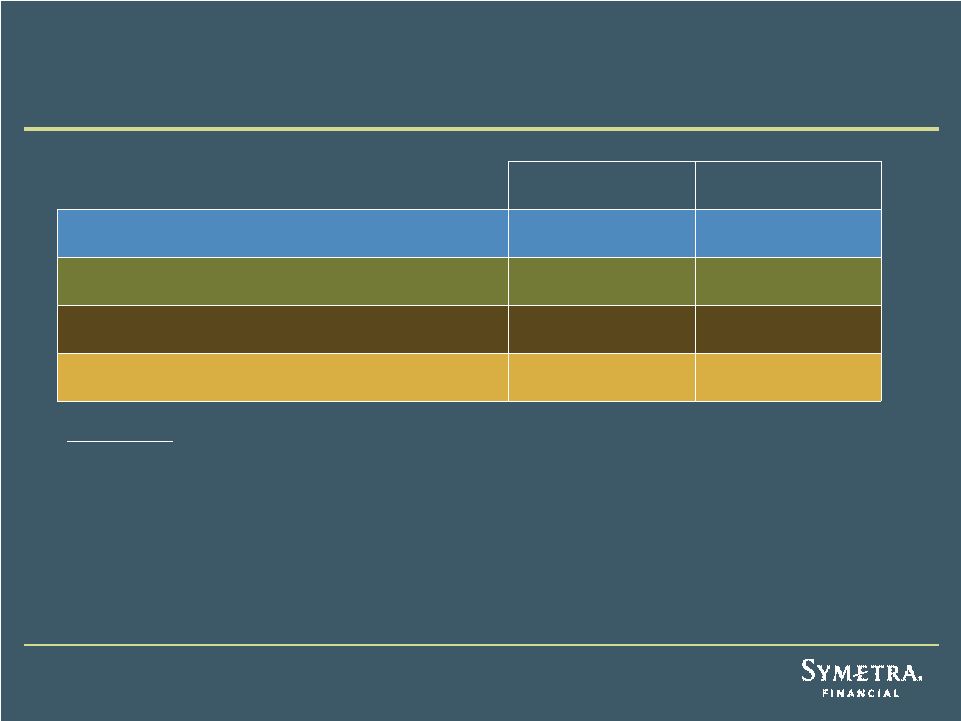
 Financial Results
4
Twelve Months Ended Sept. 30
2011
2010
Return on Equity (ROE)
7.1%
8.6%
Operating
Return
on
Average
Equity
(ROAE)
2
9.6%
9.4%
Three Months Ended Sept. 30
2011
2010
Net Income
$ 11.1
$ 56.6
Less:
Net
realized
investment
gains
(losses)
1
(36.9)
13.0
Add:
Net
investment
gains
(losses)
on
FIA
options
1
(0.4)
0.2
Adjusted
Operating
Income
2
$ 47.6
$ 43.8
$ in millions
1
Net of taxes
2
Denotes a non-GAAP financial measure. See Appendix for a definition of
these measures and reconciliations to the most directly comparable GAAP
measures. |
 Group Segment
33%
of
Pretax
Adjusted
Operating
Income
1
5
Priorities:
•
Successful campaign for 1/1/12 medical stop-loss renewals and new
business
•
Transition
AUL
3
medical
stop-loss
business
to
Symetra
(we
expect
to
renew approx. 2/3 of the AUL premium)
•
Drive growth in group life premium
3Q11
3Q10
Operating Revenues
2
$ 149.2
$ 117.3
Pretax Adjusted Operating Income
$ 22.0
$ 16.7
Group Loss Ratio
63.6%
66.5%
Total Sales
$ 20.1
$ 18.4
$ in millions
1
Denotes a non-GAAP financial measure. See Appendix for a definition of
these measures and reconciliations to the most directly comparable GAAP
measures. 2
Defined
as
total
revenue
excluding
net
realized
investment
gains
(losses).
3
American United Life Insurance Co. |
 Deferred Annuities Segment
41%
of
Pretax
Adjusted
Operating
Income
1
6
Priorities:
•
Maintain strong interest spread on fixed annuities
•
Accelerate the uptake rate of fixed indexed annuity (FIA) product on bank
and broker-dealer platforms
•
Develop new variable annuity (VA) product for the lower cost non-living
benefits market
3Q11
3Q10
Operating
Revenues
2
$ 137.2
$ 124.0
Pretax Adjusted Operating Income
$ 28.0
$ 22.5
Interest Spread
1.92%
1.85%
Total Sales
$ 393.6
$ 286.4
Ending Total Account Values
$11,093.3
$9,548.2
$ in millions
1
Denotes a non-GAAP financial measure. See Appendix for a definition of
these measures and reconciliations to the most directly comparable GAAP
measures. 2
Defined
as
total
revenue
excluding
net
realized
investment
gains
(losses)
and
including
net
investment
gains
(losses) on FIA options. |
 Income Annuities Segment
11%
of
Pretax
Adjusted
Operating
Income
1
7
Priorities:
•
Continue to drive profitability of existing block in low interest rate
environment with commercial mortgage loan origination strategy
•
Focus on shorter duration opportunities
3Q11
3Q10
Operating
Revenues
2
$ 102.5
$ 105.7
Pretax Adjusted Operating Income
$ 7.1
$ 9.5
Base Interest Spread
3
0.54%
0.59%
Total Sales
$ 64.6
$ 58.0
$ in millions
1
Denotes a non-GAAP financial measure. See Appendix for a definition of
these measures and reconciliations to the most directly comparable GAAP
measures. 2
Defined
as
total
revenue
excluding
net
realized
investment
gains
(losses).
3
Interest spread excluding mortgage-backed securities prepayment speed
adjustment. |
 Life Segment
18%
of
Pretax
Adjusted
Operating
Income
8
Priorities:
•
Enhance new Symetra Classic Universal Life insurance product with the
rollout of additional benefits riders in 4Q11
•
Secure
distribution
agreements
with
select
BGA
partners
3Q11
3Q10
Operating
Revenues
$ 110.9
$ 107.4
Pretax Adjusted Operating Income
$ 12.4
$ 15.3
BOLI Return on Assets
0.82%
0.92%
Individual Sales
$ 3.3
$ 2.6
BOLI Sales
$ --
$ 7.5
$ in millions
1
Denotes a non-GAAP financial measure. See Appendix for a definition of
these measures and reconciliations to the most directly comparable GAAP
measures. 2
Defined
as
total
revenue
excluding
net
realized
investment
gains
(losses).
3
Brokerage general agents.
1
3
2 |
 9
Clean Balance Sheet
•
Tangible book value
1
1
= 90% of total stockholders’
equity
•
Statutory book value = $1,996.7 million = 65% of total stockholders’
equity (97% of adjusted book value
1
1
)
•
Estimated risk-based capital (RBC) ratio of 455%
•
Down from estimated 466% at 6/30/11 due to AUL renewal rights
acquisition and unrealized losses on mark-to-market equities and
REITs •
DAC = only 7% of total stockholders’
equity
•
3Q11 includes $1.3M pretax favorable unlocking
As of 9/30/11
1
Denotes a non-GAAP financial measure. See Appendix for definition and
reconciliation to most directly comparable GAAP measure.
|
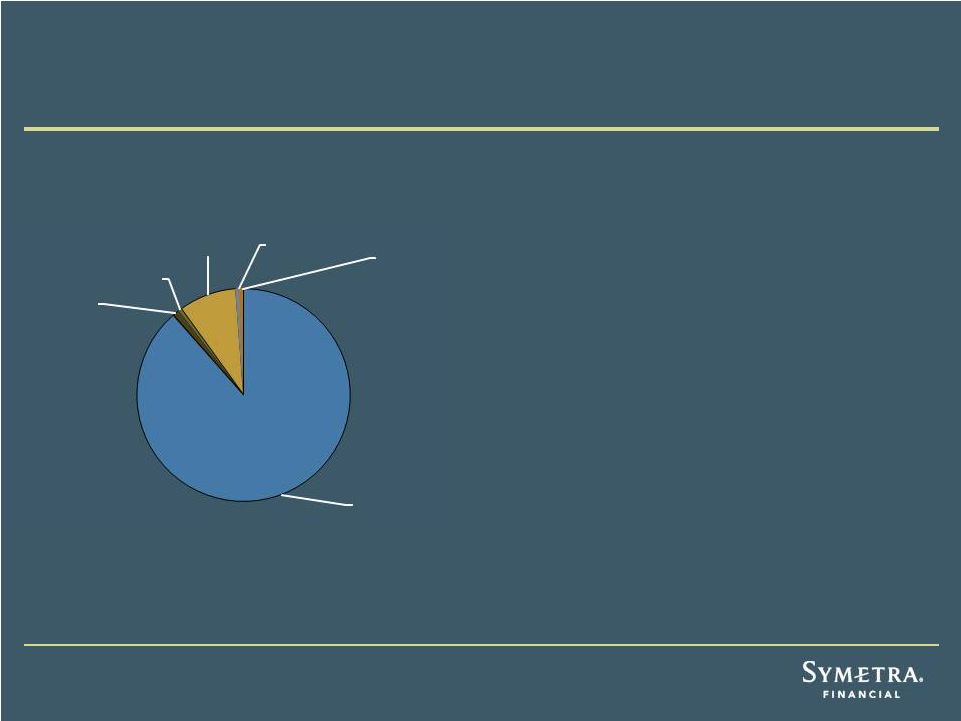 $25.9 billion
Portfolio Composition
As of 9/30/11
10
High-Quality Investment Portfolio
1
Included in trading marketable equity securities.
2
From inception of Symetra portfolio in January 2005 through 9/30/11.
3
FTSE NAREIT All Equity REITS Index.
•
Pretax impairments of $4.9M in 3Q11 vs $3.5M in
3Q10
•
AOCI of $1,006.5M at 9/30/11 vs $819.4M at
9/30/10
•
RMBS $3.7B
•
Gross premium of ($68.2M)
•
Gross discount of $74.1M
•
Average mortgage loan rate = 5.5%
•
Outstanding long-term equity portfolio
performance: Life-to-date annualized total return
of 8.6% (vs 1.1% for S&P 500 Total Return Index)
•
YTD annualized total return for REITs of (10.9)% vs
benchmark total return of (8.5)%
•
European exposure of $1.3B
•
$0.7M of sovereign
•
$162.4M of financials
•
Largest holding = $112.6M of Shell
•
Commercial mortgage loans (CML) offer attractive
yields: 3Q11 originations funded at approx. 300 bp
spread to Treasurys
Fixed
maturities,
88.5%
Equities,
1.0%
REITs
1
, 0.5%
Commercial
mortgage
loans, 8.8%
Limited
partnerships,
0.8%
Policy loans
and other,
0.4%
2
3 |
 11
•
“Successful efforts”
DAC accounting becomes effective 1/1/2012
•
Symetra will retrospectively adopt
•
Expenses that will no longer be deferrable include:
•
Indirect sales costs (e.g., key account management)
•
Marketing and advertising costs
•
Future net income impact will depend upon expected future sales levels, sales
expense levels and changes in projected amortization
1
Accounting Standards Update 2010-26, Financial Services –
Insurance (ASU 2010-26), Accounting for
Costs Associated with Acquiring or Renewing Insurance Contracts.
2
Denotes a non-GAAP financial measure. See Appendix for definition and
reconciliation to most directly comparable GAAP measure.
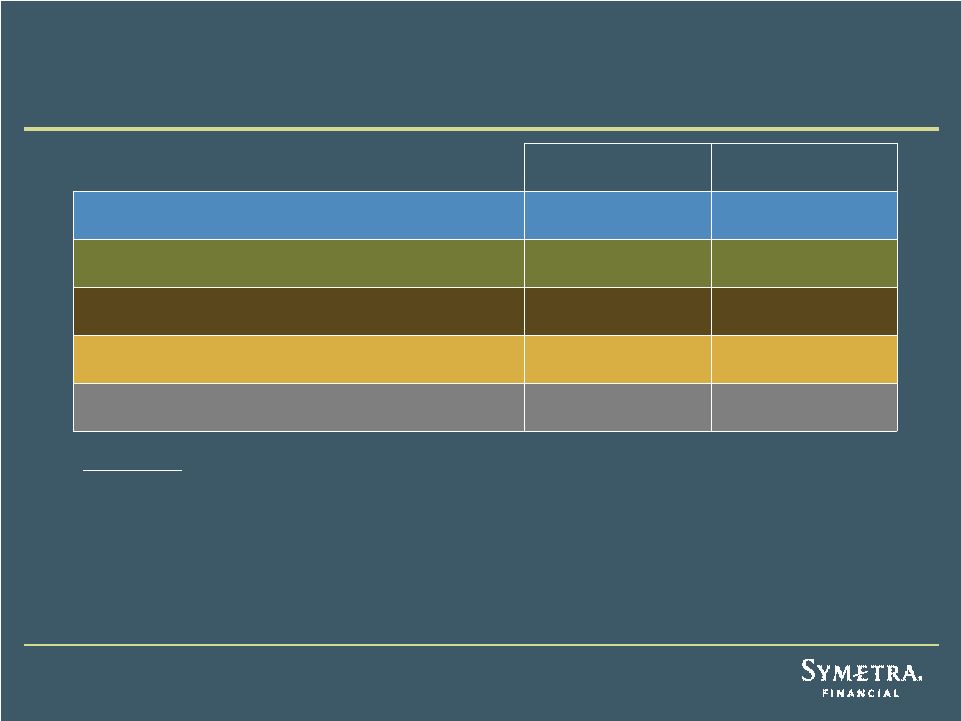
New Accounting for Deferred Acquisition Costs
1
As of
12/31/10
Range of Estimated Impact
on 12/31/10 Balances
DAC Balance
$ 250.0
-12%
to
-18%
Book Value
$ 2,380.6
-0.8%
to
-1.2%
Adjusted
Book
Value²
$ 1,948.1
-1.3%
to
-1.7% |
 Analysis of Low Interest Rates
12
•
Previously, we said that a shock drop of 100 bp in interest rates from 6/30/11
$(0.03) -
$(0.05) estimated impact on Adjusted Operating EPS
1
over a six-month period
•
For 3Q11 analysis, we used interim models to develop reinvestment cash flows and
statutory reserve estimates
•
We focused on results using 9/30/11 interest rates (10-year Treasury =
2.01%) •
Our estimates could be affected by changes in monetary policy, government programs
to stimulate mortgage refinancing, significant increases in corporate
refinance activity Estimated
Amount of
Reinvestment
Risk
Management
Tools
Surplus
~ $250
CML
Deferred Annuity
< $50
Rate resets
Income Annuity
< $50
CML
BOLI
< $350
CML, rate resets,
other product levers
$ in millions
1
Denotes a non-GAAP financial measure. See Appendix for a definition of
these measures and reconciliations to the most directly comparable GAAP
measures. Estimated Statutory Cash
Flow Testing Reserves
$30 -
$60
8 -16 points RBC |
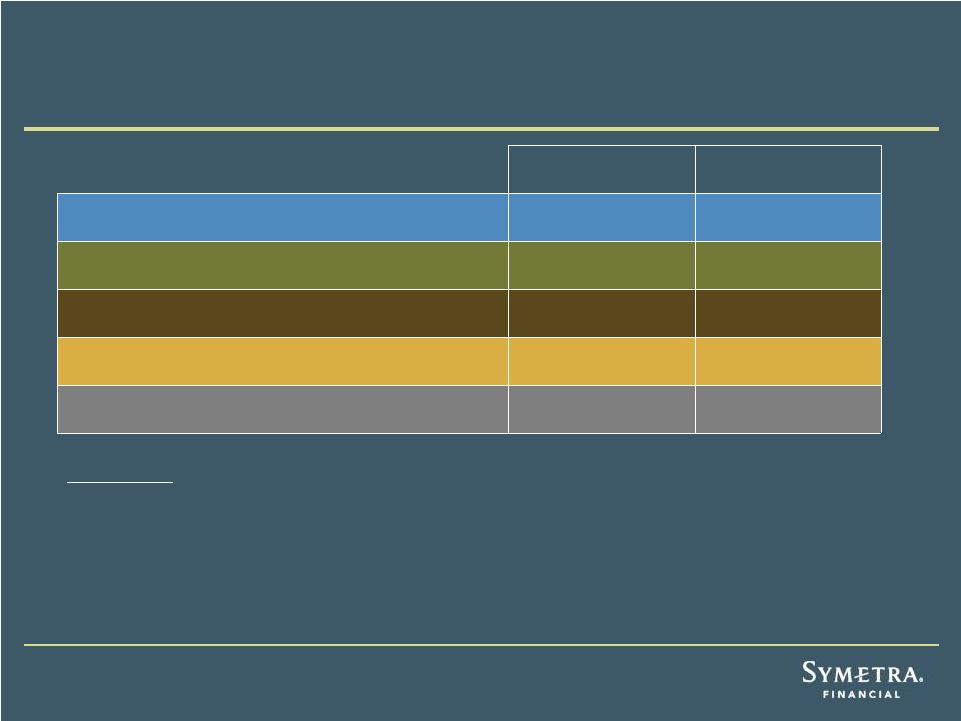
 Capital Management Priorities
Key Consideration: Ratings
13 |
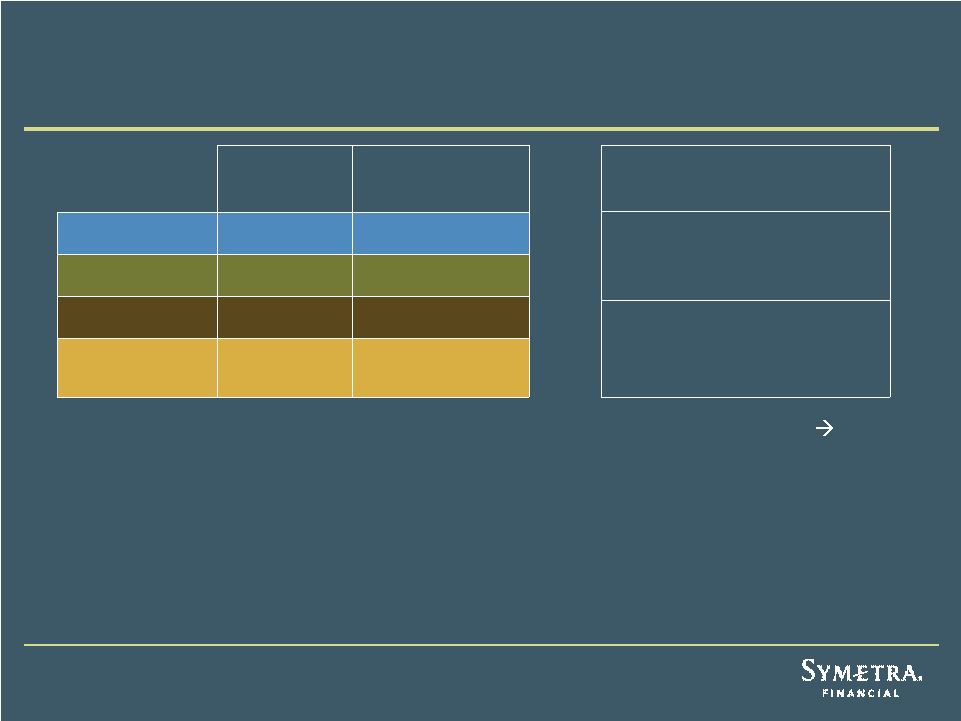
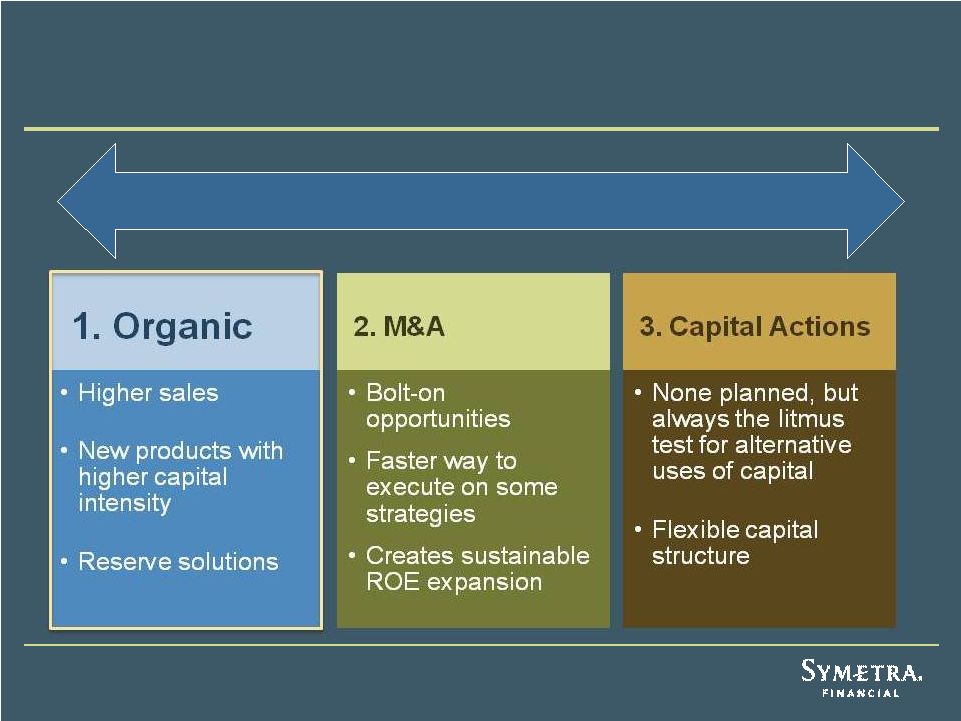
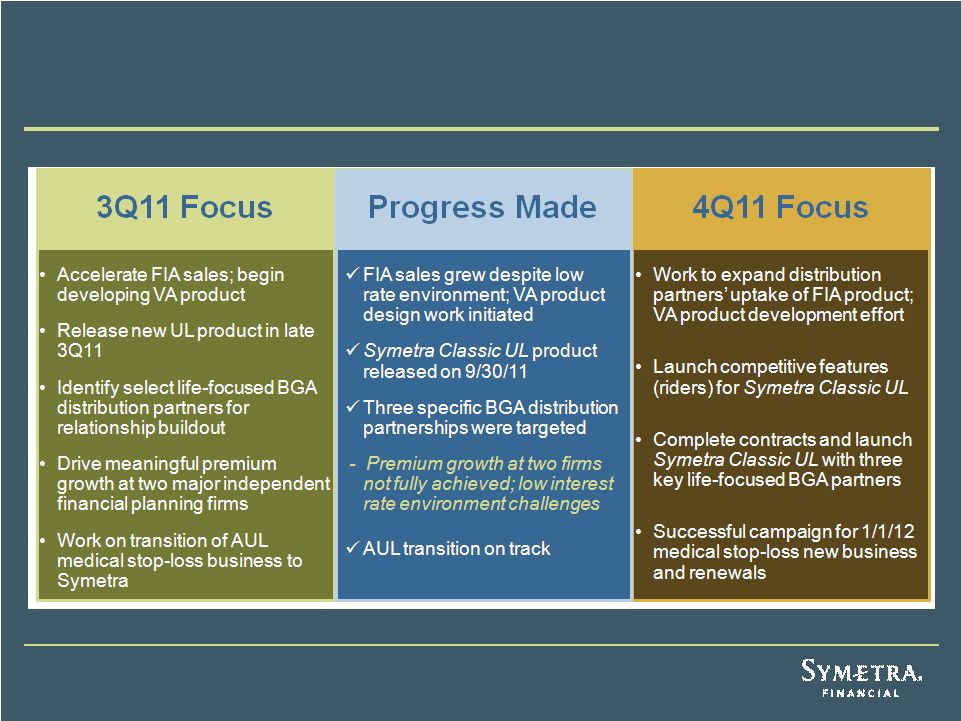 Grow & Diversify: Tracking Our Progress
14 |
 Appendix
15 |
 Reconciliation of Non-GAAP Measures
Three Months Ended
September 30
2011
2010
Net income
$ 11.1
$ 56.6
Less: Net realized investment gains (losses) (net of taxes)
(36.9)
13.0
Add: Net investment gains (losses) on FIA options (net of taxes)
(0.4)
0.2
Adjusted operating income
1
$ 47.6
$ 43.8
Adjusted operating income per diluted share of common stock
2
$ 0.35
$ 0.32
Twelve Months Ended
September 30
2011
2010
Return on equity (ROE)
7.1%
8.6%
Average book value
$ 2,646.0
$ 1,987.9
Operating return on average equity (ROAE)
3
9.6%
9.4%
Average adjusted book value
$ 1,988.0
$ 1,695.9
1
Adjusted operating income is a non-GAAP financial measure calculated as net
income, less after-tax net realized investment gains (losses), plus
after-tax net investment gains (losses) on our fixed indexed annuity (FIA)
options. ² Diluted weighted average shares outstanding for the three
months ended Sept. 30, 2011 and 2010 were 137.571 million and 137.145 million,
respectively. ³ Operating ROAE is a non-GAAP financial
measure computed as adjusted operating income for the most recent four quarters,
divided by average adjusted book value for the most recent five
quarters. Adjusted book value is stockholders’ equity
excluding
AOCI.
$ in millions
16 |
 Reconciliation of Non-GAAP Measures (cont.)
Three Months Ended
September 30
2011
2010
Segment pretax adjusted operating income:
Group
$ 22.0
$ 16.7
Deferred Annuities
28.0
22.5
Income Annuities
7.1
9.5
Life
12.4
15.3
Other
(1.7)
(0.5)
Subtotal
67.8
63.5
Less: Income Taxes
1
20.2
19.7
Adjusted operating income
2
$ 47.6
$ 43.8
1
Represents the total provision for income taxes adjusted for the tax effect on net
realized investment gains (losses) and on net realized and unrealized
investment gains (losses) on fixed indexed annuity (FIA) options at the U.S. federal income tax rate of 35%.
2
Adjusted operating income is a non-GAAP financial measure calculated as net
income, less after-tax net realized investment gains (losses), plus
after-tax net investment gains (losses) on our fixed indexed annuity (FIA) options.
$ in millions
17 |
 Reconciliation of Non-GAAP Measures (cont.)
1
Adjusted
book
value
is
a
non-GAAP
financial
measure
calculated
as
stockholders’
equity
excluding
AOCI.
2
Tangible
book
value
is
a
non-GAAP
financial
measure
calculated
as
stockholders’
equity
excluding
deferred
policy
acquisition
costs, goodwill and other non-tangible assets.
$ in millions
18
As of Sept. 30, As of Dec. 31,
2011
2010
Total stockholders' equity
$ 3,060.0
$ 2,380.6
Less: Accumulated other comprehensive income (AOCI)
1,006.5
432.5
Adjusted book value
2,053.5
1,948.1
Total Stockholders' Equity
3,060.0
Less:
Deferred policy acquisition costs
202.1
Goodwill
29.9
Intangible assets
29.6
Other non-tangible assets
57.4
Tangible
book
value
$ 2,741.0
2
1 |
 |