Attached files
| file | filename |
|---|---|
| EX-99.1 - PRESS RELEASE OF VISA INC. - VISA INC. | d247231dex991.htm |
| 8-K - FORM 8-K - VISA INC. | d247231d8k.htm |
 Visa
Inc. Fiscal Fourth Quarter and
Full-Year 2011
Financial Results
October 26, 2011
Exhibit 99.2 |
 Fiscal Fourth Quarter and Full-Year 2011 Financial Results
2
Forward-Looking Statements
This presentation contains forward-looking statements within the meaning of the U.S. Private
Securities Litigation Reform Act of 1995. These statements can be identified by the terms
“expect,” “will,” “continue” and similar references to the future. Examples of such forward-looking statements include, but are not
limited to, statements we make about our earnings per share, cash flow, revenue, incentive payments,
expenses, operating margin, tax rate and capital expenditures and the growth of those
items. By their nature, forward-looking statements: (i) speak only as of the date they are made, (ii) are
neither statements of historical fact nor guarantees of future performance and (iii) are
subject to risks, uncertainties, assumptions and changes in circumstances that are difficult to predict or quantify. Therefore, actual results
could differ materially and adversely from those forward-looking statements because of a variety
of factors, including the following:
–
the impact of new laws, regulations and marketplace barriers, particularly the rules recently
promulgated under the U.S. Wall Street Reform and Consumer Protection Act, including: •
rules capping debit interchange rates; •
rules expanding issuers’ and retailers’ choice among debit payment networks; •
the spread of regulation of debit payments to credit and other product categories; •
the spread of U.S. regulations to other countries; and •
rules about consumer privacy and data use and security –
developments in current or future disputes and our ability to absorb their impact, including
interchange, tax and antitrust; –
macroeconomic factors, such as:
•
global economic, political, health and other conditions; •
cross-border activity and currency exchange rates; and •
material changes in our clients’ performance compared to our estimates; –
industry developments, such as: •
competitive pressure, particularly on client pricing; •
rapid technological developments; •
bank and merchant consolidation and their increased focus on payment card costs; •
disintermediation from the payments value stream through new entrants, government actions or
bilateral agreements; and
•
adverse changes in our relationships and reputation; –
system developments, such as: •
disruption of our transaction processing systems or the inability to process transactions
efficiently;
•
our clients’ failure to fund settlement obligations we have guaranteed; •
disruption of our transaction processing systems or the inability to process transactions
efficiently;
•
account data breaches or increased fraudulent or other illegal activities involving our cards; and •
issues arising at Visa Europe, including failure to maintain interoperability between our systems; –
costs arising if Visa Europe were to exercise its right to require us to acquire all of its
outstanding stock;
–
loss of organizational effectiveness or key employees; –
failure to integrate successfully recent acquisitions or new technologies; –
changes in accounting principles or treatments; and the other
factors discussed under the heading “Risk Factors” in our annual report on Form 10-K filed with the U.S. Securities and Exchange Commission. You
should not place undue reliance on such statements. Unless required to do so by law, we do not intend
to update or revise any forward-looking statement because of new information or future
developments or otherwise. |
 Fiscal Fourth Quarter and Full-Year 2011 Financial Results
3
Solid Fiscal Fourth Quarter and
Full-Year Results
•
Strong
operating
revenues
of
$2.4
billion
for
the
fourth
quarter
and
$9.2
billion for the full-year, up 13% and 14% over prior year
•
Quarterly and adjusted annual net income of $880 million and $3.5 billion,
and diluted earnings per share of $1.27 and $4.99, up 34% and 28% over
prior period adjusted amounts
•
Continued positive secular trends and spending momentum contributed to
double-digit growth year over year in key underlying business drivers for the
past two years
•
Repurchased 5.2 million class A common shares during the fiscal fourth
quarter at an average price of $80.87. For full-year 2011, effectively
repurchased 43 million shares at an average price of $74.94 per share for a
total cost of $3.2 billion |
 Fiscal Fourth Quarter and Full-Year 2011 Financial Results
4
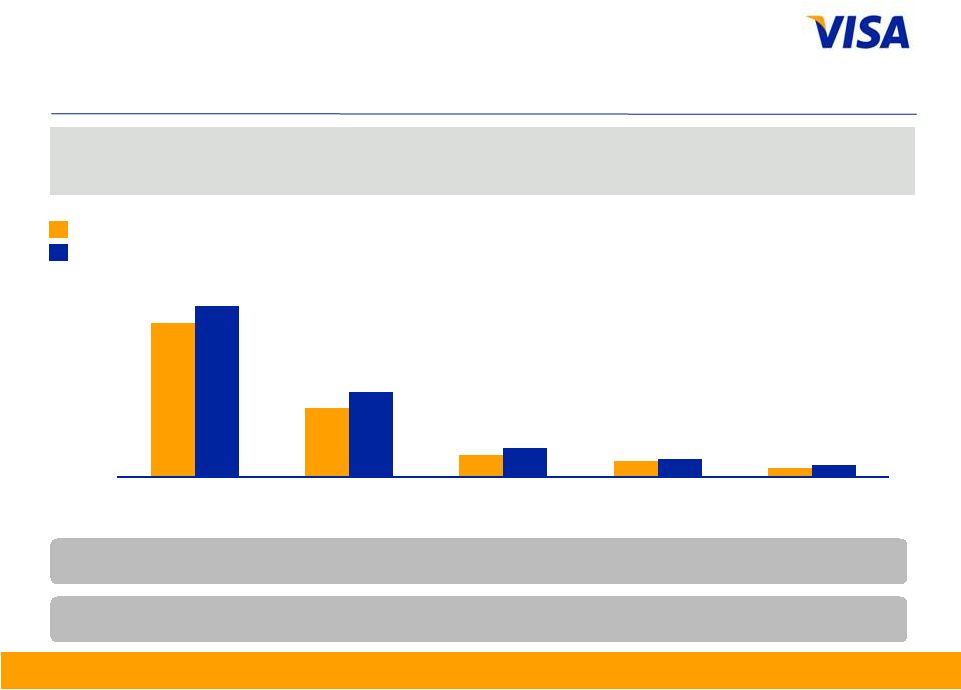
Payments Volume
US$ in billions, nominal, except percentages
YOY Change
(nominal)
19%
15%
17%
YOY Change
(constant)
14%
13%
14%
Note: Figures may not sum due to rounding. Growth rates calculated based on whole
numbers, not rounded numbers. From time to time, previously submitted volume
information may be updated. Prior year volume information presented has not been updated, as changes made are not material.
Constant dollar growth rates exclude the impact of foreign currency fluctuations
against the U.S. dollar in measuring performance. ROW
=
Rest
of
World
Quarter ended June
802
481
321
941
572
369
Total Visa Inc.
Credit
Debit
2010
2011
U.S.
469
ROW
333
U.S.
204
ROW
277
U.S.
518
ROW
423
U.S.
224
ROW
348
U.S.
294
ROW 75
U.S.
266
ROW 55 |
 Fiscal Fourth Quarter and Full-Year 2011 Financial Results
5
Payments Volume
US$ in billions, nominal, except percentages
YOY Change
(nominal)
19%
14%
17%
YOY Change
(constant)
13%
14%
13%
Note: Current quarter payments volume and other select metrics are provided in the
operational performance data supplement to provide more recent operating
data. Service revenues continue to be recognized based on payments volume in the prior quarter. From time to time, reported
payments volume information may be updated to reflect revised client submissions or
other adjustments. Prior year volume information presented has not
been updated, as changes made are not material Figures may not sum due to rounding.
Quarter ended September
2010
2011
829
970
502
327
597
373
473
ROW
356
U.S.
207
ROW
295
U.S.
266
ROW 61
U.S.
516
ROW
453
U.S.
228
ROW
369
ROW 85
U.S.
288
ROW
=
Rest
of
World
Total Visa Inc.
Credit
Debit
U.S.
473 |
 Fiscal Fourth Quarter and Full-Year 2011 Financial Results
6
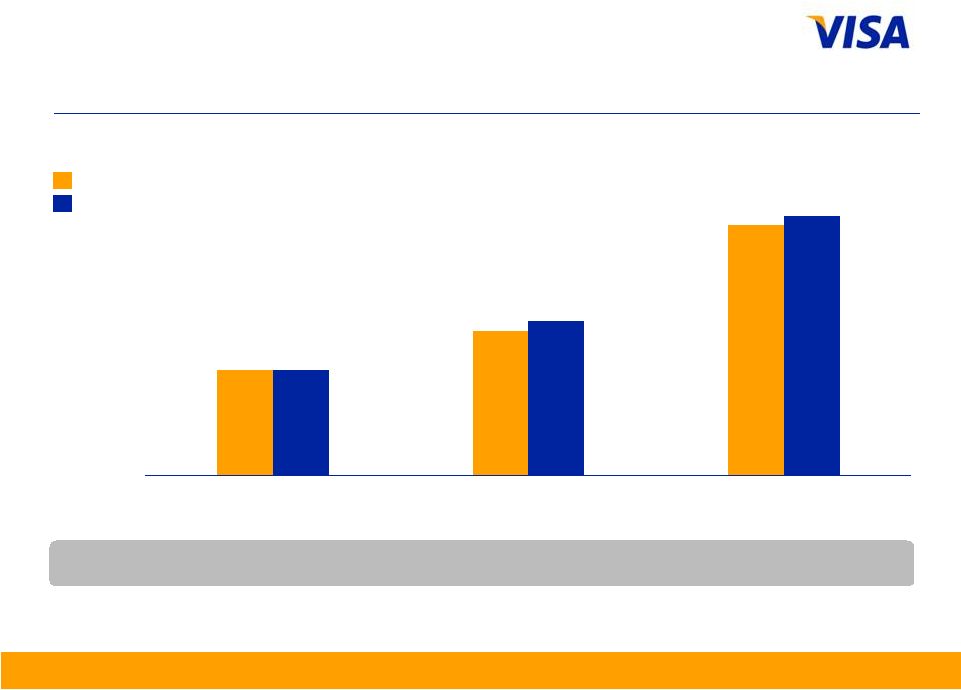
Payments Volume
US$ in billions, nominal, except percentages
Twelve Months ended June
YOY Change
(nominal)
15%
18%
16%
YOY Change
(constant)
14%
12%
17%
Note: Figures
may
not
sum
due
to
rounding.
Growth
rates
calculated
based
on
whole
numbers,
not
rounded
numbers.
From
time
to
time,
previously
submitted
volume
information
may
be
updated.
Prior
year
volume
information
presented
has
not
been
updated,
as
changes
made
are
not
material.
Constant
dollar
growth
rates
exclude
the
impact
of
foreign
currency
fluctuations
against
the
U.S.
dollar
in
measuring
performance.
ROW
=
Rest
of
World
3,037
1,861
1,176
3,530
2,141
1,390
Total Visa Inc.
Credit
Debit
Fiscal 2010
Fiscal 2011
U.S.
1,752
ROW
1,285
U.S.
781
ROW
1,080
U.S.
1,961
ROW
1,569
U.S.
846
ROW
1,295
U.S.
1,115
ROW 275
U.S.
971
ROW 206 |
 Fiscal Fourth Quarter and Full-Year 2011 Financial Results
7
Payments Volume
US$ in billions, nominal, except percentages
YOY Change
(nominal)
17%
16%
17%
YOY Change
(constant)
14%
13%
15%
Note: Current quarter payments volume and other select metrics are provided in the
operational performance data supplement to provide more recent operating
data. Service revenues continue to be recognized based on payments volume in the prior quarter. From time to time, reported
payments volume information may be updated to reflect revised client submissions or
other adjustments. Prior year volume information presented has
not
been
updated,
as
changes
made
are
not
material
Figures
may
not
sum
due
to
rounding.
Twelve Months ended September
Total Visa Inc.
Credit
Debit
ROW 220
U.S.
1,808
ROW
1,337
U.S.
794
ROW
1,116
U.S.
2,004
U.S.
867
U.S.
1,137
U.S.
1,014
ROW
1,666
ROW
1,368
ROW 299
3,145
1,910
1,235
3,670
2,235
1,435
ROW
=
Rest
of
World
Fiscal 2010
Fiscal 2011 |
 Fiscal Fourth Quarter and Full-Year 2011 Financial Results
8
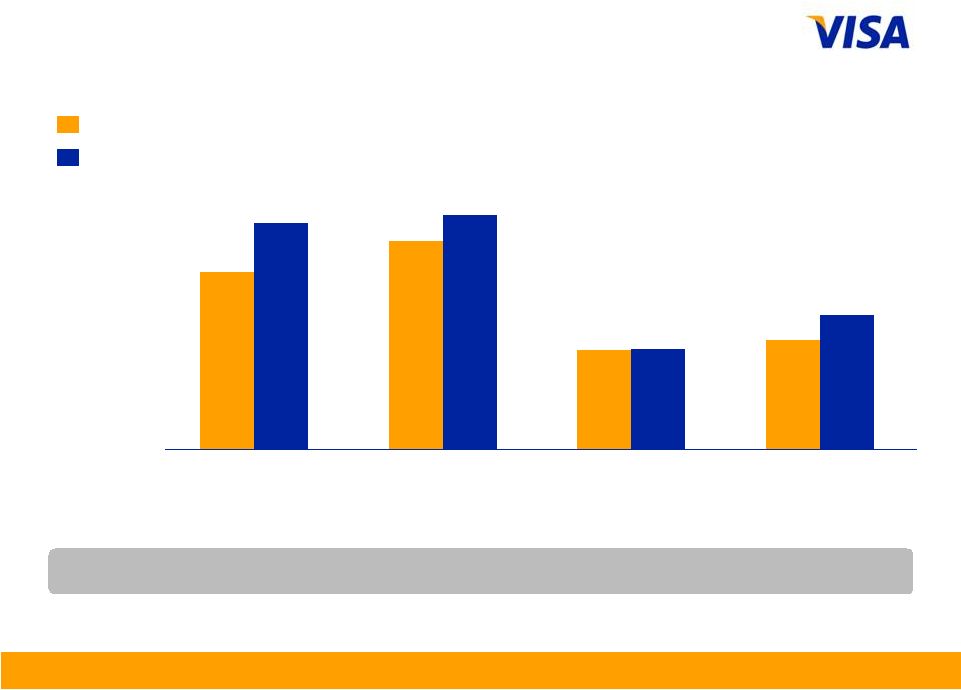
Payments Volume
US$ in billions, nominal, except percentages
YOY Change
(nominal)
26%
14%
10%
37%
42%
YOY Change
(constant)
10%
15%
8%
28%
35%
Note: Growth rates calculated based on whole numbers, not rounded numbers. From
time to time, previously submitted volume information may be updated. Prior
year volume information presented has not been updated, as changes made are not material. Constant dollar growth rates exclude
the impact of foreign currency fluctuations against the U.S. dollar in measuring
performance. 2010
2011
469
198
62
48
24
518
248
85
55
35
United States
Asia Pacific
Latin America and
Caribbean
Canada
Central and
Eastern Europe,
Middle East and
Africa
Quarter ended June |
 Fiscal Fourth Quarter and Full-Year 2011 Financial Results
9
Payments Volume
US$ in billions, nominal, except percentages
Note: Current quarter payments volume and other select metrics are provided in the
operational performance data supplement to provide more recent operating
data. Service revenues continue to be recognized based on payments volume in the prior quarter. From time to time, reported
payments volume information may be updated to reflect revised client submissions or
other adjustments. Prior year volume information presented has not been
updated, as changes made are not material. Figures may not sum due to rounding.
YOY Change
(nominal)
28%
14%
9%
31%
40%
YOY Change
(constant)
17%
7%
9%
25%
37%
Quarter ended September
2010
2011
473
212
68
49
27
516
271
90
55
37
United States
Asia Pacific
Latin America and
Caribbean
Canada
Central and
Eastern Europe,
Middle East and
Africa |
 Fiscal Fourth Quarter and Full-Year 2011 Financial Results
10
1,752
771
240
183
91
1,961
931
312
204
122
United States
Asia Pacific
Latin America and
Caribbean
Canada
Central and
Eastern Europe,
Middle East and
Africa
Payments Volume
US$ in billions, nominal, except percentages
YOY Change
(nominal)
21%
12%
12%
30%
34%
YOY Change
(constant)
12%
13%
7%
26%
32%
Note: Growth rates calculated based on whole numbers, not rounded numbers. From
time to time, previously submitted volume information may be updated. Prior
year volume information presented has not been updated, as changes made are not material. Constant dollar growth rates exclude
the impact of foreign currency fluctuations against the U.S. dollar in measuring
performance. Twelve Months ended June
2010
2011 |
 Fiscal Fourth Quarter and Full-Year 2011 Financial Results
11
Payments Volume
US$ in billions, nominal, except percentages
YOY Change
(nominal)
23%
13%
11%
32%
37%
YOY Change
(constant)
15%
7%
11%
26%
34%
Twelve Months ended September
2010
2011
Note: Current quarter payments volume and other select metrics are provided in the
operational performance data supplement to provide more recent operating
data. Service revenues continue to be recognized based on payments volume in the prior quarter. From time to time, reported
payments volume information may be updated to reflect revised client submissions or
other adjustments. Prior year volume information presented has not been
updated, as changes made are not material. Figures may not sum due to rounding.
1,808
800
253
187
97
2,004
990
333
211
133
United States
Asia Pacific
Latin America and
Caribbean
Canada
Central and Eastern
Europe, Middle East
and Africa |
 Fiscal Fourth Quarter and Full-Year 2011 Financial Results
12
Transactions
in millions, except percentages
Quarter ended June
Quarter ended September
Note: Processed transactions represent transactions involving Visa, Visa Electron,
Interlink and Plus cards processed on Visa’s networks. Total transactions
represent payments and cash transactions as reported by Visa clients on their
operating certificates. From time to time, previously submitted transaction
information may be updated. Prior year transaction information presented has not
been updated, as changes made are not material. YOY
Change
10%
11%
9%
9%
2010
2011
17,582
11,721
19,404
13,038
Total Transactions
Processed
Transactions
Credit
35%
Debit
65%
Credit
35%
Debit
65%
18,149
12,119
19,779
13,263
Total Transactions
Processed
Transactions
Credit
35%
Debit
65%
Credit
36%
Debit
64% |
 Fiscal Fourth Quarter and Full-Year 2011 Financial Results
13
Transactions
in millions, except percentages
Twelve Months ended June
Twelve Months ended September
Note: Processed transactions represent transactions involving Visa, Visa Electron,
Interlink and Plus cards processed on Visa’s networks. Total
transactions represent payments and cash transactions as reported by Visa clients
on their operating certificates. From time to time, previously submitted
transaction information may be updated. Prior year transaction information presented has not been updated, as changes made are not
material.
YOY
Change
13%
14%
11%
12%
2010
2011
Credit
36%
Debit
64%
Credit
35%
Debit
65%
Credit
36%
Debit
64%
Credit
35%
Debit
65%
Total Transactions
Processed
Transactions
Total
Transactions
Processed
Transactions
Total
66,158
43,755
74,456
49,778
68,423
45,411
76,084
50,922 |
 Fiscal Fourth Quarter and Full-Year 2011 Financial Results
14
Total Cards
in millions, except percentages
YOY
Change
7%
4%
(1%)
Note: From time to time, previously submitted card information may be
updated. Prior year card information presented has not been updated, as
changes made are not material
2010
2011
772
1,065
1,837
766
1,137
1,903
Credit
Debit
Visa Inc.
Quarter ended June |
 Fiscal Fourth Quarter and Full-Year 2011 Financial Results
15
Revenue –
Q4 2011
US$ in millions, except percentages
YOY
Change
37%
13%
17%
Note: Growth rates calculated based on whole numbers, not rounded numbers.
Percentage of
Gross Revenues
19%
81%
2,538
(421)
2,117
2,959
(576)
2,383
Gross Revenues
Incentives
Net Operating Revenues
Fiscal 2010
Fiscal 2011 |
 Fiscal Fourth Quarter and Full-Year 2011 Financial Results
16
Revenue –
Fiscal Year 2011
US$ in millions, except percentages
Percentage of
Gross Revenues
17%
83%
Note: Growth rates calculated based on whole numbers, not rounded numbers.
YOY
Change
21%
14%
15%
9,625
(1,560)
8,065
11,068
(1,880)
9,188
Gross Revenues
Incentives
Net Operating
Revenues
Fiscal 2010
Fiscal 2011 |
 Fiscal Fourth Quarter and Full-Year 2011 Financial Results
17
Revenue Detail –
Q4 2011
US$ in millions, except percentages
Note: Growth rates calculated based on whole numbers, not rounded numbers.
YOY
Change
10%
23%
21%
3%
Fiscal 2010
Fiscal 2011
912
840
619
167
1,105
925
758
171
Service
Revenues
Data Processing
Revenues
International
Transaction
Revenues
Other Revenues |
 Fiscal Fourth Quarter and Full-Year 2011 Financial Results
18
Revenue Detail –
Fiscal Year 2011
US$ in millions, except percentages
Note: Growth rates calculated based on whole numbers, not rounded numbers.
YOY
Change
11%
17%
22%
(8%)
Fiscal 2010
Fiscal 2011
3,497
3,125
2,290
713
4,261
3,478
2,674
655
Service
Revenues
Data Processing
Revenues
International
Transaction
Revenues
Other Revenues |
 Fiscal Fourth Quarter and Full-Year 2011 Financial Results
19
Operating Margin –
Q4 2011
US$ in millions, except percentages
Note: Growth rates calculated based on whole numbers, not rounded numbers.
YOY
Change
13%
2%
4 ppts
22%
Fiscal 2010
Fiscal 2011
53%
2,117
1,004
1,113
57%
2,383
1,021
1,362
Operating
Margin
Net Operating
Revenues
Total Operating
Expenses
Operating
Income |
 Fiscal Fourth Quarter and Full-Year 2011 Financial Results
20
Operating Margin –
Fiscal Year 2011
US$ in millions, except percentages
Note: Growth rates calculated based on whole numbers, not rounded numbers.
YOY
Change
14%
7%
2 ppts
19%
Fiscal 2010
Fiscal 2011
57%
8,065
3,476
4,589
59%
9,188
3,732
5,456
Operating
Margin
Net Operating
Revenues
Total Operating
Expenses
Operating
Income |
 Fiscal Fourth Quarter and Full-Year 2011 Financial Results
21
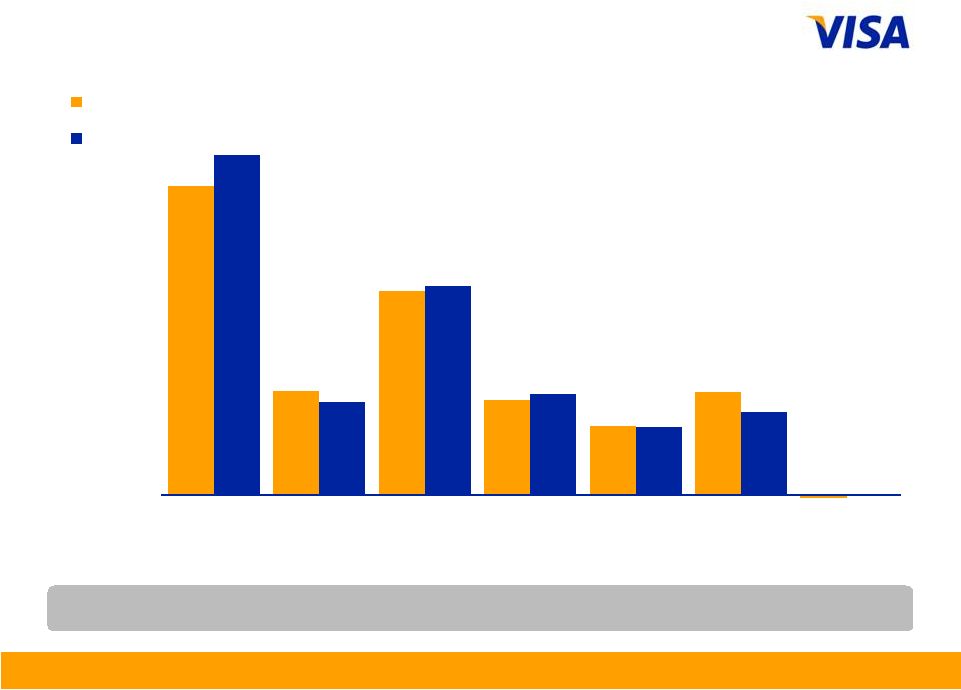
Operating Expenses –
Q4 2011
US$ in millions, except percentages
Note: Growth rates calculated based on whole numbers, not rounded numbers.
YOY
Change
2%
7%
10%
(19%)
(1)%
(11%)
NM
353
119
233
108
78
117
(4)
388
106
239
115
77
95
1
Personnel
Network
and Processing
Marketing
Professional Fees
Depreciation
and Amortization
General
and
Administrative
Litigation
Provision
Fiscal 2010
Fiscal 2011 |
 Fiscal Fourth Quarter and Full-Year 2011 Financial Results
22
Operating Expenses –
Fiscal Year 2011
US$ in millions, except percentages
Note: Growth rates calculated based on whole numbers, not rounded numbers.
YOY
Change
18%
19%
15%
9%
(10%)
(16%)
NM
1,222
425
964
286
265
359
(45)
1,459
357
870
337
288
414
7
Personnel
Network
and
Processing
Marketing
Professional Fees
Depreciation and
Amortization
General and
Administrative
Litigation
Provision
Fiscal 2010
Fiscal 2011 |
 Fiscal Fourth Quarter and Full-Year 2011 Financial Results
23
Other Income (Expense)
Fiscal Year 2011
US$ in millions
The following table presents components of our other income (expense).
Gain on sale of investment in CBSS
85
$
Revaluation of Visa Europe put option
122
Other
(1)
(7)
Total other income
200
$
(1)
Amount primarily represents interest expense, other investment income and the accretion associated
with litigation settlements to be paid over periods longer than one year.
|
 Fiscal Fourth Quarter and Full-Year 2011 Financial Results
24
Other Financial Results
•
Cash, cash equivalents, restricted cash, and available-for-sale
investment securities of $6.9 billion at the end of the fiscal year, which
includes $2.9 billion of restricted cash in the litigation escrow account
•
Free cash flow of $3.9 billion was fully deployed to effectively
repurchase 43 million shares at $3.2 billion, pay $423 million in
dividends, and finance PlaySpan and Fundamo acquisitions of $268
million
•
Capital
expenditures
of
$117
million
and
$353
million
during
the
fiscal
fourth quarter and the full-year 2011, respectively
Note: See appendix for reconciliation of adjusted non-GAAP measures to the
closest comparable GAAP measures. |
 Fiscal Fourth Quarter and Full-Year 2011 Financial Results
25
Financial Metrics for Fiscal Year 2012
Under $1
billion
Marketing expenses
Annual operating margin
About 60%
17% to 18%
range
Client incentives as % of gross revenues
Annual net revenue growth
High single to
low double
digit range |
 Fiscal Fourth Quarter and Full-Year 2011 Financial Results
26
Financial Metrics for Fiscal Year 2012
*Excludes impact of possible non-cash revaluation of deferred tax liabilities,
which could decrease the GAAP tax rate to 30% to 31%. These deferred tax
liabilities are primarily associated with indefinite-lived intangible assets recorded as
part of Visa’s October 2007 reorganization.
Capital expenditures
Adjusted annual diluted class A common stock
earnings per share growth
Mid to high
teens
range
Adjusted tax rate*
33% to 34%
range
Annual free cash flow
Above $4
billion
$350 million
to $400
million range |
 Appendix
Reconciliation of
Non-GAAP Measures |
 Fiscal Fourth Quarter and Full-Year 2011 Financial Results
Adjusted Net Income and Earnings
US$ in millions, except per share data
Management believes the presentation of adjusted net income and diluted earnings
per share provides a clearer understanding of
our
operating
performance
for
the
periods.
The
revaluation
of
the
Visa
Europe
put
option
during
the
third
fiscal
quarter
resulted in non-cash, non-operating income during fiscal 2011. The
reduction in the fair value of the put option was primarily the result
of
declines
in
our
estimated
long-term
price-to-earnings
ratio
and
does
not
reflect
any
change
in
the
likelihood
that
Visa
Europe will exercise its option. Management therefore believes that the
resulting non-operating income is not indicative of Visa’s
performance in the current or future periods. (1)
Non-cash, non-operating income resulting from the revaluation of this financial instrument is
not subject to tax. September 30, 2011
September 30, 2011
Net income attributable to Visa Inc. (as reported)
880
774
3,650
2,966
Revaluation of Visa Europe Put option
(1)
-
(79)
(122)
(79)
Adjusted net income attributable to Visa Inc.
880
695
3,528
2,887
692
731
707
739
Adjusted diluted earnings per share
1.27
0.95
4.99
3.91
Diluted earnings per share (as reported)
1.27
1.06
5.16
4.01
Impact of the revaluation of Visa Europe put option
-
0.17
0.10
Three months ended
Twelve months ended
Weighted average number of diluted shares
outstanding (as reported)
September 30, 2010
September 30, 2010
0.11
$
$
$
$
$
$
$
$
$
$
$
$
$
$
$
$
$
$
$
A1 |
 Fiscal Fourth Quarter and Full-Year 2011 Financial Results
Calculation of Free Cash Flow
US$ in millions
(1) Includes changes in client incentives, trade receivables/payable, settlement
receivable/payable, and personnel incentives. Additions (+) /
Reductions (-) to
Net income
attributable to
Visa Inc.
Net income attributable to Visa Inc. (as reported)
880
3,650
Capital Assets
+
Depreciation and amortization
77
288
-
Capital expenditures
(117)
(40)
(353)
(65)
Litigation
+
Litigation provision
1
7
+
Accretion expense
2
11
-
Settlement payments
(90)
(302)
+
Settlement payments funded by litigation escrow
70
(17)
280
(4)
Share-based Compensation
+
Share-based compensation
32
154
Pension
+
Pension expense
10
34
-
Pension contribution
(74)
(64)
(74)
(40)
Taxes
+
Income tax expense
476
2,010
-
Income taxes paid
(480)
(4)
(1,731)
279
Visa Europe Put Option
-
Fair Value Adjustment
-
(122)
Changes in Working Capital
(1)
+/-
Changes in other working capital accounts
(45)
6
Total Free Cash Flow
742
3,858
Less: PlaySpan and Fundamo
Acquisitions
-
Purchase consideration, net of cash received
-
(268)
Adjusted Free Cash Flow
742
3,590
Three Months Ended
September 30, 2011
Twelve Months Ended
September 30, 2011
A2 |
 Fiscal Fourth Quarter and Full-Year 2011 Financial Results
Impact of PlaySpan Acquisition
US$ in millions, except per share data
The following table presents the impact of the PlaySpan acquisition on Visa’s
fiscal fourth quarter and full-year adjusted diluted earnings per
share. (1)
(2)
(3)
Represents tax rate applicable to PlaySpan.
(4)
(5)
Operating revenues recognized by Visa related to PlaySpan transactions. Amount primarily
represents data processing revenues.
Operating expenses incurred by Visa related to PlaySpan. Amounts incurred subsequent to the
acquisition primarily represent personnel, amortization of intangibles and normal operating
expenses. Amount primarily represents professional fees related to closing the transaction and
some minor compensation expense, which are non-deductible for tax purposes.
See slide A1 for a reconciliation of adjusted diluted earnings per share to GAAP diluted earnings per
share. Net income attributable to Visa Inc. (as reported)
880
$
3,650
$
Revaluation of Visa Europe Put option
-
(122)
Adjusted net income attributable to Visa Inc.
880
$
3,528
$
Taxable PlaySpan adjustments:
Less: Operating revenue
(1)
(10)
(18)
Addback: Deductible operating expenses
(2)
22
43
Subtotal of taxable adjustments
12
25
Tax rate
(3)
39%
39%
Tax impact of adjustments
(4)
(10)
Impact of taxable PlaySpan adjustments
8
15
Addback: Non-deductible adjustments
(4)
-
8
Impact of PlaySpan
8
23
Adjusted net income attributable to Visa Inc.
888
$
3,551
$
Weighted average number of diluted shares outstanding (as reported)
692
707
Adjusted diluted earnings per share, excluding impact of PlaySpan acquisition
1.28
$
5.02
$
Adjusted diluted earnings per share
(5)
1.27
$
4.99
$
Impact of PlaySpan acquisition
(0.01)
$
(0.03)
$
A3
Three Months Ended
Twelve Months Ended
September 30, 2011
September 30, 2011 |
 Fiscal Fourth Quarter and Full-Year 2011 Financial Results
Impact of Fundamo Acquisition
US$ in millions, except per share data
The following table presents the impact of the Fundamo acquisition on Visa’s
fiscal fourth quarter and full-year adjusted diluted earnings per
share. A4
(1)
(2)
See slide A1 for a reconciliation of adjusted diluted earnings per share to GAAP diluted earnings per
share. Represents the net operating results of Fundamo recognized by Visa since the acquisition
in June 2011. Three Months Ended
September 30, 2011
Twelve Months Ended
September 30, 2011
Net income attributable to Visa Inc. (as reported)
880
$
3,650
$
Revaluation of Visa Europe Put option
-
(122)
Adjusted net income attributable to Visa Inc.
880
$
3,528
$
After
tax
impact
of
Fundamo
(1)
10
$
14
$
Adjusted net income attributable to Visa Inc.
890
$
3,542
$
Weighted average number of diluted shares outstanding (as reported)
692
707
Adjusted
diluted
earnings
per
share,
excluding
impact
of
Fundamo
acquisition
1.28
$
5.01
$
Adjusted diluted earnings per share
(2)
1.27
$
4.99
$
Impact of Fundamo acquisition
(0.01)
$
(0.02)
$
|