Attached files
| file | filename |
|---|---|
| EX-99.1 - PRESS RELEASE - Super Micro Computer, Inc. | d247342dex991.htm |
| 8-K - CURRENT REPORT ON FORM 8-K - Super Micro Computer, Inc. | d247342d8k.htm |
 GPU
Solutions Universal I/O
Double-Sided
Datacenter
Optimized
Twin Architecture
SuperBlade
®
Storage
1st Quarter Fiscal 2012
Earnings Conference Presentation
October 25, 2011
Exhibit 99.2 |
 2
Safe Harbor Statement
This presentation contains forward-looking statements within the meaning of
Section 27A of the Securities Act of 1933, as amended, and Section 21E of
the Securities Exchange Act of 1934, as amended. These forward-looking
statements may relate, among other things, to our expected financial
and operating results, our ability to build and grow Supermicro, the benefit of our products
and our ability to achieve our goals, plans and objectives.
Such forward-looking statements do not constitute guarantees of future
performance and are subject to a variety of risks and uncertainties that
could cause our actual results to differ materially from those anticipated.
These include, but are not limited to: our dependence on continued growth in the markets
for X86 based servers, blade servers and embedded applications, increased
competition, difficulties of predicting timing of new product
introductions, customer acceptance of new products, difficulties in
establishing and maintaining successful relationships with our distributors and
vendors, shortages or price fluctuations in our supply chain, our ability
to protect our intellectual property rights, our ability to control the
rate of expansion domestically and internationally, difficulty managing rapid growth and
general political, economic and market conditions and events.
For a further list and description of risks and uncertainties, see the reports
filed by Supermicro with the Securities and Exchange Commission. Supermicro
disclaims any intention or obligation to update
or revise any forward-looking statements, whether as a result of new
information, future events or otherwise. Supplemental information,
condensed balance sheets and statements of operations follow. All monetary
amounts are stated in U.S. dollars. |
 3
Non-GAAP Financial Measures
Non-GAAP gross margin in this presentation excludes stock-based
compensation expense and accrued customs fee for prior periods.
Non-GAAP net income and net income per share in this presentation
exclude stock-based compensation expense, accrued customs fee for prior periods, a
provision
for
litigation
costs
and
the
related
tax
effect
of
the
applicable
items.
Management
presents
non-GAAP financial measures because it considers them to be important
supplemental measures of performance. Management uses the non-GAAP
financial measures for planning purposes, including analysis
of
the
Company's
performance
against
prior
periods,
the
preparation
of
operating
budgets
and to determine appropriate levels of operating and capital investments.
Management also believes that non-GAAP financial measures provide additional
insight for analysts and investors in evaluating the Company's financial
and operational performance. However, these non-GAAP financial measures
have limitations as an analytical tool, and are not intended to be an
alternative to financial measures prepared in accordance with GAAP.
Pursuant to the requirements of SEC Regulation G, detailed reconciliations between
the Company's GAAP and non-GAAP financial results is provided at the
end of the press release that was issued announcing the Company’s
operating and financial results for the quarter ended September 30, 2011.
In addition, a reconciliation from GAAP to non-GAAP results is contained in
the financial summary attached to today’s presentation and is
available in the Investor Relations section of our website at
www.supermicro.com
in the Events and Presentations section. Investors are advised to carefully
review and consider this information as well as the GAAP financial results that
are disclosed in the Company's SEC filings. |
 4
Q1’FY2012 Non-GAAP Financial Highlights
(in millions, except per share data)
Q1'12
YoY
Sequential
Revenue
$247.9
19.6%
-4.8%
Profit after Tax
$10.5
13.2%
-19.3%
EPS
$0.24
9.1%
-17.2%
Change |
 5
Summary of Results
Revenues 19.6% higher year over year
OEM and Direct business was 44.2% of revenues of which
16.4% was Internet Data Center
System business was 39.4% of revenues
Revenues by Geography:
US –
62.1%
Europe –
18.8%
Asia –
15.8%
Other –
3.3%
Product focus remains on preparation for Sandy Bridge
Taiwan facility ready for production end of December |
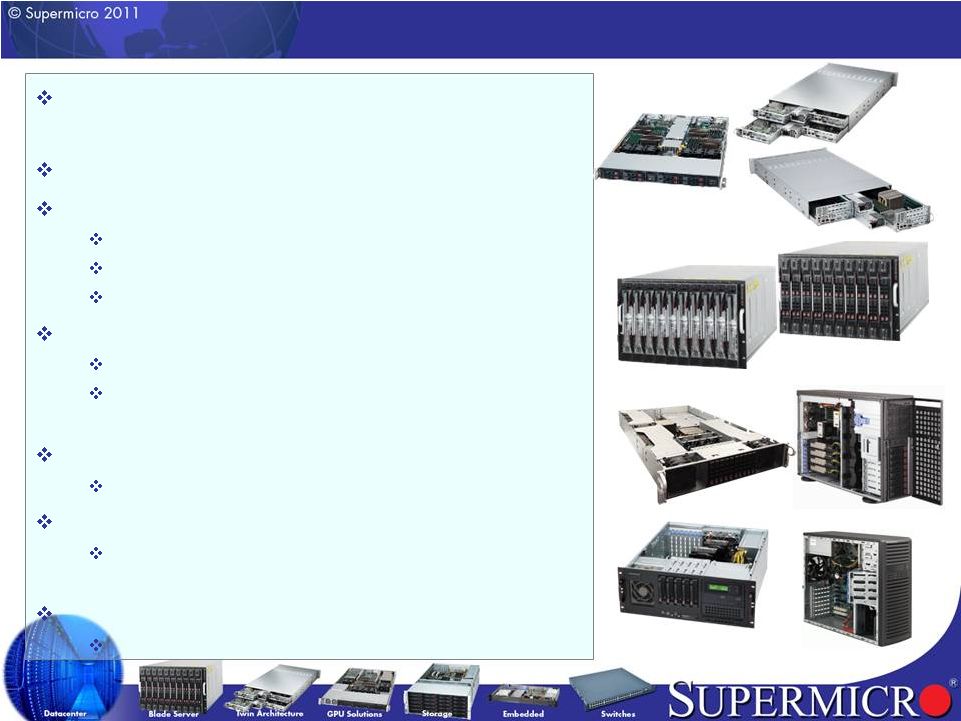 Leading Application Optimized Solutions
X9 Romley Solutions in Sampling and early
deployment
H8 Interlagos Solutions in Seeding
Twin Architecture
2U Twin (6x 3.5”
HDD or 12x 2.5”
HDD per node)
1U Twin and 2U Twin²
are still growing
Fat Twin Architecture coming soon (418, 424, 442, 414)
SuperBlade™
-
GPU Blade and TwinBlade™
GPU blade (20GPUs in 7U, most dense in the industry)
20/28 DP nodes in 7U, support 40Gb/s Infiniband or 10G
Ethernet connectivity
GPU optimized product lines (1U, 2U and 4U)
1U, 2U New High Density GPU product line
IPC and Embedded Applications
Atom and Core-based low power server: fan-less / long life
cycle, for embedded and server appliances
Workstation and Everest product line
Chassis 415 for Intel Everest CPU optimization
Twin Architectures
TwinBlade™
Industrial Solution
GPU Blade
GPU-optimized
Workstation
6 |
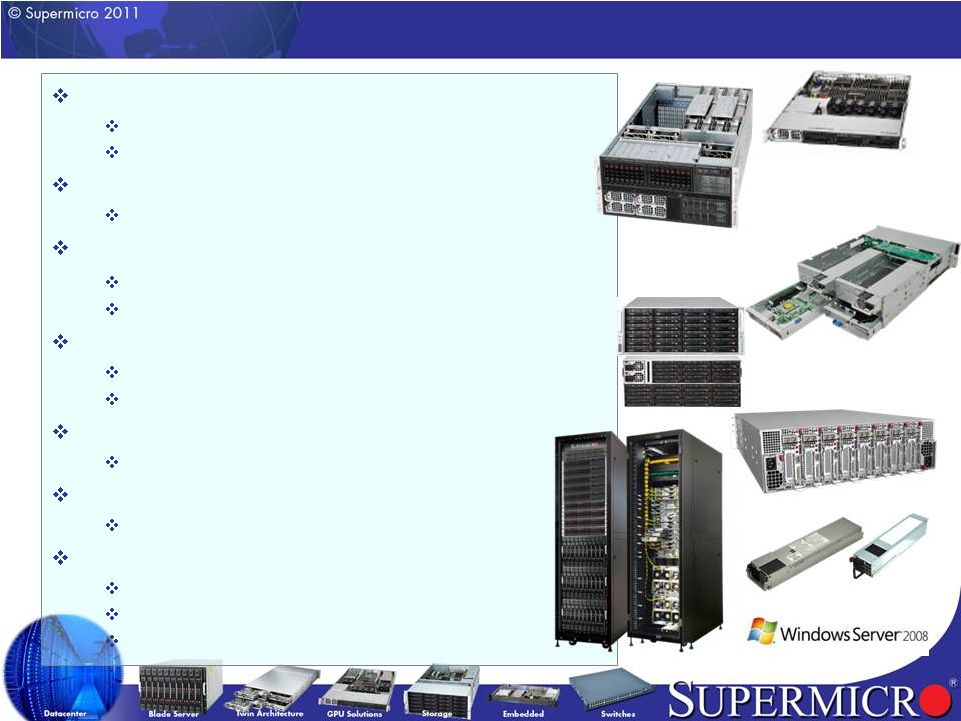 HPC/Enterprise 8-way/4-way Systems
8-way
5U
high-end
high-margin
solution
–
80
cores
and
2TB
Nehalem-EX MP and G34 MP system in 1U/2U/4U
Storage Product Lines
Double-Sided, Super SBB product line with software solutions
SuperRack™
Double side access, cable management, water cooling
Hadoop mini-rack solution
Switch Products: 10GbE, IB, FCoE
10GbE onboard and 10GbE standalone switch
FCoE solution coming soon
MicroCloud™
Optimized for IaaS
Power Subsystems
High efficiency (94%+), digital switching, UPS w/ battery
Software Opportunities
Remote management, power management
HPC/DC management toolset (DCM & SSM)
Window OS Integration/Bundle
Front
Back
Super-SBB
Double-Sided Storage
1U / 4-way
5U / 8-way
SuperRack
MicroCloud
Leading Application Optimized Solutions
High Efficiency Power
7 |
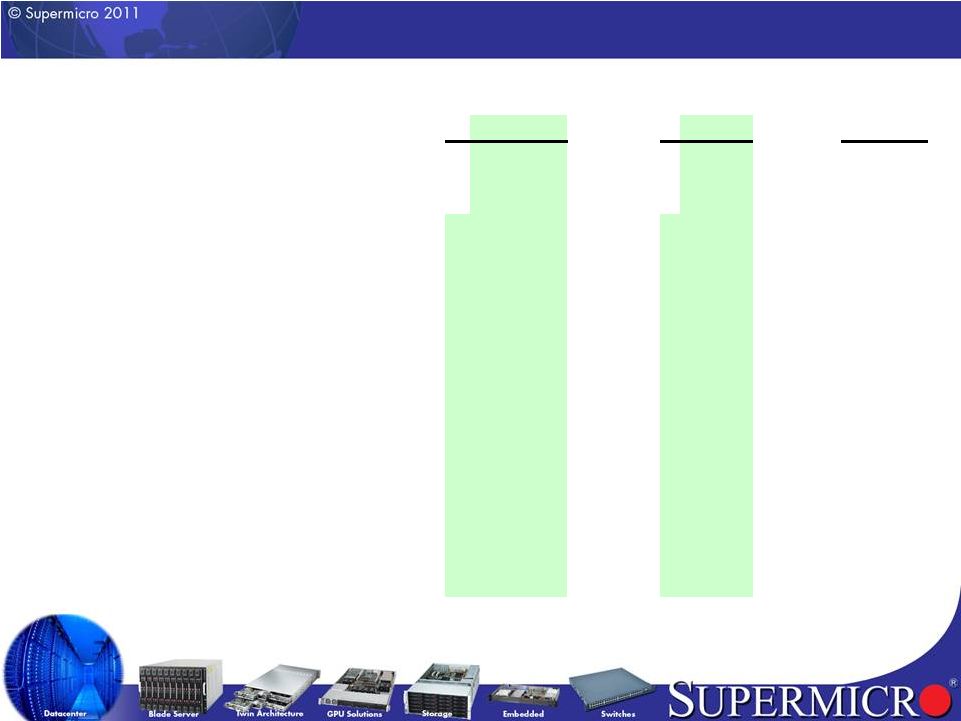
 8
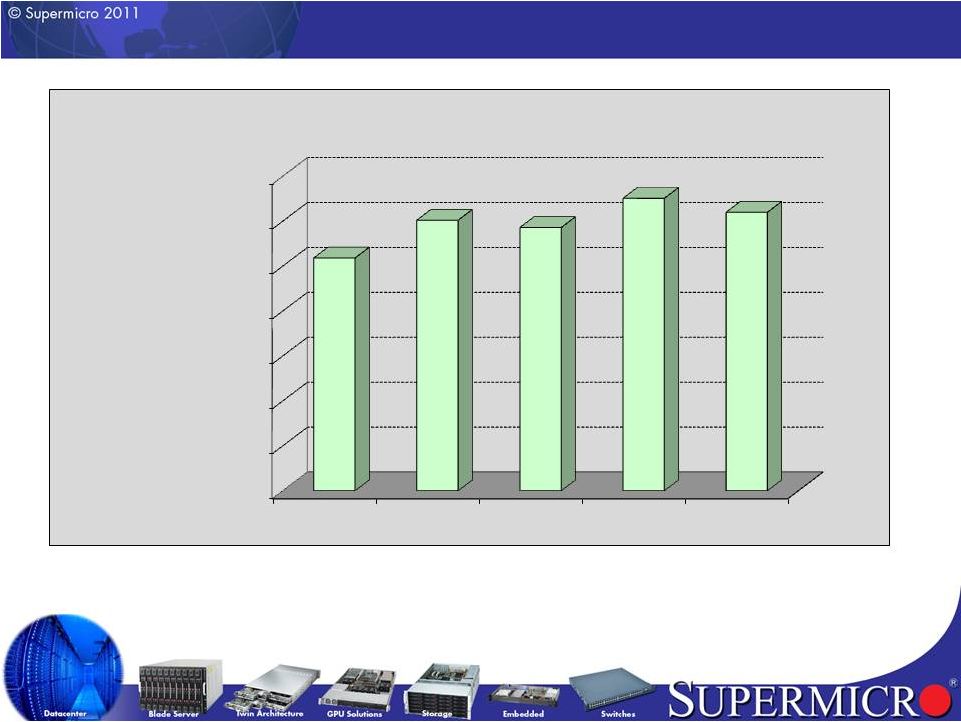
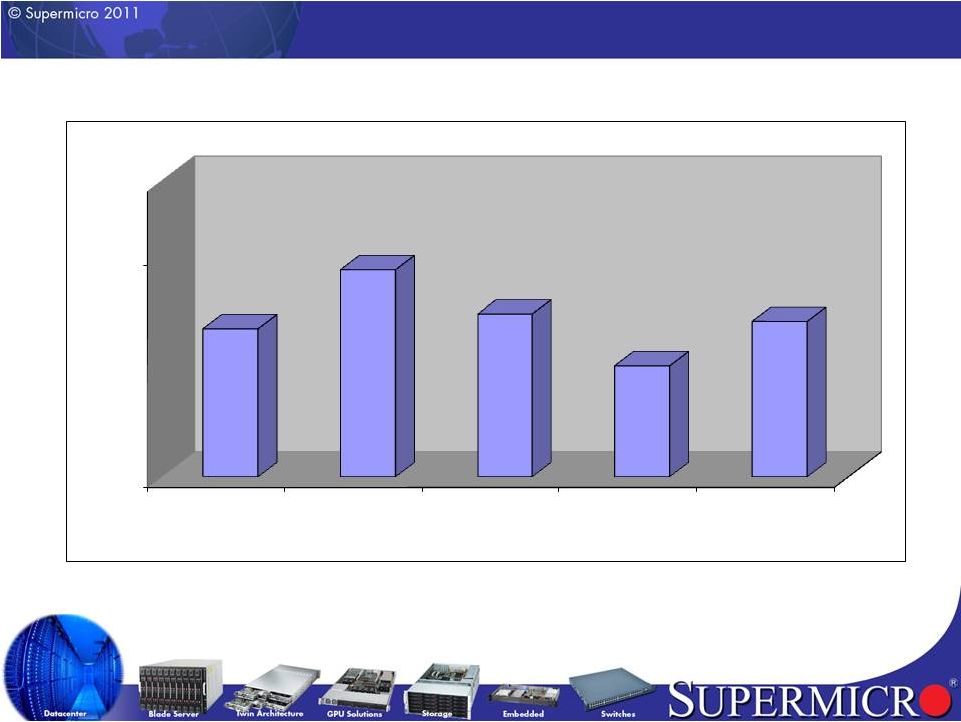
Revenue Trend
Y/Y
39.5%
32.3%
23.8%
29.1%
19.6%
Seq.
2.7%
16.2%
-2.7%
11.1%
-4.8%
$0
$40
$80
$120
$160
$200
$240
$280
Q1'11
Q2'11
Q3'11
Q4'11
Q1'12
$207
$241
$234
$260
$248
$'s millions
Supermicro Revenue Trend |
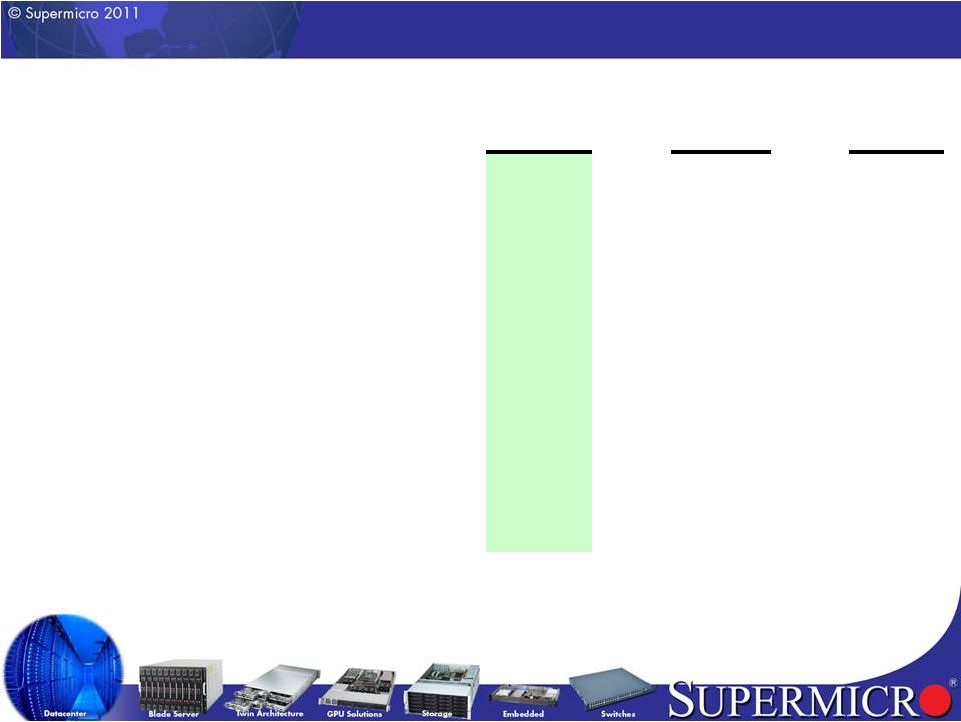
 9
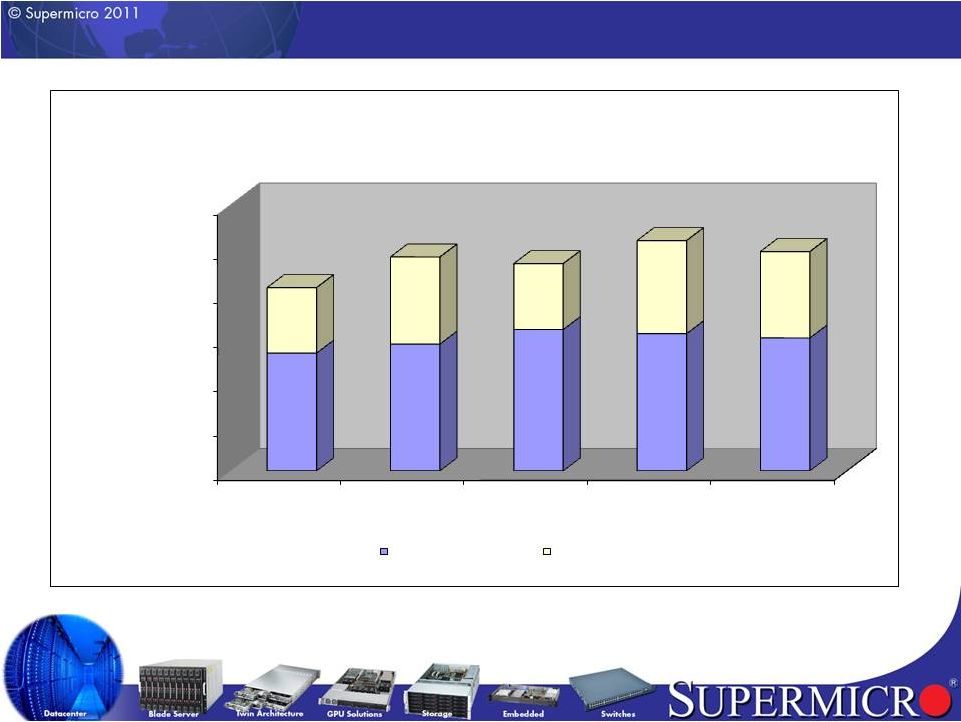
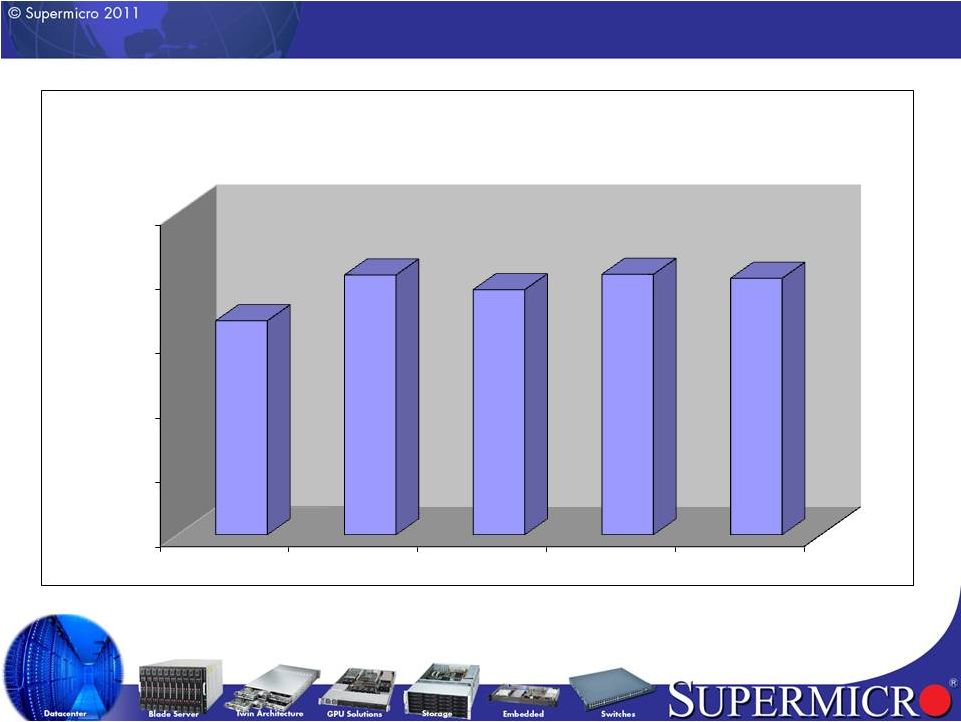
Revenue Analysis
$-
$50
$100
$150
$200
$250
$300
Q1'11
Q2'11
Q3'11
Q4'11
Q1'12
$133
$143
$160
$155
$150
$74
$98
$74
$105
$98
$'s millions
Supermicro Subsystems/System Revenue
Subsystems
Systems |
 10
Non-GAAP Gross Margins
14.0%
17.0%
Q1'11
Q2'11
Q3'11
Q4'11
Q1'12
16.0%
16.8%
16.2%
15.5%
16.1% |
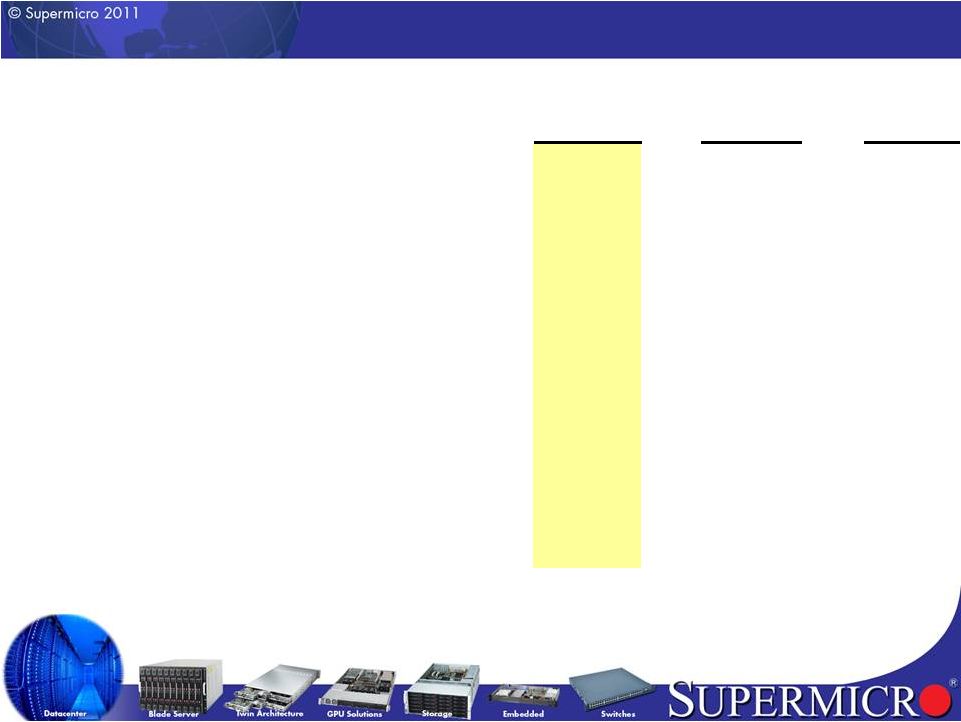
 11
Non-GAAP Gross Profit
$-
$10.0
$20.0
$30.0
$40.0
$50.0
Q1'11
Q2'11
Q3'11
Q4'11
Q1'12
$33.2
$40.4
$38.1
$40.5
$39.8
Gross Profit
$'s millions |
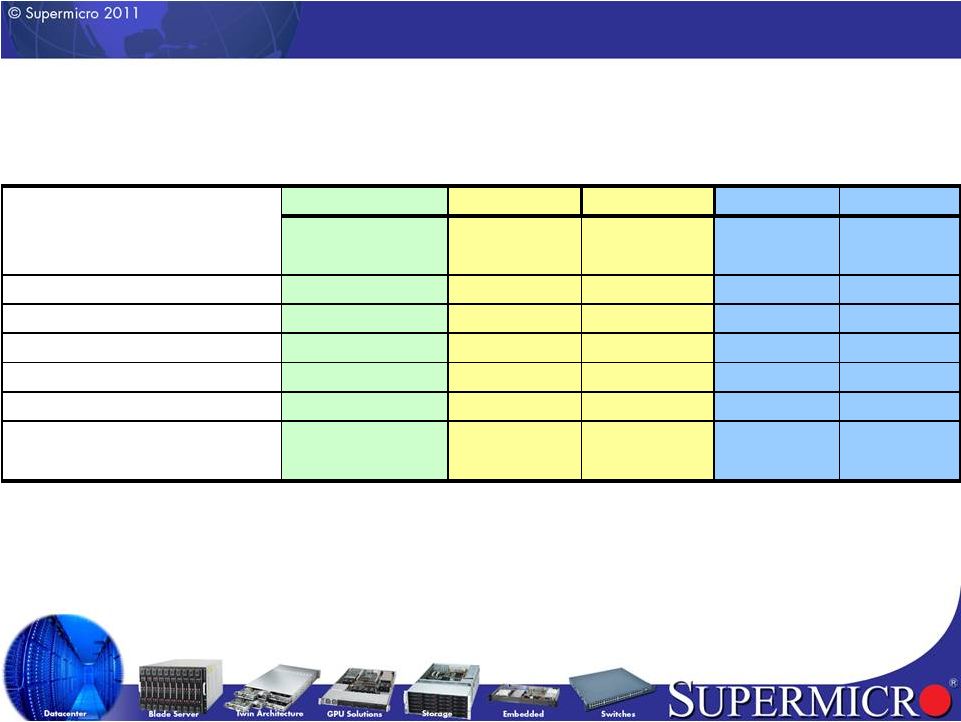 12
Summary P&L non-GAAP
(in millions, except per share data)
Q1'12
YoY
Sequential
Q1'11
Q4'11
Operating Expense
$24.0
$5.3
$1.3
$18.7
$22.7
Operating Expense Ratio
9.7%
0.7%
1.0%
9.0%
8.7%
Operating Income
$15.8
$1.3
-$1.9
$14.6
$17.7
Net Income
$10.5
$1.2
-$2.5
$9.3
$13.0
EPS
$0.24
$0.02
-$0.05
$0.22
$0.29
Diluted Common Share Count
44.3
42.7
44.9
Effective Quarterly
Tax Rate
33.1%
35.8%
26.0%
Change |
 13
Q1 FY2012 YTD Summary Statement of Cash Flows
($’s millions)
3 Months Ended
3 Months Ended
30-Sep-11
30-Sep-10
Net Income
$8.5
$7.2
Depreciation and amortization
$1.5
$1.3
Stock comp expense
$2.3
$1.8
Other reserves
$4.4
$3.4
Net change in AR, Inventory, AP
-$4.5
$1.5
Other prepaids and liabilities
$12.9
$1.7
Cash flow from operations
$25.1
$16.9
Capital expenditures
-$8.0
-$7.2
Free cash flow
$17.1
$9.7
Net cash -
investing activities
$1.7
$0.8
Net cash -
financing activities
$3.6
$0.4
Effect of exchange rate fluctuations
on cash and cash equivalents
-$0.1
$0.0
Net change in cash
$22.3
$10.9 |
   14
Q1 FY 2012 Summary of Balance Sheet Metrics
($’s millions)
Q1'12
Q4'11
Change
Cash Equivalents & Investments
96.0
$
75.2
$
20.8
$
Accounts Receivable
87.8
$
85.0
$
2.8
$
Inventory
189.0
$
192.7
$
(3.7)
$
Accounts Payable
123.6
$
113.3
$
10.3
$
DSO
32
29
3
DIO
84
83
1
DPO
52
51
1
Cash Cycle Days
64
61
3 |
 15
Supplemental Financials
First Quarter Fiscal 2012
Ended September 30, 2011 |
 16
Non-GAAP Financial Summary
(in millions, except per share data)
Q1'12
Q4'11
Q1'11
Net Sales
247.9
$
260.3
$
207.2
$
Non-GAAP Gross Margin
16.1%
15.5%
16.0%
Non-GAAP Operating Expenses
24.0
$
22.7
$
18.7
$
Non-GAAP Operating Income
15.8
$
17.7
$
14.6
$
Non-GAAP Net Income
10.5
$
13.0
$
9.3
$
Non-GAAP Net Income per share
0.24
$
0.29
$
0.22
$
Fully diluted shares for calculation
44.3
44.9
42.7 |
 17
Prior Period Net Income Comparisons
(in millions, except per share data)
Q1'12
Q4'11
Q1'11
Net Income (GAAP)
8.5
$
10.7
$
7.2
$
Stock
Comp
&
Other
Unusual
Expense
(tax
affected)
*
2.0
$
2.3
$
2.1
$
Net Income (Non-GAAP)
*
10.5
$
13.0
$
9.3
$
Diluted Net Income per common share (GAAP)
$ 0.19
0.24
$
0.17
$
Stock
Comp
&
Other
Unusual
Expense
(tax
affected)
*
0.05
$
0.05
$
0.05
$
Diluted
Net
Income
per
share
(Non-GAAP)
*
0.24
$
0.29
$
0.22
$
Shares used in diluted EPS calculation
44.3
44.9
42.7
* Note: Non-GAAP, please see Non-GAAP financial measures on page 3.
|
 18
Q1 FY 2012 GAAP to Non-GAAP Reconciliation
(in millions, except per share data)
Stock Comp &
Q1'12
Q1'12 GAAP
Other Unusual
Non-GAAP
Results
Expenses*
Results*
Net Sales
247.9
$
-
$
247.9
$
Cost of Sales
208.3
$
(0.2)
$
208.1
$
Gross Profit
39.6
$
0.2
$
39.8
$
Operating Expense
26.1
$
(2.1)
$
24.0
$
Operating Income
13.5
$
2.3
$
15.8
$
Interest, net
(0.2)
$
-
$
(0.2)
$
Income Before Tax
13.3
$
2.3
$
15.7
$
Income Tax
4.8
$
0.3
$
5.2
$
Net Income
8.5
$
2.0
$
10.5
$
Diluted Net Income per share
0.19
$
0.05
$
0.24
$
Diluted shares used in GAAP and
Non-GAAP per share calculation
43.4
44.3
44.3
* Note: Non-GAAP, please see Non-GAAP financial measures on page 3.
|
 19
Q4 FY 2011 GAAP to Non-GAAP Reconciliation
(in millions, except per share data)
Stock Comp &
Q4'11
Q4'11 GAAP
Other Unusual
Non-GAAP
Results
Expenses*
Results*
Net Sales
260.3
$
-
$
260.3
$
Cost of Sales
220.3
$
(0.4)
$
219.9
$
Gross Profit
40.0
$
0.4
$
40.5
$
Operating Expense
25.4
$
(2.7)
$
22.7
$
Operating Income
14.6
$
3.1
$
17.7
$
Interest, net
(0.2)
$
-
$
(0.2)
$
Income Before Tax
14.4
$
3.1
$
17.5
$
Income Tax
3.7
$
0.9
$
4.6
$
Net Income
10.7
$
2.3
$
13.0
$
Diluted Net Income per share
0.24
$
0.05
$
0.29
$
Diluted shares used in GAAP and
Non-GAAP per share calculation
43.7
44.9
44.9
* Note: Non-GAAP, please see Non-GAAP financial measures on page 3.
|
 20
Q3 FY 2011 GAAP to Non-GAAP Reconciliation
(in millions, except per share data)
Stock Comp &
Q3'11
Q3'11 GAAP
Other Unusual
Non-GAAP
Results
Expenses*
Results*
Net Sales
234.3
$
-
$
234.3
$
Cost of Sales
196.4
$
(0.2)
$
196.2
$
Gross Profit
37.9
$
0.2
$
38.1
$
Operating Expense
22.7
$
(1.9)
$
20.8
$
Operating Income
15.2
$
2.1
$
17.2
$
Interest, net
(0.1)
$
-
$
(0.1)
$
Income Before Tax
15.0
$
2.1
$
17.1
$
Income Tax
4.3
$
0.5
$
4.8
$
Net Income
10.7
$
1.6
$
12.3
$
Diluted Net Income per share
0.25
$
0.03
$
0.28
$
Diluted shares used in GAAP and
Non-GAAP per share calculation
42.9
44.0
44.0
* Note: Non-GAAP, please see Non-GAAP financial measures on page 3.
|
 21
Q2 FY 2011 GAAP to Non-GAAP Reconciliation
(in millions, except per share data)
Stock Comp &
Q2'11
Q2'11 GAAP
Other Unusual
Non-GAAP
Results
Expenses*
Results*
Net Sales
240.8
$
-
$
240.8
$
Cost of Sales
200.6
$
(0.2)
$
200.5
$
Gross Profit
40.2
$
0.2
$
40.4
$
Operating Expense
23.3
$
(1.7)
$
21.6
$
Operating Income
16.9
$
1.8
$
18.8
$
Interest, net
(0.2)
$
-
$
(0.2)
$
Income Before Tax
16.8
$
1.8
$
18.6
$
Income Tax
5.2
$
0.1
$
5.3
$
Net Income
11.6
$
1.9
$
13.3
$
Diluted Net Income per share
0.27
$
0.04
$
0.31
$
Diluted shares used in GAAP and
Non-GAAP per share calculation
41.6
42.7
42.7
* Note: Non-GAAP, please see Non-GAAP financial measures on page 3.
|
 22
Q1 FY 2011 GAAP to Non-GAAP Reconciliation
(in millions, except per share data)
Q1'11
Q1'11 GAAP
Other Unusual
Non-GAAP
Results
Expenses*
Results*
Net Sales
207.2
$
-
$
207.2
$
Cost of Sales
174.1
$
(0.2)
$
173.9
$
Gross Profit
33.0
$
0.2
$
33.2
$
Operating Expense
21.0
$
(2.4)
$
18.7
$
Operating Income
12.0
$
2.6
$
14.6
$
Interest, net
(0.1)
$
-
$
(0.1)
$
Income Before Tax
11.9
$
2.6
$
14.4
$
Income Tax
4.7
$
0.5
$
5.2
$
Net Income
7.2
$
3.1
$
9.3
$
Diluted Net Income per share
0.17
$
0.05
$
0.22
$
Diluted shares used in GAAP and
Non-GAAP per share calculation
41.4
42.7
42.7
Stock Comp &
* Note: Non-GAAP, please see Non-GAAP financial measures on page 3.
|