Attached files
| file | filename |
|---|---|
| 8-K - FORM 8-K - LODGENET INTERACTIVE CORP | d247612d8k.htm |
| EX-99.1 - PRESS RELEASE - LODGENET INTERACTIVE CORP | d247612dex991.htm |
Exhibit 99.2
Exhibit 99.2
Certain statements in this presentation constitute “forward ? looking statements. “ When used in this presentation and in the prepared remarks during our October 25th conference call, as well as in response to the questions during the conference call, the words “intends,” “expects, “ “estimates,” “believes,” and similar expressions, and statements which are made in the future tense or refer to future events or developments, including, without limitation, those related to our fourth quarter 2011 guidance, including revenue, Guest Entertainment revenue per room, adjusted operating cash flow, net income (loss), loss per common share, and anticipated HD Envision room installations, are intended to identify such forward ? looking statements. Such forward ? looking statements are subject to risks, uncertainties and other factors that could cause the actual results, performance or achievements to be materially different from any future results, performance or achievements expressed or implied by such forward ? looking statements. Such factors include, among others, the following: the effects of economic conditions, including general financial conditions; the economic condition of the lodging industry, which can be particularly affected by the financial conditions referenced above, as well as by high gas prices, levels of unemployment, consumer confidence, acts or threats of terrorism and public health issues; competition from providers of similar services and from alternative systems for accessing in? room entertainment; competition from HSIA providers; changes in demand for our products and services; programming availability, timeliness, quality and costs; technological developments by competitors; developmental costs, difficulties and delays; relationships with customers and property owners, in particular as we reduce capital invstment; the availability of capital to finance growth; compliance with credit facility covenants; the impact of governmental regulations; potential effects of litigation; risks of diversification into new products, services or markets; risks related to the security of our data systems; and other factors detailed, from time to time, in our filings with the Securities and Exchange Commission. For any of the foregoing reasons, our guidance and our actual financial results may not meet our expectations. These forward ? looking statements speak only as of the date of this presentation. We expressly disclaim any obligation or undertaking to release publicly any updates or revisions to any forward ? looking statements contained herein to reflect any change in our expectations with regard thereto or any change in events, conditions or circumstances on which any such statement is based.
| 1 |
|
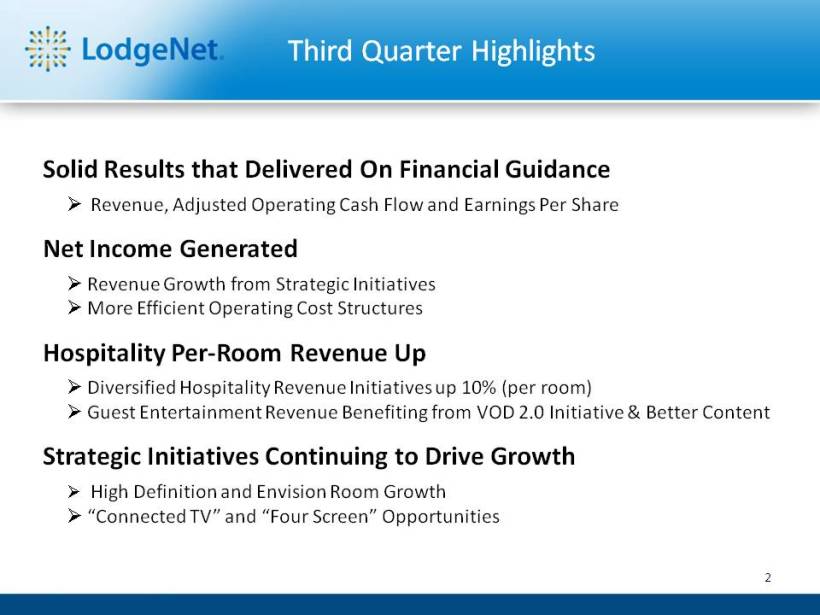
Third Quarter Highlights
Solid Results that Delivered On Financial Guidance
Revenue, Adjusted Operating Cash Flow and Earnings Per Share
Net Income Generated
Revenue Growth from Strategic Initiatives
More Efficient Operating Cost Structures
Hospitality Per? Room Revenue Up
Diversified Hospitality Revenue Initiatives up 10% (per room)
Guest Entertainment Revenue Benefiting from VOD 2.0 Initiative & Better Content
Strategic Initiatives Continuing to Drive Growth
High Definition and Envision Room Growth
“Connected TV” and “Four Screen” Opportunities
| 2 |
|
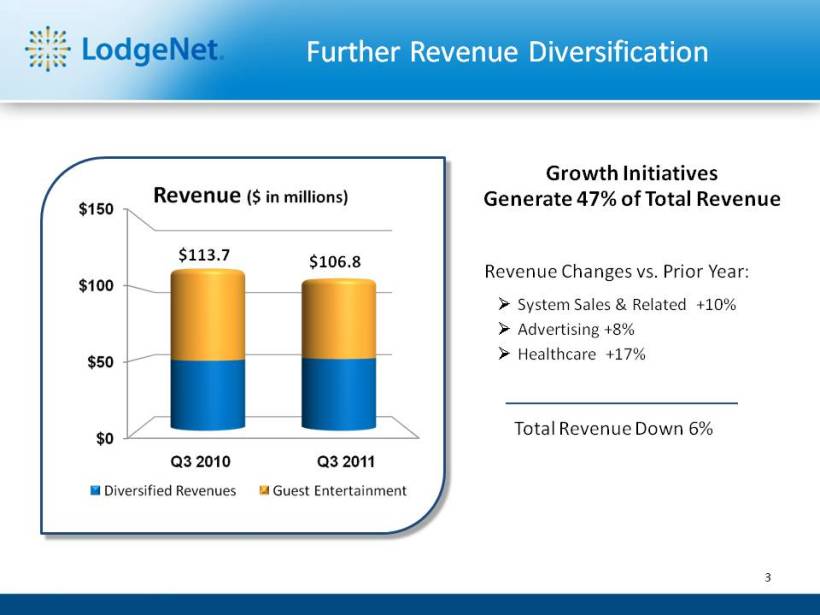
Further Revenue Diversification
$113.7 $106.8
Growth Initiatives Generate 47% of Total Revenue
Revenue Changes vs. Prior Year:
System Sales & Related +10%
Advertising +8%
Healthcare +17%
Total Revenue Down 6%
| 3 |
|
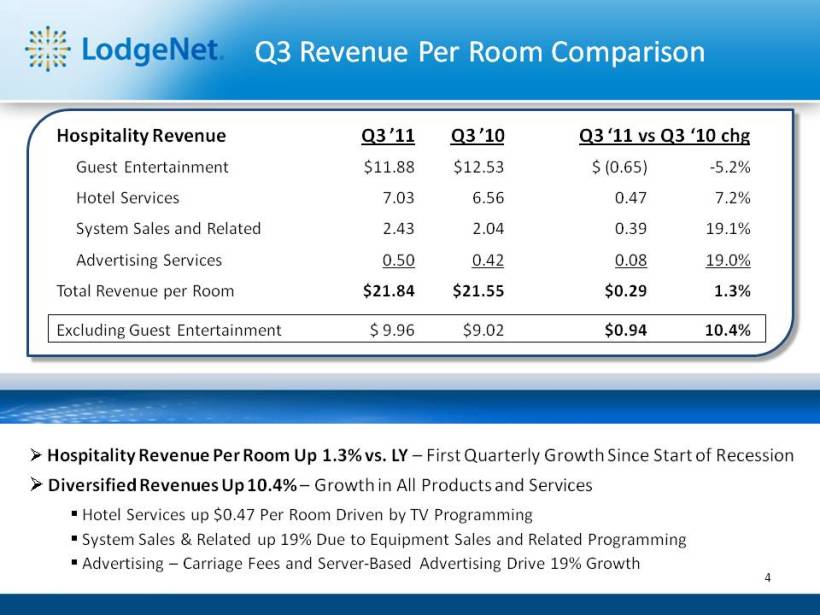
Q3 Revenue Per Room Comparison
Hospitality Revenue Q3 ‘11 Q3 ‘10 Q3 ‘11 vs Q3 ‘10 chg
Guest Entertainment $11.88 $12.53 $ (0.65) ? 5.2% Hotel Services 7.03 6.56 0.47 7.2% System Sales and Related 2.43 2.04 0.39 19.1% Advertising Services 0.50 0.42 0.08 19.0% Total Revenue per Room $21.84 $21.55 $0.29 1.3%
Excluding Guest Entertainment $ 9.96 $9.02 $0.94 10.4%
Hospitality Revenue Per Room Up 1.3% vs. LY – First Quarterly Growth Since Start of Recession
Diversified Revenues Up 10.4% – Growth in All Products and Services Hotel Services up $0.47 Per Room Driven by TV Programming System Sales & Related up 19% Due to Equipment Sales and Related Programming Advertising – Carriage Fees and Server? Based Advertising Drive 19% Growth
| 4 |
|
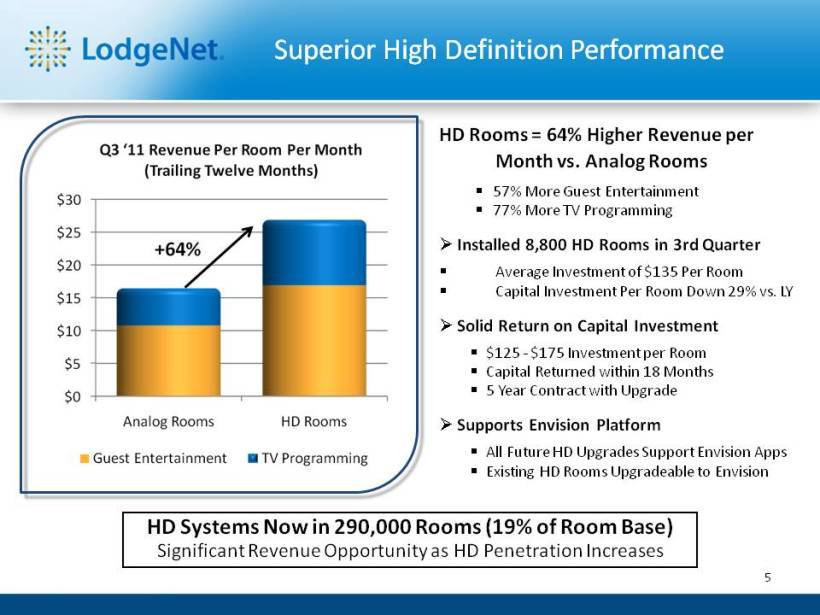
Superior High Definition Performance
HD Rooms = 64% Higher Revenue per Month vs. Analog Rooms
57% More Guest Entertainment 77% More TV Programming
Installed 8,800 HD Rooms in 3rd Quarter
Average Investment of $135 Per Room Capital Investment Per Room Down 29% vs. LY
Solid Return on Capital Investment
$125 ? $175 Investment per Room
Capital Returned within 18 Months 5 Year Contract with Upgrade
Supports Envision Platform
All Future HD Upgrades Support Envision Apps Existing HD Rooms Upgradeable to Envision
HD Systems Now in 290,000 Rooms (19% of Room Base)
Significant Revenue Opportunity as HD Penetration Increases
| 5 |
|
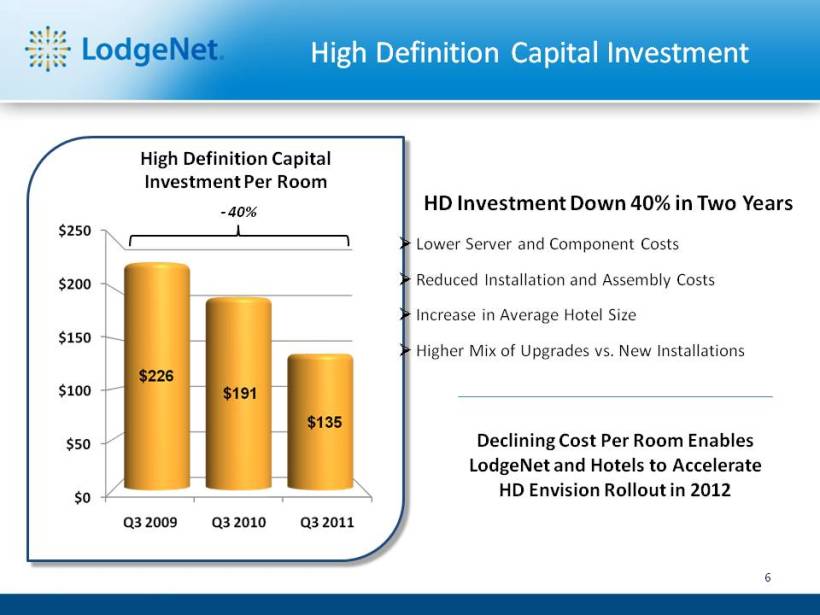
High Definition Capital Investment
High Definition Capital Investment Per Room
?40%
HD Investment Down 40% in Two Years
Lower Server and Component Costs Reduced Installation and Assembly Costs Increase in Average Hotel Size
. Higher Mix of Upgrades vs New Installations
Declining Cost Per Room Enables LodgeNet and Hotels to Accelerate HD Envision Rollout in 2012
| 6 |
|
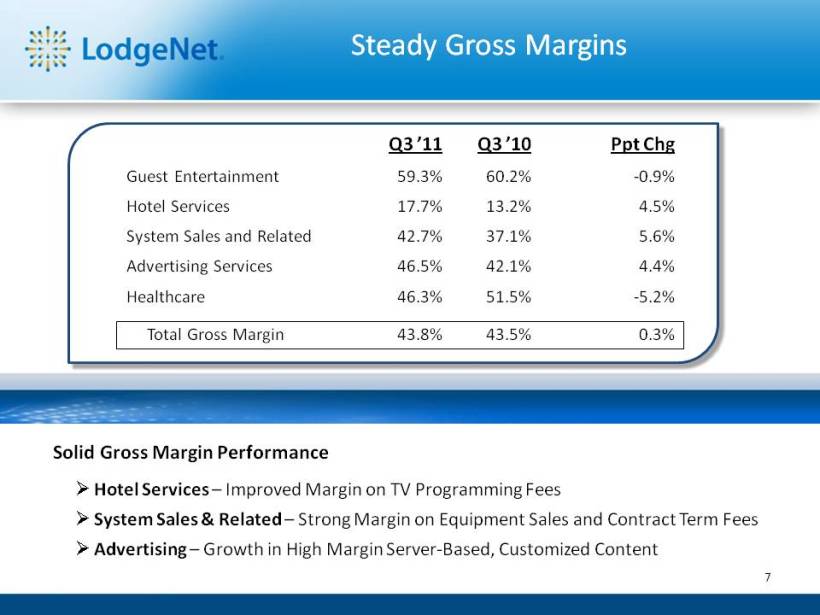
Steady Gross Margins
Q3 ‘11 Q3 ‘10 Ppt Chg
Guest Entertainment3% 59. 9% 2% 0. 60. ?
Hotel Services 17.7% 13.2% 4.5% System Sales and Related 42.7% 37.1% 5.6% Advertising Services 4. 46. 5% 1% 42. 4% Healthcare 46.3% 51.5% ? 5.2%
Total Gross Margin 43.8% 43.5% 0.3%
Solid Gross Margin Performance
Hotel Services – Improved Margin on TV Programming Fees
System Sales & Related – Strong Margin on Equipment Sales and Contract Term Fees
Advertising – Growth in High Margin Server? Based, Customized Content
| 7 |
|
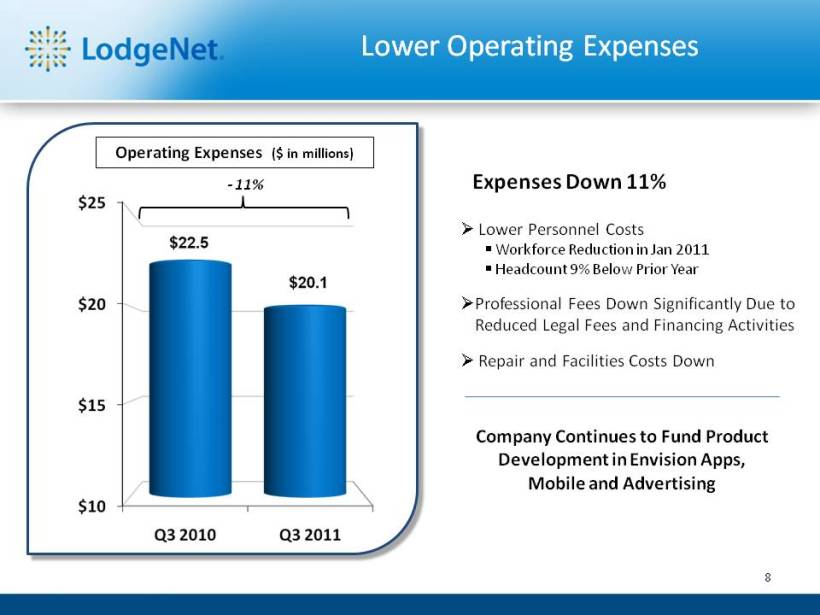
Lower Operating Expenses
Operating Expenses($ in millions)
?11%
Expenses Down 11%
Lower Personnel Costs
Workforce Reduction in Jan 2011
% Headcount 9 Below Prior Year
Professional Fees Down Significantly Due to Reduced Legal Fees and Financing Activities
Repair and Facilities Costs Down
Company Continues to Fund Product Development in Envision Apps, Mobile and Advertising
| 8 |
|
Profitability Metrics
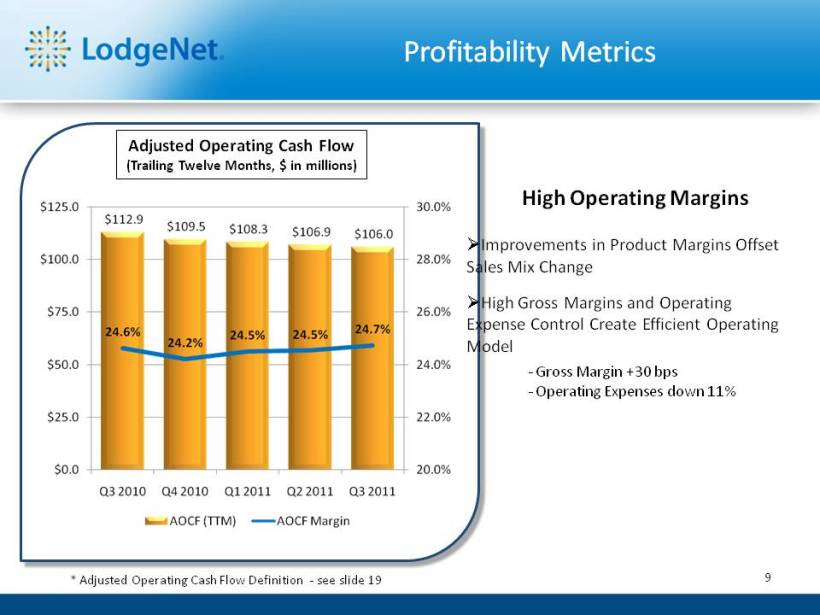
Adjusted Operating Cash Flow
(Trailing Twelve Months, $ in millions)
| * |
|
Adjusted Operating Cash Flow Definition see ?slide 19 |
High Operating Margins
Improvements in Product Margins Offset Sales Mix Change
High Gross Margins and Operating Expense Control Create Efficient Operating Model
?Gross Margin +30 bps
?Operating Expenses down 11%
9
Profitability Metrics
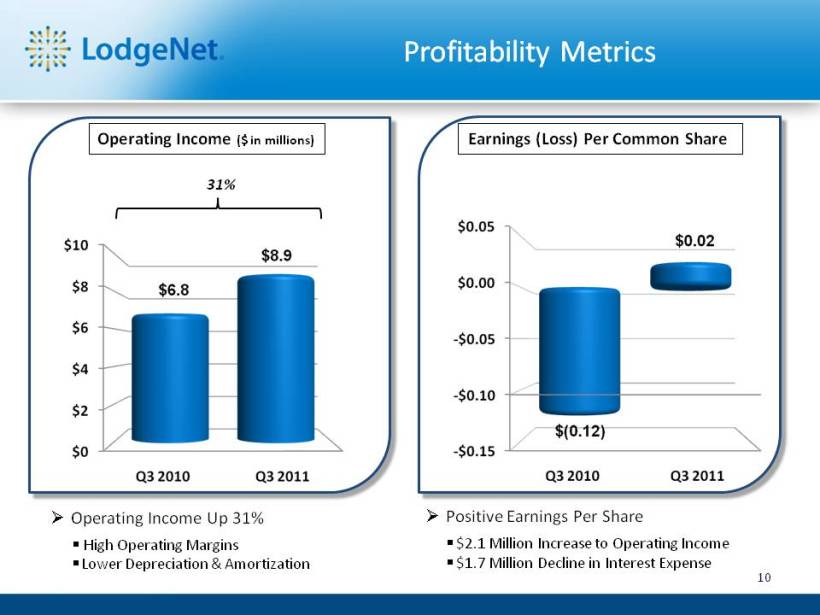
Operating Income ($ in millions)
31%
Operating Income Up 31%
High Operating Margins Lower Depreciation & Amortization
Earnings (Loss) Per Common Share
Positive Earnings Per Share
$2.1 Million Increase to Operating Income $1.7 Million Decline in Interest Expense 10
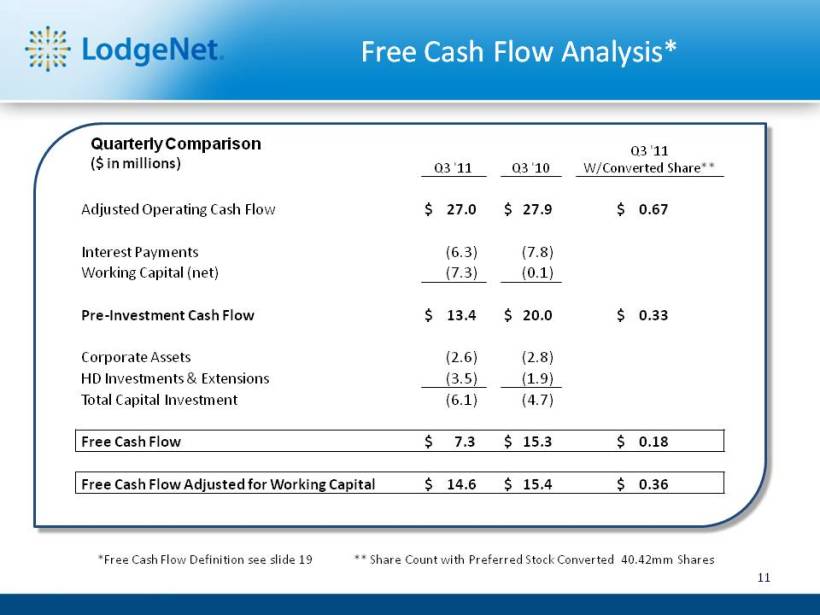
Free Cash Flow Analysis*
Quarterly Comparison Q3 ‘11
($ in millions) Q3 ‘11 Q3 ‘10 W/Converted Share**
Adjusted Operating Cash Flow $ 27.0 $ 27.9 $ 0.67
Interest Payments (6.3) (7.8) Working Capital (net) (7.3) (0.1)
Pre? Investment Cash Flow $ 13.4 $ 20.0 $ 0.33
Corporate Assets (2.6 ) (2.8 ) HD Investments & Extensions (3.5) (1.9) Total Capital Investment (6.1) (4.7)
Free Cash Flow $ 7.3 $ 15.3 $ 0.18
Free Cash Flow Adjusted for Working Capital $ 14.6 $ 15.4 $ 0.36
*Free Cash Flow Definition see slide 19 ** Share Count with Preferred Stock Converted 40.42mm Shares
11
Company Continues to Delever
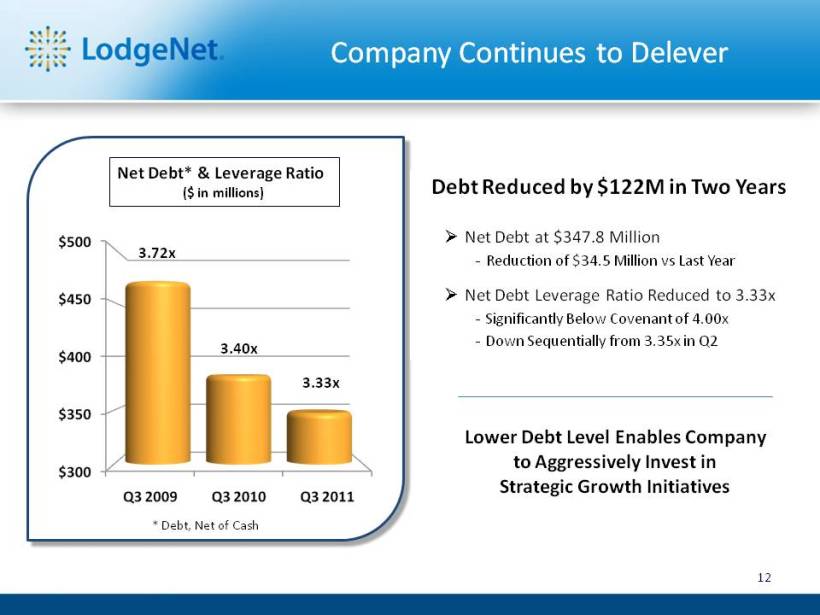
Net Debt* & Leverage Ratio
($ in millions)
3.72x
3.40x
3.33x
| * |
|
Debt, Net of Cash |
Debt Reduced by $122M in Two Years
Net Debt at $347.8 Million
.5 ?Reduction of $34 Million vs Last Year
Net Debt Leverage Ratio Reduced to 3.33x
?Significantly Below Covenant of 4.00x
?Down Sequentially from 3.35x in Q2
Lower Debt Level Enables Company to Aggressively Invest in Strategic Growth Initiatives
12
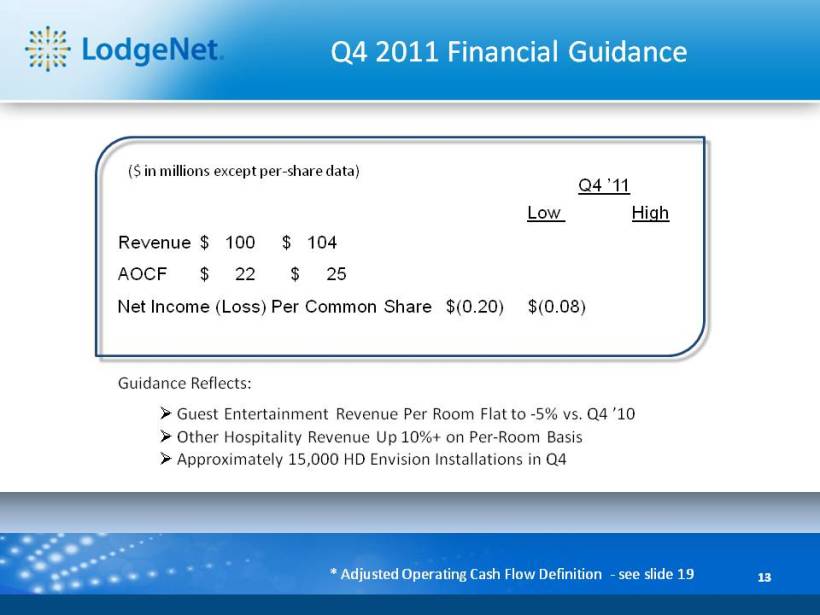
Q4 2011 Financial Guidance
($ in millions except per? share data)
Q4 ‘11 Low High Revenue $ 100 $ 104 AOCF $ 22 $ 25 Net Income (Loss) Per Common Share $(0.20) $(0.08)
Guidance Reflects:
Guest Entertainment Revenue Per Room Flat to ? 5% vs. Q4 ‘10
Other Hospitality Revenue Up 10%+ on Per? Room Basis
Approximately 15,000 HD Envision Installations in Q4
| * |
|
Adjusted Operating Cash Flow Definition see ?slide 19 13 |
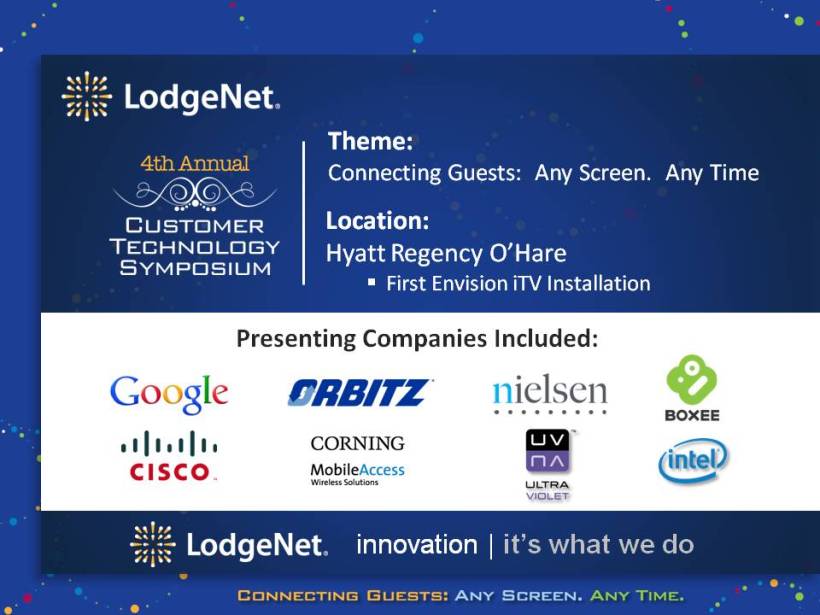
Theme:
. Connecting Guests: Any Screen Any Time
Location:
Hyatt Regency O’Hare
First Envision iTV Installation
Presentin g Companies Included:
innovation | it’s what we do
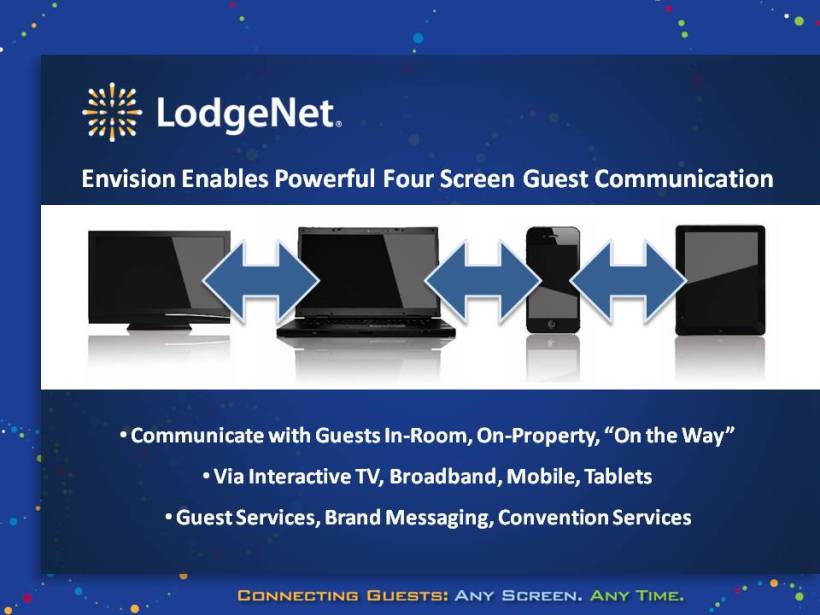
Envision Enables Powerful Four Screen Guest Communication
• Communicate with Guests In? Room, On? Property, “On the Way”
• Via Interactive TV, Broadband, Mobile, Tablets
• Guest Services , Brand Messaging, Convention Services
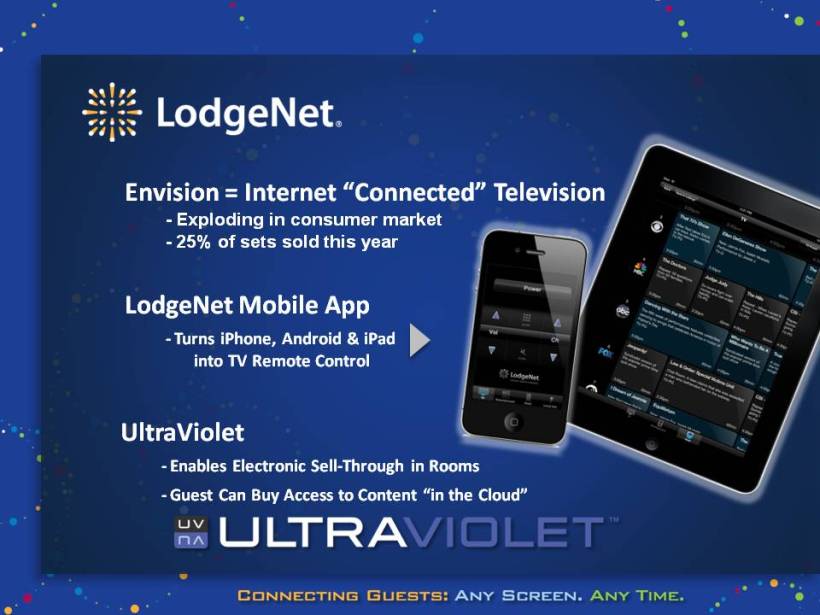
Envision = Internet “Connected” Television
- Exploding in consumer market
- 25% of sets sold this year
LodgeNet Mobile App
?Turns iPhone, Android & iPad into TV Remote Control
UltraViolet
?Enables Electronic Sell? Through in Rooms
?Guest Can Buy Access to Content “in the Cloud”

Positive Research Released
LodgeNet VOD 5th Most Popular Hotel “Channel”
Only Broadcast Networks and Premium Higher
PwC Report Highlights Value of Premium VOD
Faster Access To Content Most Appealing
Guest Survey Reflects Positive Impression of iHDTV
2/3 Find Hotels with iHDTV as Superior, More Innovative
innovation | it’s what we do
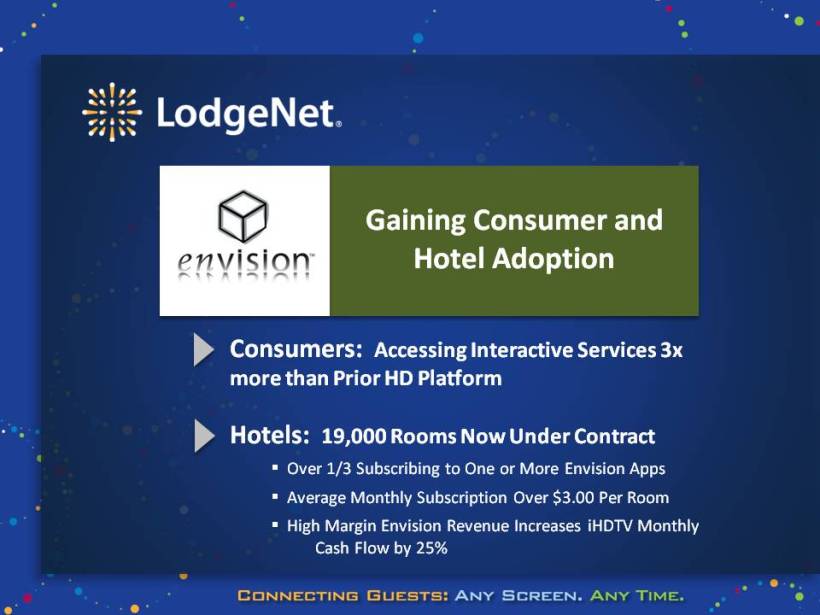
Gaining Consumer and Hotel Adoption
Consumers: Accessing Interactive Services 3x more than Prior HD Platform
Hotels: 19,000 Rooms Now Under Contract
Over 1/3 Subscribing to One or More Envision Apps Average Monthly Subscription Over $3.00 Per Room
High Margin Envision Revenue Increases iHDTV Monthly
Cash Flow by 25%
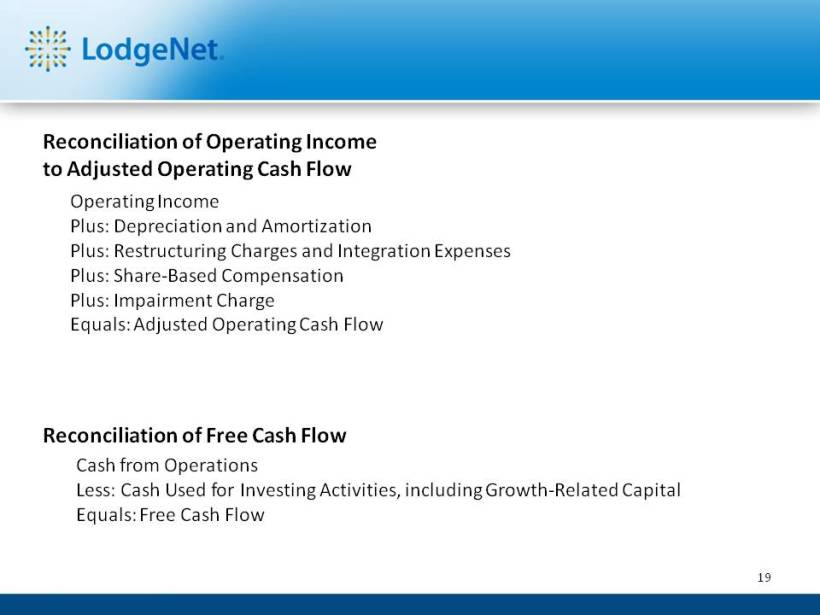
Reconciliation of Operating Income to Adjusted Operating Cash Flow
Operating Income
Plus: Depreciation and Amortization Plus: Restructuring Charges and Integration Expenses Plus: Share? Based Compensation Plus: Impairment Charge Equals: Adjusted Operating Cash Flow
Reconciliation of Free Cash Flow
Cash from Operations
Less: Cash Used for Investing Activities, including Growth ? Related Capital Equals: Free Cash Flow
19