Attached files
| file | filename |
|---|---|
| 8-K - 8-K - VEECO INSTRUMENTS INC | a11-28425_18k.htm |
| EX-3.1 - EX-3.1 - VEECO INSTRUMENTS INC | a11-28425_1ex3d1.htm |
| EX-99.1 - EX-99.1 - VEECO INSTRUMENTS INC | a11-28425_1ex99d1.htm |
Exhibit 99.2
|
|
Earnings Conference Call 10/24/11 |
|
|
Introduction Debra A. Wasser, SVP, Investor Relations |
|
|
Safe Harbor Statement To the extent that this presentation discusses expectations or otherwise makes statements about the future, such statements are forward-looking and are subject to a number of risks and uncertainties that could cause actual results to differ materially from the statements made. These items include the risk factors discussed in the Business Description and Management's Discussion and Analysis sections of Veeco's Annual Report on Form 10-K for the year ended December 31, 2010 and subsequent Quarterly Reports on Form 10-Q and current reports on Form 8-K. Veeco does not undertake any obligation to update any forward-looking statements to reflect future events or circumstances after the date of such statements. In addition, this presentation includes non-GAAP financial measures. For GAAP reconciliation, please refer to the reconciliation section in this presentation as well as Veeco’s financial press releases and 10-K and 10-Q filings available on www.veeco.com. Note: All results presented herein are for Veeco’s “Continuing Operations” which exclude the Metrology business sold to Bruker Corporation on October 7, 2010 and the discontinued CIGS Solar Systems Business. |
|
|
Q3 2011 Results David D. Glass, CFO |
|
|
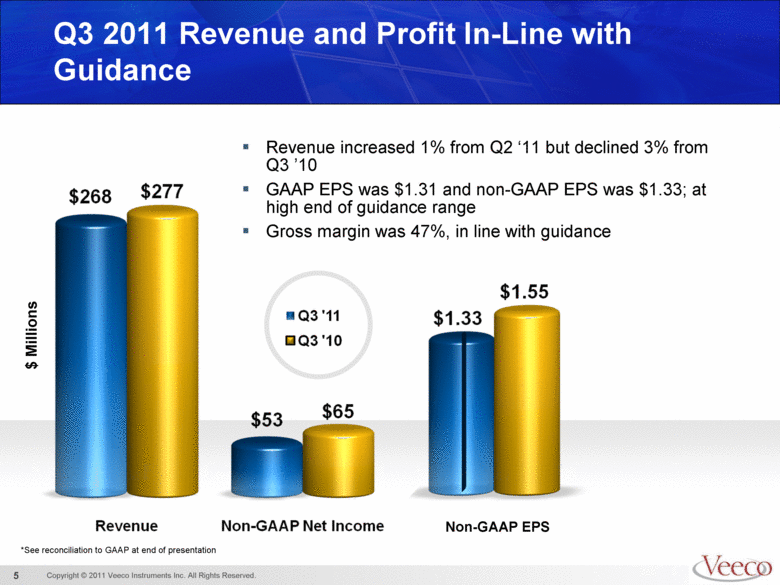
Q3 2011 Revenue and Profit In-Line with Guidance *See reconciliation to GAAP at end of presentation $ Millions Revenue increased 1% from Q2 ‘11 but declined 3% from Q3 ’10 GAAP EPS was $1.31 and non-GAAP EPS was $1.33; at high end of guidance range Gross margin was 47%, in line with guidance Non-GAAP EPS |
|
|
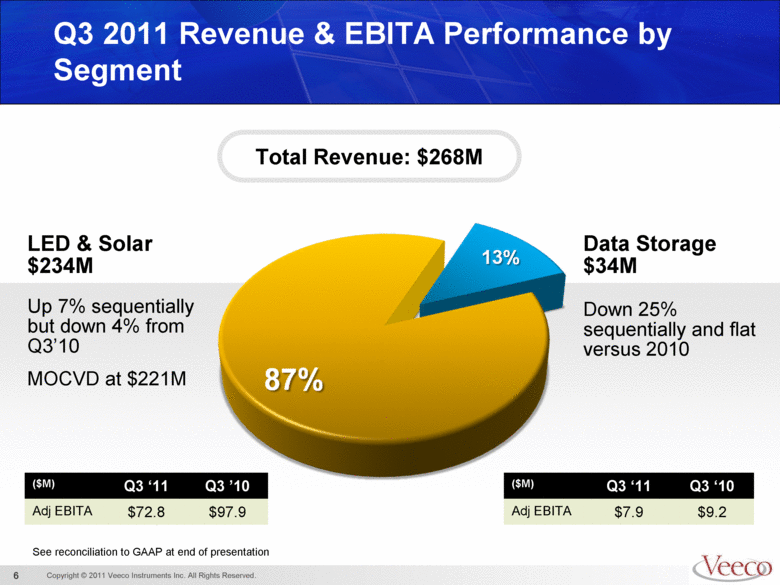
Q3 2011 Revenue & EBITA Performance by Segment Data Storage $34M Down 25% sequentially and flat versus 2010 Total Revenue: $268M LED & Solar $234M Up 7% sequentially but down 4% from Q3’10 MOCVD at $221M ($M) Q3 ‘11 Q3 ’10 Adj EBITA $72.8 $97.9 ($M) Q3 ‘11 Q3 ‘10 Adj EBITA $7.9 $9.2 See reconciliation to GAAP at end of presentation |
|
|
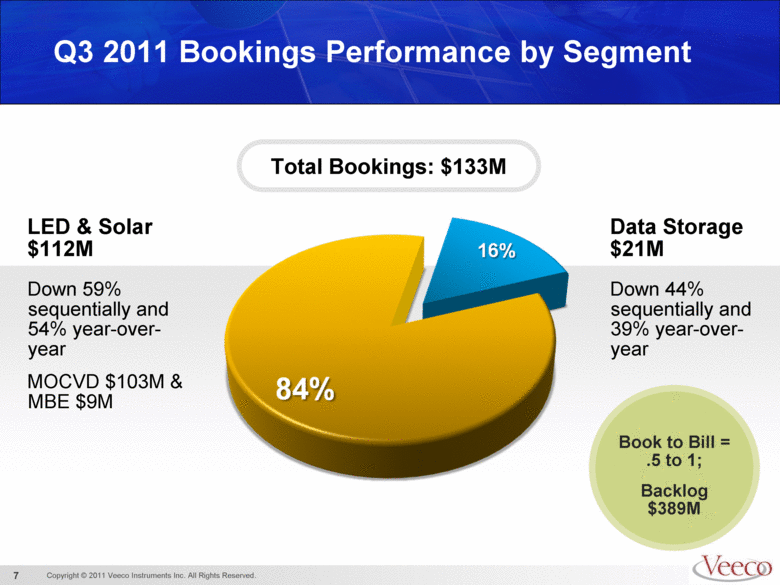
Q3 2011 Bookings Performance by Segment Data Storage $21M Down 44% sequentially and 39% year-over-year Total Bookings: $133M LED & Solar $112M Down 59% sequentially and 54% year-over-year MOCVD $103M & MBE $9M Book to Bill = .5 to 1; Backlog $389M |
|
|
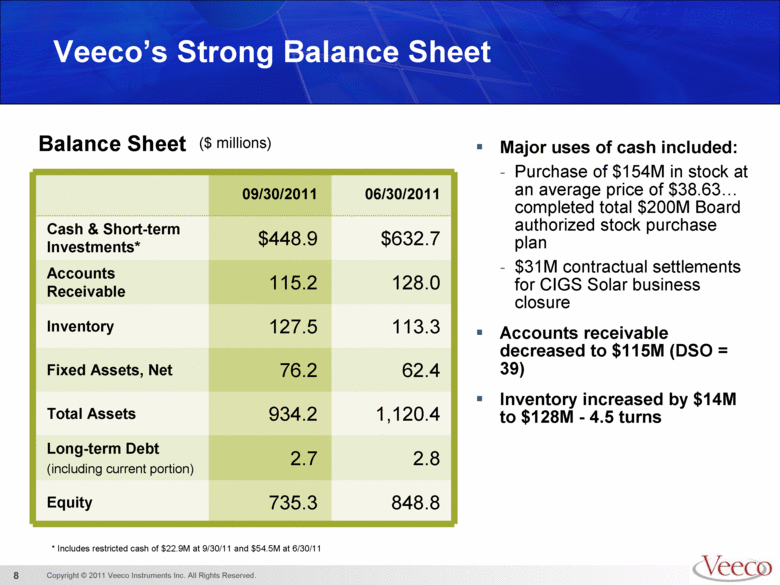
Veeco’s Strong Balance Sheet 09/30/2011 06/30/2011 Cash & Short-term Investments* $448.9 $632.7 Accounts Receivable 115.2 128.0 Inventory 127.5 113.3 Fixed Assets, Net 76.2 62.4 Total Assets 934.2 1,120.4 Long-term Debt (including current portion) 2.7 2.8 Equity 735.3 848.8 * Includes restricted cash of $22.9M at 9/30/11 and $54.5M at 6/30/11 ($ millions) Major uses of cash included: Purchase of $154M in stock at an average price of $38.63 completed total $200M Board authorized stock purchase plan $31M contractual settlements for CIGS Solar business closure Accounts receivable decreased to $115M (DSO = 39) Inventory increased by $14M to $128M - 4.5 turns Balance Sheet |
|
|
Business Update and Outlook John R. Peeler, CEO |
|
|
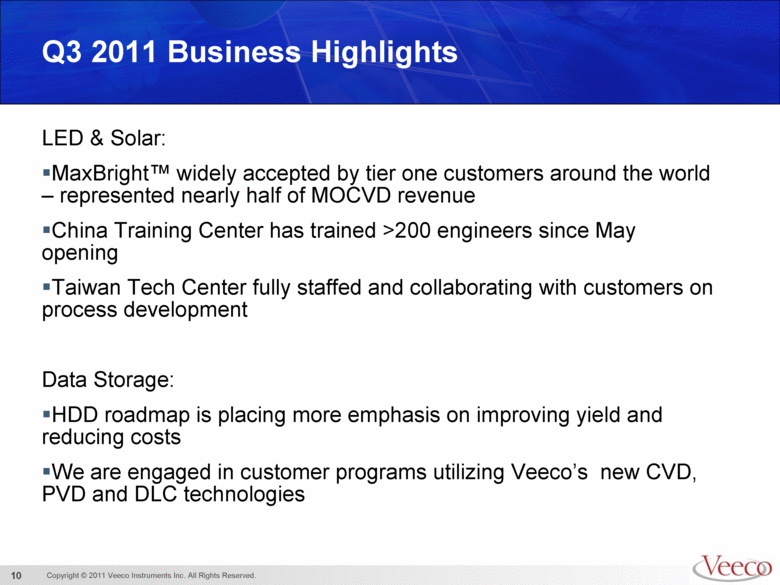
Q3 2011 Business Highlights LED & Solar: MaxBright™ widely accepted by tier one customers around the world – represented nearly half of MOCVD revenue China Training Center has trained >200 engineers since May opening Taiwan Tech Center fully staffed and collaborating with customers on process development Data Storage: HDD roadmap is placing more emphasis on improving yield and reducing costs We are engaged in customer programs utilizing Veeco’s new CVD, PVD and DLC technologies |
|
|
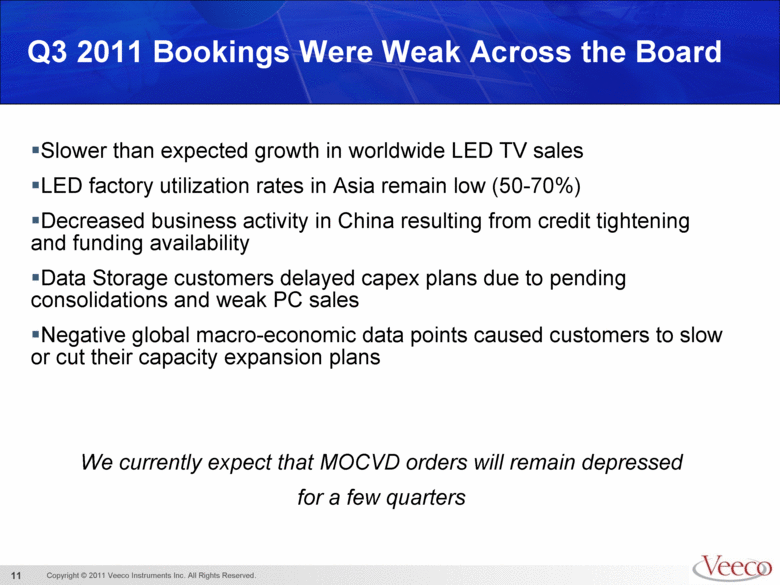
Q3 2011 Bookings Were Weak Across the Board Slower than expected growth in worldwide LED TV sales LED factory utilization rates in Asia remain low (50-70%) Decreased business activity in China resulting from credit tightening and funding availability Data Storage customers delayed capex plans due to pending consolidations and weak PC sales Negative global macro-economic data points caused customers to slow or cut their capacity expansion plans We currently expect that MOCVD orders will remain depressed for a few quarters |
|
|
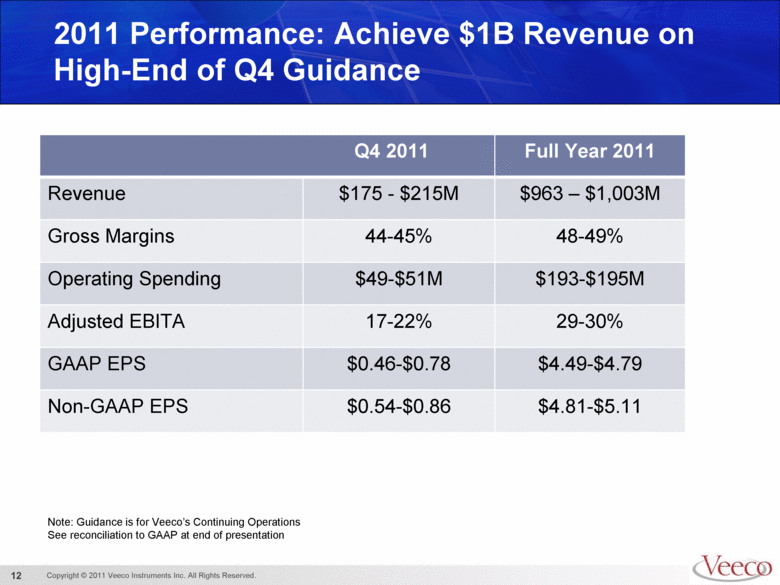
2011 Performance: Achieve $1B Revenue on High-End of Q4 Guidance Note: Guidance is for Veeco’s Continuing Operations See reconciliation to GAAP at end of presentation Q4 2011 Full Year 2011 Revenue $175 - $215M $963 – $1,003M Gross Margins 44-45% 48-49% Operating Spending $49-$51M $193-$195M Adjusted EBITA 17-22% 29-30% GAAP EPS $0.46-$0.78 $4.49-$4.79 Non-GAAP EPS $0.54-$0.86 $4.81-$5.11 |
|
|
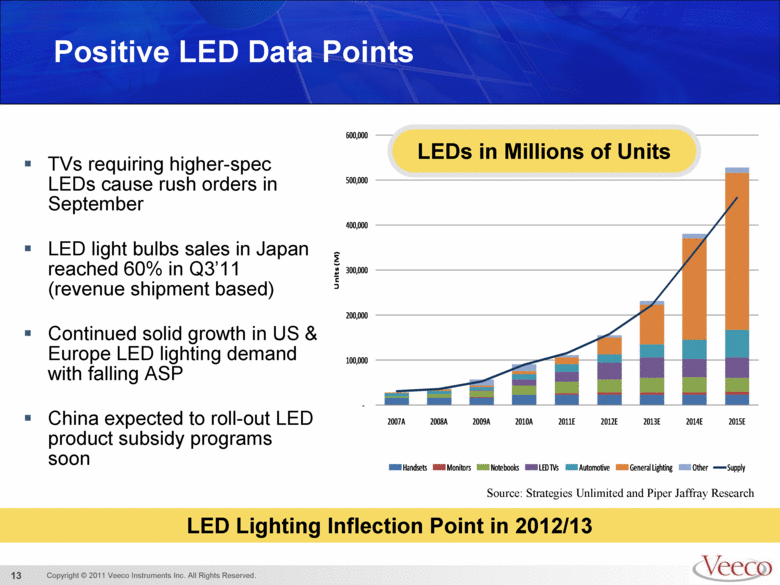
Positive LED Data Points TVs requiring higher-spec LEDs cause rush orders in September LED light bulbs sales in Japan reached 60% in Q3’11 (revenue shipment based) Continued solid growth in US & Europe LED lighting demand with falling ASP China expected to roll-out LED product subsidy programs soon LEDs in Millions of Units LED Lighting Inflection Point in 2012/13 Source: Strategies Unlimited and Piper Jaffray Research - 100,000 200,000 300,000 400,000 500,000 600,000 2007A 2008A 2009A 2010A 2011E 2012E 2013E 2014E 2015E Units (M) Handsets Monitors Notebooks LED TVs Automotive General Lighting Other Supply |
|
|
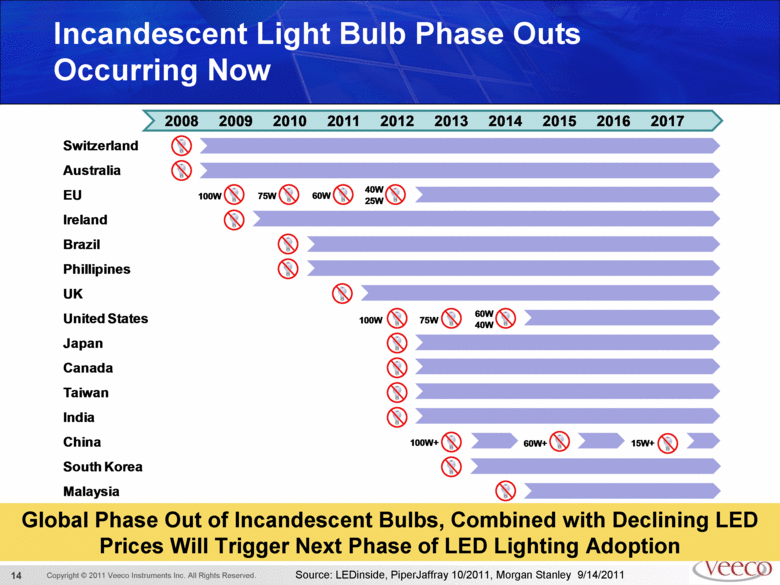
Incandescent Light Bulb Phase Outs Occurring Now Source: LEDinside, PiperJaffray 10/2011, Morgan Stanley 9/14/2011 Global Phase Out of Incandescent Bulbs, Combined with Declining LED Prices Will Trigger Next Phase of LED Lighting Adoption Switzerland EU Australia United States Ireland Brazil Phillipines UK Japan Canada Taiwan India China South Korea Malaysia 2008 2009 2010 2011 2012 2013 2014 2015 2016 2017 100W 75W 60W 40W 25W 100W 75W 60W 40W 100W+ 60W+ 15W+ |
|
|
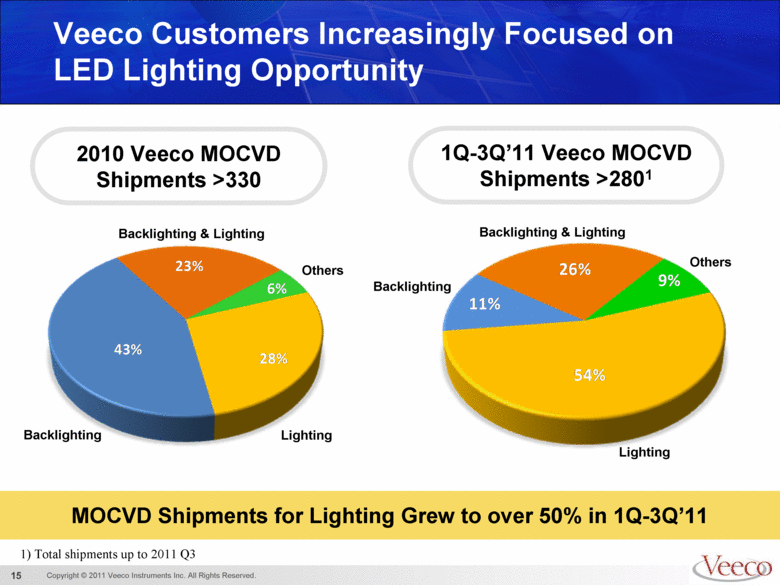
Veeco Customers Increasingly Focused on LED Lighting Opportunity 2010 Veeco MOCVD Shipments >330 Lighting Backlighting Backlighting & Lighting Others Backlighting Others Lighting Backlighting & Lighting 1Q-3Q’11 Veeco MOCVD Shipments >2801 MOCVD Shipments for Lighting Grew to over 50% in 1Q-3Q’11 1) Total shipments up to 2011 Q3 54% 11% 26% 9% 28% 43% 23% 6% |
|
|
Outlook LED & Solar: LED pricing declines will continue to stimulate demand for solid state lighting on a global basis We expect widespread adoption of LED lightingfirst in commercial, municipal and industrial and then in residential Despite some level of cyclicality overall expectation of 5,000 reactor TAM from 2011-2015 Veeco’s MOCVD market position is the best it has ever been Data Storage: Orders have been running at low levels throughout 2011 Anticipate pent-up demand for new equipment once M&A is finalized |
|
|
Wrap Up Well positioned for solid performance in 2012: Exceptional product pipeline Highly-variable operational model Strong balance sheet Proven ability to execute Expect to deliver double-digit EBITA performance next year |
|
|
Q&A Session |
|
|
Financial Tables |
|
|
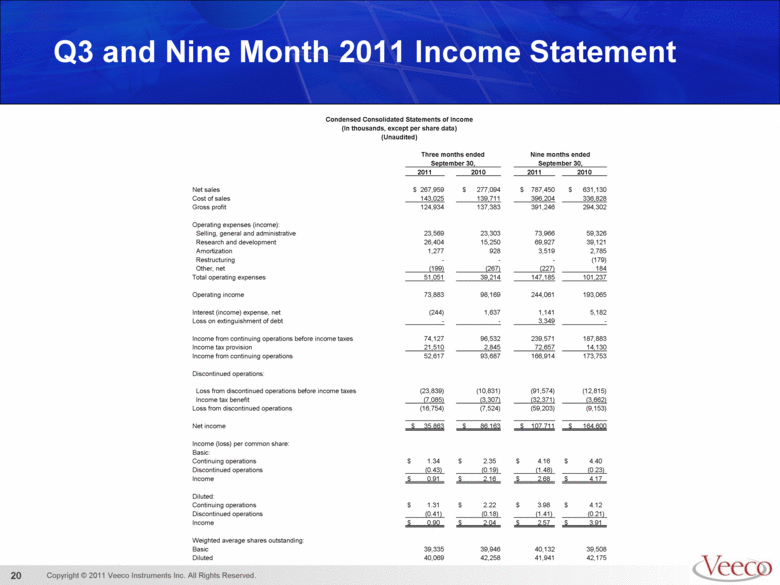
Q3 and Nine Month 2011 Income Statement Condensed Consolidated Statements of Income (In thousands, except per share data) (Unaudited) Three months ended Nine months ended September 30, September 30, 2011 2010 2011 2010 Net sales $ 267,959 $ 277,094 $ 787,450 $ 631,130 Cost of sales 143,025 139,711 396,204 336,828 Gross profit 124,934 137,383 391,246 294,302 Operating expenses (income): Selling, general and administrative 23,569 23,303 73,966 59,326 Research and development 26,404 15,250 69,927 39,121 Amortization 1,277 928 3,519 2,785 Restructuring - - - (179) Other, net (199) (267) (227) 184 Total operating expenses 51,051 39,214 147,185 101,237 Operating income 73,883 98,169 244,061 193,065 Interest (income) expense, net (244) 1,637 1,141 5,182 Loss on extinguishment of debt - - 3,349 - Income from continuing operations before income taxes 74,127 96,532 239,571 187,883 Income tax provision 21,510 2,845 72,657 14,130 Income from continuing operations 52,617 93,687 166,914 173,753 Discontinued operations: Loss from discontinued operations before income taxes (23,839) (10,831) (91,574) (12,815) Income tax benefit (7,085) (3,307) (32,371) (3,662) Loss from discontinued operations (16,754) (7,524) (59,203) (9,153) Net income $ 35,863 $ 86,163 $ 107,711 $ 164,600 Income (loss) per common share: Basic: Continuing operations $ 1.34 $ 2.35 $ 4.16 $ 4.40 Discontinued operations (0.43) (0.19) (1.48) (0.23) Income $ 0.91 $ 2.16 $ 2.68 $ 4.17 Diluted: Continuing operations $ 1.31 $ 2.22 $ 3.98 $ 4.12 Discontinued operations (0.41) (0.18) (1.41) (0.21) Income $ 0.90 $ 2.04 $ 2.57 $ 3.91 Weighted average shares outstanding: Basic 39,335 39,946 40,132 39,508 Diluted 40,069 42,258 41,941 42,175 |
|
|
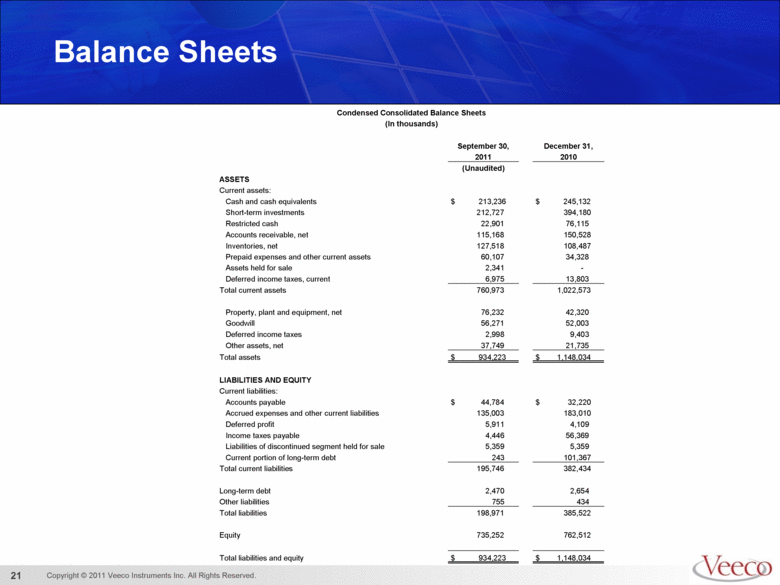
Balance Sheets Condensed Consolidated Balance Sheets (In thousands) September 30, December 31, 2011 2010 (Unaudited) ASSETS Current assets: Cash and cash equivalents $ 213,236 $ 245,132 Short-term investments 212,727 394,180 Restricted cash 22,901 76,115 Accounts receivable, net 115,168 150,528 Inventories, net 127,518 108,487 Prepaid expenses and other current assets 60,107 34,328 Assets held for sale 2,341 - Deferred income taxes, current 6,975 13,803 Total current assets 760,973 1,022,573 Property, plant and equipment, net 76,232 42,320 Goodwill 56,271 52,003 Deferred income taxes 2,998 9,403 Other assets, net 37,749 21,735 Total assets $ 934,223 $ 1,148,034 LIABILITIES AND EQUITY Current liabilities: Accounts payable $ 44,784 $ 32,220 Accrued expenses and other current liabilities 135,003 183,010 Deferred profit 5,911 4,109 Income taxes payable 4,446 56,369 Liabilities of discontinued segment held for sale 5,359 5,359 Current portion of long-term debt 243 101,367 Total current liabilities 195,746 382,434 Long-term debt 2,470 2,654 Other liabilities 755 434 Total liabilities 198,971 385,522 Equity 735,252 762,512 Total liabilities and equity $ 934,223 $ 1,148,034 |
|
|
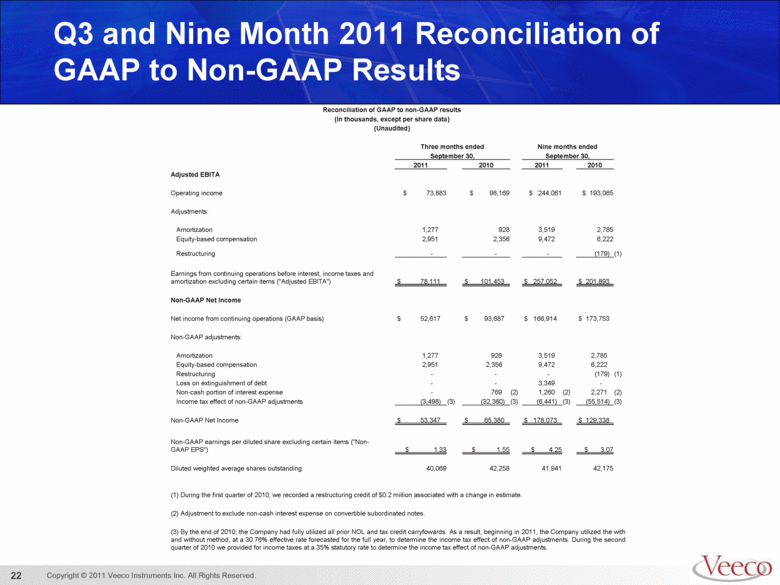
Q3 and Nine Month 2011 Reconciliation of GAAP to Non-GAAP Results Reconciliation of GAAP to non-GAAP results (In thousands, except per share data) (Unaudited) Three months ended Nine months ended September 30, September 30, 2011 2010 2011 2010 Adjusted EBITA Operating income $ 73,883 $ 98,169 $ 244,061 $ 193,065 Adjustments: Amortization 1,277 928 3,519 2,785 Equity-based compensation 2,951 2,356 9,472 6,222 Restructuring - - - (179) (1) Earnings from continuing operations before interest, income taxes and amortization excluding certain items ("Adjusted EBITA") $ 78,111 $ 101,453 $ 257,052 $ 201,893 Non-GAAP Net Income Net income from continuing operations (GAAP basis) $ 52,617 $ 93,687 $ 166,914 $ 173,753 Non-GAAP adjustments: Amortization 1,277 928 3,519 2,785 Equity-based compensation 2,951 2,356 9,472 6,222 Restructuring - - - (179) (1) Loss on extinguishment of debt - - 3,349 - Non-cash portion of interest expense - 769 (2) 1,260 (2) 2,271 (2) Income tax effect of non-GAAP adjustments (3,498) (3) (32,360) (3) (6,441) (3) (55,514) (3) Non-GAAP Net Income $ 53,347 $ 65,380 $ 178,073 $ 129,338 Non-GAAP earnings per diluted share excluding certain items ("Non-GAAP EPS") $ 1.33 $ 1.55 $ 4.25 $ 3.07 Diluted weighted average shares outstanding 40,069 42,258 41,941 42,175 (1) During the first quarter of 2010, we recorded a restructuring credit of $0.2 million associated with a change in estimate. (2) Adjustment to exclude non-cash interest expense on convertible subordinated notes. (3) By the end of 2010, the Company had fully utilized all prior NOL and tax credit carryfowards. As a result, beginning in 2011, the Company utilized the with and without method, at a 30.76% effective rate forecasted for the full year, to determine the income tax effect of non-GAAP adjustments. During the second quarter of 2010 we provided for income taxes at a 35% statutory rate to determine the income tax effect of non-GAAP adjustments. |
|
|
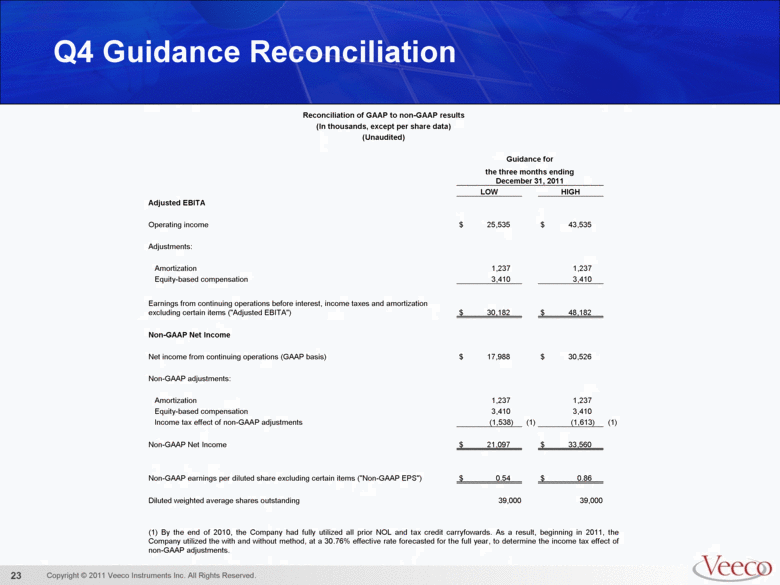
Q4 Guidance Reconciliation Reconciliation of GAAP to non-GAAP results (In thousands, except per share data) (Unaudited) Guidance for the three months ending December 31, 2011 LOW HIGH Adjusted EBITA Operating income $ 25,535 $ 43,535 Adjustments: Amortization 1,237 1,237 Equity-based compensation 3,410 3,410 Earnings from continuing operations before interest, income taxes and amortization excluding certain items ("Adjusted EBITA") $ 30,182 $ 48,182 Non-GAAP Net Income Net income from continuing operations (GAAP basis) $ 17,988 $ 30,526 Non-GAAP adjustments: Amortization 1,237 1,237 Equity-based compensation 3,410 3,410 Income tax effect of non-GAAP adjustments (1,538) (1) (1,613) (1) Non-GAAP Net Income $ 21,097 $ 33,560 Non-GAAP earnings per diluted share excluding certain items ("Non-GAAP EPS") $ 0.54 $ 0.86 Diluted weighted average shares outstanding 39,000 39,000 (1) By the end of 2010, the Company had fully utilized all prior NOL and tax credit carryfowards. As a result, beginning in 2011, the Company utilized the with and without method, at a 30.76% effective rate forecasted for the full year, to determine the income tax effect of non-GAAP adjustments. |
|
|
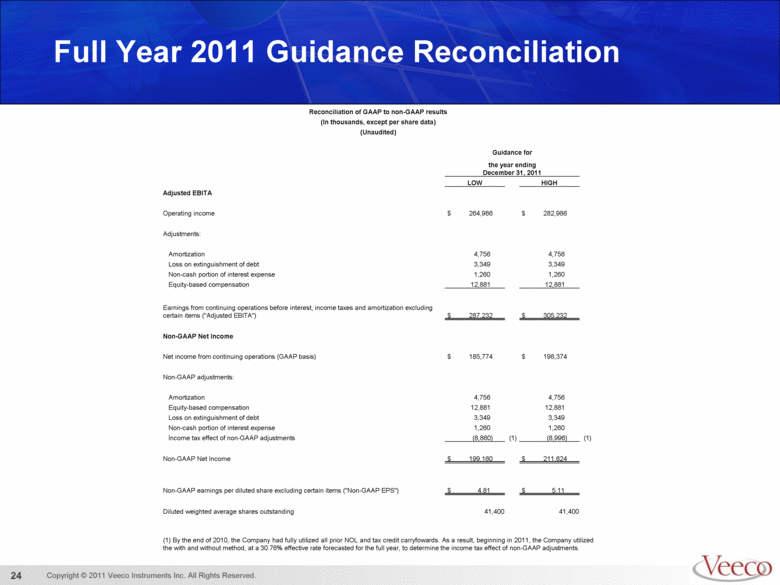
Full Year 2011 Guidance Reconciliation Reconciliation of GAAP to non-GAAP results (In thousands, except per share data) (Unaudited) Guidance for the year ending December 31, 2011 LOW HIGH Adjusted EBITA Operating income $ 264,986 $ 282,986 Adjustments: Amortization 4,756 4,756 Loss on extinguishment of debt 3,349 3,349 Non-cash portion of interest expense 1,260 1,260 Equity-based compensation 12,881 12,881 Earnings from continuing operations before interest, income taxes and amortization excluding certain items ("Adjusted EBITA") $ 287,232 $ 305,232 Non-GAAP Net Income Net income from continuing operations (GAAP basis) $ 185,774 $ 198,374 Non-GAAP adjustments: Amortization 4,756 4,756 Equity-based compensation 12,881 12,881 Loss on extinguishment of debt 3,349 3,349 Non-cash portion of interest expense 1,260 1,260 Income tax effect of non-GAAP adjustments (8,860) (1) (8,996) (1) Non-GAAP Net Income $ 199,160 $ 211,624 Non-GAAP earnings per diluted share excluding certain items ("Non-GAAP EPS") $ 4.81 $ 5.11 Diluted weighted average shares outstanding 41,400 41,400 (1) By the end of 2010, the Company had fully utilized all prior NOL and tax credit carryfowards. As a result, beginning in 2011, the Company utilized the with and without method, at a 30.76% effective rate forecasted for the full year, to determine the income tax effect of non-GAAP adjustments. |
|
|
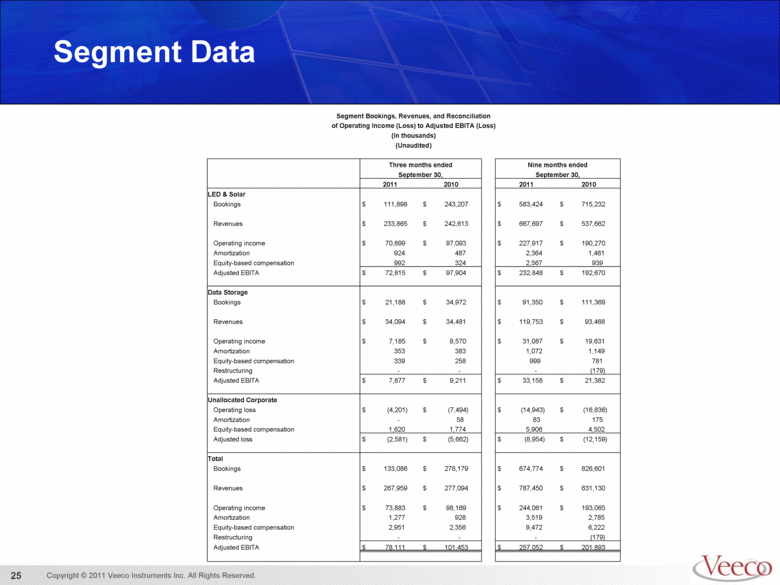
Segment Data Segment Bookings, Revenues, and Reconciliation of Operating Income (Loss) to Adjusted EBITA (Loss) (In thousands) (Unaudited) Three months ended Nine months ended September 30, September 30, 2011 2010 2011 2010 LED & Solar Bookings $ 111,898 $ 243,207 $ 583,424 $ 715,232 Revenues $ 233,865 $ 242,613 $ 667,697 $ 537,662 Operating income $ 70,899 $ 97,093 $ 227,917 $ 190,270 Amortization 924 487 2,364 1,461 Equity-based compensation 992 324 2,567 939 Adjusted EBITA $ 72,815 $ 97,904 $ 232,848 $ 192,670 Data Storage Bookings $ 21,188 $ 34,972 $ 91,350 $ 111,369 Revenues $ 34,094 $ 34,481 $ 119,753 $ 93,468 Operating income $ 7,185 $ 8,570 $ 31,087 $ 19,631 Amortization 353 383 1,072 1,149 Equity-based compensation 339 258 999 781 Restructuring - - - (179) Adjusted EBITA $ 7,877 $ 9,211 $ 33,158 $ 21,382 Unallocated Corporate Operating loss $ (4,201) $ (7,494) $ (14,943) $ (16,836) Amortization - 58 83 175 Equity-based compensation 1,620 1,774 5,906 4,502 Adjusted loss $ (2,581) $ (5,662) $ (8,954) $ (12,159) Total Bookings $ 133,086 $ 278,179 $ 674,774 $ 826,601 Revenues $ 267,959 $ 277,094 $ 787,450 $ 631,130 Operating income $ 73,883 $ 98,169 $ 244,061 $ 193,065 Amortization 1,277 928 3,519 2,785 Equity-based compensation 2,951 2,356 9,472 6,222 Restructuring - - - (179) Adjusted EBITA $ 78,111 $ 101,453 $ 257,052 $ 201,893 |
|
|
Earnings Conference Call 10/24/11 |


