Attached files
| file | filename |
|---|---|
| EX-99.1 - EX-99.1 - WESCO INTERNATIONAL INC | d245474dex991.htm |
| 8-K - FORM 8-K - WESCO INTERNATIONAL INC | d245474d8k.htm |
 Supplemental Financial Data
WESCO Third Quarter 2011
October 20, 2011
Exhibit 99.2 |
 2
Safe Harbor Statement
Note:
All statements made herein that are not historical facts should be considered as
“forward- looking
statements”
within
the
meaning
of
the
Private
Securities
Litigation
Act
of
1995. Such
statements involve known and unknown risks, uncertainties and other factors that
may cause actual results to differ materially. Such risks, uncertainties and
other factors include, but are not limited to, debt level, changes in
general economic conditions, fluctuations in interest rates, increases in
raw materials and labor costs, levels of competition and other factors described in
detail in Form 10-K for WESCO International, Inc. for the year ended December
31, 2010 and any subsequent filings with the Securities & Exchange
Commission. Any numerical or other representations in this presentation do
not represent guidance by management and should not be construed as
such. |
 3
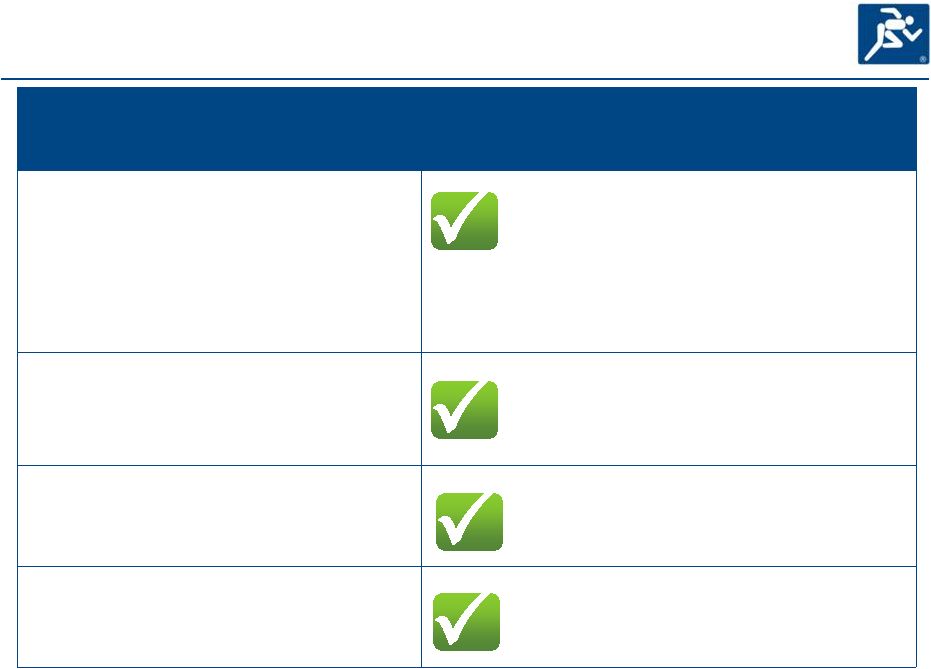
Third Quarter 2011 Results
Q3 Outlook Provided
Third Quarter 2011 Performance
Sales growth expected to be at or
above 18% year-over-year and
2.5% sequentially, assuming stable
pricing and f/x rates including
acquisitions
Sales growth of 19.3% versus prior
year; sales up 3.7% sequentially;
organic sales growth of 11.3%
versus prior year. Fifth consecutive
quarter of double-digit organic sales
growth versus prior year.
Gross margin expected to be at or
above 19.8%
Gross margin of 20%, up 50 basis
points over prior year
Operating margin expected to be at
or above 5.4%
Operating margin of 5.8%, up 120
basis points versus prior year
Tax rate expected to be
approximately 30-32%
Effective tax rate of 29.7% |
 4
Organic Sales Analysis Versus Prior Year
--------------------
2010
--------------------
2011
2011
2011
Q1
Q2
Q3
Q4
Full
Year
Q1
Q2
Q3
Consolidated Sales Growth
(2.6%)
8.6%
14.9%
17.6%
9.5%
24.6%
21.1%
19.3%
F/X
(1.8%)
(1.9%)
(0.9%)
(0.7%)
(1.3%)
(1.1%)
(1.0%)
(1.1%)
Acquisitions
0
0
(0.7%)
(1.1%)
(0.4%)
(7.0%)
(7.4%)
(6.9%)
(4.4%)
6.7%
13.3%
15.8%
7.8%
16.5%
12.7%
11.3%
1.5%
3.0%
2.5%
3.0%
2.5%
3.5%
3.0%
Organic Sales Growth
Management Estimated
Price Impact
3.5% |
 5
WESCO Portfolio –
Including Acquisitions
Lighting &
Lighting &
Controls
Controls
Controls
Controls
& Motors
& Motors
General
General
Supplies
Supplies
Data & Broadband
Data & Broadband
Communications
Communications
Wire, Cable &
Wire, Cable &
Conduit
Conduit
Utility
•
Investor Owned
•
Public Power
•
Utility Contractors
CIG
•
Commercial
•
Institutional
•
Government
Industrial
•
Global Accounts
•
Integrated Supply
•
OEM
•
General Industrial
Construction and
Contractors
•
Non-Residential
•
Residential
Distribution
Equipment
(September 2011 year-to-date, management estimates)
43%
35%
11%
11%
Markets
&
Customers
33%
18%
18%
11%
11%
9%
Products
&
Services |
 6
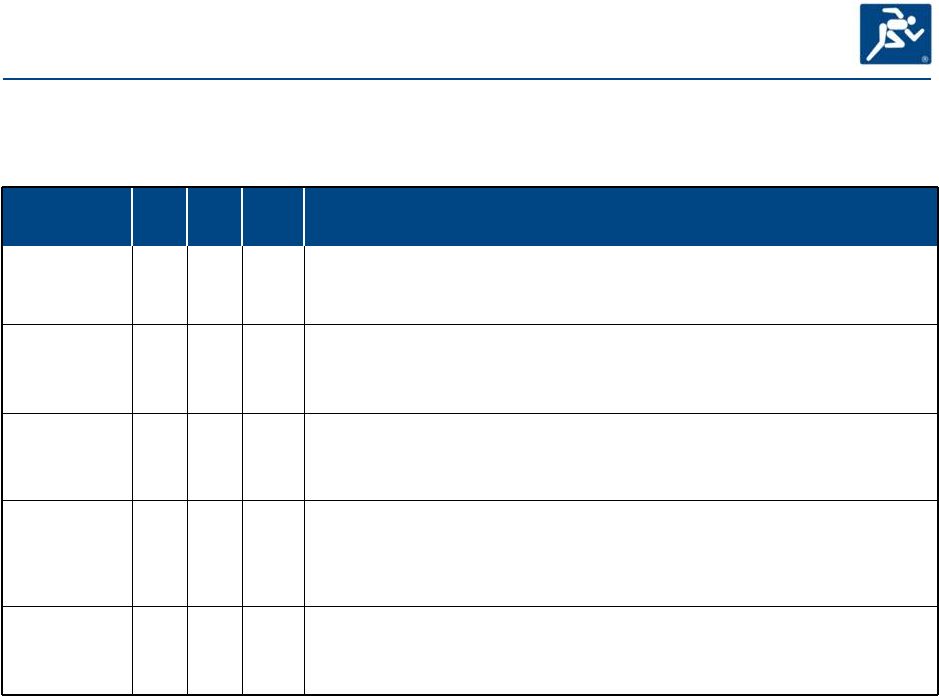
End Market
Q3 2011 Q3 2011
vs.
Q3 2010
vs.
Q2 2011
2011YTD
vs.
2010 YTD
Comments
WESCO Core
12.4%
3.7%
14.5%
•
Fifth consecutive quarter of year-over-year double digit organic sales
growth •
All four end markets and all six product categories were up versus prior
year •
Prepared for signs of slowing in addressable markets, but have not seen that occur
yet Industrial
14.8%
2.0%
18.1%
•
10 of 16 Global Account industry verticals grew double digits through September
YTD •
Strong bidding activity continues; Global Accounts and Integrated Supply
opportunity pipeline now $2.1+ billion
•
Macro indicators point to continued industrial expansion and future capital
expenditures Construction
10.9%
1.8%
14.3%
•
Backlog up 19% over last year and up 19% sequentially since year-end
•
US construction sales up 10% over last year
•
Non-residential construction market appears to be stabilizing; recovery
expected to begin in the next 12 to 24 months
Utility
13.2%
11.2%
6.4%
•
Sales to Investor Owned Utility, Public Power and Utility Contractor customers
were up versus prior year
•
Increases
in
utility
spending
driven
by
increasing
power
demand,
high
voltage
and
alternative power projects
•
Management estimates that emergency response sales related to hurricane Irene were
approximately $5 million, or 2.5% of utility sales in Q3.
Commercial,
Institutional,
Government
(CIG)
7.5%
8.5%
8.4%
•
Government opportunities driven by infrastructure projects, security and data
communications
•
Stimulus
programs
continue
–
Rural
Broadband
and
certain
DOE
projects
are
beneficiaries
•
$400 million government and stimulus opportunity pipeline
Third Quarter 2011 End Market Comments
Core year-over-year and sequential quarterly sales
comparisons Note: YOY excludes TVC and RECO
results. YTD excludes Potelcom, TVC and RECO results.
Brews
acquisition
closed
on
October
3
rd
. |
 7
Key Financial Metrics
12/31/2010
9/30/2011
Liquidity
(1)
$338 million
$486 million
Full
Year
and
Q3
Free
Cash
Flow
(2)
$112 million
$41 million
Financial Leverage
(Par Value Debt with
Reported EBITDA)
3.9x
2.7x
($Millions)
Outstanding at
December 31, 2010
Outstanding at
September 30, 2011
Debt
Maturity Schedule
AR Securitization
(V)
$370
$370
2013
Inventory Revolver
(V)
$0
$0
2013
Real Estate Mortgage
(F)
$39
$38
2013
2017 Bonds
(F)
$150
$150
2017
2029 Convertible Bonds
(F)
$345
$345
2029 (No Put)
Other
(F)
$5
$4
N/A
Total Debt
$909
$907
Capital Structure
V= Variable Rate Debt
F= Fixed Rate Debt
1=
Asset-backed facilities total available plus invested
cash 2= Operating cash flow less capital expenditures
|
 8
Quarterly Proforma Financial Leverage
Target Leverage
2.0x –
3.5x
1.5
2.0
2.5
3.0
3.5
4.0
4.5
5.0 |
 9
Number of Work Days by Quarter
Q1
Q2
Q3
Q4
FY
2010
2011
63
63
64
64
64
64
64
63
255
254 |
 10
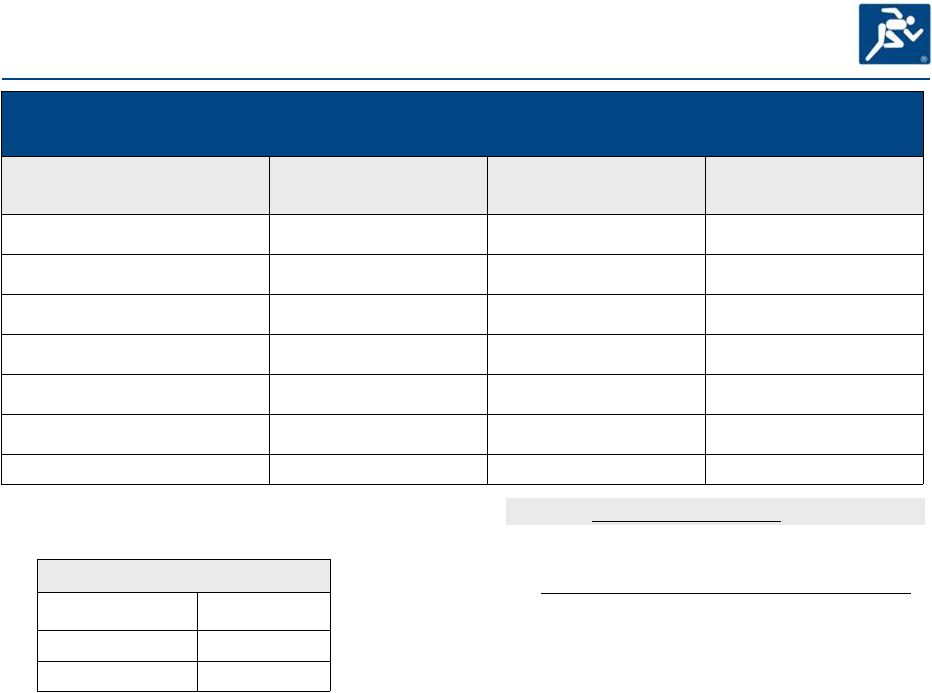
Convertible Debt and Non-cash Interest as of September 30, 2011
Convertible Debentures
(000s)
Maturity
Par Value
of Debt
Debt
Discount
Debt per
Balance
Sheet
2026
$
221
$
0
221
2029
$
344,965
$
(176,559)
$
168,406
Total
$
345,186
$
(176,559)
$
168,627
($ millions)
2010
2011
Convertible Debt
$3.7
$1.8
Amortization of Deferred Financing Fees
$2.0
$3.8
FIN 48
$0.6
$1.6
Total
$6.3
$7.2
Non-Cash Interest Expense (year-to-date)
GAAP vs. Non-GAAP
Debt Reconciliation
Non-Cash Interest Expense Schedule |
 11
Convertible Debt and SARs/Options EPS Dilution
Weighted Average Quarterly Share Count
Stock Price
Incremental Shares from
2029 Convertible Debt
(in millions)
Incremental Shares from
SARs/Option Awards
(in millions)
Total Diluted Share Count
(in millions)
4
$30.00
0.45
0.41
44.15
$40.00
3.33
0.74
47.36
Q3 2011 Average ($44.54)
4.21
0.98
48.50
$50.00
5.05
1.14
49.48
$60.00
6.20
1.36
50.85
$75.00
7.35
1.76
52.40
$100.00
8.50
2.14
53.93
2029 Convertible Debt Details
Conversion Price
$28.8656
Conversion Rate
34.6433
1
Underlying Shares
11,951,939
2
Footnotes:
2029
Convertible
Debenture
1
1000/28.8656
2
$345 million/28.8656
3
(Underlying Shares x Avg. Quarterly. Stock Price) minus $345 million
Avg. Quarterly Stock Price
4
Basic Share Count of 43.29 million shares
3 |
 12
Q4 2011 Outlook
Category
Q4 2011 Expectations
Sales Growth
Total growth expected to be at or above 14% year-over-year and down
3.5% sequentially due to seasonality and one less workday, assuming
stable pricing and foreign exchange rates
Gross Margins
Expected to be at or above 19.8%
Operating Margins
Expected to be at or above 5.2%
Effective Tax Rate
Expected
to
be
approximately
30%
-
31% |
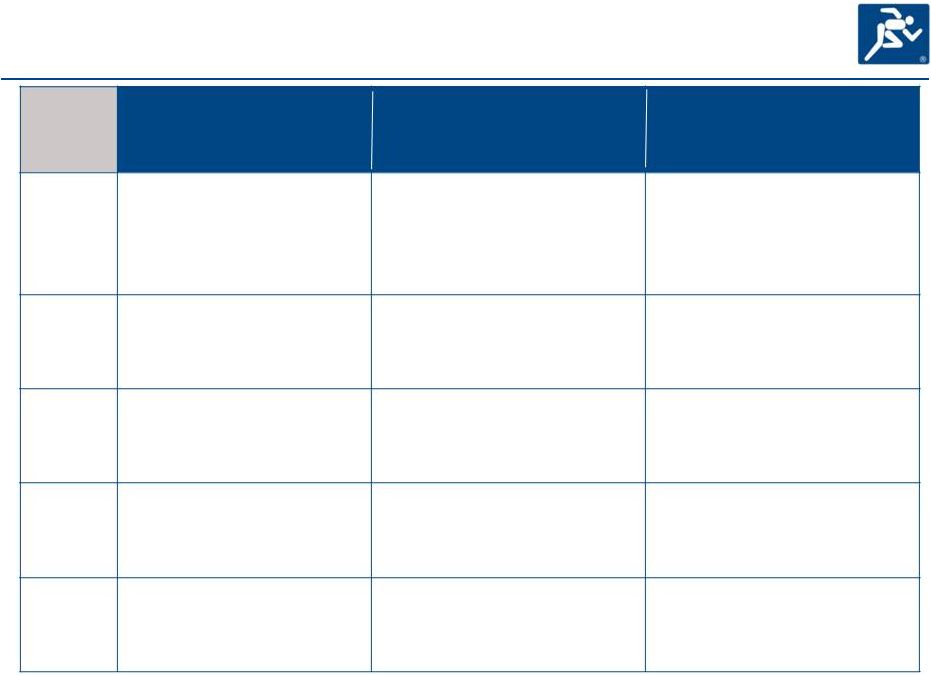
 2011
Full Year Outlook Expected to be at least
70% to 80% of net income
Category
2011 Expectations
(Revised April 21, 2011)
2011 Expectations
(Revised July 21, 2011)
2011 Expectations
(Revised October 20, 2011)
Sales
Growth
Expected to be at or above 17%
including acquisitions; Pricing
and F/X rates assumed
consistent with Q1 levels
Expected to be at or above 19%
including acquisitions; Pricing and
F/X rates assumed consistent with
first half levels
No change
Gross
Margins
Expected to be at or above
19.7%
Expected to be at or above 19.9%
No change
Operating
Margins
Expected to be at or above 4.9%
Expected to be at or above 5.1%
Expected to be at or above 5.2%
Effective
Tax Rate
Expected to be in the range of
29% to 30% levels
Expected to be in the range of
29% to 31%
Expected to be in the range of
29% to 30%
Cash Flow
Expected to be at least 80% of
net income
No change
13 |
