Attached files
| file | filename |
|---|---|
| 8-K - FORM 8-K - NEUSTAR INC | d242208d8k.htm |
| EX-2.1 - EXHIBIT 2.1 - NEUSTAR INC | d242208dex21.htm |
| EX-99.2 - EXHIBIT 99.2 - NEUSTAR INC | d242208dex992.htm |
| EX-99.3 - EXHIBIT 99.3 - NEUSTAR INC | d242208dex993.htm |
| EX-99.1 - EXHIBIT 99.1 - NEUSTAR INC | d242208dex991.htm |
 Supplemental Information
Earnings Report
October 11, 2011
Exhibit 99.4
NEUSTAR, INC. |
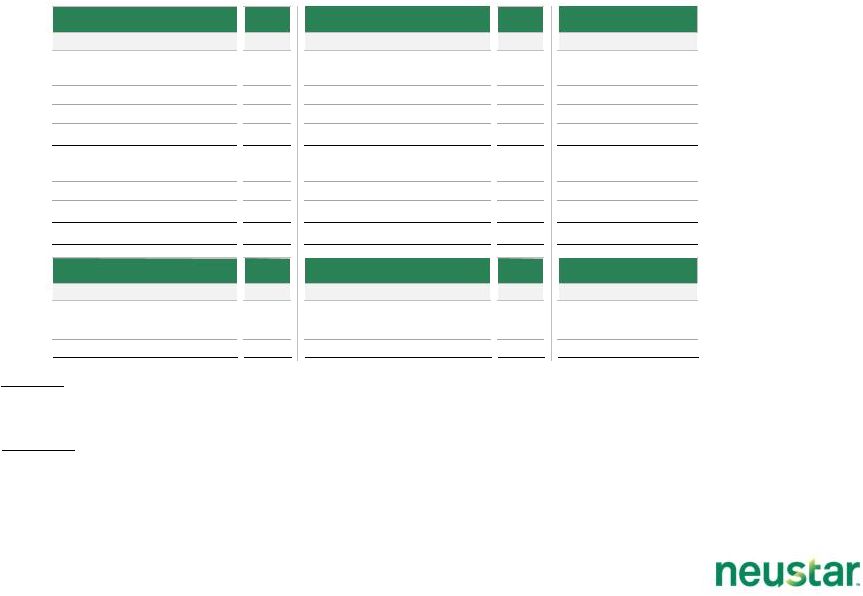 Statement of Operations
by Segments
2
Segment Revenue, $ in 000s
Full-Year
Full-Year
2009
Mar 31,
Jun 30,
Sep 30,
Dec 31,
2010
Mar 31,
Jun 30,
Sep 30,
Carrier Services
Numbering Services
329,513
90,701
90,927
89,592
90,593
361,813
99,426
98,813
99,924
Order Management Services
20,983
4,521
4,200
4,620
6,474
19,815
7,144
8,481
10,236
IP Services
6,843
2,410
2,633
2,445
2,646
10,134
3,045
3,540
3,995
Total Carrier Services revenue
357,339
97,632
97,760
96,657
99,713
391,762
109,615
110,834
114,155
Enterprise Services
Internet Infrastructure Services (IIS)
55,631
15,448
15,582
17,260
20,823
69,113
20,404
20,117
20,484
Registry Services
54,283
13,755
14,389
15,521
16,326
59,991
16,076
16,732
17,858
Total Enterprise Services revenue
109,914
29,203
29,971
32,781
37,149
129,104
36,480
36,849
38,342
Total consolidated revenue
467,253
126,835
127,731
129,438
136,862
520,866
146,095
147,683
152,497
Segment contribution, $ in 000s
Full-Year
Full-Year
2009
Mar 31,
Jun 30,
Sep 30,
Dec 31,
2010
Mar 31,
Jun 30,
Sep 30,
Carrier Services
317,070
87,227
87,999
86,561
90,530
352,317
96,579
97,570
99,302
Enterprise Services
46,130
12,788
13,261
15,733
17,502
59,284
15,651
15,418
16,551
Total segment contribution
363,200
100,015
101,260
102,294
108,032
411,601
112,230
112,988
115,853
2011 Quarter Ended,
2011 Quarter Ended,
2010 Quarter Ended,
2010 Quarter Ended,
Carrier Services:
Numbering Services – We operate and
maintain authoritative databases for telephone number resources utilized by our carrier customers and manage the telephone number lifecycle. The services utilizing these
dat include our
contracts to provide NPAC Services in the United States and Canada, International LNP Services (Taiwan and Brazil), Number Administration and Statements of Work (SOW) related to NPAC Services.
Order Management Services
–
Our Order Management Services (OMS) permit carrier customers, through a
single interface, to exchange essential operating data with multiple carriers in order to provision services.
IP Services – We provide scalable IP
services to carriers which allow them to manage access for the routing of IP communications.
Enterprise Services:
Internet Infrastructure Services – We provide a suite of
domain name systems (DNS) services to our enterprise customers built on a global directory platform. These services include Managed DNS, Monitoring and
Load Testing, and IP Geolocation.
Registry Services – We operate the
authoritative registries for certain Internet domain names and operate the authoritative U.S. Common Short Code (CSC) registry on behalf of wireless carriers in the United States.
services
include the registry services for .biz, .us, .co, .tel and .travel domain names, as well as the registry for U.S. Common Short Codes.
Note: Segment contribution excludes certain unallocated costs
within the following expense classifications: cost of revenue, sales and marketing, research and development, and general and administrative. In
addition, depreciation and amortization, restructuring charges and
impairment of long-lived assets are excluded from segment contribution. Such unallocated costs totaled $49.0 million and $57.8 million for the three
months ended September 30, 2010 and 2011, respectively, and totaled
$150.0 million and $171.4 million for the nine months ended September 30, 2010 and 2011, respectively.
We operate and maintain authoritative databases for telephone number
resources utilized by our carrier customers and manage the telephone number lifecycle. The services utilizing these databases
We provide scalable IP services to carriers which allow them to manage
access for the routing of IP communications. We provide a suite
of domain name systems (DNS) services to our enterprise customers built on a global directory platform. These services include Managed DNS, Monitoring and
Load
We operate the authoritative registries for certain Internet domain
names and operate the authoritative U.S. Common Short Code (CSC) registry on behalf of wireless carriers in the United States.
These
Our Order Management Services (OMS) permit carrier customers, through a
single interface, to exchange essential operating data with multiple carriers in order to provision services. |
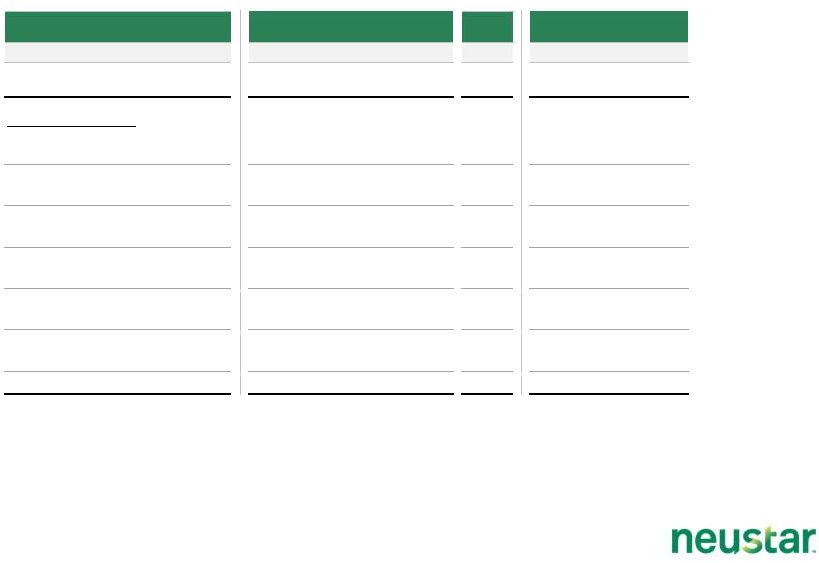
 Key
Performance Metrics by Revenue Categories
3
Metrics
Full-Year
Revenue category
Mar 31,
Jun 30,
Sep 30,
Dec 31,
2010
Mar 31,
Jun 30,
Sep 30,
Carrier Services
NPAC Services transactions (in thousands)
96,063
106,494
112,169
127,018
441,744
131,278
130,131
117,792
Functionality enhancements NPAC SOWs ($ in 000s)
1,593
1,007
708
1,405
4,713
-
-
-
Enterprise Services
Functionality enhancements IIS's SOWs ($ in 000s)
875
805
966
1,411
4,057
966
161
-
IIS queries (in billions)
1,115
1,159
1,231
1,184
4,689
1,090
881
962
IIS new customers
242
234
286
315
1,077
287
306
242
IIS upgrades
300
337
339
296
1,272
321
311
318
Registry -
domain names under management (in thousands)
4,112
4,142
4,625
4,774
4,774
5,143
5,310
5,403
CSC -
codes under management
3,203
3,570
3,719
3,876
3,876
4,103
4,256
4,370
2010 Quarter Ended,
2011 Quarter Ended, |
 Expense
by Cost by Quarter and as a Percentage of Revenue
4
Full-Year
Mar 31,
Jun 30,
Sep 30,
Dec 31,
2010
Mar 31,
Jun 30,
Sep 30,
Revenue ($ in 000s)
126,835
127,731
129,438
136,862
520,866
146,095
147,683
152,497
Expense by type ($ in 000s)
Cost of revenue (excl. depreciation & amortization)
27,016
26,988
27,574
29,704
111,282
31,052
31,417
34,194
% of Revenue
21%
21%
21%
22%
21%
21%
21%
22%
Sales and marketing
22,160
21,204
21,322
21,677
86,363
24,939
26,267
25,069
% of Revenue
17%
17%
16%
16%
17%
17%
18%
16%
Research and development
4,021
3,108
3,519
3,132
13,780
3,996
3,441
3,746
% of Revenue
3%
2%
3%
2%
3%
3%
2%
2%
General and administrative
17,635
14,584
15,865
17,412
65,496
20,215
21,949
20,960
% of Revenue
14%
11%
12%
13%
13%
14%
15%
14%
Depreciation & amortization
7,801
7,769
8,255
9,036
32,861
9,146
9,386
10,486
% of Revenue
6%
6%
6%
7%
6%
6%
6%
7%
Restructuring charges (recoveries)
1,235
771
(417)
3,772
5,361
432
(12)
(33)
% of Revenue
1%
1%
0%
3%
1%
0%
0%
0%
Total operating expense
79,868
74,424
76,118
84,733
315,143
89,780
92,448
94,422
2010 Quarter Ended,
2011 Quarter Ended, |
 Expense
Details Other Details and Headcount
5
Stock-based compensation by type ($ in 000s)
Full-Year
Mar 31,
Jun 30,
Sep 30,
Dec 31,
2010
Mar 31,
Jun 30,
Sep 30,
Cost of revenue
513
655
635
510
2,313
476
616
780
Sales and marketing
1,171
1,370
1,285
1,245
5,071
1,726
1,989
1,907
Research and development
152
246
263
227
888
335
312
345
General and administrative
1,748
2,447
2,526
2,052
8,773
3,479
3,083
3,428
Total stock-based compensation expense
3,584
4,718
4,709
4,034
17,045
6,016
6,000
6,460
Amortization of intangibles ($ in 000s)
1,054
1,015
1,082
1,602
4,753
1,129
1,110
1,716
Headcount by type
Year-End
Mar 31,
Jun 30,
Sep 30,
Dec 31,
2010
Mar 31,
Jun 30,
Sep 30,
Cost of revenue
386
368
358
392
392
385
390
430
Sales and marketing
292
279
295
297
297
300
306
327
Research and development
81
81
84
82
82
83
78
77
General and administrative
176
181
187
193
193
199
200
200
Total headcount
935
909
924
964
964
967
974
1,034
2010 Quarter Ended,
2010 Quarter Ended,
2011 Quarter Ended,
2011 Quarter Ended, |
 Reconciliation of Segment Contribution
6
$ in 000s
Full-Year
Full-Year
2009
Mar 31,
Jun 30,
Sep 30,
Dec 31,
2010
Mar 31,
Jun 30,
Sep 30,
Segment contribution
Carrier Services
317,070
87,227
87,999
86,561
90,530
352,317
96,579
97,570
99,302
Enterprise Services
46,130
12,788
13,261
15,733
17,502
59,284
15,651
15,418
16,551
Total segment contribution
363,200
100,015
101,260
102,294
108,032
411,601
112,230
112,988
115,853
Indirect operating expenses:
Cost of revenue (excl. depreciation & amortization)
66,080
18,672
18,325
18,724
19,969
75,690
19,627
19,742
20,424
Sales and marketing
15,269
4,539
4,148
3,736
3,922
16,345
3,825
4,617
3,584
Research and development
10,644
3,505
2,667
3,119
2,580
11,871
3,598
2,912
3,575
General and administrative
50,651
17,296
14,273
15,557
16,624
63,750
19,287
21,108
19,742
Depreciation and amortization
29,852
7,801
7,769
8,255
9,036
32,861
9,146
9,386
10,486
Restructuring charges (recoveries)
974
1,235
771
(417)
3,772
5,361
432
(12)
(33)
Consolidated income from operations
189,730
46,967
53,307
53,320
52,129
205,723
56,315
55,235
58,075
2010 Quarter Ended,
2011 Quarter Ended,
RECONCILIATION OF NON-GAAP FINANCIAL MEASURE Neustar reports its results in
accordance with U.S. generally accepted accounting principles (GAAP). Throughout this document, Neustar is providing certain non-GAAP
financial measures. Neustar cautions investors that the non-GAAP financial measures
presented are intended to supplement Neustar’s GAAP results and are not a substitute for
such results. Additionally, the non-GAAP financial measures used by Neustar may differ from the non-GAAP financial measures used by other companies.
|
 Income
Statement of Operations 7
Note:
$ in 000s, except per share amounts
Full-Year
Full-Year
2009
Mar 31,
Jun 30,
Sep 30,
Dec 31,
2010
Mar 31,
Jun 30,
Sep 30,
Revenue:
Carrier Services
357,339
97,632
97,760
96,657
99,713
391,762
109,615
110,834
114,155
Enterprise Services
109,914
29,203
29,971
32,781
37,149
129,104
36,480
36,849
38,342
Total revenue
467,253
126,835
127,731
129,438
136,862
520,866
146,095
147,683
152,497
Operating expense:
Cost of revenue (excl. depreciation & amortization)
99,436
27,016
26,988
27,574
29,704
111,282
31,052
31,417
34,194
Sales and marketing
80,676
22,160
21,204
21,322
21,677
86,363
24,939
26,267
25,069
Research and development
14,094
4,021
3,108
3,519
3,132
13,780
3,996
3,441
3,746
General and administrative
52,491
17,635
14,584
15,865
17,412
65,496
20,215
21,949
20,960
Depreciation and amortization
29,852
7,801
7,769
8,255
9,036
32,861
9,146
9,386
10,486
Restructuring charges (recoveries)
974
1,235
771
(417)
3,772
5,361
432
(12)
(33)
Total operating expense
277,523
79,868
74,424
76,118
84,733
315,143
89,780
92,448
94,422
Income from operations
189,730
46,967
53,307
53,320
52,129
205,723
56,315
55,235
58,075
Other (expense) income:
Interest and other expense
(5,213)
(1,537)
(1,011)
(4,294)
(153)
(6,995)
(347)
(126)
(675)
Interest and other income
7,491
1,390
2,029
4,069
94
7,582
203
930
304
Income from continuing operations before income taxes
192,008
46,820
54,325
53,095
52,070
206,310
56,171
56,039
57,704
Provision for income taxes, continuing operations
76,498
18,497
21,798
21,275
20,712
82,282
22,706
22,423
19,931
Income from continuing operations
115,510
28,323
32,527
31,820
31,358
124,028
33,465
33,616
37,773
(Loss) income from discontinued operations, net of tax
(14,369)
(3,121)
(3,954)
(1,871)
(8,873)
(17,819)
38,510
(1,261)
-
Net income
101,141
25,202
28,573
29,949
22,485
106,209
71,975
32,355
37,773
Basic net income (loss) per common share:
Continuing operations
1.55
0.38
0.43
0.43
0.42
1.66
0.45
0.46
0.52
Discontinued operations
(0.19)
(0.04)
(0.05)
(0.03)
(0.12)
(0.24)
0.52
(0.02)
-
Basic net income per common share
1.36
0.34
0.38
0.40
0.30
1.42
0.97
0.44
0.52
Diluted net income (loss) per common share:
Continuing operations
1.53
0.37
0.42
0.42
0.42
1.63
0.45
0.45
0.51
Discontinued operations
(0.19)
(0.04)
(0.05)
(0.03)
(0.12)
(0.23)
0.51
(0.02)
-
Diluted net income per common share
1.34
0.33
0.37
0.39
0.30
1.40
0.96
0.43
0.51
Weighted average common shares outstanding:
Basic
74,301
74,613
74,997
74,808
73,804
74,555
73,938
73,807
73,237
Diluted
75,465
75,944
76,217
76,026
75,458
76,065
75,285
75,015
74,632
2010 Quarter Ended,
2011 Quarter Ended,
During the second quarter of 2011, the Company completed its exit from the Converged Messaging Services
business. The results of operations of the Company’s Converged Messaging Services
business have been reclassified as discontinued operations for all periods presented.
|