Attached files
| file | filename |
|---|---|
| 8-K - 8-K - RETAIL PROPERTIES OF AMERICA, INC. | a11-27684_18k.htm |
Exhibit 99.1
|
|
Annual Meeting of Stockholders October 11, 2011 1 |
|
|
Disclaimer Notice: This presentation may contain statistics and other data that may have been obtained from or compiled from information made available by third-party service providers. While we believe these sources to be reliable, accuracy and completeness of the information cannot be guaranteed. Unless otherwise noted herein, all the financial information contained in this presentation is presented as of June 30, 2011. Forward-Looking Statements: This presentation contains “forward-looking statements” within the meaning of the safe harbor from civil liability provided for such statements by the Private Securities Litigation Reform Act of 1995 (set forth in Section 27A of the Securities Act of 1933, as amended, and Section 21E of the Securities Exchange Act of 1934). In particular, statements pertaining to our capital resources, portfolio performance, dividend policy and results of operations contain forward-looking statements. Likewise, all our statements regarding anticipated growth in our portfolio from operations, acquisitions and anticipated market conditions, demographics and results of operations are forward-looking statements. Forward-looking statements involve numerous risks and uncertainties and you should not rely on them as predictions of future events. Forward-looking statements depend on assumptions, data or methods which may be incorrect or imprecise and we may not be able to realize them. We do not guarantee that the transactions and events described will happen as described (or that they will happen at all). You can identify forward-looking statements by the use of forward-looking terminology such as “believes,” “expects,” “may,” “will,” “should,” “seeks,” “approximately,” “intends,” “plans,” “estimates,” “contemplates,” “aims,” “continues,” “would” or “anticipates” or the negative of these words and phrases or similar words or phrases. You can also identify forward-looking statements by discussions of strategies, plans or intentions. The following factors, among others, could cause actual results and future events to differ materially from those set forth or contemplated in the forward-looking statements: the effect of general economic, business and financial conditions, and changes in our industry and changes in the real estate markets in particular; general volatility of the capital and credit markets and the market price of our common stock; changes in our business strategy; defaults on, early terminations of or non-renewal of leases by tenants; bankruptcy or insolvency of a major tenant or a significant number of smaller tenants; increased interest rates and operating costs; declining real estate valuations and impairment charges; availability, terms and deployment of capital; our failure to obtain necessary outside financing, including our senior secured revolving credit facility; decreased rental rates or increased vacancy rates; our failure to generate sufficient cash flows to service our outstanding indebtedness; difficulties in identifying properties to acquire and completing acquisitions; risks of real estate acquisitions, dispositions and redevelopment, including the cost of construction delays and cost overruns; our failure to successfully operate acquired properties and operations; our failure to successfully redevelop properties; impact of changes in governmental regulations, tax law and rates and similar matters; our failure to maintain our qualification as a REIT; future terrorist attacks in the U.S.; environmental uncertainties and risks related to natural disasters; lack or insufficient amounts of insurance; financial market fluctuations; availability of and our ability to attract and retain qualified personnel; changes in real estate and zoning laws and increases in real property tax rates; and our ability to comply with the laws, rules and regulations applicable to companies and, in particular, public companies.; and those other risk factors set forth in our annual report for 2010 set forth on Form 10-K filed with the United States Securities and Exchange Commission. 2 |
|
|
Brenda G. Gujral Richard P. Imperiale Kenneth E. Masick Barbara A. Murphy Steven P. Grimes, President and Chief Executive Officer Niall J. Byrne, Executive Vice President, President of Property Management Shane C. Garrison, Executive Vice President, Chief Investment Officer Dennis K. Holland, Executive Vice President, General Counsel and Secretary James W. Kleifges, Executive Vice President, Chief Accounting Officer Gerald M. Gorski, Chairman of the Board Executive Officers Kenneth H. Beard Frank A. Catalano, Jr. Paul R. Gauvreau Steven P. Grimes Directors 3 Inland Western Directors and Executive Officers |
|
|
4 Corporate Overview & Strategy |

|
|
5 IWEST at a Glance One of the largest owners and operators of open-air shopping centers in the U.S. 265 consolidated retail properties with 35.5 million square feet (“SF”) of gross leasable area (“GLA”) in 35 states Average portfolio age of approximately 10 years provides for seasoned rent rolls without significant capital expenditure issues at the property level Over 90% of shopping centers anchored or shadow anchored by retailers that sell basic household goods or clothing1 Diversified tenant roster includes many national, investment-grade credit names Wal-Mart, The TJX Companies, Kohl’s, CVS, Home Depot, Stop & Shop, Ross Dress for Less, Bed Bath & Beyond, and Kroger 1,600 tenants – no one tenant represents more than 3.3% of annualized base rent (“ABR”) Proven management team with an average of over 23 years industry experience Note: Data as of June 30, 2011 1 Includes grocers, discount department stores, wholesale clubs or retailers that sell basic household goods or clothing |
|
|
6 Investment Thesis Investment highlights Large, diversified, high quality retail portfolio Diversified base of value-oriented retail tenants Demonstrated leasing and property management platform Experienced management team with proven track record Business and Growth Strategies Maximize cash flow through internal growth Recycle capital through disposition of non-core assets Pursue acquisitions of high quality retail properties Pursue strategic joint ventures to leverage management platform Maintain our development activity at sustainable levels |
|
|
7 Our 2010 Initiatives Complete the refinancing of $1.2 billion of maturing 2010 debt Execute new and renewal leases to achieve 90% leased rate including signed leases on the total consolidated operating portfolio Generate operating cash flows of $200 million Steadily increase shareholder distributions Position the company for growth |
|
|
8 What We Accomplished in 2010 Refinanced and repaid $1.1 billion in maturing debt Reduced total indebtedness by $353.7 million Executed 531 new and renewal leases for 4.2 million square feet Increased percent leased including signed leases 180 basis points to 90.2% at year-end on the total consolidated operating portfolio Generated $184 million in operating cash flows Increased quarterly distribution five consecutive periods Closed on eight partial sales of operating properties to our RioCan joint venture for $160 million with net proceeds of $49 million, resulting in the joint venture assuming $98 million of mortgage debt Sold eight non-core assets for $105 million, extinguishing $107 million in debt, for net proceeds of $21 million |
|
|
9 2011 Goals and Initiatives Complete the refinancing of 2011 maturing debt Execute new and renewal leases to achieve 90% leased rate including signed leases on the retail operating portfolio Generate operating cash flows of $175 million for the year Sell $125 million in non-core assets Position the company for future growth |
|
|
10 First-Half 2011 Accomplishments As of June 30, 2011, we have... Refinanced, repaid and extinguished $429.6 million in debt Signed 240 new and renewal leases totaling more than 2 million square feet Generated $85.0 million in operating cash flow for the six months ended June 30, 2011 Sold four operating properties for $58.8 million, generating net sales proceeds of $57.1 million Contributed $4.3 million to our RioCan joint venture, representing our share of the purchase price net of closing costs, for the acquisition of a multi-tenant retail property in Temple, TX Increased distribution for the seventh consecutive period to an annualized rate of $0.25 per share |
|
|
Financial Strength & Capacity 11 |

|
|
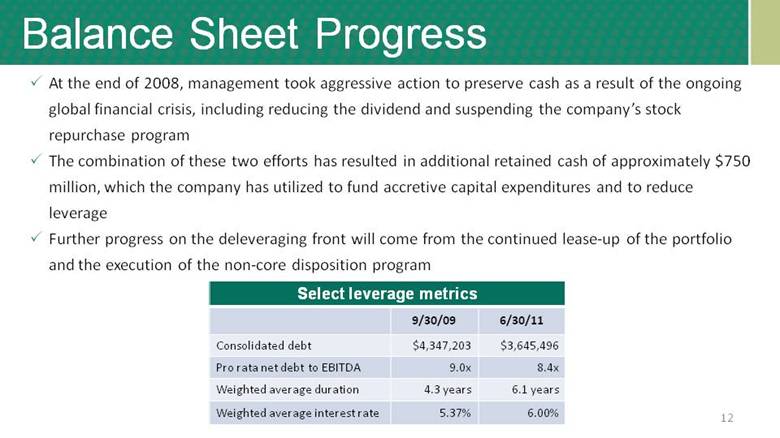
12 At the end of 2008, management took aggressive action to preserve cash as a result of the ongoing global financial crisis, including reducing the dividend and suspending the company’s stock repurchase program The combination of these two efforts has resulted in additional retained cash of approximately $750 million, which the company has utilized to fund accretive capital expenditures and to reduce leverage Further progress on the deleveraging front will come from the continued lease-up of the portfolio and the execution of the non-core disposition program Select leverage metrics 9/30/09 6/30/11 Consolidated debt $4,347,203 $3,645,496 Pro rata net debt to EBITDA 9.0x 8.4x Weighted average duration 4.3 years 6.1 years Weighted average interest rate 5.37% 6.00% Balance Sheet Progress |
|
|
13 Manageable near term debt maturities Includes principal amortization. Does not include any premiums or discounts of which $11,625 and $(2,248), net of accumulated amortization, respectively, is outstanding as of June 30, 2011. The 2011 column includes $63,869 of mortgages payable that had matured as of June 30, 2011. Staggered Debt Maturity Schedule $279,124 $487,738 $759,710 $240,057 $468,684 $1,400,806 $0 $100,000 $200,000 $300,000 $400,000 $500,000 $600,000 $700,000 $800,000 $900,000 $1,000,000 $1,100,000 $1,200,000 $1,300,000 $1,400,000 $1,500,000 2011 2012 2013 2014 2015 Thereafter Credit Facility Margin Payable Mezz Debt Mortgages Payable (1) |
|
|
Financial Update 14 |

|
|
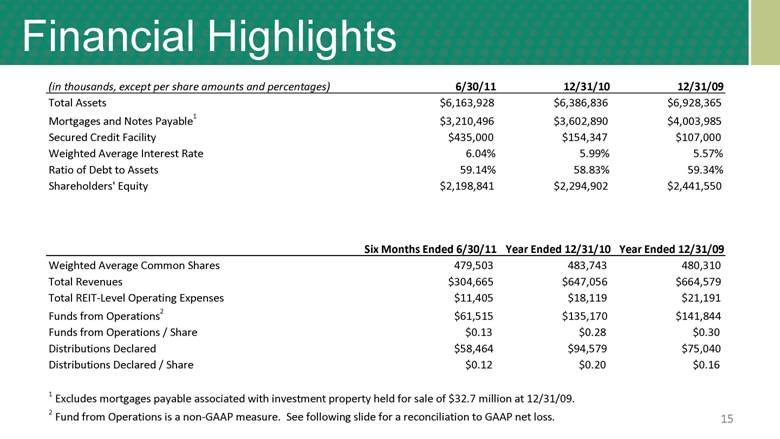
15 Financial Highlights (in thousands, except per share amounts and percentages) 6/30/11 12/31/10 12/31/09 Total Assets $6,163,928 $6,386,836 $6,928,365 Mortgages and Notes Payable 1 $3,210,496 $3,602,890 $4,003,985 Secured Credit Facility $435,000 $154,347 $107,000 Weighted Average Interest Rate 6.04% 5.99% 5.57% Ratio of Debt to Assets 59.14% 58.83% 59.34% Shareholders' Equity $2,198,841 $2,294,902 $2,441,550 Six Months Ended 6/30/11 Year Ended 12/31/10 Year Ended 12/31/09 Weighted Average Common Shares 479,503 483,743 480,310 Total Revenues $304,665 $647,056 $664,579 Total REIT-Level Operating Expenses $11,405 $18,119 $21,191 Funds from Operations 2 $61,515 $135,170 $141,844 Funds from Operations / Share $0.13 $0.28 $0.30 Distributions Declared $58,464 $94,579 $75,040 Distributions Declared / Share $0.12 $0.20 $0.16 1 Excludes mortgages payable associated with investment property held for sale of $32.7 million at 12/31/09. 2 Fund from Operations is a non-GAAP measure. See following slide for a reconciliation to GAAP net loss. |
|
|
16 FFO and Cash Flows From Operations (in thousands) Six Months Ended 6/30/11 Year Ended 12/31/10 Year Ended 12/31/09 Funds From Operations 1 $61,515 $135,170 $141,844 Adjustments, net 15,935 24,101 102,015 Funds From Operations, as adjusted 1 $77,450 $159,271 $243,859 Cash Flows From Operating Activities $85,011 $184,072 $249,837 Distributions Declared 58,464 94,579 75,040 Excess $26,547 $89,493 $174,797 1 Funds From Operations is a non-GAAP measure. Funds From Operations, as adjusted, is also a non-GAAP measure and is defined as Funds From Operations excluding the impact of provisions for impairment, and gains and losses from the early extinguishment of debt. The following table reconciles Funds From Operations and Funds From Operations, as adjusted to GAAP net loss. Six Months Ended 6/30/11 Year Ended 12/31/10 Year Ended 12/31/09 Net loss attributable to Company shareholders ($53,749) ($95,843) ($112,335) Add: Depreciation and amortization 129,836 267,500 279,361 Less: Gain on sales of investment properties (9,223) (24,465) (21,545) Noncontrolling interests' share of depreciation related to consolidated JVs (5,349) (12,022) (3,637) FFO $61,515 $135,170 $141,844 Add: Provision for impairment of investment properties 30,373 23,057 64,700 Loss on extinguishment of debt - 1,044 - Impairment of marketable securities - - 24,831 Impairment of notes receivable - - 17,322 Less: Gain on extinguishment of debt (14,438) - (4,838) FFO, as adjusted $77,450 $159,271 $243,859 |
|
|
17 Schedule of Principal Related Party Fees Fees Amount Comments Offering costs None Total of $457 million paid to date is equal to 8.7% of collected capital Mortgage servicing fees $282,000 $125 per loan serviced per month Mortgage brokerage fees $88,000 Loan brokerage fee of 0.2% Investment advisory fees $272,000 1.0% per annum (paid monthly) of aggregate fair value of assets invested in securities |
|
|
Property Quality & Diversification 18 |

|
|
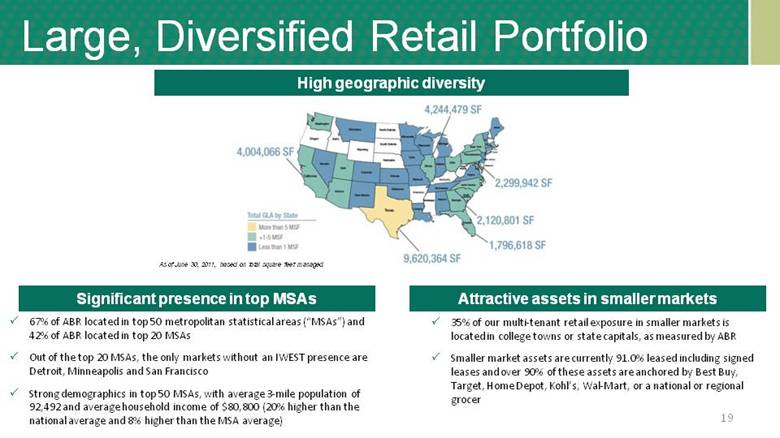
19 Large, Diversified Retail Portfolio High geographic diversity As of June 30, 2011, based on total square feet managed 67% of ABR located in top 50 metropolitan statistical areas (“MSAs”) and 42% of ABR located in top 20 MSAs Out of the top 20 MSAs, the only markets without an IWEST presence are Detroit, Minneapolis and San Francisco Strong demographics in top 50 MSAs, with average 3-mile population of 92,492 and average household income of $80,800 (20% higher than the national average and 8% higher than the MSA average) Significant presence in top MSAs 35% of our multi-tenant retail exposure in smaller markets is located in college towns or state capitals, as measured by ABR Smaller market assets are currently 91.0% leased including signed leases and over 90% of these assets are anchored by Best Buy, Target, Home Depot, Kohl’s, Wal-Mart, or a national or regional grocer Attractive assets in smaller markets |
|
|
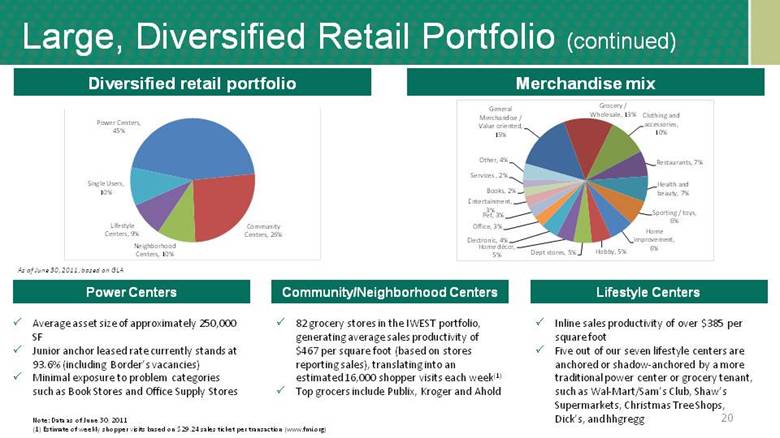
20 Large, Diversified Retail Portfolio (continued) As of June 30, 2011, based on GLA Diversified retail portfolio Community/Neighborhood Centers Power Centers Lifestyle Centers Average asset size of approximately 250,000 SF Junior anchor leased rate currently stands at 93.6% (including Border’s vacancies) Minimal exposure to problem categories such as Book Stores and Office Supply Stores 82 grocery stores in the IWEST portfolio, generating average sales productivity of $467 per square foot (based on stores reporting sales), translating into an estimated 16,000 shopper visits each week(1) Top grocers include Publix, Kroger and Ahold Inline sales productivity of over $385 per square foot Five out of our seven lifestyle centers are anchored or shadow-anchored by a more traditional power center or grocery tenant, such as Wal-Mart/Sam’s Club, Shaw’s Supermarkets, Christmas Tree Shops, Dick’s, and hhgregg Merchandise mix Note: Data as of June 30, 2011 (1) Estimate of weekly shopper visits based on $29.24 sales ticket per transaction (www.fmi.org) General Merchandise / Value oriented, 15% Grocery / Wholesale, 13% Clothing and accessories, 10% Restaurants, 7% Health and beauty, 7% Sporting / toys, 6% Home improvement, 6% Hobby, 5% Dept stores, 5% Home décor, 5% Electronic, 4% Office, 3% Pet, 3% Entertainment, 3% Books, 2% Services , 2% Other, 4% Power Centers, 45% Community Centers, 26% Neighborhood Centers, 10% Lifestyle Centers, 9% Single Users, 10% |
|
|
21 High Quality Retail Assets Data as of 6/30/2011; all GLA numbers in 000s square feet Community center - Worcester, MA GLA: 536 % leased incl. signed: 90.2% Community center - Newport News, VA GLA: 306 % leased incl. signed: 95.5% Lifestyle center - Salt Lake City, UT GLA: 625 % leased incl. signed: 93.3% Lifestyle center - Southlake, TX GLA: 840 % leased incl. signed: 86.3% Community center – Saratoga Springs, NY GLA: 438 % leased incl. signed: 99.7% Community center - Chicago, IL GLA: 261 % leased incl. signed: 95.8% Power center - Seattle, WA GLA: 303 % leased incl. signed: 97.3% Neighborhood center - Mt. Pleasant, SC GLA: 64 % leased incl. signed: 94.1% Southlake Town Square The Gateway Wilton Square Northgate North Brickyard Lincoln Plaza Jefferson Commons Shops at Park West |
|
|
Tenancy & Leasing Capabilities 22 |

|
|
23 7 of Top 10 Tenants are Investment Grade Credits Top 20 tenants represent 35.8% of retail ABR (1) The credit ratings are for the operating companies and not necessarily the entities with which we have entered into lease agreements (2) Represents retail GLA; GLA numbers in 000s square feet (3) ABR represents Annualized Base Rent (4) Represents the percentage of our retail annualized base rent as of June 30, 2011 Source: Credit Risk Monitor reports Rank Tenant Credit Ratings(1) # of Stores GLA(2) ABR(3) % of Retail ABR(4) Announced expansion plans (2012) Letter of intent / Active negotiations 1 Best Buy BBB-/Baa2 27 1,050 $14,270 3.3% 6-8 X 2 The TJX Companies, Inc. A/A3 37 1,090 10,611 2.5% 100 X 3 Rite Aid Store B-/Caa2 34 421 10,320 2.4% -- 4 Stop & Shop BBB/Baa3 10 479 10,007 2.3% 8 5 Ross Dress for Less BBB/NR 32 955 9,202 2.1% 55 X 6 Home Depot BBB+/Baa1 9 1,097 9,137 2.1% X 7 Bed Bath & Beyond, Inc. BBB/NR 26 710 9,029 2.1% 55 X 8 PetSmart BB/NR 30 643 8,629 2.0% 45 X 9 The Sports Authority - 17 723 8,423 2.0% 20 10 Kohl's BBB+/Baa1 15 1,154 8,071 1.9% 50 X 11 Publix - 16 635 6,724 1.6% X 12 Edwards Theaters - 2 219 6,558 1.5% 13 Office Depot - 22 458 6,106 1.4% 20 14 Dick's Sporting Goods - 10 531 5,985 1.4% 35 X 15 Wal-Mart Stores, Inc. AA/Aa2 5 861 5,876 1.4% 230 X 16 Pier 1 Imports B/B2 36 360 5,874 1.4% 40 X 17 Michaels B-/B3 23 530 5,757 1.2% 60 X 18 The Kroger Co. BBB/Baa2 13 550 4,784 1.1% 45 19 CVS BBB+/Baa2 15 185 4,756 1.1% 250-275 20 The Gap Inc. BB+/Baa3 25 401 4,641 1.0% 25 X Total 404 13,052 $154,760 35.8% |
|
|
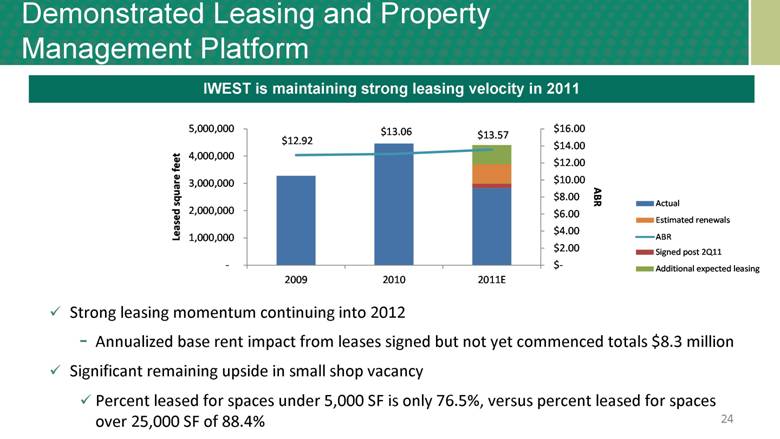
24 Demonstrated Leasing and Property Management Platform Strong leasing momentum continuing into 2012 Annualized base rent impact from leases signed but not yet commenced totals $8.3 million Significant remaining upside in small shop vacancy Percent leased for spaces under 5,000 SF is only 76.5%, versus percent leased for spaces over 25,000 SF of 88.4% IWEST is maintaining strong leasing velocity in 2011 $12.92 $13.06 $13.57 $- $2.00 $4.00 $6.00 $8.00 $10.00 $12.00 $14.00 $16.00 - 1,000,000 2,000,000 3,000,000 4,000,000 5,000,000 2009 2010 2011E ABR Leased square feet Actual Signed post 2Q11 Estimated renewals Additional expected leasing ABR |
|
|
25 Tenant focused organization with hands-on approach Network of key relationships with tenants and broker community Active management of tenant mix, diversification and lease terms Size, scale and experience provides competitive advantage 19 property management offices across the country Over 80 property management and senior leasing agents with average industry experience of 15 years Limited near-term lease expirations will allow leasing team to focus efforts on currently vacant space Source: Company filings, including month-to-month leases Average: 32.7% Demonstrated Leasing and Property Management Platform (continued) |
|
|
Circuit City Bankruptcy Vacated in March 2009. Linens ’n Things Bankruptcy Vacated at the end of 2008. Mervyn’s Bankruptcy Vacated at the end of 2008. Occupancy trough 26 Strong leasing volume driving occupancy increases 3.3 million square feet of GLA was returned via big box retailer bankruptcies during 2008/2009 Addressed 83.9% of vacated space, totaling 2.7 million SF 2.1 million SF leased, primarily to existing tenants such as Kohl’s, TJX Companies, Best Buy, hhgregg and Big Lots 0.2 million SF sold 0.5 million SF in negotiations Demonstrated Leasing and Property Management Platform (continued) |
|
|
Capital Recycling Capabilities 27 |

|
|
28 Active Capital Recycling Program Active capital recycling program will continue to improve the quality of the net operating income (“NOI”) stream Management is committed to the opportunistic disposition of non-core and free-standing triple net retail properties, in addition to multi-tenant retail assets where management believes value has been maximized Over $600 million of dispositions since year-end 2008 Significantly reduced exposure to low growth assets in secondary markets Management has a target of $125 million of non-core dispositions in 2011 and has completed over $110 million to date Net proceeds from dispositions have been redeployed into attractive acquisitions or have been used for deleveraging purposes |
|
|
29 PetSmart Distribution Center Disposition Despite IWEST’s decision in 2009 to actively dispose of non-core assets such as the PetSmart Distribution Center, PetSmart’s remaining lease duration of only 6 years as of December 31, 2009, made the asset unmarketable IWEST worked to successfully extend PetSmart’s lease duration to 11 years, as of June 30, 2011 Utilizing the Company’s deep relationships in the marketplace, management was able to quickly identify the optimal buyer for this unique asset and the Company ultimately booked a gain on the sale of an asset acquired in 2005 Key statistics Location: Ottawa, IL GLA: 1,000,350 Purchase price: $42 million Sale price: $49 million Cap rate: 6.9% |
|
|
Closing 30 |

|
|
31 Key Takeaways Our business is stabilized Opportunities for growth remain in the portfolio Management is committed to capture growth wherever and however possible |