Attached files
| file | filename |
|---|---|
| 8-K - FORM 8-K - PIONEER ENERGY SERVICES CORP | d239125d8k.htm |
 Johnson Rice Energy
Conference
October 5-6, 2011
Exhibit 99.1
Well Positioned for Unconventional Plays |
 2
Forward-looking Statements
This presentation contains various forward-looking statements and information
that are based on
management’s current
expectations and assumptions about future events. Forward-looking statements
are generally accompanied by words such as
“estimate,”
“project,” “predict,”
“expect,”
“anticipate,”
“plan,
” “intend,” “seek,” “will,” “should,” “goal” and other words that convey the uncertainty of future
events and outcomes. Forward-looking information includes, among other matters,
statements regarding the
Company’s anticipated growth, quality of assets, rig utilization rate, capital spending by oil
and gas companies, production rates, the Company's growth strategy, and the Company's
international operations. Although the Company believes that the
expectations and assumptions reflected in such forward-looking statements
are reasonable, it can give no assurance that such expectations and
assumptions will prove to have been correct. Such statements are subject to certain
risks, uncertainties and assumptions, including, among others: general and
regional economic conditions and industry trends; the continued strength of
the contract land drilling industry in the geographic areas where the Company
operates; decisions about onshore exploration and development projects to be made by oil
and gas companies; the highly competitive nature of the contract land drilling
business; the Company’s
future financial performance, including availability, terms and deployment of
capital; the continued availability of qualified personnel; changes in
governmental regulations, including those relating to the environment; the
political, economic and other uncertainties encountered in the Company's
international operations and other risks, contingencies and uncertainties, most of
which are difficult to predict and many of which are beyond our control.
Should one or more of these risks, contingencies or uncertainties materialize,
or should underlying assumptions prove incorrect, actual results may vary
materially from those expected. Many of these factors have been discussed in
more detail in the Company's annual report on Form 10-K for the fiscal
year ended December 31, 2010. Unpredictable or unknown factors that the
Company has not discussed in this presentation or in its filings with the
Securities and Exchange Commission could also have material adverse effects on actual
results of matters that are the subject of the forward-looking
statements. All forward-looking statements speak only as the date on
which they are made and the Company undertakes no duty to update or revise any
forward-looking statements. We advise our shareholders to use caution and common
sense when considering our forward-looking statements. |
 Overview
Ticker Symbol:
PDC
Market Cap:
$402.2 million (Sep 29, 2011)
Stock price:
$7.42 (Sep 29, 2011)
Average 3-month daily
trading volume:
1,096,440 shares
Public float:
Approximately 61 million shares
Employees:
2,877
Headquarters:
San Antonio, Texas
Website:
www.pioneerdrlg.com
3 |
 4
Pioneer Drilling Overview |
 Pioneer Drilling Company
5
71 Drilling Rigs in 8 Locations
Approximately 9th largest contract driller
84 Well Service Rigs operating in 12 Locations
Approximately 7th largest well service
provider
99 Wireline Units in 21 Locations
81 cased hole
18 open hole |
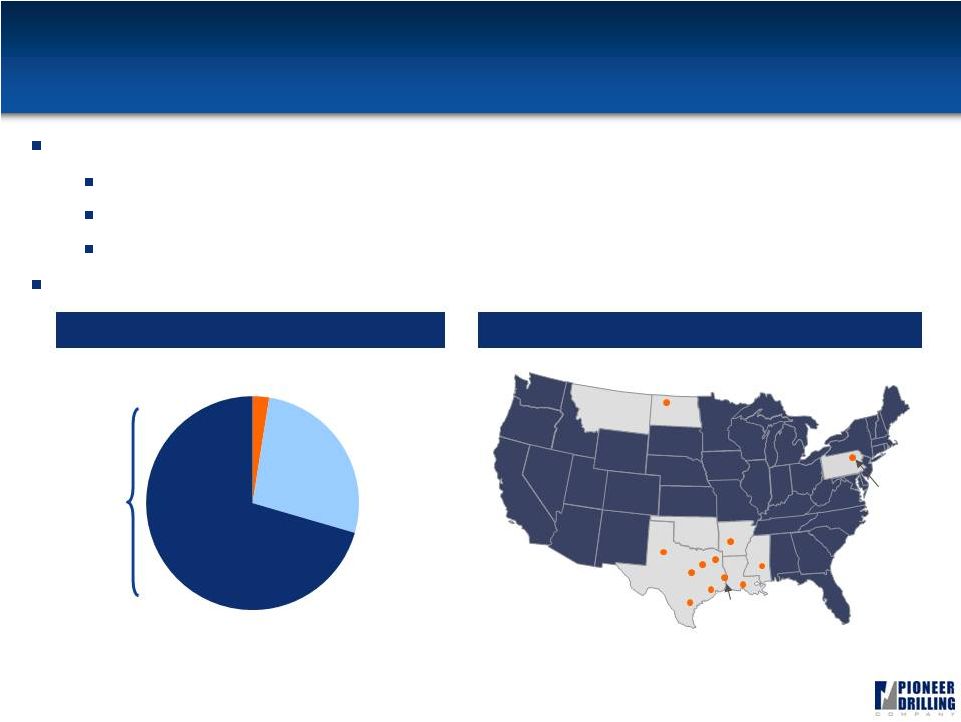
 6
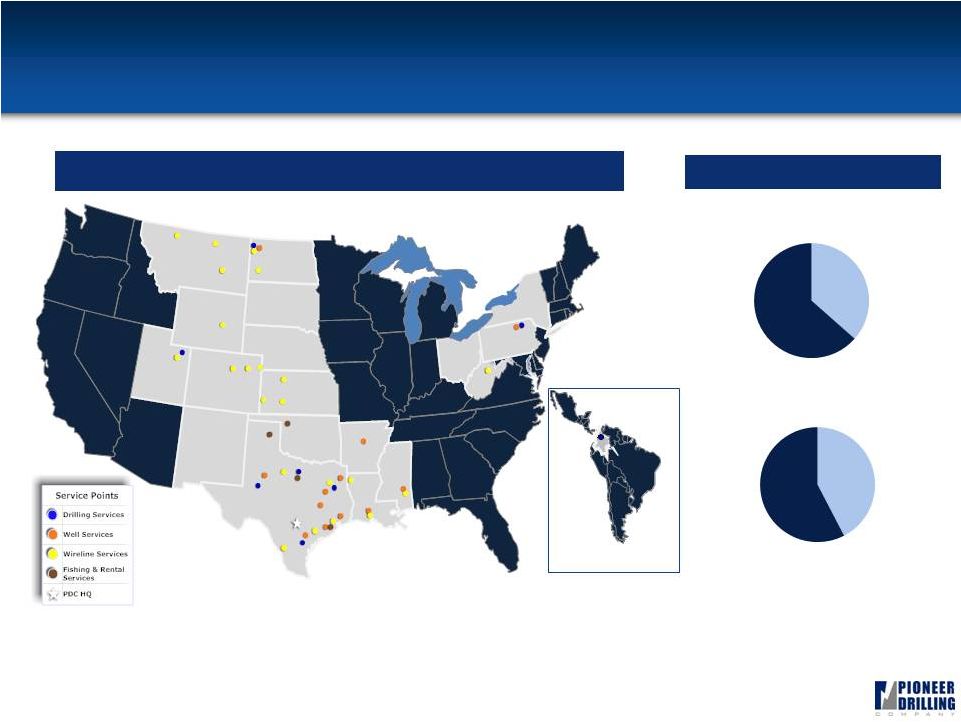
Leading Service Provider Across Well Life Cycle
Total Revenue: $609 million
Total Margin: $214 million
Colombia
Services
Production
Services
Services
Production
Services
Diversified Business and Geography Mix
TTM June 30, 2011
63%
37%
58%
42%
Drilling
Drilling |
 Investment Considerations
Continued organic growth opportunities in core businesses: land drilling,
well services and wireline
Signed six new-build drilling term contracts for delivery in the first and
second quarters of 2012
Adding 14 well service rigs in 2011
Adding 19 wireline units in 2011
Currently have 14 drilling rigs operating in the West Texas division with
expectations to have 16 to 18 rigs operating by the end of 2011
Strong contract backlog
41 rigs backed by term contracts (approximately 73% of working rigs)
Enhanced balance sheet flexibility
Equity offering of 6,900,000 shares priced on July 14, 2011, netting $94.3MM
Recently amended and restated credit agreement for $250mm, 5-yr, senior secured
credit facility maturing in 2016
7 |
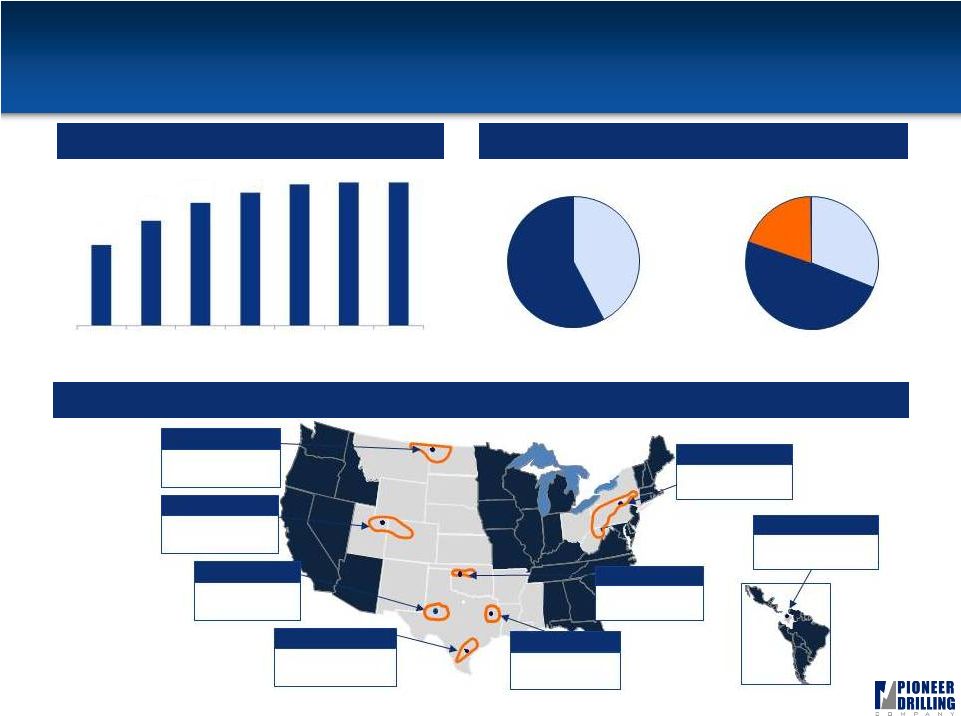 High Quality Drilling Fleet,
Focused on Unconventional Plays
8
Historical Fleet Growth
Drilling Locations
Current Rig Fleet Mix
Note: Rig counts for 2004, 2005 and 2006 represent fiscal years ended March 31,
2004, 2005 and 2006 while 2007, 2008 and 2009 represent fiscal years ended
December 31, 2007, 2008 and 2009. *Cold-stacked
15 rigs
South Texas
Electric
Mechanical
550-999
HP
1,000-1,499
HP
1,500-2,000
HP
49%
31%
20%
58%
42%
40
52
61
70
71
66
71
2004
2005
2006
2007
2008
2009
2010
9 rigs
4 rigs
8 rigs
7 rigs
9 rigs
3 rigs
16 rigs
Oklahoma*
Colombia
Appalachia
West Texas
Utah
North Dakota
East Texas |
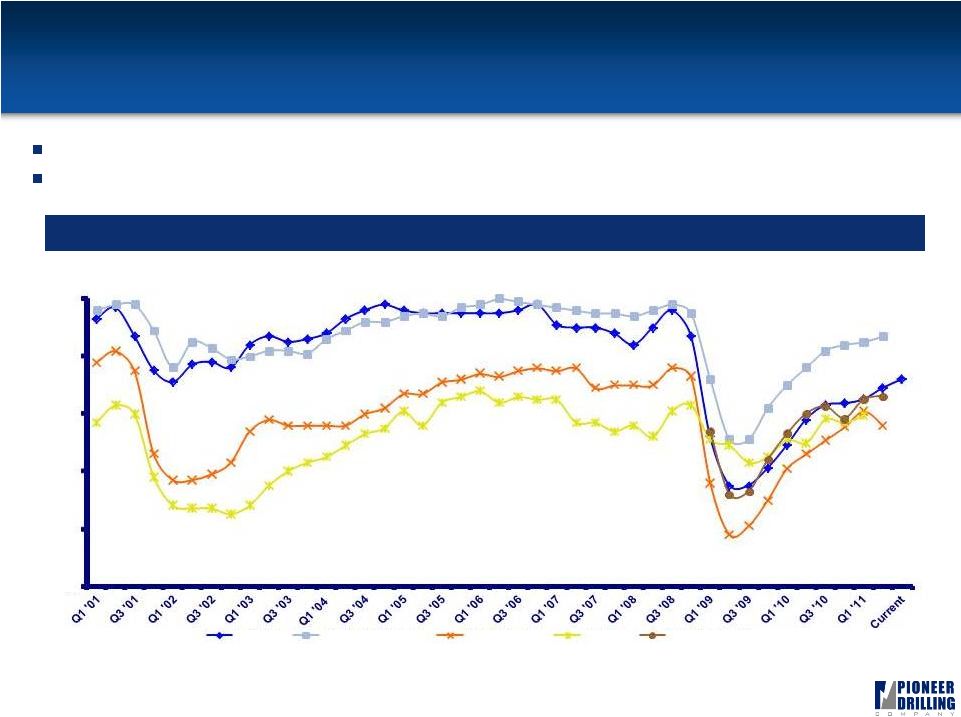 9
Strong Utilization Through the Cycles
Source: Helmerich & Payne, Patterson-UTI, & Precision Drilling
data consists of U.S. domestic utilization rates derived from Form 10-K, Form 10-Q reports, & press releases. Nabors utilization rates for worldwide land fleet obtained from
public documents and industry analysts. Helmerich & Payne Q3 2010 only
estimated based on analyst reports. Pioneer Drilling utilization rates include Colombian operations beginning Q3 2007.
(1) PDC utilization as of August 4, 2011.
Averaged 85% utilization through cycles since 2001, comparing favorably to
peers Utilization
has
rebounded
from
a
monthly
low
of
33%
in
June
2009
to
72%
currently
(1)
Comparable Utilization Rates
0%
20%
40%
60%
80%
100%
Pioneer
Helmerich & Payne
Patterson-UTI
Nabors
Precision (U.S.) |
 10
Modern, Efficient Drilling Fleet
35 rigs working with top drives (49%
of fleet)
16 walking/skidding systems on rigs
36 pairs of 1,300/1,600 HP mud pumps
66% of rigs have iron roughnecks
42% of rigs are electric
50 Series Rig |
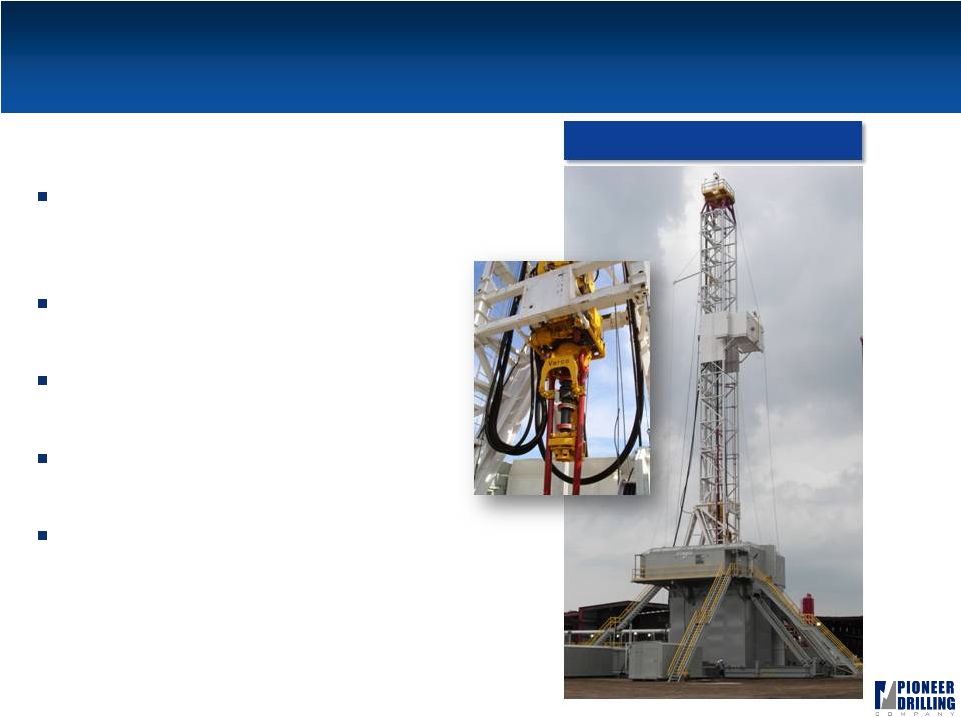
 New-Builds Driving Visible Organic Growth
11
Six state-of-the-art AC rigs under construction
Rigs secured with long term contracts up to four
years
Attractive rates of return (20%+ IRR)
Ideal for drilling complex shales such as Bakken,
Eagle Ford and Marcellus |
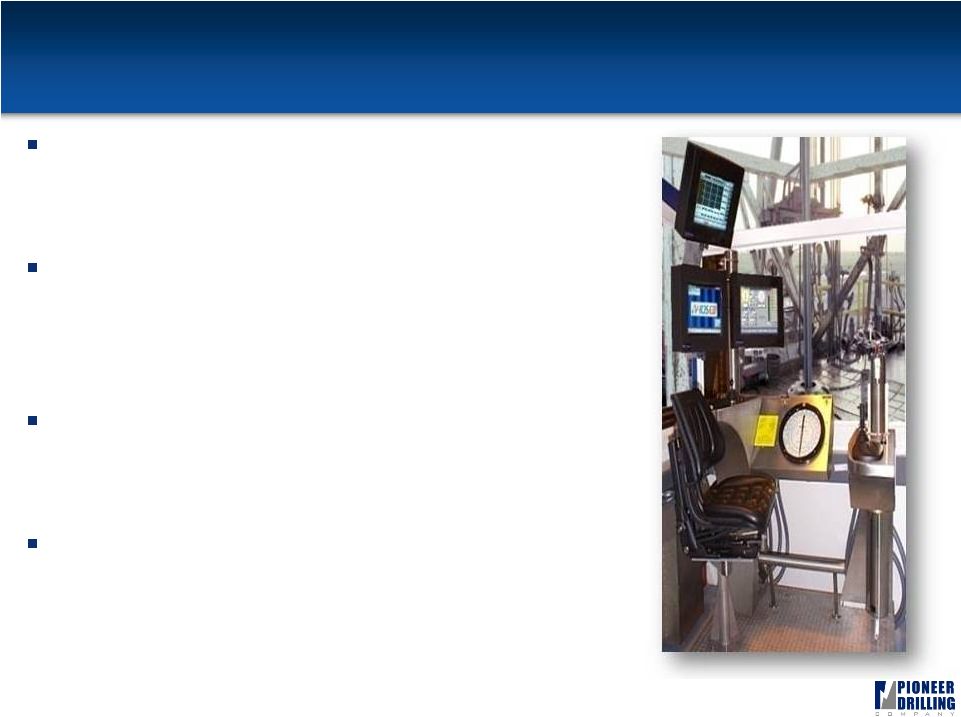
 New-Build Features
12
State-of-the-art 550K and 750K sub & mast AC new-
builds
Integrated 500 ton top drives in mast section for
faster rig up and rig down
Crane free rig up / rig down design
30 loads on base rig for fast moves
BOP handling systems
Automatic catwalk
1,600 HP and 2,000 HP mud pumps
Latest features in rig control software
Ability to drill multi-well single-row pads and walk
easily between wells with above ground heads |
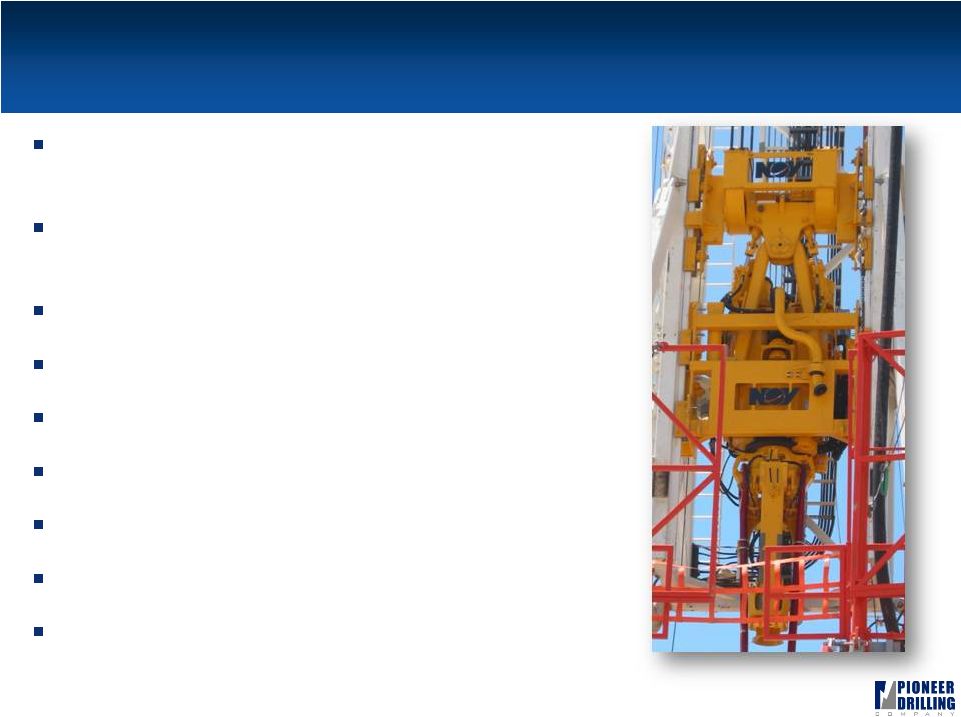
 New-Build Pad Drilling Capability
13
BOP Wrangler
Pin On Walking System
One Walker Per Corner
Accumulator/HPU Skid
Pin On Walking System
Can walk in either direction or spin the rig
Can walk with full set back of drill pipes in mast
Accumulator & HPU walks with sub
BOP handling system walks with sub |
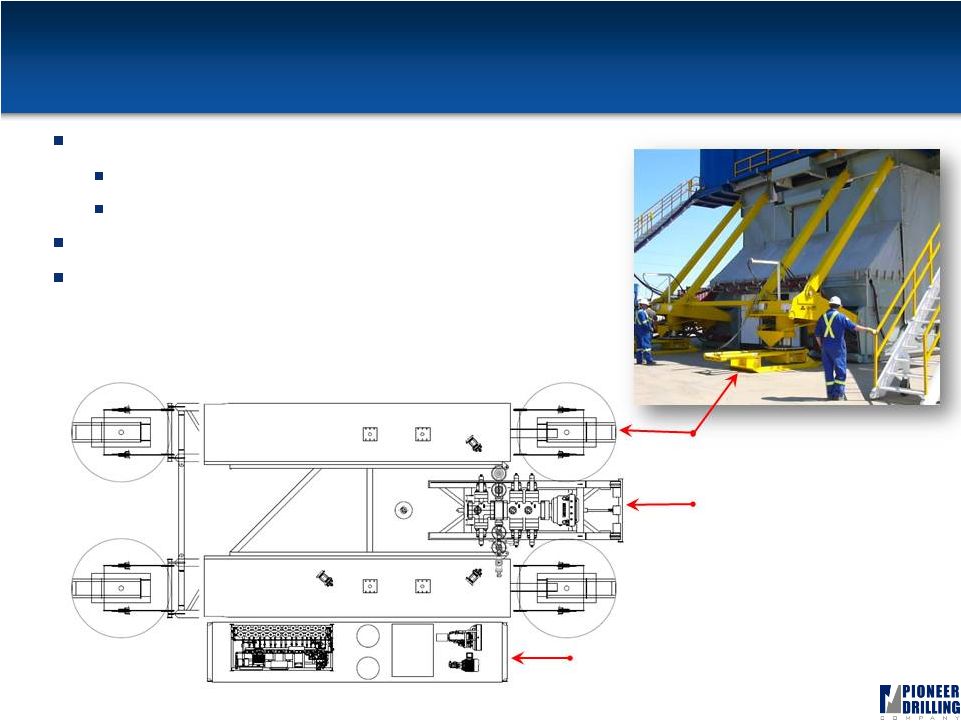
 New-Build Advanced Electrical System
14
Festoon System to Manage Electrical Supply to Substructure
|
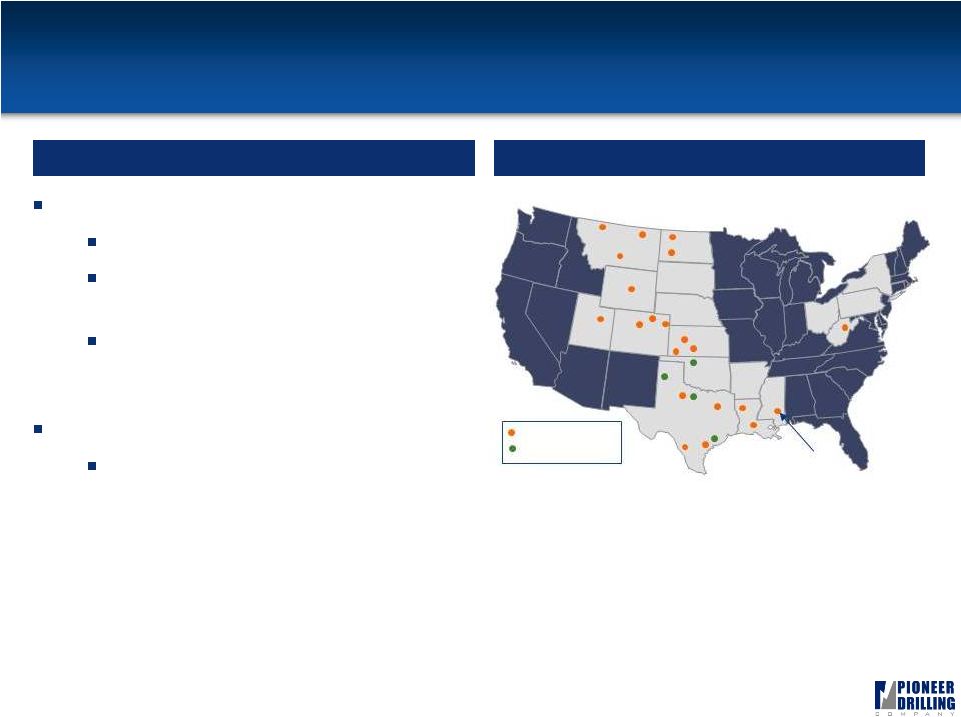
 Premium Well Servicing Fleet,
Established Positions in Emerging Shale Plays
15
One
of
the
newest
and
most
highly
capable
well
service
fleets
in
the
industry
Seventy-five 550 HP rigs
Eight 600 HP rigs
One 400 HP rig
Established in the Bakken, Fayetteville, Haynesville and Eagle Ford shales
Average year in service: 2007
70%
2007 or
newer
Williston
Bryan
Palestine
Longview
New Iberia
El Campo
Liberty
Kenedy
Greenbrier
Laurel
2005-2006
2002-2004
New
Milford
Snyder
Well Service Fleet Age
Well Service Locations
27%
2% |
 Wireline and Fishing & Rental Overview
16
Wireline Services
Open and cased-hole wireline services
Fleet of 99 wireline units has an
average age of less than 6 years
Established in the Bakken, Barnett,
Marcellus, Haynesville, Niobrara, and
Eagle Ford shales
Fishing & Rental Services
Range of specialized services and
equipment that are utilized on a non-
routine basis for both drilling and well
servicing operations
Overview
Wireline Locations
Williston
Dickinson
Cut Bank
Billings
Havre
Tyler
Bossier City
Broussard
Graham
Roosevelt
Pratt
Liberal
Hays
Casper
Buckhannon
Ft. Morgan
Brighton
Wray
Woodward
Pampa
Springtown
El Campo
Wireline
Fishing & Rental
Laredo
Laurel
Victoria |
 17
Industry and Market Conditions |
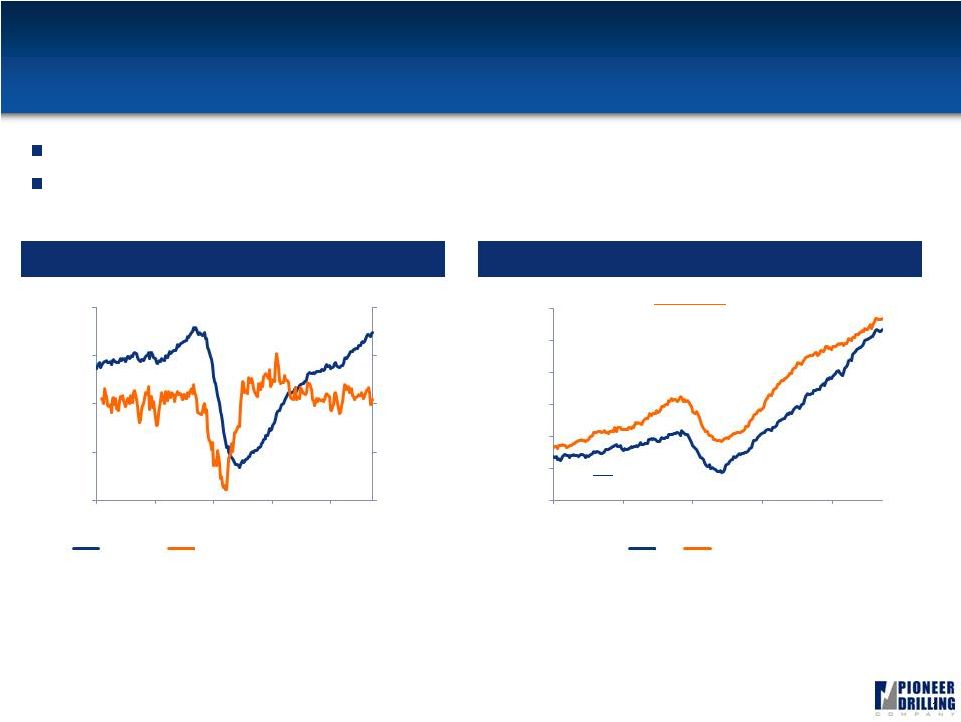 Resurgence in U.S. Land Rig Count
1
18
Steady rig count improvement since the second half of 2009
Horizontal and oil rig counts have surpassed Fall 2008 peak levels
Land Rig Count
Horizontal & Oil Rig Count
Source: Baker Hughes
Source: Baker Hughes.
Oil
Fall ’08 Peak: 442
September 23, 2011: 1,071
Horizontal
Fall ’08 Peak: 650
September 23, 2011: 1,140
0.0%
2.5%
5.0%
600
1,000
1,400
1,800
2,200
Jan-07
Jan-08
Jan-09
Jan-10
Jan-11
Land Rigs
BHI Rolling 4-Week Avg. Weekly Change
0
200
400
600
800
1,000
1,200
Jan-07
Jan-08
Jan-09
Jan-10
Jan-11
Oil
Horizontal
-
5.0%
-
2.5% |
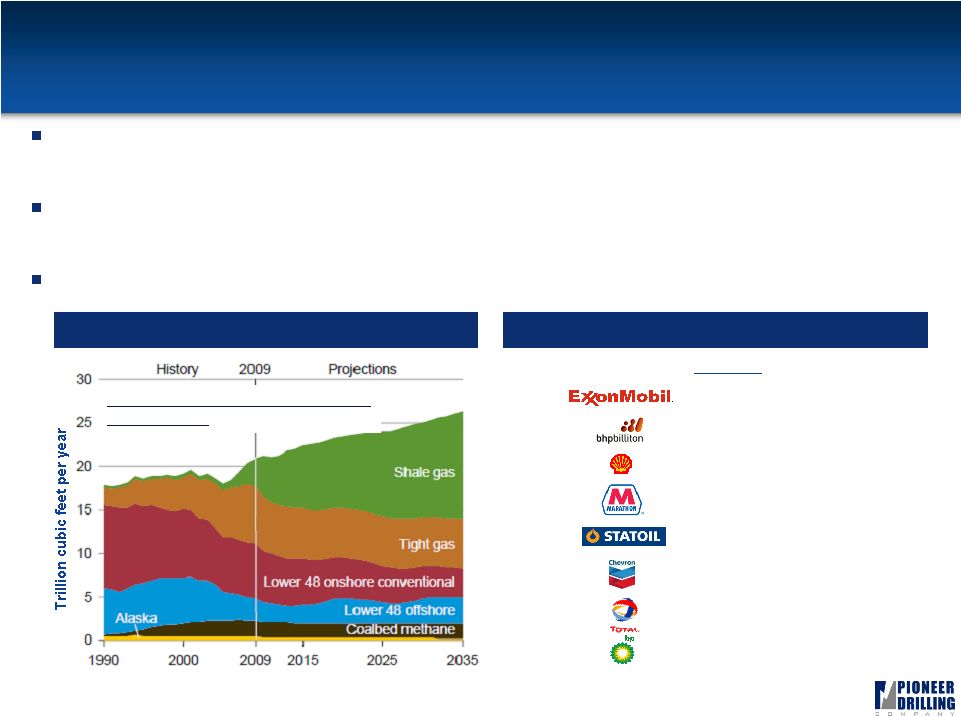 Benefits of Growing Shale Plays
1
19
Oilfield service companies stand to benefit from shale production due to its lower
risk
development
and
increased
service
intensity
(up
to
3
-
5x conventional)
Shale
gas
is
expected
to
make
up
47%
of
total
U.S.
production
in
2035 vs. its 16%
share in 2009
(1)
Reintroduction
of
the
Majors
in
the
U.S.
market
should
result
in
greater activity levels
Recent U.S. Shale Investments
Growing Importance of Shale
$Millions
$40,991
12/14/2009
$12,100
7/13/2011
$4,700
5/28/2010
$3,500
6/1/2011
$3,375
11/11/2008
$3,200
11/9/2010
$2,250
12/30/2009
$1,900
9/2/2008
U.S. NATURAL GAS PRODUCTION
1990 –
2035
(1)
(1) SOURCE: EIA “ANNUAL ENERGY OUTLOOK 2011” APRIL 2011 |
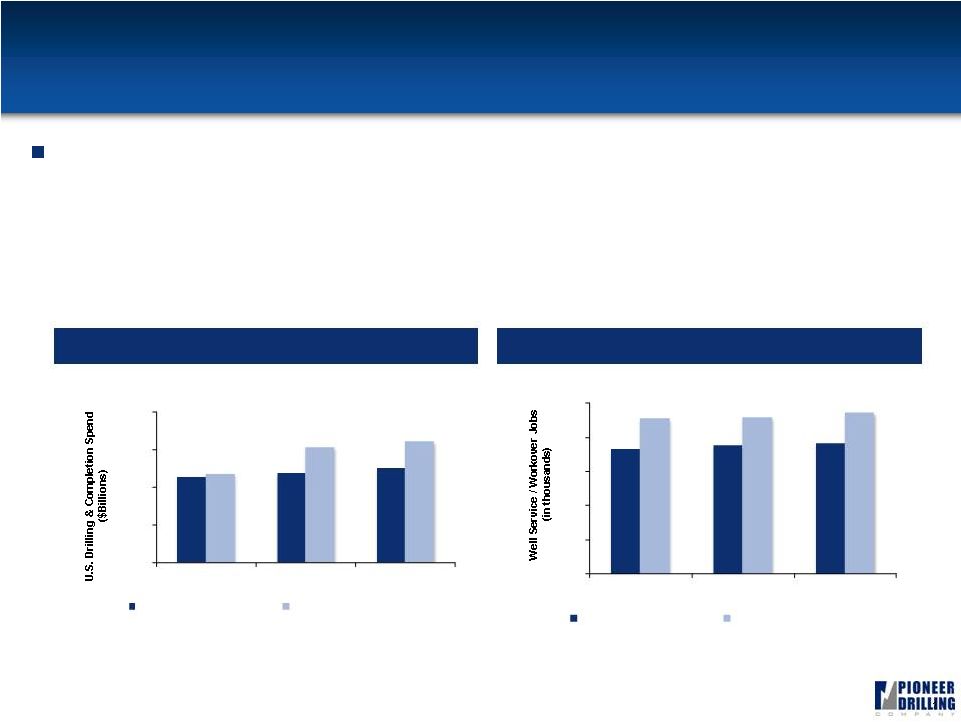 Conclusion: Improving Oil Service Outlook
1
20
North American capital spending and activity outlook is much
improved
Source: Spears & Associates
Source: Spears & Associates.
Upstream Spending Outlook
Well Service / Workover Jobs Outlook
$115
$120
$126
$119
$154
$162
$0
$50
$100
$150
$200
2010
2011
2012
Jun 2010 Estimate
Jun 2011 Estimate
73
76
77
91
92
95
0
20
40
60
80
100
2010
2011
2012
Jun 2010 Estimate
Jun 2011 Estimate |
 21
Financials |
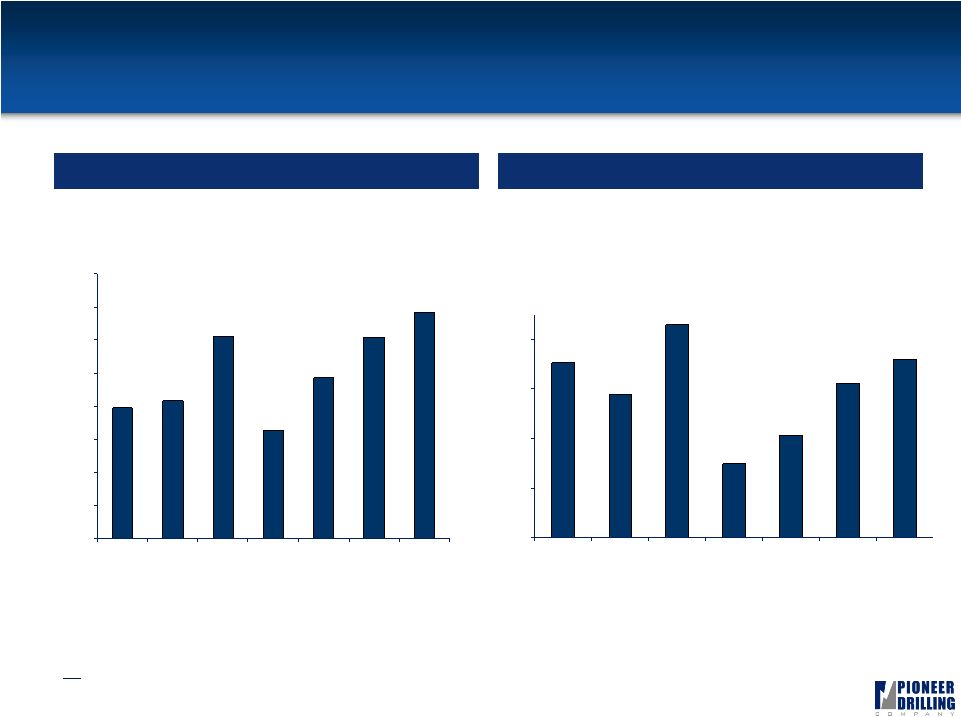 22
$177
$145
$215
$75
$103
$156
$180
$0
$50
$100
$150
$200
2006
2007
2008
2009
2010
Q2 2011
TTM
Q2 2011
Ann.
Strong Revenue and Adjusted EBITDA Growth
Revenue ($ millions)
Adjusted EBITDA ($ millions)
Note:
Fiscal year end was changed from March 31 to December 31 effective on December 31,
2007; all data points reflect calendar year and trailing twelve months information derived from 10K and 10Q filings.
$396
$417
$610
$326
$487
$609
$685
$0
$100
$200
$300
$400
$500
$600
$700
$800
2006
2007
2008
2009
2010
Q2 2011
TTM
Q2 2011
Ann. |
 Strong Liquidity and Capital Structure
23
Pro Forma Capitalization (As of June 30, 2011)
Pro Forma
($ in millions)
June 30, 2011
$94MM Net
Equity
Offering
Cash
$
11.5
$
63.8
Revolving Credit Facility ($250)
42.0
-
Sr. Unsecured Notes
240.6
240.6
Other
2.1
2.1
Total Debt
$
284.7
$
242.7
Stockholders' Equity
399.9
494.2
Total Capitalization
$
684.6
$
736.9
Liquidity
210.3
304.6
Debt / LTM EBITDA
1.90x
1.55x
Debt / Total Book Capitalization
41.6%
32.9%
(1) Excludes $9.2 million of LCs outstanding. Pro-Forma for amended and
restated $250 mm credit facility. (2) Defined as remaining credit
facility capacity plus cash less LCs outstanding. (3) Total consolidated
leverage ratio as reported in form 10Q for 2011. (1)
(2)
(3) |
 24
Appendix |
 25
Reconciliation
of
Adjusted
EBITDA
to
Net
Income
We define Adjusted EBITDA as earnings (loss) before interest income (expense),
taxes, depreciation, amortization, impairments, and the Colombian
Net
Equity
Tax.
Although
not
prescribed
under
GAAP,
we
believe
the
presentation
of
Adjusted
EBITDA
is
relevant
and
useful
because it helps our investors understand our operating performance and makes it
easier to compare our results with those of other companies that have
different financing, capital or tax structures. Adjusted EBITDA should not be considered in isolation from or as a
substitute
for
net
earnings
(loss)
as
an
indication
of
operating
performance
or
cash
flows
from
operating
activities
or
as
a
measure
of
liquidity. A reconciliation of net earnings (loss) to Adjusted EBITDA is included
in the table below. Adjusted EBITDA, as we calculate it, may not be
comparable to EBITDA measures reported by other companies. In addition, Adjusted EBITDA does not represent funds
available for discretionary use.
($ in millions)
Q3
2010
Q4
2010
Q1
2011
Q2
2011
TTM
Adjusted EBITDA
34.2
37.7
38.9
45.1
155.9
Colombian Net Equity Tax
-
-
(7.3)
-
(7.3)
Depreciation & Amortization
(30.8)
(31.5)
(32.3)
(32.4)
(127.0)
Net Interest
(7.6)
(7.8)
(7.5)
(8.0)
(30.9)
Impairment Expense
-
(3.3)
-
-
(3.3)
Income Tax (Expense) Benefit
1.6
(1.0)
2.1
(1.0)
1.7
Net Income (Loss)
(2.6)
(6.0)
(6.0)
3.7
(10.9)
($ in millions)
2006
2007
2008
2009
2010
Adjusted EBITDA
176.6
144.5
214.8
74.9
103.2
Colombian Net Equity Tax
-
-
-
-
-
Depreciation & Amortization
(47.6)
(63.6)
(88.1)
(106.2)
(120.8)
Net Interest
3.6
3.3
(11.8)
(8.9)
(26.6)
Impairment Expense
-
-
(171.5)
-
(3.3)
Income Tax (Expense) Benefit
(47.7)
(27.3)
(6.1)
17.0
14.3
Net Income (Loss)
84.8
56.9
(62.7)
(23.2)
(33.3)
Fiscal Year |
 26 |